the growth potential from financial inclusion govind
TRANSCRIPT

The Growth Potential from Financial Inclusion1
By
Govind Hariharan and Marcus Marktanner ICA Institute
and Kennesaw State University
Abstract
According to the World Bank, in 2011 only 50% of all adults (aged 15+) in the world had an account at a formal financial institution. The exclusion of large population shares from access to comprehensive banking services has been discovered as a major obstacle to development in recent years. In this paper we attempt to estimate within the framework of a simple Solow growth model the impact of financial inclusion on economic growth. Our preliminary results indicate that a 10 percent increase in financial inclusion has the potential to increase income per worker on average by 1.34 percent.
Contact Information:
Govind Hariharan Executive Director India China America (ICA) Institute Coles College of Business Kennesaw State University 1000 Chastain Road Kennesaw, GA 30144 Office: BB-476 Phone: +1(770)423-6580 Email: [email protected]
Marcus Marktanner Associate Professor of Economics Coles College of Business and INCM Kennesaw State University 1000 Chastain Road Kennesaw, GA 30144 Office: BB-458 Phone: +1(770)794-7750 Email: [email protected]
1 This is an extremely preliminary draft submitted for Atlanta Fed/GSU International Development Economics Workshop. All comments are welcome.

The Growth Potential from Financial Inclusion
1. Introduction
Financial inclusion, which is typically understood as access to formal financial services such
as credit, insurance and secure saving opportunities, has in recent years been identified as a
critical engine of economic growth. This paper has three main objectives. Firstly, we review and
test the significance of the literature’s explanations for the lack of financial inclusion. Secondly,
we estimate the growth potential associated with increasing financial inclusion using the
framework of a traditional Solow Growth model. Lastly, we propose policy recommendations for
increasing financial inclusion.
The paper is structured as follows. Section two assesses the problem of lack of financial
inclusion from a quantitative and qualitative global perspective: Where in the world is financial
inclusion lagging behind? What does the literature say about what causes it? In Section 3, we
will review the literature and present casual empiricism. In section four we describe the data and
methodologies to answer two questions: What variables explain the lack of financial inclusion?
How much growth could be triggered by increasing financial inclusion? We present the results of
our empirical analysis in section four and conclude with a summary of our findings and policy
recommendations in section five.
2. A Review of the Financial Inclusion Problem
Lack of financial inclusion, which is understood as access to formal financial services such
as credit, insurance and secure saving opportunities, has in recent years been identified as a
critical engine of economic growth [Reference].
Sarma (2010, p. 3f), referring to Kempson and Whiley (1999a, 1999b), distinguishes
between five factors that account for the lack of financial inclusion (exclusion): (1) Access
exclusion due to geography and “risk management of the financial system”, (2) Condition
exclusion “due to conditions that are inappropriate for some people,” (3) Price exclusion due to
non-affordability of financial services, (4) Marketing exclusion due to the non-attractiveness of
conducting business with certain groups within society (lending risk), and (5) Self-exclusion, due
to “fear of refusal or due to psychological barriers.”
These different factors arise from either supply or demand side channels, which we will
elaborate upon in more detail. For example, cultural and religious factors may undermine
demand for banking services. In addition, strong tribal structures may imply a preference for
clan-based lending and borrowing over modern banking, which many find too anonymous. Such
traditions can be difficult to overcome. Modern banking requires literacy skills that are often not
present. Potential customers need to invest time and effort in understanding banking
opportunities and costs. There may be also a collective action problem. Unless a critical mass of
people is willing to invest in banking literacy, everyone else will find that their individual efforts
in developing banking literacy will not pay off. Because banking activity is costly in terms of

fees and transaction costs, opening a bank account only becomes attractive if the individual has a
minimum income (Beck and Demirguc-Kunt, 2008, p. 386).
From an economic classification perspective, bank accounts are normal, if not luxury
goods. Dealing with banks also requires trust in markets and regulatory oversight, which are
often not in place, especially not in early stages of development or transitional periods.
Demirguc-Kunt and Klapper (2012, p. 19) report seven self-reported reasons for lack of financial
inclusion, which rank lack of trust sixth. In descending order of importance the other reasons
were: (1) Not enough money, (2) Too expensive, (3) Family member already has account, (4)
Too far away, (5) Lack of necessary documentation, (7) Religious Reasons. Last but not least, a
strong informal sector in certain areas may also reduce demand for formal banking services
(Sarma and Pais, 2011). Chibba (2009) also reports from a case study of Botswana a certain
deterring “fear of complications” attitude, which is likely to be observable in other places as
well.
As far as the supply side is concerned, the absence of clearly specified land and property
titles is a major obstacle for banks to offer the full range of financial services. In regions that
practice partible inheritance law, for example, land titles can often not be transferred easily
because they are inefficiently small or are shared by too many stakeholders. Similarly, if a region
has a small economic base, banking activities will not be offered due to the lack of economies of
scale on the side of the banks. Operational costs may be a consideration when banks need to
decide whether or not to serve remote or sparsely populated areas (Claessens and Perotti, 2007;
Andrianaivo and Kpodar, 2011). Setting up a bank is often associated with high sunk and fixed
costs, which can serve as a market entry barrier and lend first movers monopolistic market power
that prevents financial inclusion of certain strata of the society. Financial market regulation and

oversight are therefore important to correct market power. Chibba (2009, p. 224) explicitly
reports market power as a source of lack of financial inclusion in the case of Botswana, which is,
however, a problem that can be observed in other countries as well. He moreover laments “poor
governance in areas such as monetary policy, land ownership, public sector agency government,
government procurement, and the legal and regulatory framework.”
For example, in many developing countries, cell phone providers have successfully
entered the market for the safe transfer of funds. Cell phone users use their phones to transfer
money to other family members or to pay bills to businesses. Cell phone companies have
therefore excellent access to data that can be used to build a credit profile of cell phone users.
This credit profile could serve as a substitute for the absence of collateral and reduce high
transaction costs of gathering information about borrowers (Claessens and Perotti, 2007, p.757).
It seems accordingly plausible to assume that a market would evolve in which cell phone
companies either use these credit profiles as an input factor for banks willing to expand their
credit business, or even enter the market for credit themselves. To which extent this will occur,
however, depends substantially on the regulatory quality of the country (Thulani, D., et.al, 2011,
p. 13)
Lack of financial inclusion is costly to society and the individual. As far as the individual
is concerned, lack of financial inclusion forces the unbanked into informal banking sectors where
interest rates are higher and the amount of available funds much smaller. Because the informal
banking structure is outside any legislative framework, any dispute between lenders and
borrowers cannot be settled legally. Borrowers are at much greater risk of usury and exploitation.
Poverty and informal banking sectors often constitute a vicious cycle that borrowers cannot
escape. This is particularly true in rural areas where tenancy farmers are pushed into borrowing
funds for fertilizer, machinery and seeds at the beginning of the growing season that the farmers
then cannot repay after the harvest is being sold. This middlemen problem is discussed, for
example, in Global Partnership for Fiancial inclusion (GPFI) and International Finance
Corporation (IFC), 2011).
As far as the social benefits are concerned, financial inclusion increases the amount of
available savings, increases efficiency of financial intermediation, and allows for tapping new
business opportunities. Historically, a main reason for why many European countries introduced
universal banks under the auspices of the state was the fear that market based competitive
banking would not free the social benefit from comprehensive financial inclusion and instead
cause social costs from rural-urban migration. State sponsored universal banking has therefore
contributed to greater economic diversification in rural areas than is the case in more competitive
banking environments (World Bank, 2012, p. 11). The basic idea of the social cost associated
with lack of financial inclusion can be simply illustrated as in Figure 1.
Where in the world is lack of financial inclusion the biggest problem? Figure 2 shows on the
y-axis the variable “Account at a formal financial institution (% age 15+)” for the year 2011
from the World Bank’s Global Financial Inclusion Database, and on the x-axis the natural log of
GDP per person in the labor force age in $2000 from the World Bank Development Indicator
Database.
Figure 3 maps observations that are in Figure 2 above the trend line as relative financial
inclusion surplus countries, and observations below it as relative financial inclusion deficit
countries. The map shows strong differences among Latin America and Asia. Latin America is a
relative financial inclusion deficit region, while Asia – especially Central and East Asia, but not

West Asia and South Asia – is a relative financial inclusion surplus region. The difference
between the United States and Europe is also worth noting as Europe is largely a financial
inclusion surplus region, while the US has a deficit. The Arab world is also largely a relative
financial inclusion region. Africa south of the Sahara shows no uniform trend.
Figure 1
Social Cost from Lack of financial inclusion
Private Marginal Benefit
F inancial Inclusion
Private plus Social Marginal Benefit
Mar
ket
Equ
ilibr
ium
Soc
ial
Opt
imum
Marginal Banking Cost
Social Cost f romFinancial Inclusion
Priv
ate
plus
Soc
ial M
argi
nal B
enef
itP
rivat
e M
argi
nal B
enef
it

Figure 2
Income per Person in the Labor Force ($2000) vs. Account at a Formal Institution (% age 15+)
Figure 3
Relative Financial Inclusion Deficit and Surplus Countries
Legend: Red = Deficit, Blue = Surplus
0
10
20
30
40
50
60
70
80
90
100
6 7 8 9 10 11
acct
lny
Actual and fitted acct versus lny
ALB
DZA
AGO
ARG
ARM
AUSAUT
AZE
BHR
BGD
BLR
BEL
BEN
BOL
BIH
BWA
BRABGR
BFA
BDIKHM
CMR
CAN
CAF
TCD
CHL
CHN
COL
COM
ZAR
COG
CRI
HRVCYP
CZE
DNK
DJI
DOMECU
EGYSLV
ESTFINFRA
GAB
GEO
DEU
GHA
GRC
GTM
GIN
HTI HND
HKG
HUN
IND
IDN
IRN
IRQ
IRLISR
ITAJAM
JPN
JOR
KAZKEN
KOR
KWT
KGZ
LAO
LVA
LBN
LSOLBR
LTU
LUX
MKD
MDG
MWI
MYS
MLI
MLT
MRT
MUS
MEX
MDA
MNG
MARMOZ
NPL
NLDNZL
NIC
NER
NGA
OMN
PAK
PANPRY PER
PHL
POL
PRT
QAT
ROMRUS
RWA
SAU
SEN
SRB
SLE
SGP
SVK
SVN
ZAF
ESP
LKA
SDN
SWZ
SWE
SYR
TJK
TZA
THA
TGO
TTO
TUN
TUR
TKM
UGA
UKR
ARE
GBR
USA
URYUZB
VEN
VNMWBG
YEM
ZMB
ZWE
actualfitted
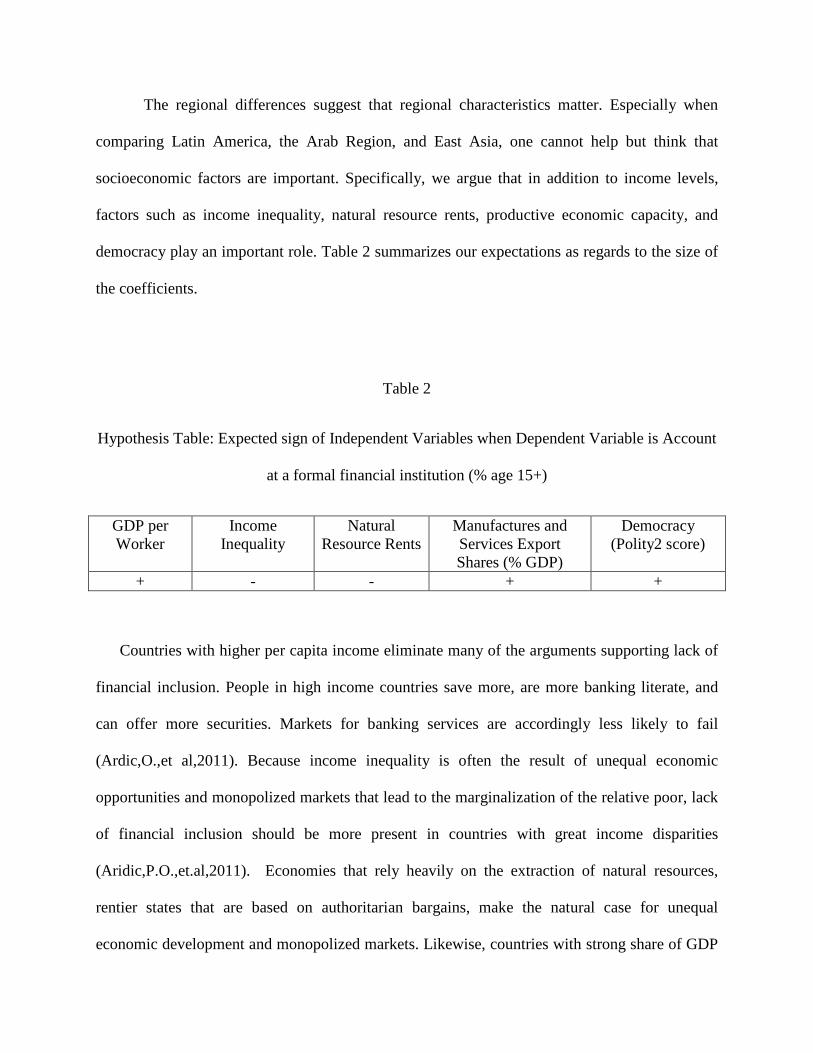
The regional differences suggest that regional characteristics matter. Especially when
comparing Latin America, the Arab Region, and East Asia, one cannot help but think that
socioeconomic factors are important. Specifically, we argue that in addition to income levels,
factors such as income inequality, natural resource rents, productive economic capacity, and
democracy play an important role. Table 2 summarizes our expectations as regards to the size of
the coefficients.
Table 2
Hypothesis Table: Expected sign of Independent Variables when Dependent Variable is Account
at a formal financial institution (% age 15+)
GDP per Worker
Income Inequality
Natural Resource Rents
Manufactures and Services Export Shares (% GDP)
Democracy (Polity2 score)
+ - - + +
Countries with higher per capita income eliminate many of the arguments supporting lack of
financial inclusion. People in high income countries save more, are more banking literate, and
can offer more securities. Markets for banking services are accordingly less likely to fail
(Ardic,O.,et al,2011). Because income inequality is often the result of unequal economic
opportunities and monopolized markets that lead to the marginalization of the relative poor, lack
of financial inclusion should be more present in countries with great income disparities
(Aridic,P.O.,et.al,2011). Economies that rely heavily on the extraction of natural resources,
rentier states that are based on authoritarian bargains, make the natural case for unequal
economic development and monopolized markets. Likewise, countries with strong share of GDP

with productive and competitive manufactures and services exports provide more decentralized
economic opportunities for wage earners that are attractive to serve by financial service
industries. We therefore hypothesize that countries with a high share of natural resources rents
have on average more lack of financial inclusion, more productive economies more financial
inclusion. Lastly, as democracy is a vehicle to correct many of the determinants of financial
inclusion through redistribution, we hypothesize that democracies favor financial inclusion
through established institutions (Claessens and Perotti, 2007, p.761; Deininger and Squire,
1998s, p.272).
How does an increase of financial inclusion affect economic growth? Using a typical
production function in which output depends on capital and total factor productivity, there is
good reason to assume that an increase of financial inclusion could affect both capital
accumulation and total factor productivity. As financial inclusion increases the amount of funds
being made available and reduces borrowing costs, capital should increase (Claessens and
Perotti, 2007, p.758). In addition, building a banking service infrastructure is capital, too.
Moreover, the expansion of financial inclusion (FI) is likely to facilitate the matching process
between savers and investors, which increases total factor productivity (Claessens,S.,2006 ). We
therefore hypothesize that
Output=F[Total factor Productivity (FI), Capital(FI)] (1)

3. Data and Methodology
Determinants of Financial Inclusion
In line with the above hypothesis table 2, we use the following data sources and variables to
test the determinants of financial inclusion.
Table 3
Data Description and Sources
Variable Abbreviation Source Account at a formal financial institution (% age 15+) acct The Global Financial Inclusion
(Global Findex) Database.
GDP per worker y
Calculated as the ratio of GDP (constant 2000 US$), Y, and total Labor Force, L, available at 2011 World Bank Development Indicator Database (2011 WDI).
Income Inequality gini
United Nations University, World Institute for Development Economics Research (UNU-WIDER), World Income Inequality Database V2.0c May 2008.
Total Natural Resource Rents (% GDP), sum of oil rents, natural gas rents, coal rents (hard and soft), mineral rents, and forest rents.
nrr 2011 WDI
Manufactures and Services Trade Share (% GDP), exports and imports of manufactures and services of GDP.
msts Calculated from 2011 WDI data.
Polity2 score (measures democratic practice on a scale from -10 to +10 with higher values indicating greater institutionalization of democratic procedures).
polity
Marshall, M., Jaggers, K., and Gurr, T. (online), Polity IV Project, Political Regime Characteristics and Transitions, 1800-2010.
The dependent variable “acct” is the observation for the year 2011. At the time of writing this
paper, the Global Findex Database has only observation for the year 2011. All other variables are
1995-2010 averages of available data. An average from a long period was chosen to maximize

the number of observations (for example, data on income inequality is rather scarce). Although
averages were taken, the variables under consideration are also rather sticky over time. We
therefore believe that the benefit from increasing the number of observations outweighs any
possible information distortion from aggregation.
We test the significance of the independent variables using a logistic regression because the
dependent variable “acct” is bounded between zero and 100.
Estimation of Growth Potential Associated with Financial Inclusion
We first estimate for a country the simple Solow growth equation
y Akα= (2)
where
y= income per worker
A=Total factor productivity
k=capital per worker
α=production elasticity of capital per labor
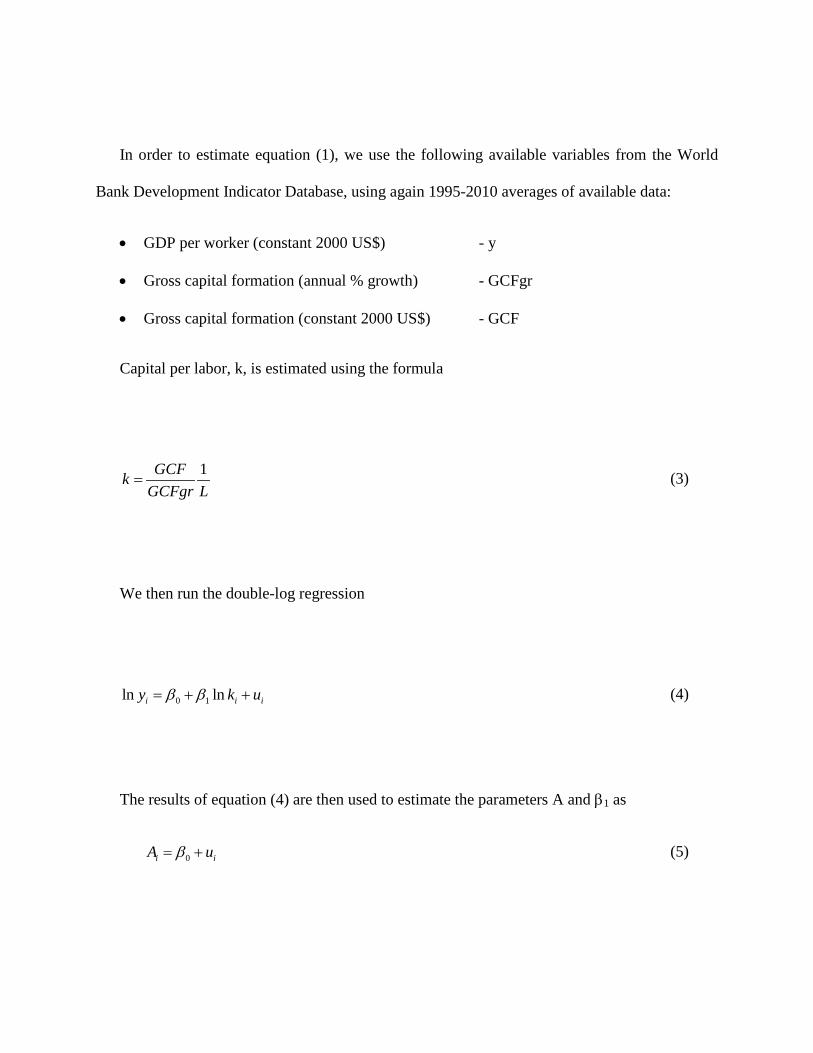
In order to estimate equation (1), we use the following available variables from the World
Bank Development Indicator Database, using again 1995-2010 averages of available data:
• GDP per worker (constant 2000 US$) - y
• Gross capital formation (annual % growth) - GCFgr
• Gross capital formation (constant 2000 US$) - GCF
Capital per labor, k, is estimated using the formula
1GCFkGCFgr L
= (3)
We then run the double-log regression
0 1ln lni i iy k uβ β= + + (4)
The results of equation (4) are then used to estimate the parameters A and β1 as
0i iA uβ= + (5)

1α β= (6)
Endowed with estimates for k and A, we then test, using regular OLS estimates, the
following two equations:
0 1ln lnki i j i i
jA Acct Controls uβ β β= + + +∑ (7)
0 1ln lnki i j i i
jk Acct Controls uγ γ γ= + + +∑ (8)
The coefficients “beta 1” and “gamma 1” are then the estimated financial inclusion
elasticities of total factor productivity and capital per worker, respectively. The financial
inclusion elasticities of total factor productivity and capital per worker can then be used for
policy simulation purposes. Control variables are income inequality, natural resource rents,
manufactures and services trade shares, and polity. (It is not controlled for per capita income,
because, by assumption, income per worker depends on capital per worker and total factor
productivity, not the other way around.)
4. Empirical Results

Normality Tests
In a first step, we checked the normality of the various variables. The results are
summarized in Table 4. All variables except for gini and msexpshr (ln) are non-normally
distributed. While some of the non-normally distributed variables became “more normal” after a
natural log transformation, normality must not be taken for granted. Statistical significance tests
of the regression coefficients must therefore be handled with the usual care.
Table 4
Normality Tests (H0: Data is normal)
Original Variable
c2 Test against
Normality (p-value)
c2 Test against Normality of ln-
transformed data (p-value)
Did ln-transformation
help?
Variable used in regression
acct <0.01 <0.01 no acct y <0.01 <0.01 yes lny gini 0.09 0.07 no Gini msexpshr <0.01 0.24 yes lnmsexpshr nrr <0.01 <0.01 yes Lnnrr polity2 <0.01 <0.01 no Polity2

Multicollinearity
In order to get an idea of the “independence of the independent variable,” Table 5 shows that
multicollinearity in subsequent regression must not be ruled out. Especially combinations on the
right hand side of “lnmsexpshr and lnnrr (r=-0.61), “lny and lnmsexpshr (r=0.57),” “polity2 and
lnnrr (r=-0.46),” “gini and lnmsexpshr (r=-0.41),” and “lny and lnnrr (-0.40)” need to be
carefully watched.
Table 5:
Pearson Correlation Matrix
acct lny gini polity2 lnnrr lnmsexpshr
acct 1.00 0.80 -0.47 0.35 -0.51 0.62 lny 0.80 1.00 -0.37 0.24 -0.40 0.57 gini -0.47 -0.37 1.00 -0.14 0.21 -0.41 polity2 0.35 0.24 -0.14 1.00 -0.46 0.29 lnnrr -0.51 -0.40 0.21 -0.46 1.00 -0.61 lnmsexpshr 0.62 0.57 -0.41 0.29 -0.61 1.00
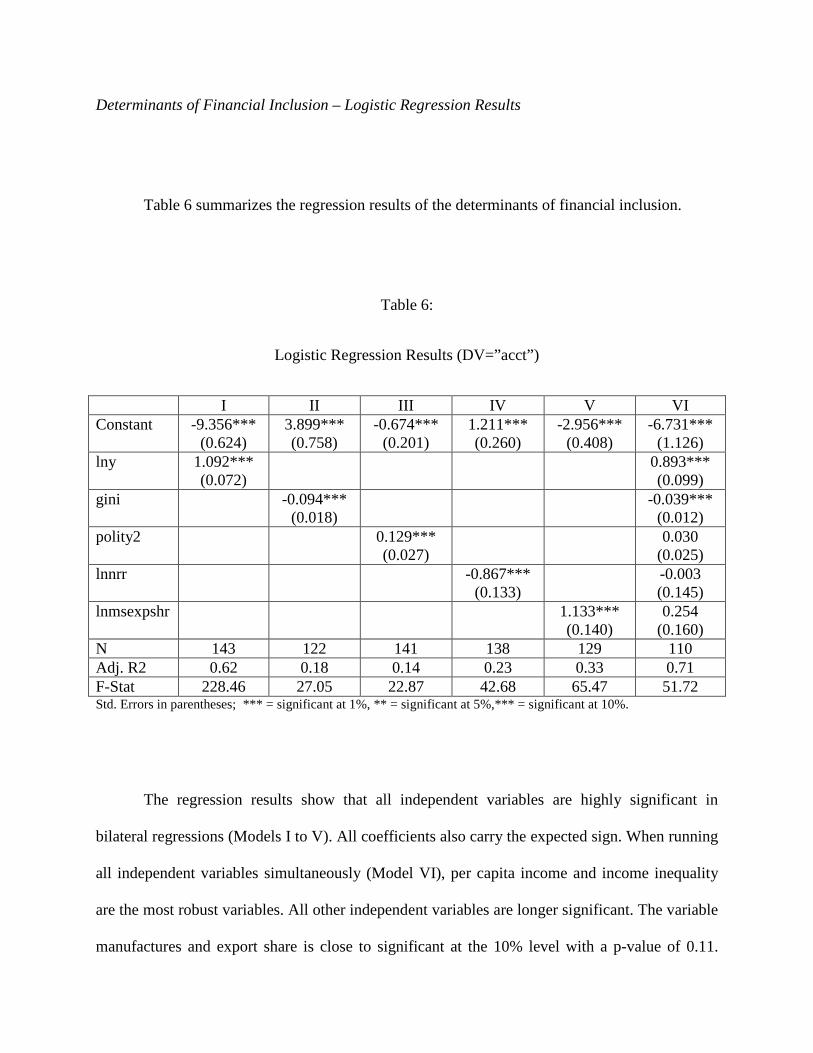
Determinants of Financial Inclusion – Logistic Regression Results
Table 6 summarizes the regression results of the determinants of financial inclusion.
Table 6:
Logistic Regression Results (DV=”acct”)
I II III IV V VI Constant -9.356***
(0.624) 3.899*** (0.758)
-0.674*** (0.201)
1.211*** (0.260)
-2.956*** (0.408)
-6.731*** (1.126)
lny 1.092*** (0.072)
0.893*** (0.099)
gini -0.094*** (0.018)
-0.039*** (0.012)
polity2 0.129*** (0.027)
0.030 (0.025)
lnnrr -0.867*** (0.133)
-0.003 (0.145)
lnmsexpshr 1.133*** (0.140)
0.254 (0.160)
N 143 122 141 138 129 110 Adj. R2 0.62 0.18 0.14 0.23 0.33 0.71 F-Stat 228.46 27.05 22.87 42.68 65.47 51.72 Std. Errors in parentheses; *** = significant at 1%, ** = significant at 5%,*** = significant at 10%.
The regression results show that all independent variables are highly significant in
bilateral regressions (Models I to V). All coefficients also carry the expected sign. When running
all independent variables simultaneously (Model VI), per capita income and income inequality
are the most robust variables. All other independent variables are longer significant. The variable
manufactures and export share is close to significant at the 10% level with a p-value of 0.11.

Despite the loss of significance, all variables kept the expected signs. We attribute the loss of
significance to multicollinearity problems and not the loss of socioeconomic significance. The
transmission mechanism from various socioeconomic variables is surely highly complex and
involves direct and indirect effects.
Estimation of the Solow Growth Equation
Figure 4 shows the scatter plot of “lny on lnk” and the regression results of Equation (4).
Figure 4
Estimating the A and alpha of the Solow Growth Equation
Scatter Plot “lny on lnk” DV=lny Coefficient
constant 1.979*** (-0.219)
lnk 0.668*** (-0.022)
N 143
R2 0.81
F 953.3

The regression results suggest that the production elasticity of capital per labor is α=0.668 and
the average total factor productivity A=7.235 (exp1.979). We therefore assume for each country
the production function
( ) 0.668
exp 1.97893i i iy u k= + (9)
Does Financial Inclusion Determine TFP and Capital Accumulation? – OLS Regression Results
Table 7 reports the regression results of total factor productivity and capital per worker
on financial inclusion and other control variables. The results indicate that financial inclusion is
highly significant and robust explanatory variable for both “Total Factor Productivity” and
higher capital per capita levels. Specifically, the results suggests that a 1 percentage point
increase in the variable “acct,” after controlling for other socioeconomic factors, increases total
factor productivity and capital per labor by 0.6% and 4%, respectively.

Table 7
OLS Regression Results (DV=lnA and lnk)
DV=lnA (Total Factor Productivity) DV=lnk (Capital per capita)
const 1.944*** (0.072)
1.621*** (0.324)
7.462*** (0.227)
6.313*** (1.075)
acct 0.003*** (0.001)
0.006*** (0.002)
0.051*** (0.004)
0.041*** (0.006)
Gini
0.004 (0.005)
0.021 (0.017)
polity2
0.004 (0.009)
0.039 (0.031)
lnnrr
0.039 (0.055)
0.132 (0.183)
lnmsexpshr
0.041 (0.059)
0.289 (0.197)
N 125 100 125 100 Adj. R2 0.047 0.083 0.566 0.590 F-Stat 7.07 2.80 162.66 29.56
Economic Significance
A final question is: What is the economic significance of our finding? In order to answer
this question, we use the semi-elasticities calculated in Table 7 after controlling for
socioeconomic factors and calculate the per capita incomes assuming that the country manages a
full transition towards a 100 percent financial inclusion. Our findings suggest that the growth
dividend of complete financial inclusion can reach up to 362% (as is the case of Niger in our
simple simulation example).
For illustration purposes, we also correlate the potential growth dividend from financial
inclusion with the socioeconomic control variables, which shows that the growth dividend from

financial inclusion is greater, when income is low, inequality high, the productive economic
sector weak, and levels of democracy low. This is shown in Figure 5.
Figure 5
Growth Potential from Financial Inclusion vs. Socioeconomic Factors
Growth Potential vs. Per Worker Income Growth Potential vs. Gini
Growth Potential vs. Natural Resource Rents Growth Potential vs. Natural Resources Rents
Growth Potential vs. Polity2

Lastly, Figure 6 provides a global view of the distribution of growth potentials according
to terciles. According to Figure 6, the highest growth potentials of financial inclusion are in
Central America, Sub-Saharan Africa, the Middle East and North Africa, and South East Asia.
Figure 6
Global Distribution of Growth Potentials from Financial Inclusion
Legend: Grey=no observation, yellow=low growth potential, orange=medium growth potential, red=high growth
potential (according to terciles).

5. Conclusions
Lack of financial inclusion is a complex socioeconomic phenomenon that includes factors as
diverse as geography, culture, religion, history, socioeconomic inequality, structure of the
economy, and economic policy. While this paper is still explorative in nature, one cannot think
but while lack of financial inclusion is the result of many socioeconomic problems, financial
inclusion is also a substantial part of these problems’ solution.
This paper finds that financial inclusion is still a huge untapped source of economic
growth and development. Specifically, financial inclusion is a robust and significant correlate of
a country’s total factor productivity and ability to form capital.
An important question therefore is: What stands in the way of greater financial inclusion?
Of course, while exact answers can only be given through country specific case studies, a
universal factor may be ignorance of economic policy. Many developing countries have a long
tradition of state interventionism and capital controls. With structural adjustment programs being
introduced in the 1980s and 1990s, financial market reforms swept over many developing
countries. These markets, however, have largely failed to reach large segments of the society.
More government may be needed again to correct the conditions on the ground that account for
the failing of financial markets. Depending on the country, such policies may include financial
regulation, land reforms, educational programs, and competition policy.
