the harmonic trader report monthly in this report: dow ...i am excited to announce that we will be...
TRANSCRIPT
The Harmonic Trader Report Monthly – December 2017 COPYRIGHT HARMONICTRADER.COM, L.L.C. 2017
____________________________________________________________________________
1
The Harmonic Trader Report Monthly
December 2017
December 31, 2017
In this report:
NASDAQ 100 Index (NQ) Dow Jones Industrial Average Index (YM) German DAX Futures March 2018 (FDAX) Crude Oil December 2018 (CL)
Quality over Quantity
As we close out the year, there are a number of markets that have experienced historically bullish price action, representing more of what's to come in to the New Year. The leaders in the equity markets, especially Technology, will continue to accelerate into the New Year. In fact, we will likely see strong follow through in early 2018 as a consequence of the current momentum in today's market.
Although there will be easy opportunities to buy and hold as prices continue to go higher, these markets still require some degree of measured levels to define the overall character and outline what is “naturally” possible. Simply stated, many equity markets have booked remarkable gains over the past 12 months, and it is obvious that this strength will carry through into the next year. In fact, the current momentum of the bullish trend will accelerate into 2018, but it is still critical to wait for simple retracements and short-term corrections to optimize entries. Furthermore, these current trends must exhibit a consistent bullish character as they reach for higher targets.
Regardless of the current fervor, all harmonic opportunities are still defined by ACTIONABLE MEASURES that trigger entries at precise levels. Although certain markets may lack complex structures, other harmonic measures such as Harmonic Strength Index and Pi/Phi Bands have been effective in trending markets and provide clearest confirmation with harmonic patterns. However, those situations that possess the clearest structures with overwhelming harmonic measures should continue to be favored.

The Harmonic Trader Report Monthly – December 2017 COPYRIGHT HARMONICTRADER.COM, L.L.C. 2017
____________________________________________________________________________
2
NASDAQ 100 Index (NQ 03-18): Weekly 3.14/3.618 Harmonic Ratio Extensions with Pi/Phi Bands In last month’s report, I outlined “…some long-term objectives and even have been calling for the NASDAQ 100 to reach as high as 6800 by early January. However, the current strength requires that we assess the long-term measures… that define the 8600-8800 area.” The larger possibility will take more than a year to be realized but the eventual test of the 6800 level will provide a great deal of insight how quickly this will be realized.
The Harmonic Trader Report Monthly – December 2017 COPYRIGHT HARMONICTRADER.COM, L.L.C. 2017
____________________________________________________________________________
3
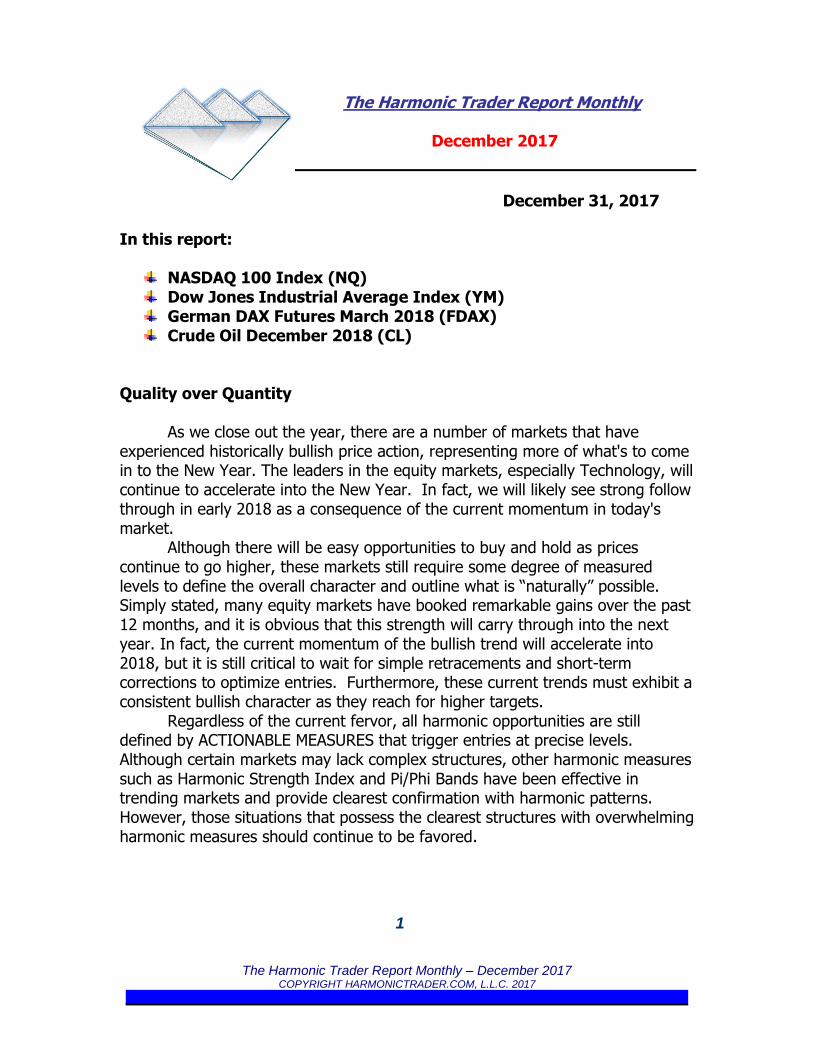
NASDAQ 100 Index (NQ 03-18): Daily Harmonic Strength Index with Pi/Phi Bands
The following chart shows the bullish trend in the NASDAQ 100. We will look at the next set of upside objectives that that will take the immediate rally to 6800 - as high as 7000 - before the end of January. We identified the 6400 level as an important upside objective as recently as September. Now well-above that level, we must consider that the market is in an area where much larger price objectives can be realized. If a 20% gain for 2017 was possible, it is not unreasonable to think that another 15-20% follow-through can be achieved.
In these type of trending environments, we rely on swing measurements such as daily retracements and important extensions. The daily action is testing a short-term Oversold HSI area that requires a few days before triggering a reversal but the internal action is beginning to stabilize. The current pause in the uptrend is almost over and the 6380-6400 is immediate support.
The Harmonic Trader Report Monthly – December 2017 COPYRIGHT HARMONICTRADER.COM, L.L.C. 2017
____________________________________________________________________________
4
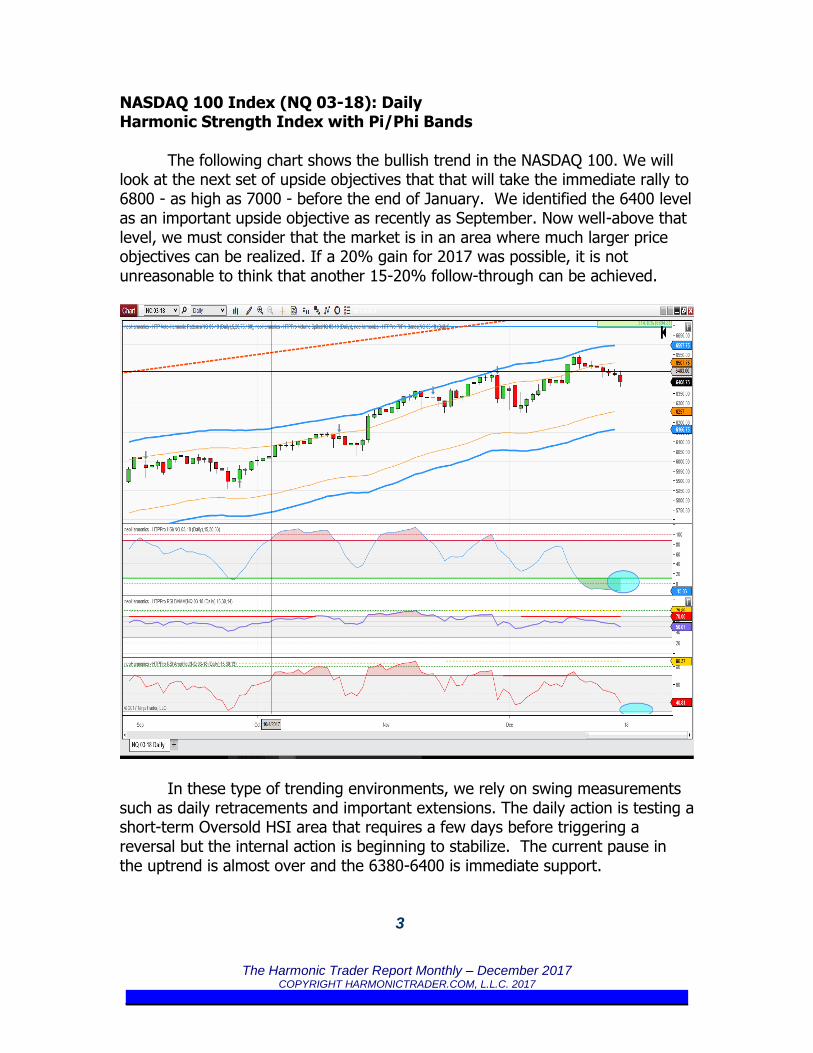
Dow Jones Industrial Average Index (YM 03-18): Daily 2016-Present Pi/Phi Bands
The Dow Industrials fell just shy of 25,000 in 2017 but this will likely be exceeded in January. We outlined a few price objectives earlier in the year that indicated 25,000 was an important milestone. However, it is more psychological than relevant to any important natural cyclical point. Much like the NASDAQ, the Dow index will likely follow through this year's strong gains with another positive performance. The daily price action is pausing at the 24,800 level with trailing Pi/Phi support at 23,800.

The Harmonic Trader Report Monthly – December 2017 COPYRIGHT HARMONICTRADER.COM, L.L.C. 2017
____________________________________________________________________________
5
Dow Jones Industrial Average Index (YM 03-18): Weekly Harmonic Indicators
The YM is in a multi-year bullish acceleration that cannot be denied. Within that context, we must consider that double-digit year-over-year positive gains are likely. I do believe that the action in early January will be tremendously important in defining how strong this year will be. I will address this scenario later in the year but I do believe that a larger continuation of this bull market possesses much higher targets no matter what. For now, the trend still up and we are looking for an aggressive breakout above 25,000. Although the recent Harmonic Strength Index triggered an Oversold reading, this will merely be a pause before resuming the bullish trend. Stay long until further notice, while monitoring the area beyond 24,800.
The Harmonic Trader Report Monthly – December 2017 COPYRIGHT HARMONICTRADER.COM, L.L.C. 2017
____________________________________________________________________________
6
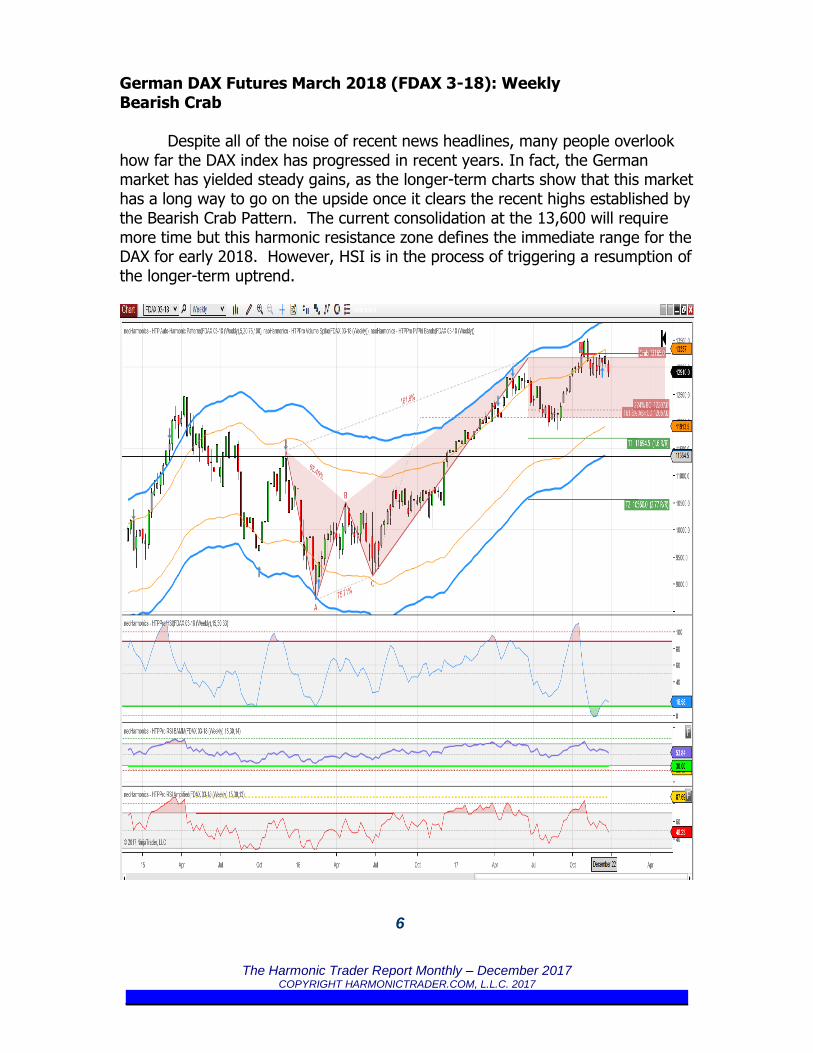
German DAX Futures March 2018 (FDAX 3-18): Weekly Bearish Crab
Despite all of the noise of recent news headlines, many people overlook how far the DAX index has progressed in recent years. In fact, the German market has yielded steady gains, as the longer-term charts show that this market has a long way to go on the upside once it clears the recent highs established by the Bearish Crab Pattern. The current consolidation at the 13,600 will require more time but this harmonic resistance zone defines the immediate range for the DAX for early 2018. However, HSI is in the process of triggering a resumption of the longer-term uptrend.
The Harmonic Trader Report Monthly – December 2017 COPYRIGHT HARMONICTRADER.COM, L.L.C. 2017
____________________________________________________________________________
7
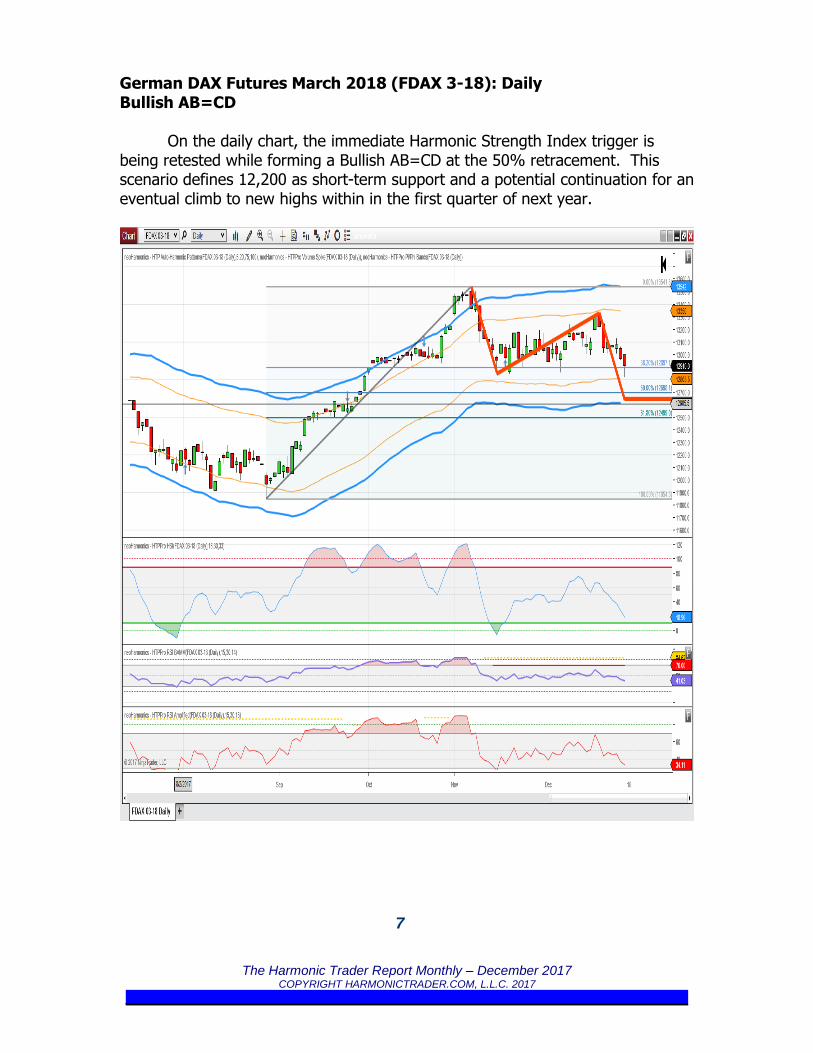
German DAX Futures March 2018 (FDAX 3-18): Daily Bullish AB=CD
On the daily chart, the immediate Harmonic Strength Index trigger is being retested while forming a Bullish AB=CD at the 50% retracement. This scenario defines 12,200 as short-term support and a potential continuation for an eventual climb to new highs within in the first quarter of next year.
The Harmonic Trader Report Monthly – December 2017 COPYRIGHT HARMONICTRADER.COM, L.L.C. 2017
____________________________________________________________________________
8
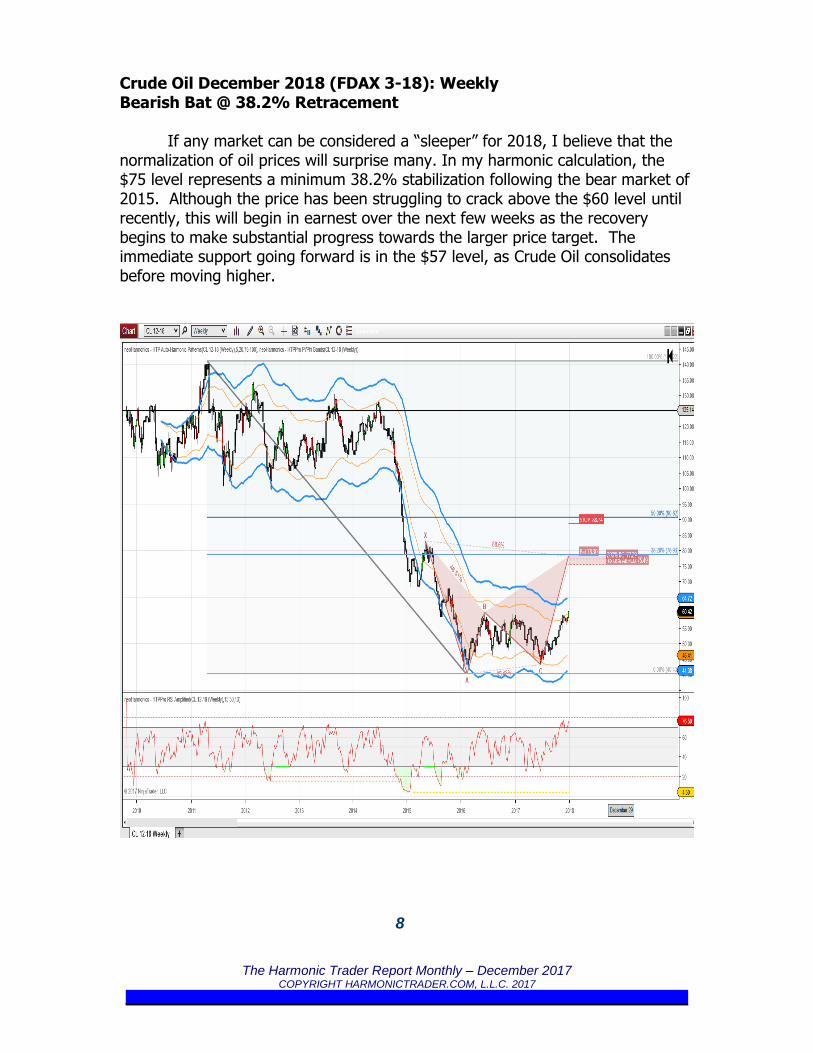
Crude Oil December 2018 (FDAX 3-18): Weekly Bearish Bat @ 38.2% Retracement
If any market can be considered a “sleeper” for 2018, I believe that the normalization of oil prices will surprise many. In my harmonic calculation, the $75 level represents a minimum 38.2% stabilization following the bear market of 2015. Although the price has been struggling to crack above the $60 level until recently, this will begin in earnest over the next few weeks as the recovery begins to make substantial progress towards the larger price target. The immediate support going forward is in the $57 level, as Crude Oil consolidates before moving higher.
The Harmonic Trader Report Monthly – December 2017 COPYRIGHT HARMONICTRADER.COM, L.L.C. 2017
____________________________________________________________________________
9
December Conclusion
We have seen a number of markets experience tremendous moves over
the past two years. Crude oil, the breakout in equities and considerable currency fluctuations have presented substantial opportunities, providing clear price objectives along the way. These longer-term situations have required more patience but the harmonic framework of measurements have consistently defined the critical turning points with precise accuracy. From a larger perspective, these harmonic price objectives have provided a clear indication of trend. For example, Crude Oil has been range bound for the past few months but the larger weekly levels have continued to indicate that the bullish trend remains intact until reaching these objectives. This is one of many market examples where longer-term timeframes continue to define ideal targets precisely.
I am excited to announce that we will be expanding the Harmonic Trader community online at the website throughout 2018. In addition, there will be a few other announcements that will immensely expand the offerings at Harmonic Trader to create the greatest the resource of harmonic pattern information available anywhere. Please feel free to reach out to me if you have questions of how to learn more about the new HarmonicTrader.com resources or want to take advantage of the amazing technology we have with the Harmonic Trader Platform. www.neoHarmonics.com/purchase/ Contact me directly if you have any questions about the Gold Membership or would like feedback with your trading at [email protected]. I welcome your comments, questions and suggestions. If you are a trial member or wish to receive future reports, please sign up here: http://harmonictrader.com
Best Regards, Scott Carney HarmonicTrader.com

The Harmonic Trader Report Monthly – December 2017 COPYRIGHT HARMONICTRADER.COM, L.L.C. 2017
____________________________________________________________________________
10
COPYRIGHT HARMONICTRADER.COM, L.L.C. 2017 The Harmonic Trader Report Monthly By Scott M. Carney Library of Congress Cataloging-in-Publication Data This publication is designed to provide accurate and authoritative information in regard to the subject matter covered. It is sold with the understanding that the publisher is not engaged in rendering legal, accounting, or other professional service. If legal advice or other expert assistance is required, the services of a competent professional person should be sought. From a Declaration of Principles Jointly Adopted by a Committee of the American Bar Association and a Committee of Publishers and Associations. COPYRIGHT HARMONICTRADER.COM, L.L.C. 2017 This material is protected under all copyright laws. This material may not be reprinted or reused in any manner without written consent of Scott M. Carney. All rights reserved! Printed in the United States of America