the head loss ratio in water distribution: case study … · the fraction of head loss due to...
TRANSCRIPT
Journal of Advanced & Applied Sciences (JAAS), 2 (3): 105-116, 2014 ISSN: 2289-6260
© 2014 Academic Research Online Publisher.
Research Paper
105 | P a g e
The Head Loss Ratio in Water Distribution: Case Study of a 96- Unit
Residential Estate
John I. Sodik , Emmanuel M. Adigio
b
aDepartment of Mechanical Engineering, Rivers State University of Science and Technology, Port Harcourt, Nigeria
bDepartment of Mechanical Engineering, Niger Delta University, Wilberforce Island, Amassoma, Nigeria
*Corresponding author. Tel: +2348033101488
E-mail address: [email protected]
A b s t r a c t
Keywords:
Loss through pipe fittings,
Design flow rate,
Residential estate.
The paper presents a case study of water distribution to a 96-unit residential housing
estate with a total design flow rate of 24 l/s and a first index pipe run of 705m. A
useful method of distribution pipe sizing and estimation of the frictional and fitting
loss components is presented. The fraction of head loss due to fittings in the first index
pipe run is found to be 0.392 of the total loss. This fraction falls in the region predicted
by an earlier study.
Accepted: 14 May2014 © Academic Research Online Publisher. All rights reserved.
1. Introduction
In a related paper, the fraction of the total head loss
which constitutes that through pipe fittings for the
first index pipe run was computed for a water
distribution system serving a 448-bed student hostel
building [1]. The relevant fluid mechanics equations
employed to obtain the frictional and fittings loss are,
respectively, the Hazen-Williams equation expressed
for plastic pipe material as [2]
lf
h /3
101374.1
x 85.1867.4 qd
(1)
where hf = frictional head loss (in m)
l = pipe length (m)
d = pipe diameter (m)
q = flow rate )/( 3 sm
and the D’Arcy-Weisbach equation expressed in
terms of the head loss coefficient k of the fitting as
[3]:
2408256.0 qkdph
(2)
The result of that study agreed well with an earlier
one which studied the effect of varying the available
distribution pressure on the fraction of loss due to
pipe fittings [4].
John I. Sodiki et al./Journal of Advanced & Applied Sciences (JAAS), 2 (3): 105-116, 2014
106 | P a g e
The present case study is one in which water is
distributed to a 96 – unit residential estate. The
frictional and fitting loss components in the first
index pipe run are calculated using the methods
employed in the case of distribution to the student
hostel building [1]. The fraction of the head loss due
to fittings is obtained and compared with typical
values obtained from earlier studies.
2. Distribution system to the residential estate
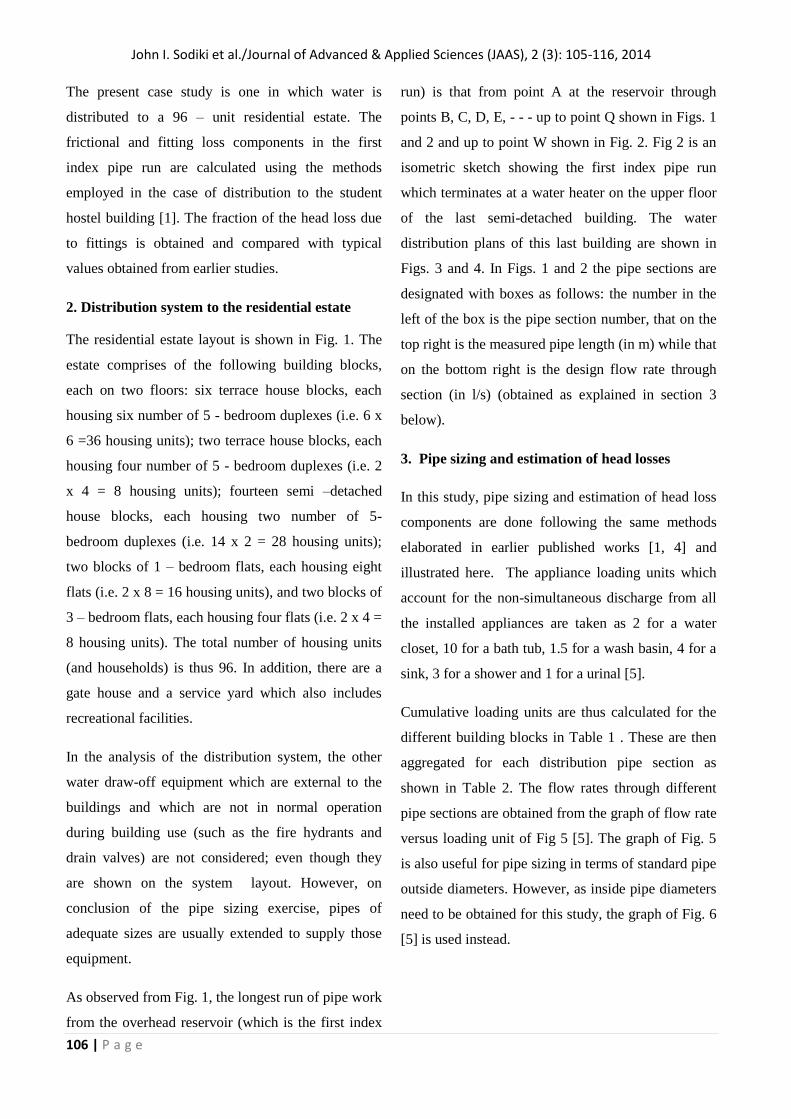
The residential estate layout is shown in Fig. 1. The
estate comprises of the following building blocks,
each on two floors: six terrace house blocks, each
housing six number of 5 - bedroom duplexes (i.e. 6 x
6 =36 housing units); two terrace house blocks, each
housing four number of 5 - bedroom duplexes (i.e. 2
x 4 = 8 housing units); fourteen semi –detached
house blocks, each housing two number of 5-
bedroom duplexes (i.e. 14 x 2 = 28 housing units);
two blocks of 1 – bedroom flats, each housing eight
flats (i.e. 2 x 8 = 16 housing units), and two blocks of
3 – bedroom flats, each housing four flats (i.e. 2 x 4 =
8 housing units). The total number of housing units
(and households) is thus 96. In addition, there are a
gate house and a service yard which also includes
recreational facilities.
In the analysis of the distribution system, the other
water draw-off equipment which are external to the
buildings and which are not in normal operation
during building use (such as the fire hydrants and
drain valves) are not considered; even though they
are shown on the system layout. However, on
conclusion of the pipe sizing exercise, pipes of
adequate sizes are usually extended to supply those
equipment.
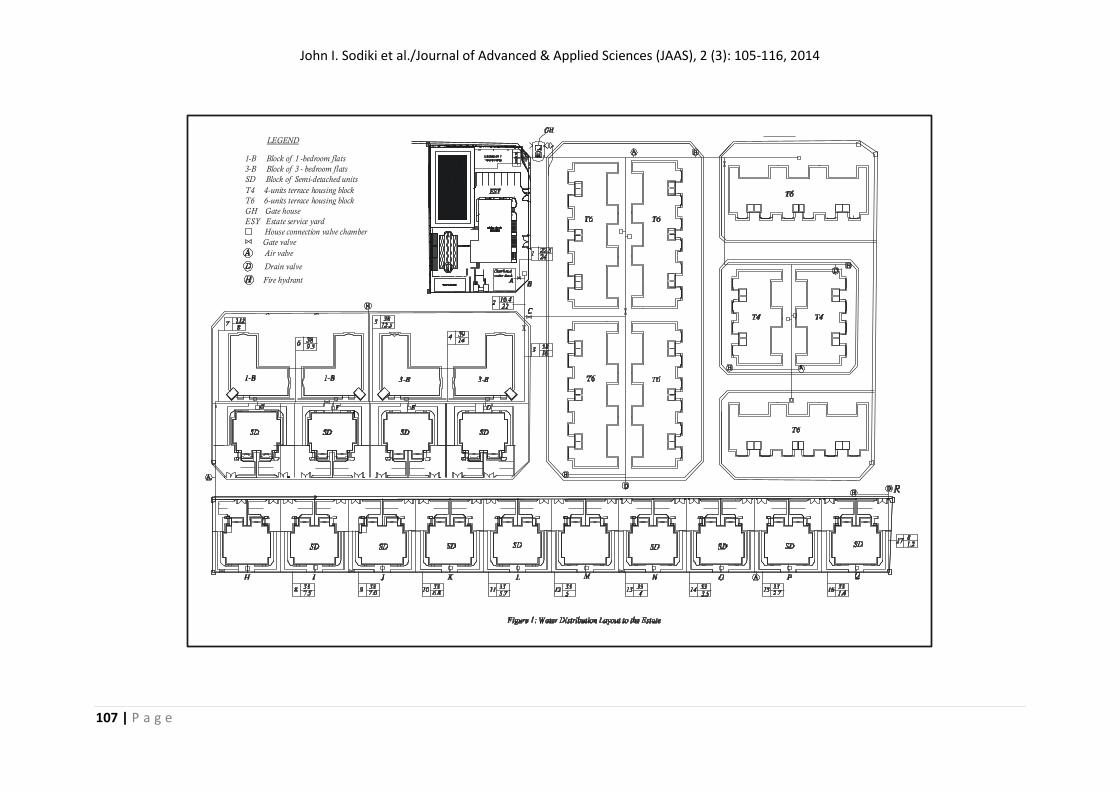
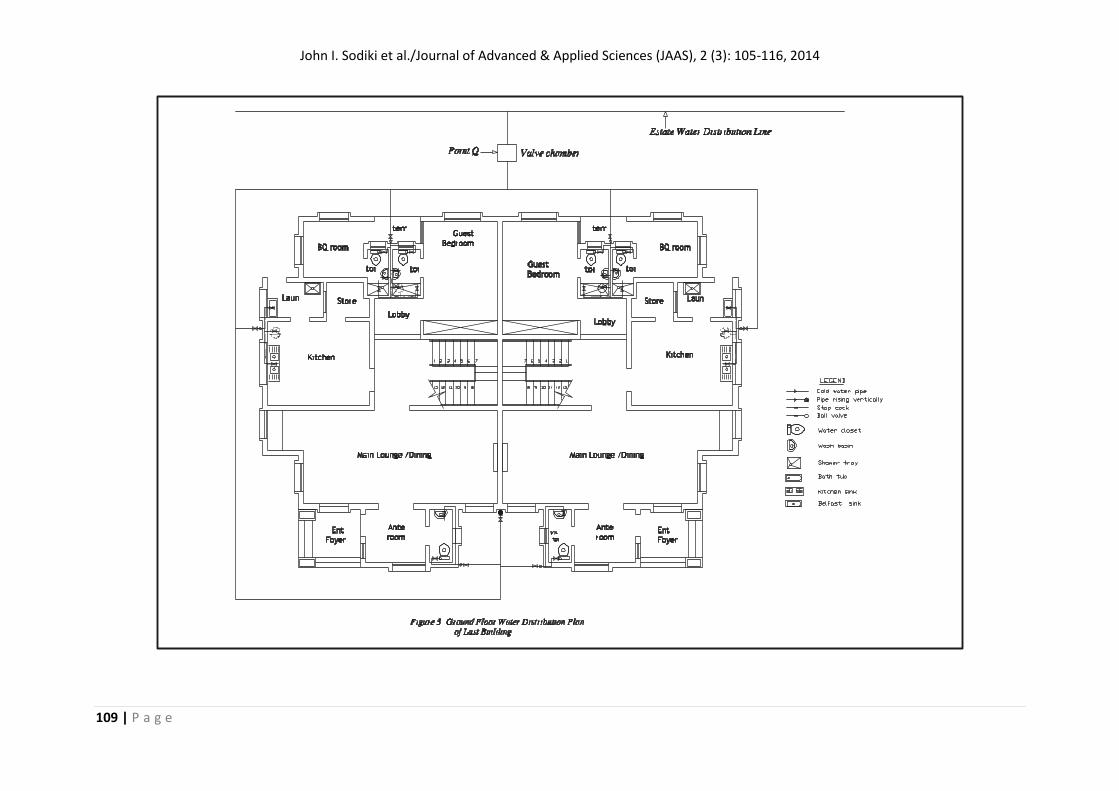
As observed from Fig. 1, the longest run of pipe work
from the overhead reservoir (which is the first index
run) is that from point A at the reservoir through
points B, C, D, E, - - - up to point Q shown in Figs. 1
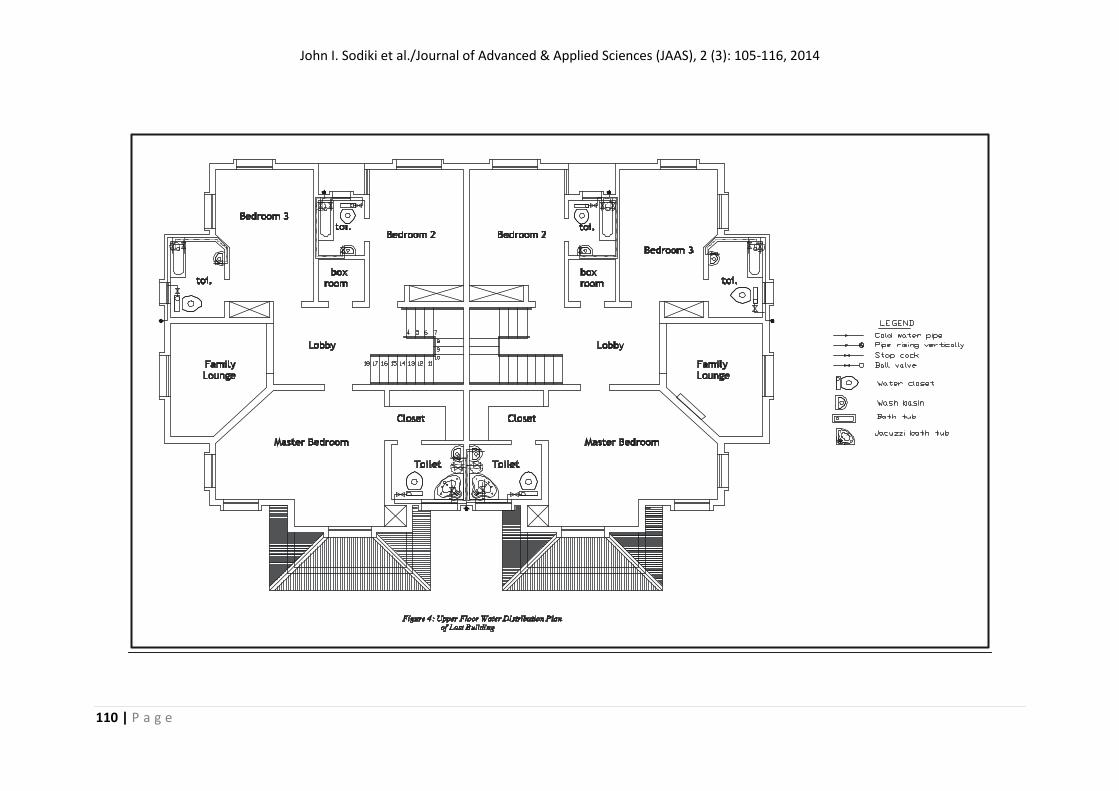
and 2 and up to point W shown in Fig. 2. Fig 2 is an
isometric sketch showing the first index pipe run
which terminates at a water heater on the upper floor
of the last semi-detached building. The water
distribution plans of this last building are shown in
Figs. 3 and 4. In Figs. 1 and 2 the pipe sections are
designated with boxes as follows: the number in the
left of the box is the pipe section number, that on the
top right is the measured pipe length (in m) while that
on the bottom right is the design flow rate through
section (in l/s) (obtained as explained in section 3
below).
3. Pipe sizing and estimation of head losses
In this study, pipe sizing and estimation of head loss
components are done following the same methods
elaborated in earlier published works [1, 4] and
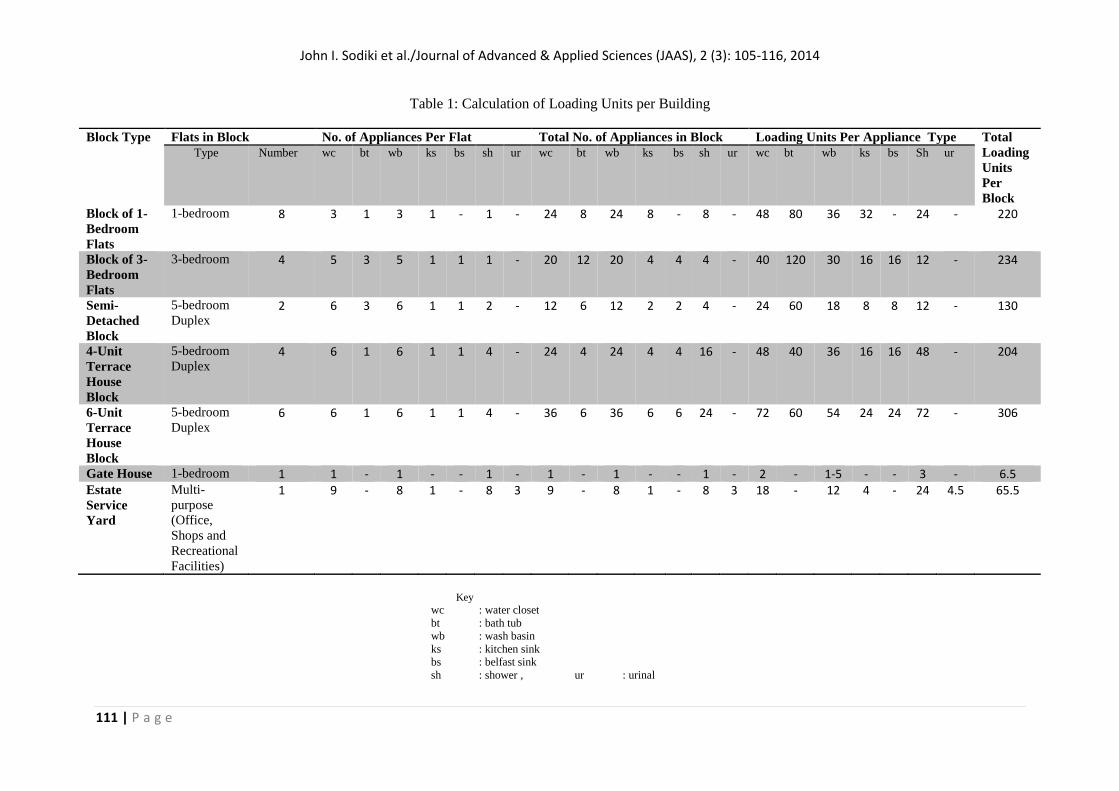
illustrated here. The appliance loading units which
account for the non-simultaneous discharge from all
the installed appliances are taken as 2 for a water
closet, 10 for a bath tub, 1.5 for a wash basin, 4 for a
sink, 3 for a shower and 1 for a urinal [5].
Cumulative loading units are thus calculated for the
different building blocks in Table 1 . These are then
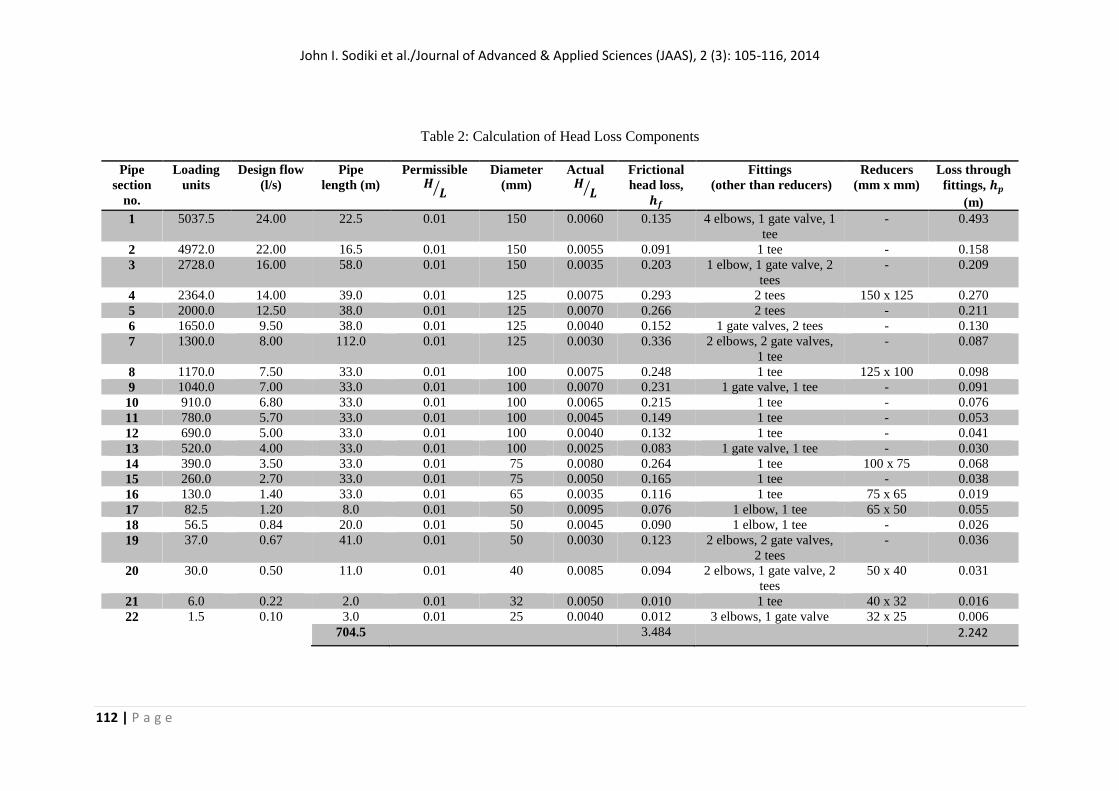
aggregated for each distribution pipe section as
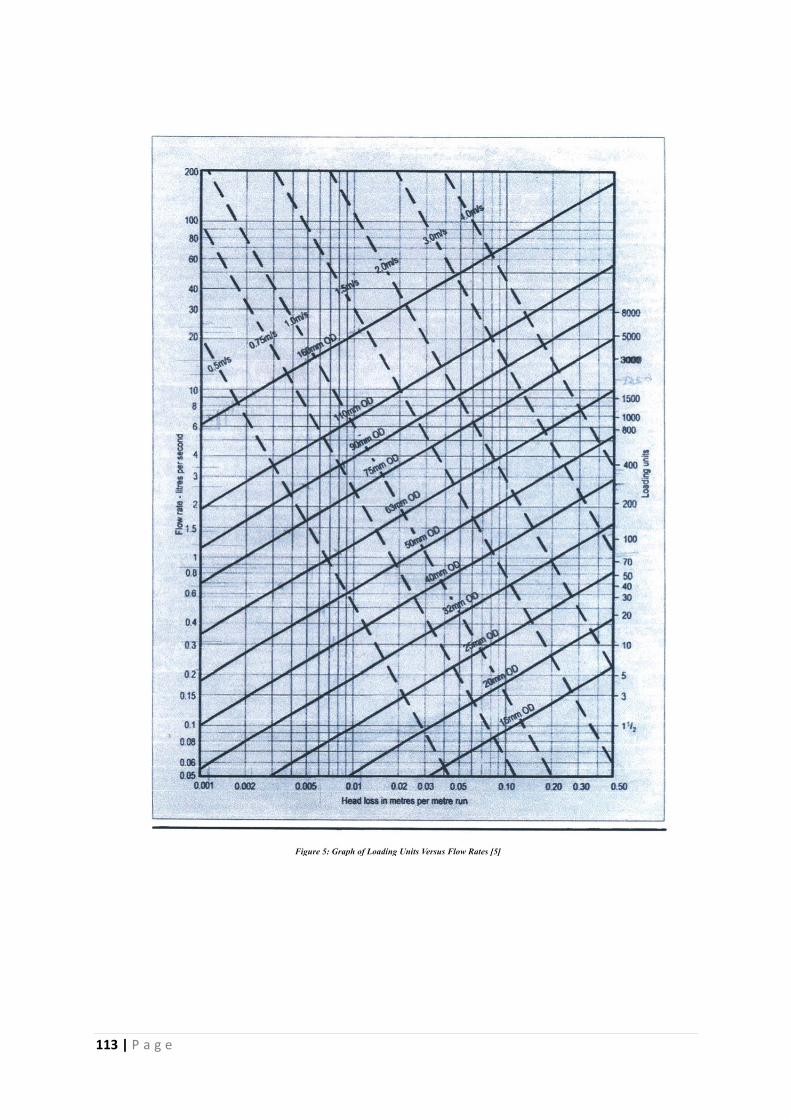
shown in Table 2. The flow rates through different
pipe sections are obtained from the graph of flow rate
versus loading unit of Fig 5 [5]. The graph of Fig. 5
is also useful for pipe sizing in terms of standard pipe
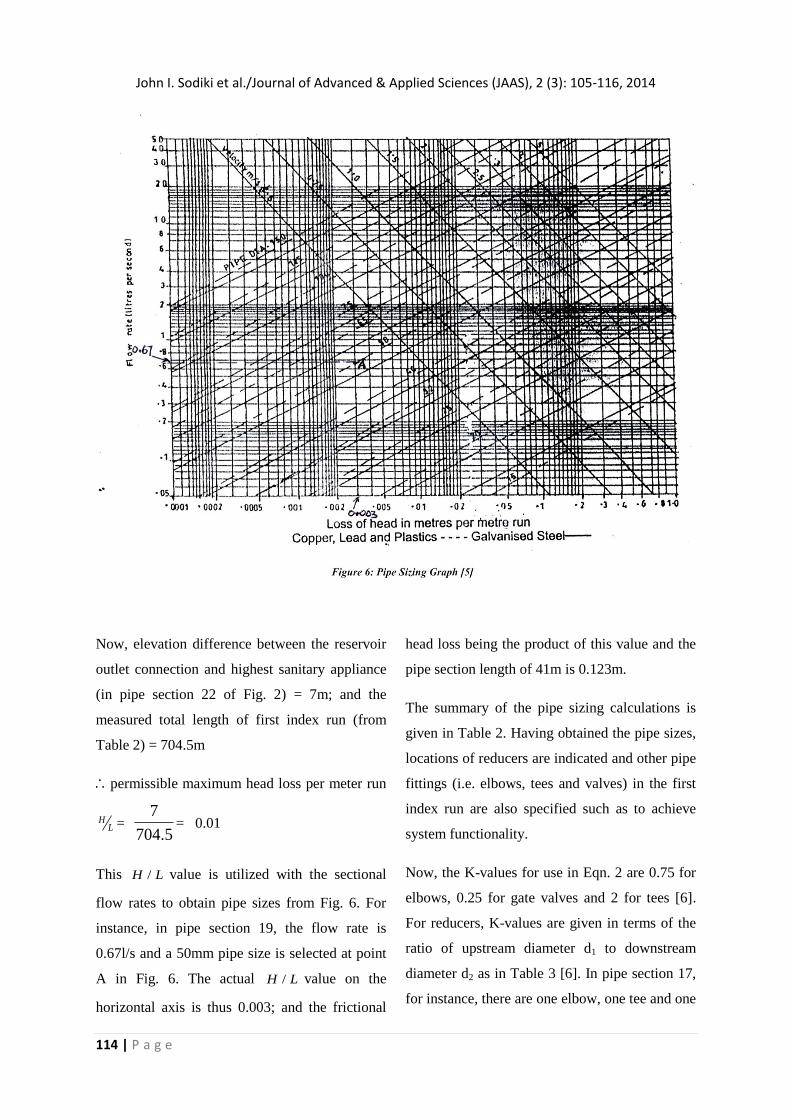
outside diameters. However, as inside pipe diameters
need to be obtained for this study, the graph of Fig. 6
[5] is used instead.
John I. Sodiki et al./Journal of Advanced & Applied Sciences (JAAS), 2 (3): 105-116, 2014
107 | P a g e
LEGEND
1-B Block of 1 -bedroom flats
3-B Block of 3 - bedroom flats
SD Block of Semi-detached units
T4 4-units terrace housing block
T6 6-units terrace housing block
GH Gate house
ESY Estate service yard
House connection valve chamber
Gate valve
Air valve
Drain valve
Fire hydrant
John I. Sodiki et al./Journal of Advanced & Applied Sciences (JAAS), 2 (3): 105-116, 2014
108 | P a g e
John I. Sodiki et al./Journal of Advanced & Applied Sciences (JAAS), 2 (3): 105-116, 2014
109 | P a g e
John I. Sodiki et al./Journal of Advanced & Applied Sciences (JAAS), 2 (3): 105-116, 2014
110 | P a g e
John I. Sodiki et al./Journal of Advanced & Applied Sciences (JAAS), 2 (3): 105-116, 2014
111 | P a g e
Table 1: Calculation of Loading Units per Building
Block Type Flats in Block No. of Appliances Per Flat Total No. of Appliances in Block Loading Units Per Appliance Type Total
Loading
Units
Per
Block
Type Number wc bt wb ks bs sh ur wc bt wb ks bs sh ur wc bt wb ks bs Sh ur
Block of 1-
Bedroom
Flats
1-bedroom 8 3 1 3 1 - 1 - 24 8 24 8 - 8 - 48 80 36 32 - 24 - 220
Block of 3-
Bedroom
Flats
3-bedroom 4 5 3 5 1 1 1 - 20 12 20 4 4 4 - 40 120 30 16 16 12 - 234
Semi-
Detached
Block
5-bedroom
Duplex 2 6 3 6 1 1 2 - 12 6 12 2 2 4 - 24 60 18 8 8 12 - 130
4-Unit
Terrace
House
Block
5-bedroom
Duplex 4 6 1 6 1 1 4 - 24 4 24 4 4 16 - 48 40 36 16 16 48 - 204
6-Unit
Terrace
House
Block
5-bedroom
Duplex 6 6 1 6 1 1 4 - 36 6 36 6 6 24 - 72 60 54 24 24 72 - 306
Gate House 1-bedroom 1 1 - 1 - - 1 - 1 - 1 - - 1 - 2 - 1-5 - - 3 - 6.5 Estate
Service
Yard
Multi-
purpose
(Office,
Shops and
Recreational
Facilities)
1 9 - 8 1 - 8 3 9 - 8 1 - 8 3 18 - 12 4 - 24 4.5 65.5
Key
wc : water closet
bt : bath tub
wb : wash basin
ks : kitchen sink
bs : belfast sink
sh : shower , ur : urinal
John I. Sodiki et al./Journal of Advanced & Applied Sciences (JAAS), 2 (3): 105-116, 2014
112 | P a g e
Table 2: Calculation of Head Loss Components
Pipe
section
no.
Loading
units
Design flow
(l/s)
Pipe
length (m)
Permissible ⁄
Diameter
(mm)
Actual ⁄
Frictional
head loss,
Fittings
(other than reducers)
Reducers
(mm x mm)
Loss through
fittings,
(m)
1 5037.5 24.00 22.5 0.01 150 0.0060 0.135 4 elbows, 1 gate valve, 1
tee
- 0.493
2 4972.0 22.00 16.5 0.01 150 0.0055 0.091 1 tee - 0.158
3 2728.0 16.00 58.0 0.01 150 0.0035 0.203 1 elbow, 1 gate valve, 2
tees
- 0.209
4 2364.0 14.00 39.0 0.01 125 0.0075 0.293 2 tees 150 x 125 0.270
5 2000.0 12.50 38.0 0.01 125 0.0070 0.266 2 tees - 0.211
6 1650.0 9.50 38.0 0.01 125 0.0040 0.152 1 gate valves, 2 tees - 0.130
7 1300.0 8.00 112.0 0.01 125 0.0030 0.336 2 elbows, 2 gate valves,
1 tee
- 0.087
8 1170.0 7.50 33.0 0.01 100 0.0075 0.248 1 tee 125 x 100 0.098
9 1040.0 7.00 33.0 0.01 100 0.0070 0.231 1 gate valve, 1 tee - 0.091
10 910.0 6.80 33.0 0.01 100 0.0065 0.215 1 tee - 0.076
11 780.0 5.70 33.0 0.01 100 0.0045 0.149 1 tee - 0.053
12 690.0 5.00 33.0 0.01 100 0.0040 0.132 1 tee - 0.041
13 520.0 4.00 33.0 0.01 100 0.0025 0.083 1 gate valve, 1 tee - 0.030
14 390.0 3.50 33.0 0.01 75 0.0080 0.264 1 tee 100 x 75 0.068
15 260.0 2.70 33.0 0.01 75 0.0050 0.165 1 tee - 0.038
16 130.0 1.40 33.0 0.01 65 0.0035 0.116 1 tee 75 x 65 0.019
17 82.5 1.20 8.0 0.01 50 0.0095 0.076 1 elbow, 1 tee 65 x 50 0.055
18 56.5 0.84 20.0 0.01 50 0.0045 0.090 1 elbow, 1 tee - 0.026
19 37.0 0.67 41.0 0.01 50 0.0030 0.123 2 elbows, 2 gate valves,
2 tees
- 0.036
20 30.0 0.50 11.0 0.01 40 0.0085 0.094 2 elbows, 1 gate valve, 2
tees
50 x 40 0.031
21 6.0 0.22 2.0 0.01 32 0.0050 0.010 1 tee 40 x 32 0.016
22 1.5 0.10 3.0 0.01 25 0.0040 0.012 3 elbows, 1 gate valve 32 x 25 0.006
704.5 3.484 2.242
113 | P a g e
John I. Sodiki et al./Journal of Advanced & Applied Sciences (JAAS), 2 (3): 105-116, 2014
114 | P a g e
Now, elevation difference between the reservoir
outlet connection and highest sanitary appliance
(in pipe section 22 of Fig. 2) = 7m; and the
measured total length of first index run (from
Table 2) = 704.5m
permissible maximum head loss per meter run
LH =
5.704
7= 0.01
This LH / value is utilized with the sectional
flow rates to obtain pipe sizes from Fig. 6. For
instance, in pipe section 19, the flow rate is
0.67l/s and a 50mm pipe size is selected at point
A in Fig. 6. The actual LH / value on the
horizontal axis is thus 0.003; and the frictional
head loss being the product of this value and the
pipe section length of 41m is 0.123m.
The summary of the pipe sizing calculations is
given in Table 2. Having obtained the pipe sizes,
locations of reducers are indicated and other pipe
fittings (i.e. elbows, tees and valves) in the first
index run are also specified such as to achieve
system functionality.
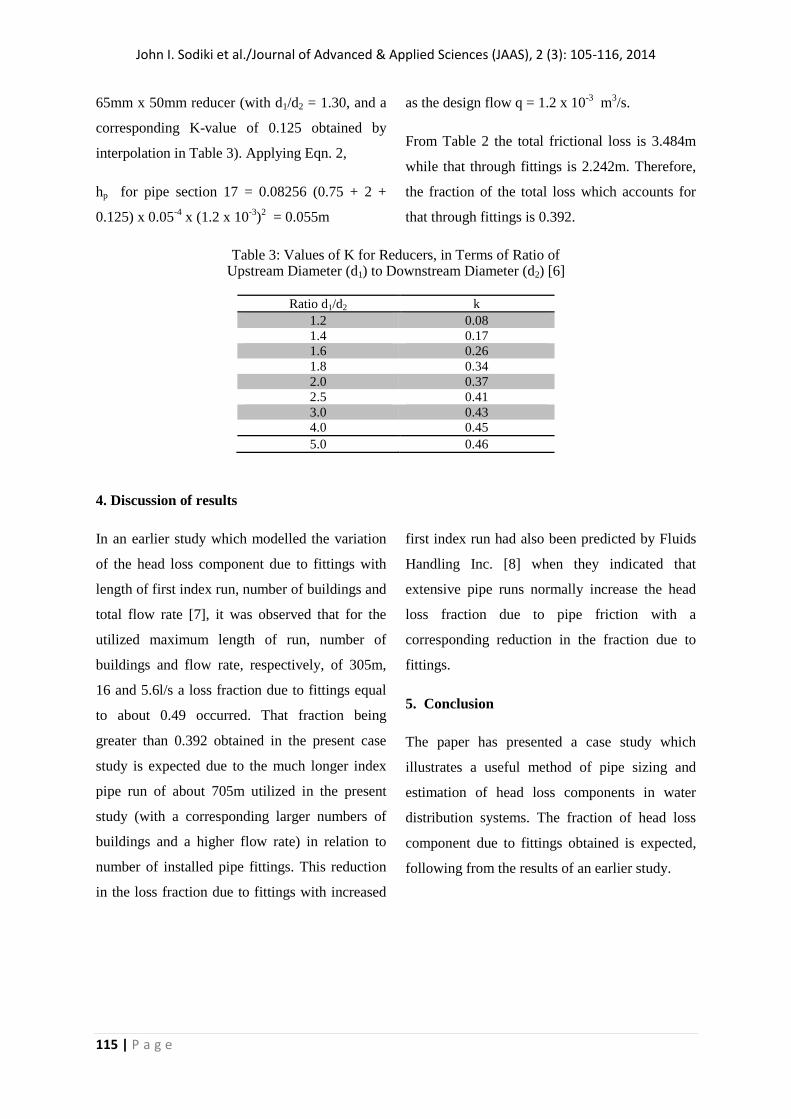
Now, the K-values for use in Eqn. 2 are 0.75 for
elbows, 0.25 for gate valves and 2 for tees [6].
For reducers, K-values are given in terms of the
ratio of upstream diameter d1 to downstream
diameter d2 as in Table 3 [6]. In pipe section 17,
for instance, there are one elbow, one tee and one
John I. Sodiki et al./Journal of Advanced & Applied Sciences (JAAS), 2 (3): 105-116, 2014
115 | P a g e
65mm x 50mm reducer (with d1/d2 = 1.30, and a
corresponding K-value of 0.125 obtained by
interpolation in Table 3). Applying Eqn. 2,
hp for pipe section 17 = 0.08256 (0.75 + 2 +
0.125) x 0.05-4
x (1.2 x 10-3
)2 = 0.055m
as the design flow q = 1.2 x 10⁻³
m3/s.
From Table 2 the total frictional loss is 3.484m
while that through fittings is 2.242m. Therefore,
the fraction of the total loss which accounts for
that through fittings is 0.392.
Table 3: Values of K for Reducers, in Terms of Ratio of Upstream Diameter (d1) to Downstream Diameter (d2) [6]
Ratio d1/d2 k
1.2 0.08
1.4 0.17
1.6 0.26
1.8 0.34
2.0 0.37
2.5 0.41
3.0 0.43
4.0 0.45
5.0 0.46
4. Discussion of results
In an earlier study which modelled the variation
of the head loss component due to fittings with
length of first index run, number of buildings and
total flow rate [7], it was observed that for the
utilized maximum length of run, number of
buildings and flow rate, respectively, of 305m,
16 and 5.6l/s a loss fraction due to fittings equal
to about 0.49 occurred. That fraction being
greater than 0.392 obtained in the present case
study is expected due to the much longer index
pipe run of about 705m utilized in the present
study (with a corresponding larger numbers of
buildings and a higher flow rate) in relation to
number of installed pipe fittings. This reduction
in the loss fraction due to fittings with increased
first index run had also been predicted by Fluids
Handling Inc. [8] when they indicated that
extensive pipe runs normally increase the head
loss fraction due to pipe friction with a
corresponding reduction in the fraction due to
fittings.
5. Conclusion
The paper has presented a case study which
illustrates a useful method of pipe sizing and
estimation of head loss components in water
distribution systems. The fraction of head loss
component due to fittings obtained is expected,
following from the results of an earlier study.
John I. Sodiki et al./Journal of Advanced & Applied Sciences (JAAS), 2 (3): 105-116, 2014
116 | P a g e
References
[1] Sodiki JI, Adigio EM, The head loss ratio in
water distribution: case study of a 448-bed
student hostel. Journal of Innovative Systems
Design and Engineering. 2014; 4(5): 91-100
[2] Sodiki JI, A representative expression for
swimming pool circulator pumps selection.
Nigerian Journal of Engineering Research and
Development 2002; 1 (4): 24-35
[3] Sodiki JI, Design analysis of water supply
and distribution to a multi-storey building
utilizing a borehole source. Nigerian Journal of
Industrial and Systems Studies 2003;2 (2): 16-32
[4] Sodiki JI, The effect of system pressure on
head loss components (Part 1: water distribution
within buildings). International Journal of
Scientific and Engineering Research 2013; 4
(11): 881-903
[5] Institute of Plumbing, Plumbing services
design guide. (Section A), Essex 1977: 6-7
[6] Giles RV, Fluid mechanics and hydraulics.
1977, McGraw-Hill, New York: 252 – 253.
[7] Sodiki JI, Modeling of head loss components
in water distribution to a group of
buildings.Journal of Basic and Applied Scientific
Research 2013; 3(12): 342-351
[8] Fluids Handling Inc, Calculating pump head
2008. [Online] Available: http://www.fluidh.com