the hershey company · 2009 annual report to stockholders the hershey company proxy statement and...
TRANSCRIPT
Letters to Stockholders
Notice of 2010 Annual Meeting and Proxy Statement
2009 Annual Report to Stockholders
The Hershey CompanyProxy Statement and2009 Annual Report
to Stockholders
March 22, 2010
To Our Stockholders:
It is my pleasure to invite you to attend the 2010 Annual Meeting ofStockholders of The Hershey Company to be held at 10:00 a.m. EasternDaylight Time on Tuesday, May 4, 2010.
Business scheduled to be considered at the meeting includes (1) the electionof eight directors and (2) ratification of the appointment of KPMG LLP as theCompany’s independent auditors for 2010. Management will review theCompany’s 2009 performance and will be available to respond to questionsduring the meeting.
The meeting will be held at GIANT Center, 550 West Hersheypark Drive,Hershey, Pennsylvania. Directions to GIANT Center are included with thesematerials. The doors to GIANT Center will open at 8:00 a.m. Please note theonly entrance to the meeting will be at the front of GIANT Center. Seatingwill be in the arena seats and will require use of the stadium steps. Therewill be designated seating for those using wheelchairs or requiring specialassistance.
If you plan to attend the meeting, you will need an ADMISSION TICKETand a government-issued PHOTO IDENTIFICATION to gain admission.Any of the following items will serve as your ADMISSION TICKET:
• The Notice of Internet Availability of Proxy Materials youreceived by mail, directing you to the website where proxy materialscould be accessed;
• The top half of your Proxy Card, if you received your proxymaterials in paper form;
• An Admission Ticket supplied by our Investor RelationsDepartment upon your request if your proxy materials weredelivered by email; or
• A letter from your broker, bank or other nominee, or yourmost recent account statement, indicating that you were thebeneficial owner of Hershey stock as of the record date, if yourshares are held in street name.

Please remember that, if you are a street name holder and want to vote your shares at themeeting, you also will need to bring a legal proxy from your broker, bank or other nominee.
As in prior years, we highly recommend you do not carry items such as handbags and packages tothe meeting as all such items will be inspected. Weapons and sharp objects (such as pocketknivesand scissors), cell phones, pagers, cameras and recording devices will not be permitted inside themeeting room.
Please note that we will not distribute voting ballots during the meeting. If you plan to vote at themeeting, pick up a ballot at any of the registration booths upon your arrival and place it in theballot boxes located near the Security Booth area, or submit your ballot to a meeting usher at thetime designated during the meeting.
We also invite you to visit HERSHEY’S CHOCOLATE WORLD visitors center on the day of theAnnual Meeting. Please note that this year the visitors center will be open from 9:00 a.m. to6:00 p.m. Once again, we are offering stockholders a special 25% discount on selected items. Youwill need to show your ADMISSION TICKET (in any of the forms described above) atHERSHEY’S CHOCOLATE WORLD to receive the special discount.
The economy continues to create challenges for many in our communities. In recognition of this,The Hershey Company is again making a contribution to community agencies in lieu of providinggifts to those attending this meeting. This contribution is consistent with our commitment to ourcommunities and with Milton Hershey’s legacy of helping those less fortunate.
To assure proper representation of your shares at the meeting, we encourage you to submit yourvoting instructions to the Company in advance by Internet, phone or mail. Please refer to ourproxy materials for more information on how to vote your shares.
I look forward to seeing you at the meeting.
Regards,
James E. Nevels
David J. WestPresident & Chief Executive Officer
March 22, 2010
To Our Fellow Stockholders,
The Hershey Company delivered strong results in a difficult environment during 2009. Overall, asstockholders, we can be extremely proud of what our Company accomplished. We have entered2010 in a strong position and are encouraged by our prospects for the year.
Here are a few highlights:
• Full-year 2009 net sales were $5.3 billion, an increase of 3.2% on a reported basis.Excluding the impact of unfavorable foreign currency exchange rates of 1%, net salesincreased 4.2%.
• Full-year 2009 adjusted earnings per share-diluted, which we define on pages 19 and 20of the Annual Report to Stockholders that accompanies this letter, were $2.17, anincrease of 15% over 2008.
• Operating cash flow was a record $1.1 billion.
• Dividend increased by 7.6% in February 2010.
Our 2009 marketplace performance was strong in the channels where we concentrated ourresources. Hershey retail takeaway was up 7.2% for the full year in the channels that account forover 80% of our U.S. retail business. We also gained market share in the channels measured bysyndicated data for the first time since 2005. Our in-store sales force continues to be a competitiveadvantage and differentiates Hershey from its competitors.
Our marketplace performance was the result of our increased investment in our core brands,consumer insights and global infrastructure. For the year, we increased advertising by 50% over2008! Our investment in Hershey’s brand-building initiatives and selling capabilities enabled ourmarketplace success. This investment was funded by savings from our Global Supply ChainTransformation program and the successful implementation of a price increase made necessary byincreasing commodity and other input costs. Both of these initiatives were vital to creating theresources to invest in our brands.
We also made progress in our international business and continued our long-term strategy ofinvesting in our global infrastructure in strategic markets. In 2009, these investments includedour global SAP software implementation and our acquisition of the Van Houten business in Asia.
Undoubtedly, many of you read the speculative press reports over the past couple of monthsregarding Cadbury. As a matter of policy, we generally do not comment on merger and acquisitionissues.
But I can tell you, The Hershey Company undertook a rigorous and disciplined examination of apotential bid for Cadbury. The Board of Directors and senior management team unanimouslydecided not to make an offer for Cadbury. While certain parts of Cadbury were attractive, asuccessful bid simply did not fit within our long-term financial framework. Thanks to thecommitment of Hershey’s employees, our team remained focused and closed the year successfully,without allowing the rumors and speculation to become a distraction.
We remain steadfastly committed to investing in our global infrastructure over the long term, and wecontinue to make progress. Over the past five years, our international business has grown at acompound annual rate of about 20%. We’ve strengthened our position in China, India, Brazil, Mexicoand other key global markets. As we look to the long term, Hershey has many opportunities toleverage its global brands and U.S. scale. The new consumer-based model is working in the U.S. and
this approach is being adopted in our international markets. In recent years, we have seen the benefitsof a focused, disciplined approach across our business. We will continue to evaluate future acquisitionopportunities in a disciplined manner to ensure an appropriate fit within our strategic framework.
With almost a 45% share of the U.S. chocolate market, we remain encouraged by our position in themarketplace and our ability to compete successfully. We remain committed to category leadershipand will strive to deliver our iconic brands to consumers around the world as we continue to be theconfectionery solution for all customers, in all channels, in the near and long term.
Moving into 2010, we will continue to execute our consumer-driven strategy. Our brand-buildinginitiatives continue to deliver results with consumers, as evidenced by our core brand marketshare gains. During the first half of 2010, we will continue the distribution and rollout of our newHershey’s Bliss white chocolate and continue the expansion of the Pieces format to includeHershey’s Special Dark, Almond Joy and York brands. In the second half of 2010, we’re bringinginnovation to our largest brands, with Reese’s Minis and Hershey’s Drops candies. These offeringswill enable our largest brands to participate in the rapidly growing hand-to-mouth segment.
We expect to increase advertising by 25% to 30% during the year, supporting our new productlaunches and core brands – particularly Hershey’s, Reese’s, Hershey’s Kisses, Hershey’s Bliss,Twizzlers and Kit Kat. We will also launch new advertising campaigns behind the Almond Joy,Mounds and York brands and increase support for key international brands.
Hershey has long been category captain, based on our proprietary tools and our unmatched in-storesales force. Moving forward, we are working with retailers to leverage our deep knowledge ofconsumer behavior and shopper preferences to drive profitable growth. Specifically, I’m pleased toannounce the launch of Insights Driven Performance – IDP – a collaborative initiative with keyretail customers that leverages the Company’s deep knowledge of consumer behavior and shopperpreferences to deliver profitable confectionery growth. We have shared the concept of IDP withmany of our key retail partners who are excited about this new approach and how it will transformthe way consumers shop for candy, changing store layouts and fixtures and growing the category.
Increased levels of consumer investment and brand support, as well as collaborative efforts withretail customers in all classes of trade, will continue and should deliver improvement in net saleswithin our 3% to 5% long-term objective. Additionally, we have good visibility into our 2010 coststructure and expect our growth in adjusted earnings per share-diluted to be within our long-termobjective of 6% to 8%. Despite the macro-economic challenges facing consumers, the categorycontinues to grow across retail channels, in both the measured and non-measured outlets. Ouradvertising, consumer investments and insights work will enable Hershey to consistently andpredictably achieve its financial targets.
Hershey possesses significant advantages, including iconic brands, an enviable position in NorthAmerica, a strong footprint in key emerging markets and most importantly, what I believe is thebest team in the industry. Our Board of Directors and management team remain confident inHershey’s consumer-driven strategy and in the Company’s ability to execute and deliver long-termvalue for all stockholders. Thank you for your support.
David J. West
Safe Harbor Statement
Please refer to the 2009 Annual Report to Stockholders that accompanies this letter for a discussionof Risk Factors that could cause future results to differ materially from the forward-lookingstatements, expectations and assumptions expressed or implied in this letter to stockholders orelsewhere. This letter to stockholders is not part of our proxy soliciting material.
TABLE OF CONTENTS
Page
NOTICE OF ANNUAL MEETING OF STOCKHOLDERS ➞PROXY STATEMENT 1 ➞Information about the Annual Meeting and Voting . . . . . . . . . . . . . . . . . . . . . . . . . . . . . . . . . . . 2
Annual Meeting Information . . . . . . . . . . . . . . . . . . . . . . . . . . . . . . . . . . . . . . . . . . . . . . . . . . 2Voting Information . . . . . . . . . . . . . . . . . . . . . . . . . . . . . . . . . . . . . . . . . . . . . . . . . . . . . . . . . . . 4Additional Information about the Annual Meeting . . . . . . . . . . . . . . . . . . . . . . . . . . . . . . . . 8
Governance of the Company . . . . . . . . . . . . . . . . . . . . . . . . . . . . . . . . . . . . . . . . . . . . . . . . . . . . . . . 9Director Compensation . . . . . . . . . . . . . . . . . . . . . . . . . . . . . . . . . . . . . . . . . . . . . . . . . . . . . . . . . . . 23Proposal No. 1 – Election of Directors . . . . . . . . . . . . . . . . . . . . . . . . . . . . . . . . . . . . . . . . . . . . . . . 28Audit Committee Report . . . . . . . . . . . . . . . . . . . . . . . . . . . . . . . . . . . . . . . . . . . . . . . . . . . . . . . . . . 33Information about our Independent Auditors . . . . . . . . . . . . . . . . . . . . . . . . . . . . . . . . . . . . . . . . 35Proposal No. 2 – Appointment of Independent Auditors . . . . . . . . . . . . . . . . . . . . . . . . . . . . . . . 36Ownership of the Company’s Securities . . . . . . . . . . . . . . . . . . . . . . . . . . . . . . . . . . . . . . . . . . . . . 37Executive Compensation . . . . . . . . . . . . . . . . . . . . . . . . . . . . . . . . . . . . . . . . . . . . . . . . . . . . . . . . . . 43
Compensation Discussion and Analysis . . . . . . . . . . . . . . . . . . . . . . . . . . . . . . . . . . . . . . . . . 43Compensation Committee Report . . . . . . . . . . . . . . . . . . . . . . . . . . . . . . . . . . . . . . . . . . . . . . . 61Summary Compensation Table . . . . . . . . . . . . . . . . . . . . . . . . . . . . . . . . . . . . . . . . . . . . . . . . . 62Grants of Plan-Based Awards . . . . . . . . . . . . . . . . . . . . . . . . . . . . . . . . . . . . . . . . . . . . . . . . . . 66Outstanding Equity Awards . . . . . . . . . . . . . . . . . . . . . . . . . . . . . . . . . . . . . . . . . . . . . . . . . . . 68Option Exercises and Stock Vested . . . . . . . . . . . . . . . . . . . . . . . . . . . . . . . . . . . . . . . . . . . . . 70Pension Benefits . . . . . . . . . . . . . . . . . . . . . . . . . . . . . . . . . . . . . . . . . . . . . . . . . . . . . . . . . . . . . 71Non-Qualified Deferred Compensation . . . . . . . . . . . . . . . . . . . . . . . . . . . . . . . . . . . . . . . . . . 73Potential Payments Upon Termination or Change in Control . . . . . . . . . . . . . . . . . . . . . . . 76
Section 16(a) Beneficial Ownership Reporting Compliance . . . . . . . . . . . . . . . . . . . . . . . . . . . . . 83Certain Transactions and Relationships . . . . . . . . . . . . . . . . . . . . . . . . . . . . . . . . . . . . . . . . . . . . . 84Information about the 2011 Annual Meeting . . . . . . . . . . . . . . . . . . . . . . . . . . . . . . . . . . . . . . . . . 87Appendix A – Corporate Governance Guidelines . . . . . . . . . . . . . . . . . . . . . . . . . . . . . . . . . . . . . . A-1
ANNUAL REPORT TO STOCKHOLDERS ➞Item 1. Business . . . . . . . . . . . . . . . . . . . . . . . . . . . . . . . . . . . . . . . . . . . . . . . . . . . . . . . . . . . . . . . . . 1Item 1A. Risk Factors . . . . . . . . . . . . . . . . . . . . . . . . . . . . . . . . . . . . . . . . . . . . . . . . . . . . . . . . . . . . 10Item 1B. Unresolved Staff Comments . . . . . . . . . . . . . . . . . . . . . . . . . . . . . . . . . . . . . . . . . . . . . . . 13Item 2. Properties . . . . . . . . . . . . . . . . . . . . . . . . . . . . . . . . . . . . . . . . . . . . . . . . . . . . . . . . . . . . . . . . 14Item 3. Legal Proceedings . . . . . . . . . . . . . . . . . . . . . . . . . . . . . . . . . . . . . . . . . . . . . . . . . . . . . . . . . 15Item 4. Submission of Matters to a Vote of Security Holders . . . . . . . . . . . . . . . . . . . . . . . . . . . 15Item 5. Market for the Registrant’s Common Equity, Related Stockholder Matters and
Issuer Purchases of Equity Securities . . . . . . . . . . . . . . . . . . . . . . . . . . . . . . . . . . . . . . . . . . . . . 16Item 6. Selected Financial Data . . . . . . . . . . . . . . . . . . . . . . . . . . . . . . . . . . . . . . . . . . . . . . . . . . . . 18Item 7. Management’s Discussion and Analysis of Financial Condition and Results of
Operations . . . . . . . . . . . . . . . . . . . . . . . . . . . . . . . . . . . . . . . . . . . . . . . . . . . . . . . . . . . . . . . . . . . . 19Item 7A. Quantitative and Qualitative Disclosures about Market Risk . . . . . . . . . . . . . . . . . . 49Item 8. Financial Statements and Supplementary Data . . . . . . . . . . . . . . . . . . . . . . . . . . . . . . . 50Item 9. Changes in and Disagreements with Accountants on Accounting and Financial
Disclosure . . . . . . . . . . . . . . . . . . . . . . . . . . . . . . . . . . . . . . . . . . . . . . . . . . . . . . . . . . . . . . . . . . . . 98Item 9A. Controls and Procedures . . . . . . . . . . . . . . . . . . . . . . . . . . . . . . . . . . . . . . . . . . . . . . . . . . 98Item 9B. Other Information . . . . . . . . . . . . . . . . . . . . . . . . . . . . . . . . . . . . . . . . . . . . . . . . . . . . . . . 101
i
PageItem 10. Directors, Executive Officers and Corporate Governance . . . . . . . . . . . . . . . . . . . . . . . 102Item 11. Executive Compensation . . . . . . . . . . . . . . . . . . . . . . . . . . . . . . . . . . . . . . . . . . . . . . . . . . 103Item 12. Security Ownership of Certain Beneficial Owners and Management and Related
Stockholder Matters . . . . . . . . . . . . . . . . . . . . . . . . . . . . . . . . . . . . . . . . . . . . . . . . . . . . . . . . . . . . 103Item 13. Certain Relationships and Related Transactions, and Director Independence . . . . . 104Item 14. Principal Accountant Fees and Services . . . . . . . . . . . . . . . . . . . . . . . . . . . . . . . . . . . . . 104Item 15. Exhibits and Financial Statement Schedules . . . . . . . . . . . . . . . . . . . . . . . . . . . . . . . . . 105Signatures . . . . . . . . . . . . . . . . . . . . . . . . . . . . . . . . . . . . . . . . . . . . . . . . . . . . . . . . . . . . . . . . . . . . . . 109Certifications . . . . . . . . . . . . . . . . . . . . . . . . . . . . . . . . . . . . . . . . . . . . . . . . . . . . . . . . . . . . . . . . . . . . 112
ii
The Hershey Company
NOTICE OF ANNUAL MEETING OF STOCKHOLDERS
DATE AND TIME May 4, 2010 at 10:00 a.m. Eastern Daylight Time
PLACE GIANT Center550 West Hersheypark DriveHershey, PA 17033
ITEMS OF BUSINESS (1) Elect eight directors.
(2) Ratify the appointment of KPMG LLP as the Company’sindependent auditors for 2010.
(3) Discuss and take action on any other business that is properlybrought before the meeting.
WHO CAN VOTE? You are entitled to vote at the meeting and at any adjournment orpostponement of the meeting if you were a stockholder at the close ofbusiness on March 8, 2010, the record date for the annual meeting.
By order of the Board of Directors,
Burton H. SnyderSenior Vice President,General Counsel and Secretary
March 22, 2010
Your vote is important. Instructions on how to vote are contained in our proxystatement and in the Notice of Internet Availability of Proxy Materials. Please cast yourvote by telephone or over the Internet as described in those materials. Alternatively, ifyou requested a copy of the proxy/voting instruction card by mail, you may mark, sign,date and return the proxy/voting instruction card in the envelope provided.
The Hershey Company
100 Crystal A Drive
Hershey, Pennsylvania 17033
March 22, 2010
PROXY STATEMENT
For the Annual Meeting of Stockholders
To Be Held on May 4, 2010
The Board of Directors of The Hershey Company, a Delaware corporation, is furnishing this proxystatement to you in connection with the solicitation of proxies for our 2010 annual meeting ofstockholders. The meeting will be held on May 4, 2010, at 10:00 a.m. Eastern Daylight Time, atGIANT Center, 550 West Hersheypark Drive, Hershey, Pennsylvania 17033. Valid proxiesreceived in connection with the annual meeting may be voted at the annual meeting and at anyadjournments or postponements of that meeting.
Important Notice Regarding the Availability of Proxy Materials for the2010 Annual Meeting of Stockholders to be held on May 4, 2010
Our notice of annual meeting and proxy statement, annual report to stockholders,electronic proxy card and other annual meeting materials are available on the Internetat www.proxyvote.com. We intend to begin mailing our Notice of Internet Availability of ProxyMaterials to stockholders on or about March 22, 2010. At that time, we also will begin mailingpaper copies of our proxy materials to stockholders who requested them. Please see page 2 of thisproxy statement for more information on how these materials will be distributed.
1

INFORMATION ABOUT THE ANNUAL MEETING AND VOTING
Annual Meeting Information
What is a proxy statement and why is it important?
We hold a meeting of stockholders annually. This year’s meeting will be held on May 4, 2010.There will be certain items of business that must be voted on by our stockholders at the meeting,and our Board of Directors is seeking your proxy to vote on these items. This proxy statementcontains important information about The Hershey Company and the matters that will be votedon at the meeting. Please read these materials carefully so that you have the information youneed to make informed decisions. Throughout this proxy statement, we will refer to ourselves as“The Hershey Company,” “Hershey,” “we,” “our” or the “Company.”
How are proxy solicitation and other required annual meeting materialsdistributed?
The Securities and Exchange Commission, or SEC, has adopted rules that allow us to mail anotice to our stockholders advising that our proxy statement, annual report to stockholders,electronic proxy card and related materials are available for viewing, free of charge, on theInternet. Stockholders may then access these materials and vote over the Internet or requestdelivery of a full set of materials by mail or email. We have elected to utilize this process for the2010 annual meeting. We intend to begin mailing the required notice, called Notice of InternetAvailability of Proxy Materials, to stockholders on or about March 22, 2010. The proxy materialswill be posted on the Internet, at www.proxyvote.com, no later than the day we begin mailing theNotice. If you receive a Notice, you will not receive a paper or email copy of the proxy materialsunless you request one in the manner set forth in the Notice.
The Notice of Internet Availability of Proxy Materials contains important information, including:
• The date, time and location of the annual meeting;• A brief description of the matters to be voted on at the meeting;• A list of the proxy materials available for viewing on www.proxyvote.com and the control
number you will use to access the site; and• Instructions on how to access and review the proxy materials online, how to vote your
shares over the Internet, and how to get a paper or email copy of the proxy materials, ifthat is your preference.
These rules give us the opportunity to serve you more efficiently by making the proxy materialsavailable quickly online and reducing costs associated with printing and postage.
What is a proxy?
A proxy is your legal designation of another person to vote the stock that you own. The person youdesignate to vote your shares is also called a proxy. We have provided an electronic proxy card atwww.proxyvote.com that you will use to vote your shares online or by telephone. If you requesteda paper copy of our proxy materials, you also can vote using the proxy card enclosed with thosematerials. On our proxy card, you will find the names of the persons designated by the Companyto act as proxies to vote your shares at the annual meeting. When you submit a proxy, the peoplenamed on the proxy card as proxies are required to vote your shares at the annual meeting in themanner you have instructed. Please turn to page 4 for more information about voting your shares.
2
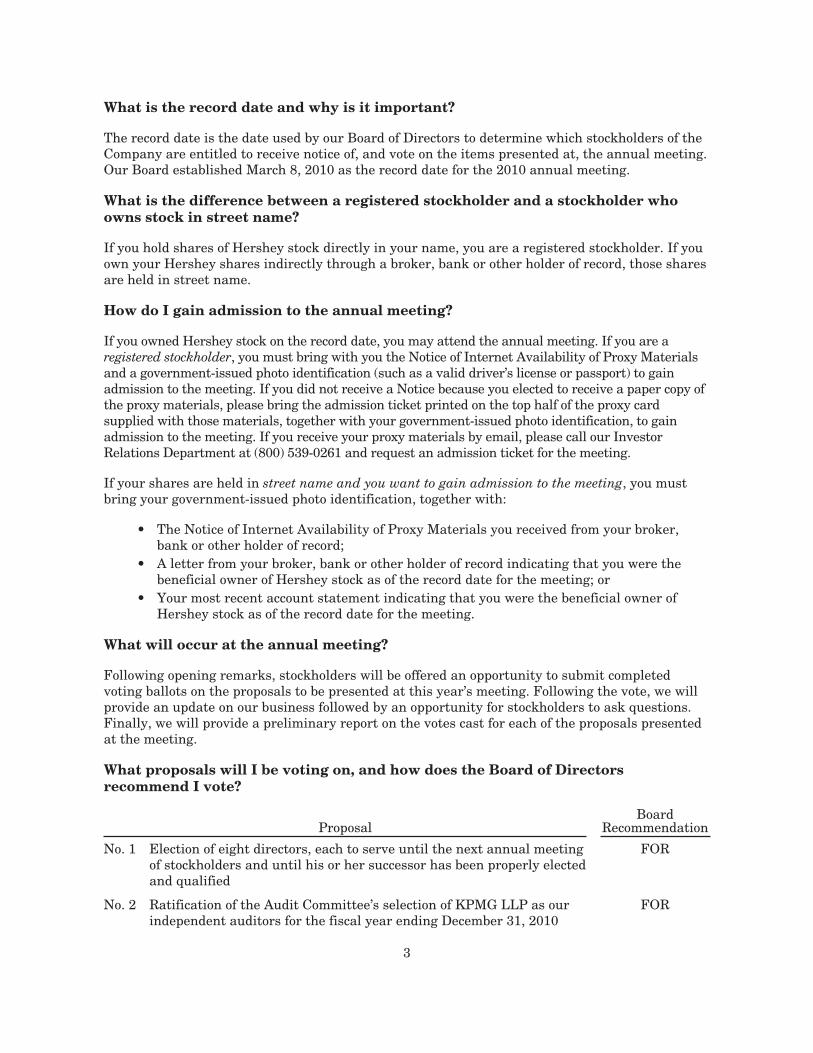
What is the record date and why is it important?
The record date is the date used by our Board of Directors to determine which stockholders of theCompany are entitled to receive notice of, and vote on the items presented at, the annual meeting.Our Board established March 8, 2010 as the record date for the 2010 annual meeting.
What is the difference between a registered stockholder and a stockholder whoowns stock in street name?
If you hold shares of Hershey stock directly in your name, you are a registered stockholder. If youown your Hershey shares indirectly through a broker, bank or other holder of record, those sharesare held in street name.
How do I gain admission to the annual meeting?
If you owned Hershey stock on the record date, you may attend the annual meeting. If you are aregistered stockholder, you must bring with you the Notice of Internet Availability of Proxy Materialsand a government-issued photo identification (such as a valid driver’s license or passport) to gainadmission to the meeting. If you did not receive a Notice because you elected to receive a paper copy ofthe proxy materials, please bring the admission ticket printed on the top half of the proxy cardsupplied with those materials, together with your government-issued photo identification, to gainadmission to the meeting. If you receive your proxy materials by email, please call our InvestorRelations Department at (800) 539-0261 and request an admission ticket for the meeting.
If your shares are held in street name and you want to gain admission to the meeting, you mustbring your government-issued photo identification, together with:
• The Notice of Internet Availability of Proxy Materials you received from your broker,bank or other holder of record;
• A letter from your broker, bank or other holder of record indicating that you were thebeneficial owner of Hershey stock as of the record date for the meeting; or
• Your most recent account statement indicating that you were the beneficial owner ofHershey stock as of the record date for the meeting.
What will occur at the annual meeting?
Following opening remarks, stockholders will be offered an opportunity to submit completedvoting ballots on the proposals to be presented at this year’s meeting. Following the vote, we willprovide an update on our business followed by an opportunity for stockholders to ask questions.Finally, we will provide a preliminary report on the votes cast for each of the proposals presentedat the meeting.
What proposals will I be voting on, and how does the Board of Directorsrecommend I vote?
ProposalBoard
Recommendation
No. 1 Election of eight directors, each to serve until the next annual meetingof stockholders and until his or her successor has been properly electedand qualified
FOR
No. 2 Ratification of the Audit Committee’s selection of KPMG LLP as ourindependent auditors for the fiscal year ending December 31, 2010
FOR
3
What other matters might arise at the meeting?
We are not aware of any other matters that will be brought before the stockholders at the annualmeeting. Except under very limited circumstances, stockholder proposals and nominations fordirector had to be submitted to us in advance and meet certain requirements in order to beeligible for consideration at the meeting. We described those requirements in our 2009 proxystatement. If any other item of business is properly presented for a vote at the annual meeting,the proxies will vote validly-executed proxies returned to us in accordance with their bestjudgment. Procedures for submitting stockholder proposals and nominations for director for the2011 annual meeting are described on page 87.
Voting Information
Does Hershey have more than one class of stock outstanding?
We have two classes of stock outstanding, Common Stock and Class B Common Stock. As of therecord date for the annual meeting, there were 166,182,457 shares of Common Stock outstandingand 60,708,908 shares of Class B Common Stock outstanding. All of the outstanding shares ofCommon Stock and Class B Common Stock are entitled to be voted at the meeting.
What are the voting rights of each class of stock?
You may cast one vote for each share of Common Stock that you held as of the close of business onthe record date. You may cast ten votes for each share of Class B Common Stock that you held asof the close of business on the record date.
What is a quorum and why is it important?
A quorum is the minimum number of votes required to be present at the annual meeting toconduct business. Votes will be deemed to be “present” at the meeting if a stockholder of record:
• Attends the meeting in person; or• Votes in advance by Internet, telephone or proxy card.
In most instances, holders of the Common Stock and Class B Common Stock vote together.However, there are some matters that must be voted on only by the holders of one class of stock.We will have a quorum for all matters to be voted upon at the annual meeting if the followingnumber of votes is present, in person or by proxy:
• For any matter requiring the vote of the Common Stock voting separately: a majority of thevotes of the Common Stock outstanding on the record date.
• For any matter requiring the vote of the Class B Common Stock voting separately: amajority of the votes of the Class B Common Stock outstanding on the record date.
• For any matter requiring the vote of the Common Stock and Class B Common Stock votingtogether without regard to class: a majority of the votes of the Common Stock and Class BCommon Stock outstanding on the record date.
It is possible that we could have a quorum for certain items of business to be voted on at theannual meeting and not have a quorum for other matters. If that occurs, we will proceed with avote only on the matters for which a quorum is present.
4
Abstentions are counted as being present and entitled to vote in determining whether a quorum ispresent. Shares as to which "broker non-votes" exist will be counted as present and entitled tovote in determining whether a quorum is present for any matter requiring the vote of theCommon Stock and Class B Common Stock voting together as a class, but will not be counted aspresent and entitled to vote in determining whether a quorum is present for any matter requiringthe vote of the Common Stock or Class B Common Stock voting separately as a class.
What vote is required to approve each proposal?
Proposal No. 1: Election of Directors. Eight directors are to be elected at our annual meeting. Asrequired by our certificate of incorporation and by-laws:
• One-sixth of our directors (which equates presently to one director) will be elected by theholders of our Common Stock voting separately as a class.
• The remaining seven directors will be elected by the holders of our Common Stock andClass B Common Stock voting together without regard to class.
You can cast your vote “FOR” any or all of the director nominees named on the proxy card or“WITHHOLD” your vote on any or all of the nominees. Please refer to the voter website,www.proxyvote.com, for voting instructions. If you requested a paper copy of the proxy materials,voting instructions are also contained on the proxy card enclosed with those materials.
Directors will be elected by plurality. That means the nominees who receive the greatest numberof properly cast “FOR” votes will be elected.
David L. Shedlarz has been nominated by the Board for election by the holders of our CommonStock voting separately at the 2010 annual meeting. The other director nominees have beennominated for election by the holders of our Common Stock and Class B Common Stock votingtogether. Please go to page 28 for more information about Proposal No. 1.
Proposal No. 2. Holders of record of our Common Stock and Class B Common Stock present (inperson or by proxy) at the annual meeting will approve Proposal No. 2 if they cast more votes infavor of the proposal than against the proposal. We have provided additional information aboutProposal No. 2 in this proxy statement.
How can I vote my shares before the meeting?
You may vote your shares prior to the meeting by following the instructions provided on theNotice of Internet Availability of Proxy Materials, this proxy statement and the voter website,www.proxyvote.com. If you requested a paper copy of the proxy materials, voting instructions arealso contained on the proxy card enclosed with those materials.
• If you are a registered stockholder, there are three ways to vote your shares before themeeting:
By Internet (www.proxyvote.com): Use the Internet to transmit your votinginstructions until 11:59 p.m. EDT on May 3, 2010. Have your Notice of InternetAvailability of Proxy Materials with you when you access the website and follow theinstructions to obtain your records and to create an electronic voting instructionform.
5

By telephone (800-690-6903): Submit your vote by telephone until 11:59 p.m. EDT onMay 3, 2010. Have your Notice of Internet Availability of Proxy Materials or proxycard in hand when you call and then follow the instructions you receive from thetelephone voting site.
By mail: If you requested a paper copy of the proxy materials, mark, sign and datethe proxy card enclosed with those materials and return it in the postage-paidenvelope we have provided. To be valid, proxy cards must be received before the startof the annual meeting. Proxy cards should be returned to The Hershey Company,c/o Broadridge, 51 Mercedes Way, Edgewood, New York 11717.
• If your shares are held in street name, your broker, bank or other holder of record mayprovide you with a Notice of Internet Availability of Proxy Materials. Follow theinstructions on the Notice to access our proxy materials and vote online or to request apaper or email copy of our proxy materials. If you received these materials in paper form,the materials included a voting instruction card so you can instruct your broker, bank orother holder of record how to vote your shares.
Can I vote at the meeting?
If you are a registered stockholder, you can vote at the meeting any shares that were registered inyour name as the stockholder of record as of the record date.
If your shares are held in street name, you are not a holder of record of those shares and cannotvote them at the annual meeting unless you have a legal proxy from the holder of record. If youplan to attend and vote your street-name shares at the annual meeting, you should request a legalproxy from your broker, bank or holder of record and bring it with you to the meeting.
If you plan to vote at the meeting, please pick up a ballot at the registration table upon yourarrival. You may then either deposit your ballot in any of the designated voting boxes locatedinside the meeting room before the meeting begins, or submit your ballot to a meeting usher at thetime designated during the meeting. Ballots will not be distributed during the meeting. Sharesmay not be voted after the polls close.
Whether or not you plan to attend the meeting, we strongly encourage you to vote by proxy priorto the meeting.
Can I revoke my proxy or change my voting instructions once submitted?
If you are a registered stockholder, you can revoke your proxy and change your vote prior to theannual meeting by:
• Sending a written notice of revocation to our Corporate Secretary at 100 Crystal A Drive,Hershey, Pennsylvania 17033 (the notification must be received by the close of businesson May 3, 2010);
• Voting again by Internet or telephone prior to 11:59 p.m. EDT on May 3, 2010 (only thelatest vote you submit will be counted); or
• Submitting a new properly signed and dated paper proxy card with a later date (yourproxy card must be received before the start of the annual meeting).
If your shares are held in street name, you should contact your broker, bank or other holder ofrecord about revoking your voting instructions and changing your vote prior to the meeting.
6
If you are eligible to vote at the annual meeting, you also can revoke your proxy or votinginstructions and change your vote at the annual meeting by submitting a written ballot before thepolls close.
What will happen if I provide my proxy but do not vote on a proposal?
You should provide voting instructions for all proposals appearing on the proxy/voting instructioncard. The persons named as proxies on the proxy card will vote your shares according to yourinstructions. However, if you submit a valid proxy but fail to provide instructions on how youwant your shares to be voted, properly submitted proxies will be voted:
• “FOR” the election of all director nominees; and• “FOR” the ratification of the appointment of KPMG LLP as our independent auditors.
If any other item is properly presented for a vote at the meeting, the shares represented by yourproperly submitted proxy will be voted by the proxies using their own best judgment.
What will happen if I do not provide my proxy or vote my shares in person at theannual meeting?
If you are a registered stockholder, your shares will not be voted.
If your shares are held in street name, your broker, bank or other holder of record might beauthorized to vote your shares on certain “routine” matters. The ratification of independentauditors is currently considered to be a routine matter. On this matter, your broker or nomineecan:
• Vote your street-name shares even though you have not provided voting instructions; or• Choose not to vote your shares.
The election of directors is not routine and cannot be voted without your instructions. When abroker or nominee is unable to vote shares for this reason, it is called a “broker non-vote.”
Are abstentions and broker non-votes counted in the vote totals?
When a stockholder abstains from voting on any proposal (other than the election of directors), theabstention is counted as a vote “AGAINST” the proposal. Broker non-votes are not included invote totals and will not affect the outcome of the vote.
How do I vote if I am a participant in one of the Company’s 401(k) Plans?
If you are a participant in either The Hershey Company 401(k) Plan or The Hershey CompanyPuerto Rico 401(k) Plan, and you meet the vesting requirements of the plan, you may have certainvoting rights regarding shares of our Common Stock credited to your account in the plan. You donot own these shares. They are owned by the trustee.
The plan provides you with voting rights based on the number of shares of Hershey CommonStock that were constructively invested in your plan account as of the close of business on therecord date. We originally contributed these shares to the plan on your behalf as matching orsupplemental retirement contributions. You may vote these shares in much the same way as
7

registered stockholders vote their shares, but you have an earlier deadline. Your vote must bereceived by the trustee by 11:59 p.m. EDT on April 29, 2010. You may vote these shares byfollowing the instructions provided on the Notice of Internet Availability of Proxy Materials andon the voter website, www.proxyvote.com. If you requested a paper copy of the proxy materials,you also may vote by mail by signing, dating and returning the proxy/voting instruction cardincluded with those materials.
By submitting voting instructions, you will direct the plan trustee:
• How to vote the shares of Common Stock allocated to your account in the plan; and• How to vote a portion of the shares of Common Stock allocated to the accounts of other
participants in the plan who have not submitted voting instructions by the deadline.
The plan trustee will submit one proxy to vote all shares of Common Stock in the plan. Thetrustee will vote the shares of participants submitting voting instructions in accordance with theirinstructions and will vote the remaining shares of Common Stock in the plan in the sameproportion as the final votes of all participants who actually voted. Please note that, if you do notsubmit voting instructions for the shares of Common Stock in your account by the voting deadline,those shares will be included with the other undirected shares and voted by the trustee asdescribed above. Because the trustee submits one proxy to vote all shares of Common Stock in theplan, you may not vote plan shares in person at the annual meeting.
How do I vote my shares in the Company’s Automatic Dividend ReinvestmentService Plan?
BNY Mellon Shareowner Services, our transfer agent, has arranged for any shares that you holdin the Automatic Dividend Reinvestment Service Plan to be included in the total registered sharesof Common Stock shown on the Notice of Internet Availability of Proxy Materials or proxy card wehave provided you. By voting these shares, you will also be voting your shares in the AutomaticDividend Reinvestment Service Plan.
Additional Information about the Annual Meeting
Who will pay the cost of soliciting votes for the annual meeting?
We will pay the cost of preparing, assembling and furnishing proxy solicitation and other requiredannual meeting materials. We do not use a third-party solicitor. It is possible that our directors,officers and employees might solicit proxies by mail, telephone, telefax, electronically over theInternet or by personal contact, without receiving additional compensation. We will reimbursebrokers, banks and other nominees, fiduciaries and custodians who nominally hold shares of ourstock as of the record date for the reasonable costs they incur furnishing proxy solicitation andother required annual meeting materials to street-name holders who beneficially own thoseshares on the record date.
What is householding?
The SEC has adopted rules that allow us to send in a single envelope our Notice of InternetAvailability of Proxy Materials or a single copy of our proxy solicitation and other required annualmeeting materials to two or more stockholders sharing the same address. We may do this only ifthe stockholders at that address share the same last name or if we reasonably believe that thestockholders are members of the same family. If we are sending a Notice, the envelope mustcontain a separate Notice for each stockholder at the shared address. Each Notice must also
8
contain a unique control number that each stockholder will use to gain access to our proxymaterials and vote online. If we are mailing a paper copy of our proxy materials, the rules requireus to send each stockholder at the shared address a separate proxy card.
We believe this rule is beneficial to both our stockholders and to us. Our printing and postagecosts are lowered anytime we eliminate duplicate mailings to the same household. However,stockholders at a shared address may revoke their consent to the householding program andreceive their Notice in a separate envelope, or, if they have elected to receive a full copy of ourproxy materials in the mail, receive a separate copy of these materials. If you have elected toreceive paper copies of our proxy materials and want to receive a separate copy of these materialsfor our 2010 annual meeting, please call our Investor Relations Department, toll free, at(800) 539-0261. If you consented to the householding program and wish to revoke your consent forfuture years, simply call, toll free, (800) 542-1061, or write to Broadridge, HouseholdingDepartment, 51 Mercedes Way, Edgewood, New York 11717.
What does it mean if I received more than one Notice or proxy card?
You probably have multiple accounts with us and/or brokers, banks or other nominees. You shouldvote all of the shares represented by these Notices/proxy cards. Certain brokers, banks andnominees have procedures in place to discontinue duplicate mailings upon a stockholder’s request.You should contact your broker, bank or nominee for more information. Additionally, our transferagent, BNY Mellon Shareowner Services, can assist you if you want to consolidate multipleregistered accounts existing in your name. To contact our transfer agent, write to BNY MellonShareowner Services, 480 Washington Boulevard, Jersey City, New Jersey 07310-1900, or call:
• (800) 851-4216 Domestic Holders• (201) 680-6578 Foreign Holders• (800) 231-5469 Domestic TDD line for hearing impaired• (201) 680-6610 Foreign TDD line for hearing impaired
Will you publish the results of voting?
Preliminary results of voting will be announced at the annual meeting. We also will publish votingresults in a current report on Form 8-K that we will file with the SEC within four business daysfollowing the meeting, with the day the meeting ends counted as the first day. If on the date ofthis filing the Inspector of Elections for the annual meeting has not certified the voting results asfinal, we will note in the filing that the results are preliminary and publish the final results in asubsequent Form 8-K filing within four business days after the final voting results are known.The final results also will be posted in the Investor Relations section of the Company’s website,www.hersheys.com, as soon as they are certified by the Inspector of Elections for the annualmeeting. To find the voting results on our website, select “Investor Relations,” then select the“Voting Results” tab located along the left-hand column of the page. Questions also may bedirected to our Investor Relations Department at (800) 539-0261.
GOVERNANCE OF THE COMPANY
What is corporate governance?
Corporate governance is the process by which companies govern themselves.
At The Hershey Company, day-to-day business activities are carried out by our employees underthe direction and supervision of our Chief Executive Officer, or CEO. The Board of Directors
9
oversees these activities. In doing so, each director is required to use his or her business judgmentin the best interests of the Company. The Board’s responsibilities include:
• Review of the Company’s performance, strategies and major decisions;• Oversight of the Company’s compliance with legal and regulatory requirements and the
integrity of its financial statements;• Oversight of management, including review of the CEO’s performance and succession
planning for key management roles; and• Oversight of compensation for the CEO, key executives and the Board, as well as
oversight of compensation policies and programs for all employees.
What principles has the Board established with respect to corporate governance?
The general principles governing the functions of our Board and its committees are contained inthe following documents:
• Corporate Governance Guidelines: Our Corporate Governance Guidelines provide thebasic framework for the Board’s role in the governance of the Company. The guidelinesinclude the Board’s policies regarding director independence, qualifications,responsibilities, access to management and outside advisors, compensation, continuingeducation, oversight of management succession and stockholding requirements. They alsoprovide a process for directors to annually evaluate the performance of the Board. TheCorporate Governance Guidelines were last amended and restated by the Board onFebruary 23, 2010. We have included a copy of the Corporate Governance Guidelines asAppendix A to this proxy statement.
• Board Committee Charters: The Board has adopted a charter for each standingcommittee of the Board — the Audit Committee, the Compensation and ExecutiveOrganization Committee, the Finance and Risk Management Committee, the GovernanceCommittee and the Executive Committee. The charters comply with the requirements ofthe Sarbanes-Oxley Act of 2002, rules of the SEC and listing standards of the New YorkStock Exchange. We believe the charters reflect current best practices in corporategovernance.
• Code of Ethical Business Conduct: The Board has adopted a Code of Ethical BusinessConduct. Adherence to this Code assures that our directors, officers and employees areheld to the highest standards of integrity. The Code covers areas such as conflicts ofinterest, insider trading and compliance with laws and regulations. The Audit Committeeoversees the Company’s communication of, and compliance with, the Code.
You can view the Corporate Governance Guidelines, committee charters and Code of EthicalBusiness Conduct in the Investor Relations section of our website, www.hersheys.com. Once youare in the Investor Relations section, look for the heading “Corporate Governance” in the right-hand column of the page and select the appropriate subheading. We will post amendments to anyof these documents on our website as soon as possible after the effective date of the amendment. Ifany amendment or waiver of the Code of Ethical Business Conduct applies to directors orexecutive officers, our posting will appear within four business days of the amendment or waiver.
What is the composition of the Board and how often are members elected?
There currently are seven members of the Board. Each member’s term will expire at the annualmeeting. As discussed in greater detail beginning on page 28, the Board is recommending that
10

you reelect each of these seven members for an additional one-year term and elect one newmember for an initial one-year term at the annual meeting.
Which directors are independent, and how does the Board make thatdetermination?
The Board determines which of our directors are independent. For a director to be consideredindependent under the listing standards of the New York Stock Exchange, the Board mustaffirmatively determine that the director has no direct or indirect material relationship with TheHershey Company. The Board has adopted categorical standards for independence that the Boarduses when determining which directors are independent. Rather than have one set of standardsfor Board members as a whole and additional standards for Audit Committee members, aspermitted by the New York Stock Exchange, the Board bases its determination of independencefor all directors on the more stringent standards applicable to Audit Committee members. Thesestandards are contained in our Corporate Governance Guidelines. You can review these standardsby turning to page A-2 of Appendix A.
Applying the categorical standards for independence, the listing standards of the New York StockExchange and rules of the SEC, the Board determined that the following directors recommendedfor election at the annual meeting are independent: Pamela M. Arway, Robert F. Cavanaugh,Charles A. Davis, James E. Nevels, Thomas J. Ridge, David L. Shedlarz and LeRoy S.Zimmerman. The Board also determined that Arnold G. Langbo and Charles B. Strauss, directorswho resigned from the Board on August 10, 2009, and Kenneth L. Wolfe, our former non-executiveChairman of the Board who resigned from the Board on February 16, 2009, were independentduring the periods of their respective service in 2009. The Board determined that David J. West,President and Chief Executive Officer of The Hershey Company, is not independent because he isan executive officer of the Company.
The Board determined that Ms. Arway and Mr. Ridge have no relationship with the Companyother than their relationship as director, director nominee and stockholder. Messrs. Cavanaugh,Davis, Nevels, Shedlarz and Zimmerman have certain relationships with the Company, inaddition to being directors and stockholders, that the Board considered but determined ultimatelynot to be material. Messrs. Strauss and Wolfe also had certain immaterial relationships with theCompany during the time they were directors. Mr. Langbo had no relationship with the Companyother than his relationship as a director and stockholder during the time he was a director in2009.
Robert F. Cavanaugh, James E. Nevels and LeRoy S. Zimmerman. Messrs. Cavanaugh, Nevelsand Zimmerman are independent members of the board of directors of Hershey Trust Companyand the board of managers (governing body) of Milton Hershey School. Mr. Cavanaugh wasinitially recommended for nomination to our Board by the Milton Hershey School Trust in 2003.Messrs. Nevels and Zimmerman were initially elected to the Board on November 11, 2007 by theMilton Hershey School Trust acting by written consent. Our Board elected Mr. Nevels thenon-executive Chairman of the Board on February 16, 2009. None of these individuals receive anycompensation from The Hershey Company, from Hershey Trust Company or from Milton HersheySchool other than compensation they receive in the ordinary course as board members of each ofthose entities. We do not expect these individuals to receive other forms of compensation fromthese entities in 2010. Hershey Trust Company and the Milton Hershey School Trust arestockholders of the Company whose holdings are described in greater detail beginning on page 41of this proxy statement. Under SEC rules, Hershey Trust Company, the Milton Hershey SchoolTrust and companies controlled by the Milton Hershey School Trust are considered affiliates ofthe Company. During 2009, we had a number of transactions with the Milton Hershey
11
School Trust and companies owned by the Milton Hershey School Trust involving the purchaseand sale of goods and services in the ordinary course of business. We also leased a facility from theMilton Hershey School Trust in 2009. Messrs. Cavanaugh, Nevels and Zimmerman did notparticipate in Board decisions in connection with these transactions. We have outlined thesetransactions and transactions we contemplate for 2010 in greater detail in the section entitled“Certain Transactions and Relationships,” beginning on page 84 of this proxy statement.
Charles A. Davis. Mr. Davis is a director of AXIS Capital Holdings Limited. During 2009, AXISCapital Holdings Limited provided a portion of our directors’ and officers’ liability insurance andfiduciary liability insurance coverage. This insurance coverage was purchased in the ordinarycourse of our business at market rates. We do not expect this coverage or the amounts ofpayments to change materially during 2010. We also made a $6,000 charitable contribution in2009 to the Stone Point Capital Foundation Charity Golf Tournament. The Stone Point CapitalFoundation is operated by the principals of Stone Point Capital LLC, of which Mr. Davis is ChiefExecutive Officer.
David L. Shedlarz. Mr. Shedlarz is a director of Pitney Bowes Inc. During 2009, we purchased orleased office supplies and equipment such as postage meters and copiers from Pitney Bowes Inc.All purchases and leases were in the ordinary course of our business. We do not expect thesetransactions or amounts of payments to change materially in 2010.
Charles B. Strauss. Mr. Strauss is a director of The Hartford Financial Services Group. TheHartford Financial Services Group provided a portion of our directors’ and officers’ liabilityinsurance coverage through June 30, 2009, when the coverage expired. This insurance coveragewas purchased in the ordinary course of our business at market rates.
Kenneth L. Wolfe. Mr. Wolfe was formerly the Company’s Chairman of the Board and ChiefExecutive Officer. He retired on January 1, 2002. Mr. Wolfe again became a director in November2007 and resigned as non-executive Chairman of the Board in February 2009. As a formerdirector, Mr. Wolfe participates in the Directors’ Charitable Award Program, which is described ingreater detail on page 24 of this proxy statement. As a retiree of the Company, Mr. Wolfe receivesretiree life insurance, paid for by the Company, and he and his wife are covered under a fully-insured Medicare advantage program, the cost of which is shared by the Company and Mr. Wolfe.These programs and benefits are provided solely in connection with Mr. Wolfe’s former service asa director or his retirement and were not conditioned on his service as a director in 2009.
Do our independent directors meet separately in regularly-scheduled executivesessions, and, if so, who presides at those meetings?
Our independent directors meet regularly in executive session at the conclusion of every Boardmeeting, and at other times as the independent directors deem necessary. Each executive sessionis chaired by James E. Nevels, our non-executive Chairman of the Board. In the Chairman’sabsence, executive sessions are chaired by an independent director assigned on a rotating basis.Members of the Audit Committee, Compensation and Executive Organization Committee, Financeand Risk Management Committee and Governance Committee also meet regularly in executivesession at the conclusion of committee meetings. Additional information about executive sessionsis contained in our Corporate Governance Guidelines. To learn more, please turn to page A-5 ofAppendix A.
12
Can I communicate with directors?
You may communicate with our directors in several ways. Communications regarding accounting,internal accounting controls or auditing matters may be addressed to the Audit Committee at thefollowing address:
Audit Committeec/o Corporate SecretaryThe Hershey Company100 Crystal A DriveP. O. Box 810Hershey, PA 17033-0810
You also may email the Audit Committee at [email protected]. Finally, you maysubmit your comments, confidentially and anonymously, if you desire, to the Audit Committee bycalling the Hershey Concern Line at (800) 362-8321 or by accessing the Hershey Concern Linewebsite at www.HersheysConcern.com.
You may contact the independent directors at the following address:
Independent Directorsc/o Corporate SecretaryThe Hershey Company100 Crystal A DriveP. O. Box 810Hershey, PA 17033-0810
You also may email the independent directors at [email protected] or contactthe independent directors using the Hershey Concern Line telephone number or website notedabove.
Under the procedures approved by our Board, the Audit Committee will address communicationsfrom any interested party in accordance with our Board-approved Procedures for Submission andHandling of Complaints Regarding Compliance Matters, which are available for viewing in theInvestor Relations section of our website at www.hersheys.com. Communications to the AuditCommittee and/or our independent directors are processed by the Office of General Counsel. TheOffice of General Counsel reviews and summarizes these communications and provides reports tothe Audit Committee on a periodic basis. Communications regarding any accounting, internalcontrol or auditing matter are reported immediately to the Audit Committee, as are allegationsabout our officers. Solicitations, junk mail and obviously frivolous or inappropriatecommunications are not forwarded to the Audit Committee, but copies are retained and madeavailable to any director who wishes to review them.
How often did the Board meet in 2009?
The Board held six regular meetings and eight special meetings in 2009. Each director attended atleast 84% of all of the meetings of the Board and committees of the Board on which he served(during the period he served) in 2009. Average attendance for all of these meetings equaled 95%.
13
What is the Company’s policy regarding Board members’ attendance at the annualmeeting?
Directors are expected to attend our annual meetings of stockholders. All of the nine directorsstanding for election at our 2009 annual meeting, held on April 30, 2009, were in attendance atthat meeting.
What is the Board’s leadership structure, and why is it the best structure for theCompany at this time?
The Board’s current leadership structure separates the roles of the Chairman of the Board ofDirectors and the Chief Executive Officer. Our non-executive Chairman of the Board presides atall meetings of stockholders and of the Board of Directors, approves the agendas for all Boardmeetings and sees that all orders, resolutions and policies adopted or established by the Board arecarried into effect. The Board has determined that our Chairman is an independent member of theBoard under the listing standards of the New York Stock Exchange and our CorporateGovernance Guidelines. Our Chief Executive Officer manages and directs the day-to-dayoperations of the Company. He also serves as a member of the Board of Directors and is theprimary liaison between the Board and Company management.
Our Board believes that separation of the roles of Chairman and Chief Executive Officer is thebest governance model for the Company at this time. Under this model, our Chairman can devotehis attention to assuring that the Company has the proper governance controls in place, that ourBoard is properly structured from the standpoints of membership, size and diversity, and thatmanagement has the support it needs from the Board to carry out the Company’s strategicpriorities. The Chief Executive Officer, relieved of the duties normally performed by theChairman, is free to focus his entire attention on growing and strengthening the business.
What is the Board’s role in risk oversight?
Our Board takes an active role in risk oversight. Prior to August 2009, the Board delegated to theAudit Committee primary responsibility for oversight of the Company’s risk managementprograms. The Audit Committee would receive reports from management on various risk topics atCommittee meetings throughout the year in accordance with the Committee’s rolling agenda. TheCommittee would then provide reports to the Board on these topics at the Board’s next regularly-scheduled meeting.
In August 2009, the Board established a Finance and Risk Management Committee. This newCommittee was established, in part, to relieve the Audit Committee of some of its substantialworkload and to enhance the Board’s oversight of how senior management manages the materialrisks facing the Company. The Finance and Risk Management Committee is currently overseeingmanagement’s development and implementation of a new enterprise-wide risk managementprogram.
The Finance and Risk Management Committee is composed of independent directors and operatesin accordance with a written charter. The Committee receives regular reports from managementon risk topics pursuant to the Committee’s rolling agenda. Reports are then provided by theCommittee to the Board at the Board’s next regularly-scheduled meeting. The Finance and RiskManagement Committee also meets at least annually with the Audit Committee to discuss theCompany’s risk management programs. The Audit Committee includes a summary of thesediscussions in its report to the Board at the Board’s next regularly-scheduled meeting.
14
In addition, when setting the performance measures and goals for the Company’s incentive plansfor 2010, the Compensation and Executive Organization Committee received management’s viewson whether the incentive plans’ measures or goals may encourage inappropriate risk-taking by theCompany’s officers or employees. Management noted, and the Committee concurred, that theperformance measures and goals were tied to the Company’s strategic objectives, achievablefinancial performance centered on the Company’s publicly-announced financial expectations andadherence with Hershey’s values. As such, the incentive plans were believed not to encouragerisk-taking outside of the range of risks contemplated by the Company’s business plan.
What are the committees of the Board and what are their functions?
The Board has five standing committees: Audit, Compensation and Executive Organization,Finance and Risk Management, Governance, and Executive. The Board also establishes, fromtime to time, committees of limited duration for a special purpose. Our Corporate GovernanceGuidelines require that every member of the Audit Committee, Compensation and ExecutiveOrganization Committee, Finance and Risk Management Committee, and Governance Committeebe independent.
15
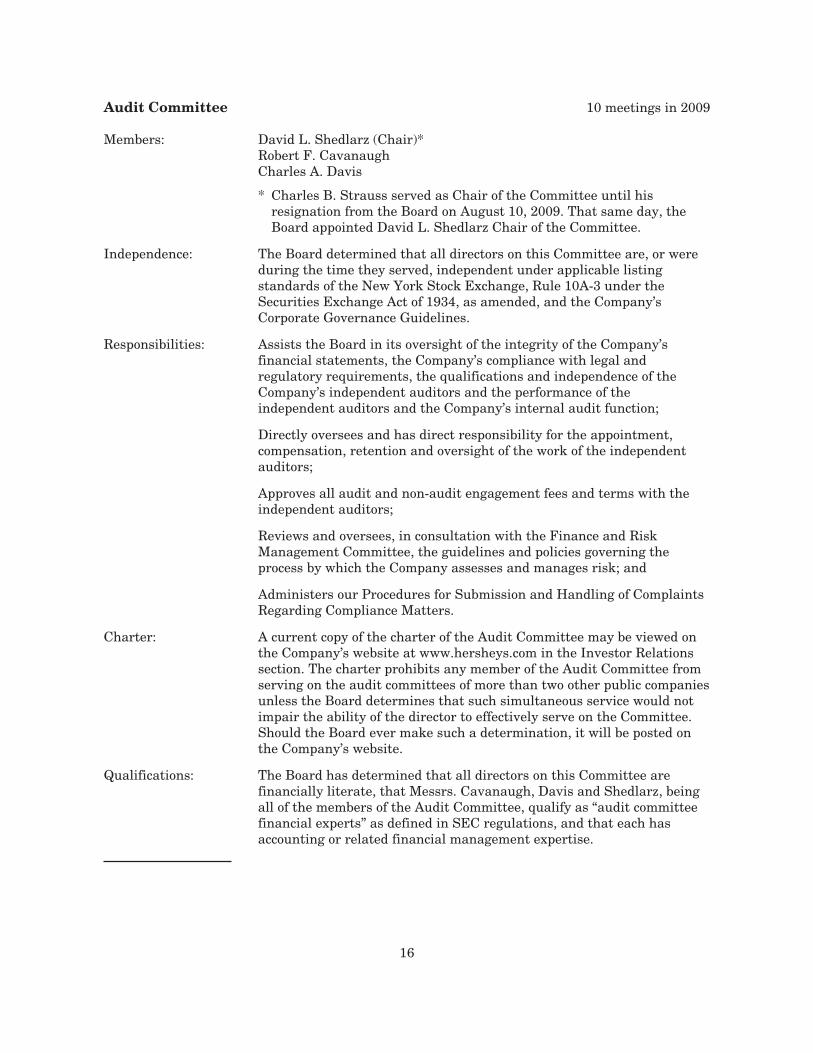
Audit Committee 10 meetings in 2009
Members: David L. Shedlarz (Chair)*Robert F. CavanaughCharles A. Davis
* Charles B. Strauss served as Chair of the Committee until hisresignation from the Board on August 10, 2009. That same day, theBoard appointed David L. Shedlarz Chair of the Committee.
Independence: The Board determined that all directors on this Committee are, or wereduring the time they served, independent under applicable listingstandards of the New York Stock Exchange, Rule 10A-3 under theSecurities Exchange Act of 1934, as amended, and the Company’sCorporate Governance Guidelines.
Responsibilities: Assists the Board in its oversight of the integrity of the Company’sfinancial statements, the Company’s compliance with legal andregulatory requirements, the qualifications and independence of theCompany’s independent auditors and the performance of theindependent auditors and the Company’s internal audit function;
Directly oversees and has direct responsibility for the appointment,compensation, retention and oversight of the work of the independentauditors;
Approves all audit and non-audit engagement fees and terms with theindependent auditors;
Reviews and oversees, in consultation with the Finance and RiskManagement Committee, the guidelines and policies governing theprocess by which the Company assesses and manages risk; and
Administers our Procedures for Submission and Handling of ComplaintsRegarding Compliance Matters.
Charter: A current copy of the charter of the Audit Committee may be viewed onthe Company’s website at www.hersheys.com in the Investor Relationssection. The charter prohibits any member of the Audit Committee fromserving on the audit committees of more than two other public companiesunless the Board determines that such simultaneous service would notimpair the ability of the director to effectively serve on the Committee.Should the Board ever make such a determination, it will be posted onthe Company’s website.
Qualifications: The Board has determined that all directors on this Committee arefinancially literate, that Messrs. Cavanaugh, Davis and Shedlarz, beingall of the members of the Audit Committee, qualify as “audit committeefinancial experts” as defined in SEC regulations, and that each hasaccounting or related financial management expertise.
16
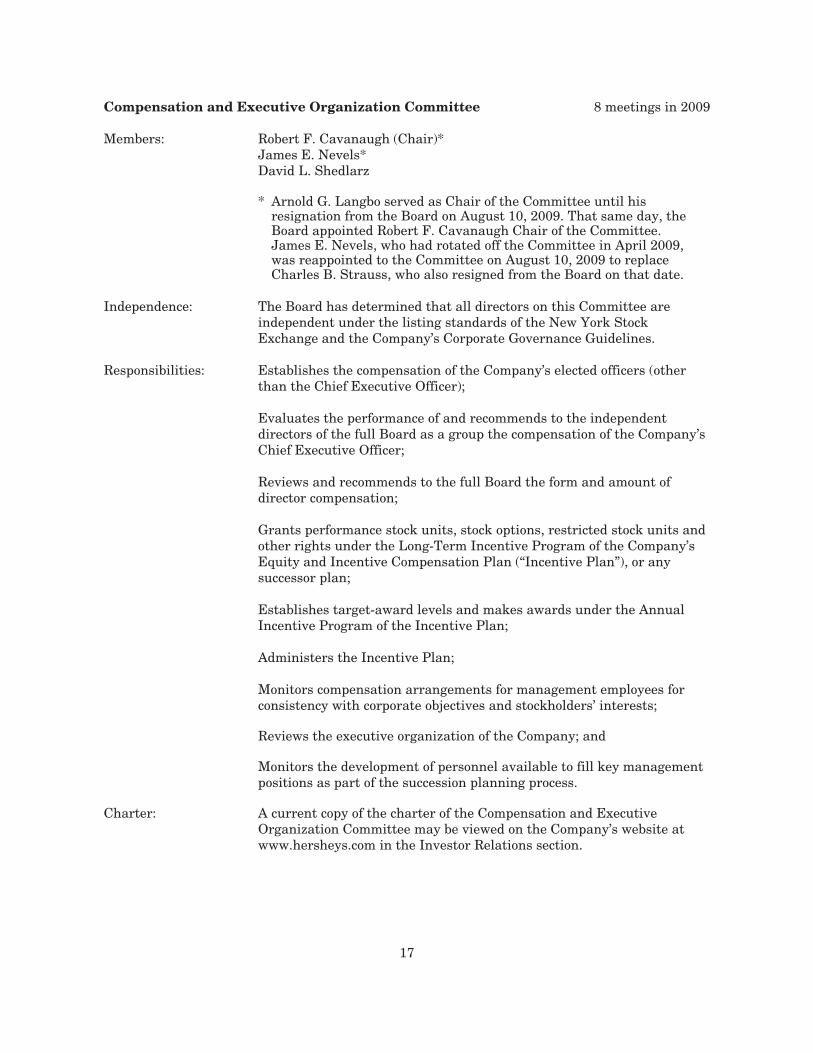
Compensation and Executive Organization Committee 8 meetings in 2009
Members: Robert F. Cavanaugh (Chair)*James E. Nevels*David L. Shedlarz
* Arnold G. Langbo served as Chair of the Committee until hisresignation from the Board on August 10, 2009. That same day, theBoard appointed Robert F. Cavanaugh Chair of the Committee.James E. Nevels, who had rotated off the Committee in April 2009,was reappointed to the Committee on August 10, 2009 to replaceCharles B. Strauss, who also resigned from the Board on that date.
Independence: The Board has determined that all directors on this Committee areindependent under the listing standards of the New York StockExchange and the Company’s Corporate Governance Guidelines.
Responsibilities: Establishes the compensation of the Company’s elected officers (otherthan the Chief Executive Officer);
Evaluates the performance of and recommends to the independentdirectors of the full Board as a group the compensation of the Company’sChief Executive Officer;
Reviews and recommends to the full Board the form and amount ofdirector compensation;
Grants performance stock units, stock options, restricted stock units andother rights under the Long-Term Incentive Program of the Company’sEquity and Incentive Compensation Plan (“Incentive Plan”), or anysuccessor plan;
Establishes target-award levels and makes awards under the AnnualIncentive Program of the Incentive Plan;
Administers the Incentive Plan;
Monitors compensation arrangements for management employees forconsistency with corporate objectives and stockholders’ interests;
Reviews the executive organization of the Company; and
Monitors the development of personnel available to fill key managementpositions as part of the succession planning process.
Charter: A current copy of the charter of the Compensation and ExecutiveOrganization Committee may be viewed on the Company’s website atwww.hersheys.com in the Investor Relations section.
17
The Compensation and Executive Organization Committee recommends or establishes directorand executive officer compensation in accordance with the authority granted by its charter andthe Board-approved compensation plans the Committee oversees. The Committee may delegate itsresponsibilities under limited circumstances to a subcommittee composed only of a subset ofCommittee members. Also, under the terms of the Board- and stockholder-approved IncentivePlan, the Committee is authorized to provide our CEO with limited authority to make stock-basedawards to non-executive employees in connection with recruitment, retention, performancerecognition or promotion. The Incentive Plan does not authorize our CEO to make grants to ourexecutive officers.
The Committee engaged Mercer (US) Inc. (“Mercer”), an executive compensation consultant, toprovide independent assistance to the Committee with respect to the Committee’s developmentand refinement of our compensation policies and the Committee’s assessment of whether ourcompensation programs support our business objectives, are market competitive and are cost-efficient.
Under its engagement letter with the Committee, Mercer has acknowledged that the firm worksfor the Committee while working with management to provide advice, counsel andrecommendations that reinforce the Company’s business strategy, economics, organization andmanagement approach. Mercer has provided and continues to provide services and products to theCompany in addition to its work for the Committee, including services related to globalcompensation studies and surveys for various geographies. During 2009, the fees paid to Mercerfor these additional services were less than $120,000.
Mercer provides the Committee with advice, counsel and recommendations with respect to thecomposition of the peer group and competitive data used for benchmarking our compensationprogram and financial performance. The Committee uses this and other information provided byMercer, along with data supplied by our Chief People Officer and the staff of the Company’sGlobal Total Rewards Department, to reach an independent recommendation regardingcompensation to be paid to our Chief Executive Officer. The Committee’s final recommendation isthen given to the independent directors of our Board for review and final approval.
In establishing compensation levels and awards for executive officers other than our ChiefExecutive Officer, the Committee takes into consideration the recommendations of Mercer and ourChief People Officer, evaluations by our Chief Executive Officer of each officer’s individualperformance and Company performance. The Committee evaluates director compensationprimarily on the basis of peer group data used for benchmarking director compensation providedby Mercer.
Please turn to page 43 for additional information regarding our executive compensation programsand page 23 for information regarding compensation of our directors.
18
Finance and Risk Management Committee 6 meetings in 2009
The Board established the Finance and Risk Management Committee as a standing committee ofthe Board on August 4, 2009.
Members: Charles A. Davis (Chair)Robert F. CavanaughThomas J. RidgeDavid L. Shedlarz
Independence: The Board has determined that all directors on this Committee areindependent under the listing standards of the New York StockExchange and the Company’s Corporate Governance Guidelines.
Responsibilities: Assists the Board in fulfilling its oversight responsibilities relating to theCompany’s management of its assets, liabilities and risks;
Reviews and makes recommendations regarding capital projects,acquisitions and dispositions of assets and changes in capital structure;
Develops and makes recommendations regarding the use of financialinstruments, including derivative instruments, and recommends theterms of the Company’s principal banking relationships, credit facilitiesand commercial paper programs; and
Reviews and oversees, in consultation with the Audit Committee, theguidelines and policies governing the process by which the Companyassesses and manages risk.
Charter: A current copy of the charter of the Finance and Risk ManagementCommittee may be viewed on the Company’s website atwww.hersheys.com in the Investor Relations section.
19
Governance Committee 6 meetings in 2009
Members: James E. Nevels (Chair)*Thomas J. RidgeLeRoy S. Zimmerman
* Kenneth L. Wolfe served as Chair of the Governance Committee untilhis resignation from the Board on February 16, 2009. That same day,the Board appointed James E. Nevels to replace Mr. Wolfe as amember and Chair of the Committee.
Independence: The Board has determined that all directors on this Committee areindependent under the listing standards of the New York StockExchange and the Company’s Corporate Governance Guidelines.
Responsibilities: Reviews and makes recommendations on the composition of the Boardand its committees;
Identifies, evaluates and recommends candidates for election to theBoard consistent with the Board’s membership qualifications;
Reviews and makes recommendations to the full Board on corporategovernance matters, including the Company’s Corporate GovernanceGuidelines;
Administers the Company’s Related Person Transaction Policy asdirected by the Board; and
Evaluates the performance of the full Board, its independent committeesand each director.
Charter: A current copy of the charter of the Governance Committee may beviewed on the Company’s website at www.hersheys.com in the InvestorRelations section.
20
Executive Committee 0 meetings in 2009
Members: James E. Nevels (Chair)*Robert F. Cavanaugh*Charles A. Davis*David L. Shedlarz*LeRoy S. Zimmerman
* Kenneth L. Wolfe served as Chair of the Executive Committee until hisresignation from the Board on February 16, 2009. As required by ourCorporate Governance Guidelines in effect at that time, James E.Nevels assumed the role of Chair of the Executive Committee when hereplaced Mr. Wolfe as Chair of the Governance Committee onFebruary 16, 2009. Robert F. Cavanaugh replaced Arnold G. Langboand David L. Shedlarz replaced Charles B. Strauss on this Committeefollowing the resignations of Messrs. Langbo and Strauss from theBoard on August 10, 2009 and upon the appointment that same day ofMr. Cavanaugh as Chair of the Compensation and ExecutiveOrganization Committee and Mr. Shedlarz as Chair of the AuditCommittee. Charles A. Davis became a member of this Committee onAugust 4, 2009 when he was appointed Chair of the Finance and RiskManagement Committee.
Responsibilities: Manages the business and affairs of the Company, to the extentpermitted by the Delaware General Corporation Law, when the Board isnot in session.
A subcommittee consisting of the independent directors on thisCommittee who are not affiliated with Hershey Trust Company, HersheyEntertainment & Resorts Company and/or Milton Hershey School, or anysubsidiary, division or affiliate of any of the foregoing, reviews andapproves in advance any transaction not in the ordinary course ofbusiness between the Company and any of these entities, unless theBoard or Corporate Governance Guidelines specify a different approvalprocess. Currently, our Corporate Governance Guidelines provide thatsuch transactions will be reviewed and approved in advance by a specialcommittee consisting of the directors elected by the holders of ourCommon Stock voting separately, and only in the absence of suchdirectors will the subcommittee of this Committee approve suchtransactions. For more information regarding the review, approval orratification of transactions involving the Company and these entities,please refer to the section entitled Certain Transactions andRelationships beginning on page 84.
Charter: A current copy of the charter of the Executive Committee may be viewedon the Company’s website at www.hersheys.com in the InvestorRelations section.
How are nominees for the Board selected?
The Governance Committee is responsible for identifying and recommending to the Boardcandidates for Board membership. The Milton Hershey School Trust, our controlling stockholder,
21
also may from time to time recommend to the Governance Committee, or elect outright,individuals to serve on our Board.
The Governance Committee considers recommendations from directors, stockholders (includingthe Milton Hershey School Trust) or other sources. Occasionally, the Governance Committeeengages a paid third-party consultant to assist it in identifying and evaluating directorcandidates. The Governance Committee has sole authority under its charter to retain, compensateand terminate these consultants. The Governance Committee’s general policy is to have allmembers of the Committee interview prospective candidates before their nominations areapproved by the Committee and recommended to the full Board.
Our Corporate Governance Guidelines describe the experience, qualifications, attributes andskills sought by the Board of any Board nominee. Generally, the Board seeks individuals withskills and backgrounds that will complement those of other directors and maximize the diversityand effectiveness of the Board as a whole.
In reviewing the qualifications of prospective directors, the Board considers factors it deemsappropriate, including the candidate’s:
• Integrity;• Judgment;• Skill;• Diversity;• Ability to express informed, useful and constructive views;• Experience with businesses and other organizations of comparable size;• Ability to commit the time necessary to learn our business and to prepare for and
participate actively in committee meetings and in Board meetings;• Experience and how it relates to the experience of the other Board members; and• Overall desirability as an addition to the Board and its committees.
The Board seeks individuals having knowledge and experience in such disciplines as finance,international business, marketing, information technology, human resources and consumerproducts. The Board also seeks individuals who bring unique and varied perspectives and lifeexperiences to the Board. As such, the Governance Committee assists the Board by recommendingprospective director candidates who will enhance the overall diversity of the Board. The Boardviews diversity broadly, taking into consideration the age, professional experience, race,education, gender and other attributes of its members. Our Chairman has stated publicly that oneof his current goals is to increase the representation of women on our Board. As an initial step inthis process, Pamela M. Arway, a highly-qualified candidate whose biography appears on page 28,has been nominated for election as a new director at this year’s annual meeting.
The Governance Committee does not distinguish between nominees recommended by stockholdersand other nominees. However, stockholders desiring to nominate a director candidate at theannual meeting must comply with certain procedures. We explained the procedures fornominating a director candidate at this year’s annual meeting in our 2009 proxy statement. If youare a stockholder and desire to nominate a director candidate at next year’s annual meeting, youmust comply with the procedures for nomination set forth in the section entitled “InformationAbout the 2011 Annual Meeting,” beginning on page 87.
22
Does the Board impose a maximum age limit for directors?
Our Corporate Governance Guidelines provide that directors will not be nominated for reelectionafter their 72nd birthday. All of the directors standing for election at the 2010 annual meeting ofstockholders, with the exception of Mr. Zimmerman, satisfied the applicable age requirement atthe time of their nomination. In the case of Mr. Zimmerman, the Board elected to waive thisrequirement and nominated him to stand for election at the 2010 annual meeting for anadditional one-year term.
DIRECTOR COMPENSATION
How are directors compensated?
The Company maintains a Directors’ Compensation Plan designed to:
• Attract and retain highly-qualified non-employee directors; and• Align the interests of non-employee directors with those of our stockholders by paying
a portion of their compensation in units representing shares of our Common Stock.
Directors who are employees of the Company receive no additional compensation for their serviceon our Board. Mr. West, our President and Chief Executive Officer, is the only employee of theCompany who also served as a director and thus received no additional compensation for hisBoard service in 2009.
The Board targets non-employee director compensation at the 50th percentile of compensation paidto directors at a peer group of 14 food, beverage and consumer products companies representingour most direct competitors for director and executive talent. Information about this peer group isincluded in the Compensation Discussion and Analysis beginning on page 43. Each year, with theassistance of the Compensation and Executive Organization Committee and the Committee’scompensation consultant, the Board reviews the compensation paid to directors at thesecompanies and establishes its compensation in accordance with its target.
As a result of its review in December 2008, the Board elected to keep the compensation of ournon-employee directors in 2009 at the level paid in 2008, as follows:
• Annual retainer $ 80,000• Annual retainer for non-executive Chairman of the Board $180,000• Annual restricted stock unit award $120,000• Annual fee for chairs of the Audit Committee, Compensation and
Executive Organization Committee and Governance Committee$10,000
On August 4, 2009, the Board approved the establishment of a Finance and Risk ManagementCommittee and, accordingly, the Chair of that Committee became eligible for payment of anannual committee chair fee of $10,000. For 2009, that fee was pro-rated to reflect the portion ofthe year the Committee was in existence.
Annual Retainer and Committee Chair Fees
Non-employee directors may elect to receive all or a portion of the annual retainer in cash orCommon Stock. Non-employee directors also may elect to defer receipt of the retainer or
23
committee chair fees until the date their membership on the Board ends. Committee chair feesthat are not deferred are paid only in cash. Non-employee directors desiring to defer some or all ofthe retainer or committee chair fees may invest the deferred amounts in two ways:
• In a cash account that values the performance of the investment based upon theperformance of one or more third-party investment funds, as selected by the director.These investment funds were selected from the mutual funds or other investment optionsavailable to all employees participating in our 401(k) Plan. Amounts invested in the cashaccount are paid only in cash.
• In a deferred common stock unit account that we value according to the performance ofour Common Stock, including reinvested dividends. Amounts invested in the deferredcommon stock unit account are paid in shares of Common Stock.
Restricted Stock Units
Restricted stock units, or RSUs, were granted quarterly to non-employee directors on the firstday of January, April, July and October 2009. The number of RSUs granted in each quarterwas determined by dividing $30,000 by the average closing price of a share of our CommonStock on the New York Stock Exchange on the last three trading days preceding the grant date.RSUs awarded to non-employee directors vest one year after the date of grant, or earlier, upontermination of the director’s membership on the Board by reason of retirement (termination ofservice from the Board after the director’s 60th birthday), death or disability, for any reason after achange in control, or such other circumstances as the Board may determine. Once vested, RSUsare paid to directors only in shares of Common Stock or, at the option of the director, deferred ascommon stock units under the Directors’ Compensation Plan until the director’s membership onthe Board ends. Dividend equivalent units are credited at regular rates on the RSUs during therestriction period and, upon vesting of the RSUs, are paid currently in shares of Common Stock ordeferred as common stock units together with RSUs the director has deferred. As of March 8,2010, all of the non-employee directors, except Messrs. Cavanaugh and Nevels, had attainedretirement age for purposes of the vesting of RSUs.
Other Compensation, Reimbursements and Programs
The Board occasionally establishes committees of limited duration for special purposes. The Boardwill consider paying additional compensation to non-employee directors who serve on specialcommittees, generally $1,250 per meeting, if the special committee holds six or more meetings,each lasting one hour or more. No director received compensation for service on a specialcommittee in 2009.
Prior to 1997, directors participated in our Directors’ Charitable Award Program. No directorshave been added to the program since 1996 and our obligations under the program were notaffected by the service of any director during 2009. Under the program, upon the participatingdirector’s death, the Company makes a charitable gift to an educational institution designated bythe director. The amount of the donation varies, depending upon the director’s length of service,with a maximum donation of $1 million after five years of service. As of December 31, 2009, therewere 17 former directors who participated in the program for whom we are committed to makecharitable contributions aggregating $16.8 million. No current director participates in thisprogram.
We reimburse our directors for travel and other out-of-pocket expenses they incur when attendingBoard and committee meetings and for minor incidental expenses they incur when performingdirectors’ services. We also provide reimbursement for at least one director continuing education
24
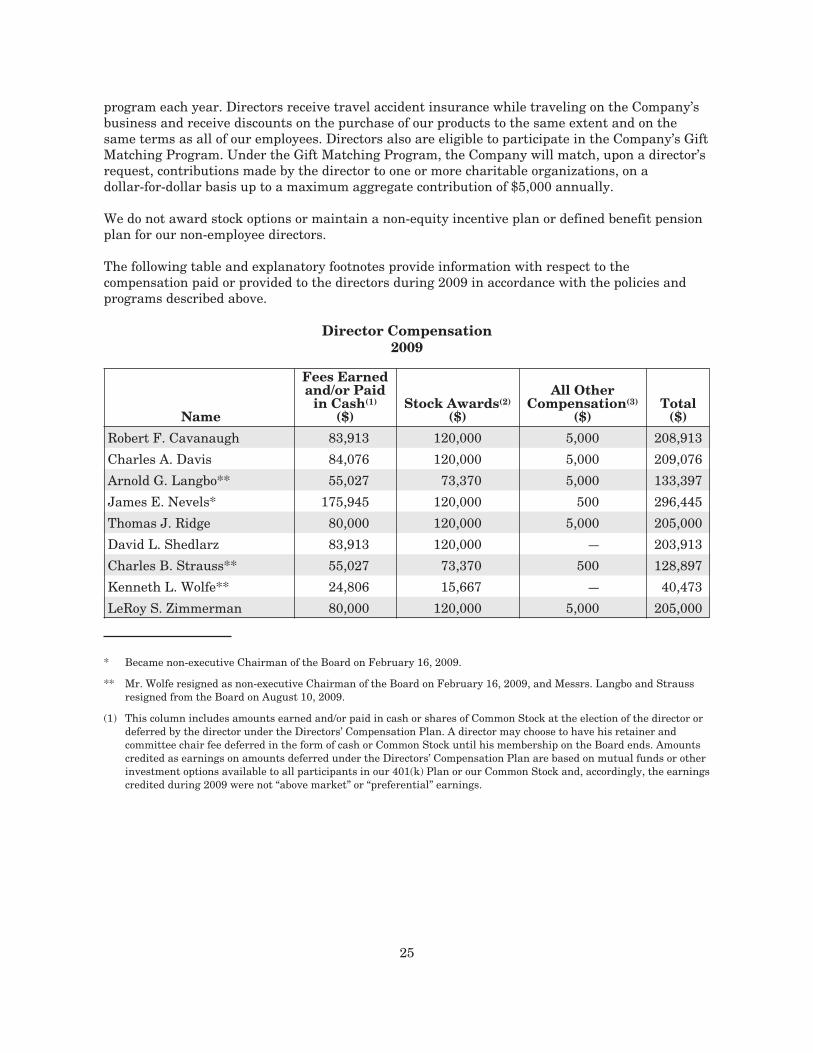
program each year. Directors receive travel accident insurance while traveling on the Company’sbusiness and receive discounts on the purchase of our products to the same extent and on thesame terms as all of our employees. Directors also are eligible to participate in the Company’s GiftMatching Program. Under the Gift Matching Program, the Company will match, upon a director’srequest, contributions made by the director to one or more charitable organizations, on adollar-for-dollar basis up to a maximum aggregate contribution of $5,000 annually.
We do not award stock options or maintain a non-equity incentive plan or defined benefit pensionplan for our non-employee directors.
The following table and explanatory footnotes provide information with respect to thecompensation paid or provided to the directors during 2009 in accordance with the policies andprograms described above.
Director Compensation2009
Name
Fees Earnedand/or Paid
in Cash(1)
($)Stock Awards(2)
($)
All OtherCompensation(3)
($)Total
($)
Robert F. Cavanaugh 83,913 120,000 5,000 208,913
Charles A. Davis 84,076 120,000 5,000 209,076
Arnold G. Langbo** 55,027 73,370 5,000 133,397
James E. Nevels* 175,945 120,000 500 296,445
Thomas J. Ridge 80,000 120,000 5,000 205,000
David L. Shedlarz 83,913 120,000 — 203,913
Charles B. Strauss** 55,027 73,370 500 128,897
Kenneth L. Wolfe** 24,806 15,667 — 40,473
LeRoy S. Zimmerman 80,000 120,000 5,000 205,000
* Became non-executive Chairman of the Board on February 16, 2009.
** Mr. Wolfe resigned as non-executive Chairman of the Board on February 16, 2009, and Messrs. Langbo and Straussresigned from the Board on August 10, 2009.
(1) This column includes amounts earned and/or paid in cash or shares of Common Stock at the election of the director ordeferred by the director under the Directors’ Compensation Plan. A director may choose to have his retainer andcommittee chair fee deferred in the form of cash or Common Stock until his membership on the Board ends. Amountscredited as earnings on amounts deferred under the Directors’ Compensation Plan are based on mutual funds or otherinvestment options available to all participants in our 401(k) Plan or our Common Stock and, accordingly, the earningscredited during 2009 were not “above market” or “preferential” earnings.
25
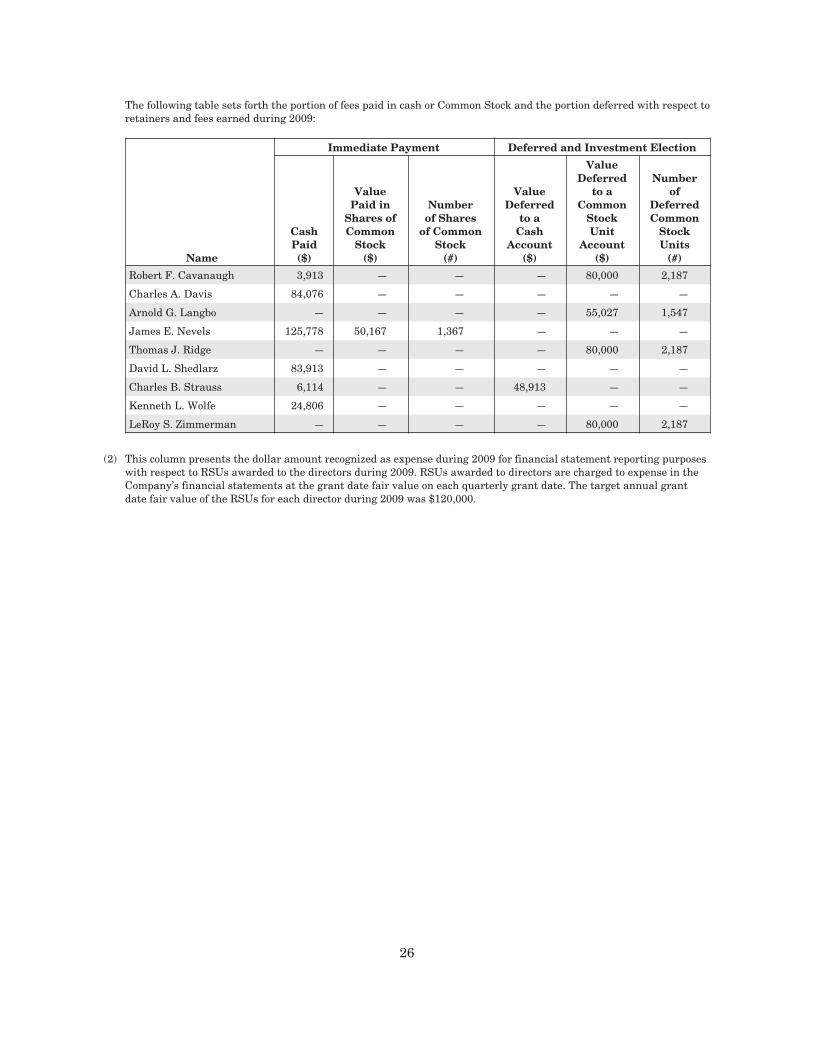
The following table sets forth the portion of fees paid in cash or Common Stock and the portion deferred with respect toretainers and fees earned during 2009:
Immediate Payment Deferred and Investment Election
Name
CashPaid($)
ValuePaid in
Shares ofCommon
Stock($)
Numberof Shares
of CommonStock
(#)
ValueDeferred
to aCash
Account($)
ValueDeferred
to aCommon
StockUnit
Account($)
Numberof
DeferredCommon
StockUnits
(#)
Robert F. Cavanaugh 3,913 — — — 80,000 2,187
Charles A. Davis 84,076 — — — — —
Arnold G. Langbo — — — — 55,027 1,547
James E. Nevels 125,778 50,167 1,367 — — —
Thomas J. Ridge — — — — 80,000 2,187
David L. Shedlarz 83,913 — — — — —
Charles B. Strauss 6,114 — — 48,913 — —
Kenneth L. Wolfe 24,806 — — — — —
LeRoy S. Zimmerman — — — — 80,000 2,187
(2) This column presents the dollar amount recognized as expense during 2009 for financial statement reporting purposeswith respect to RSUs awarded to the directors during 2009. RSUs awarded to directors are charged to expense in theCompany’s financial statements at the grant date fair value on each quarterly grant date. The target annual grantdate fair value of the RSUs for each director during 2009 was $120,000.
26
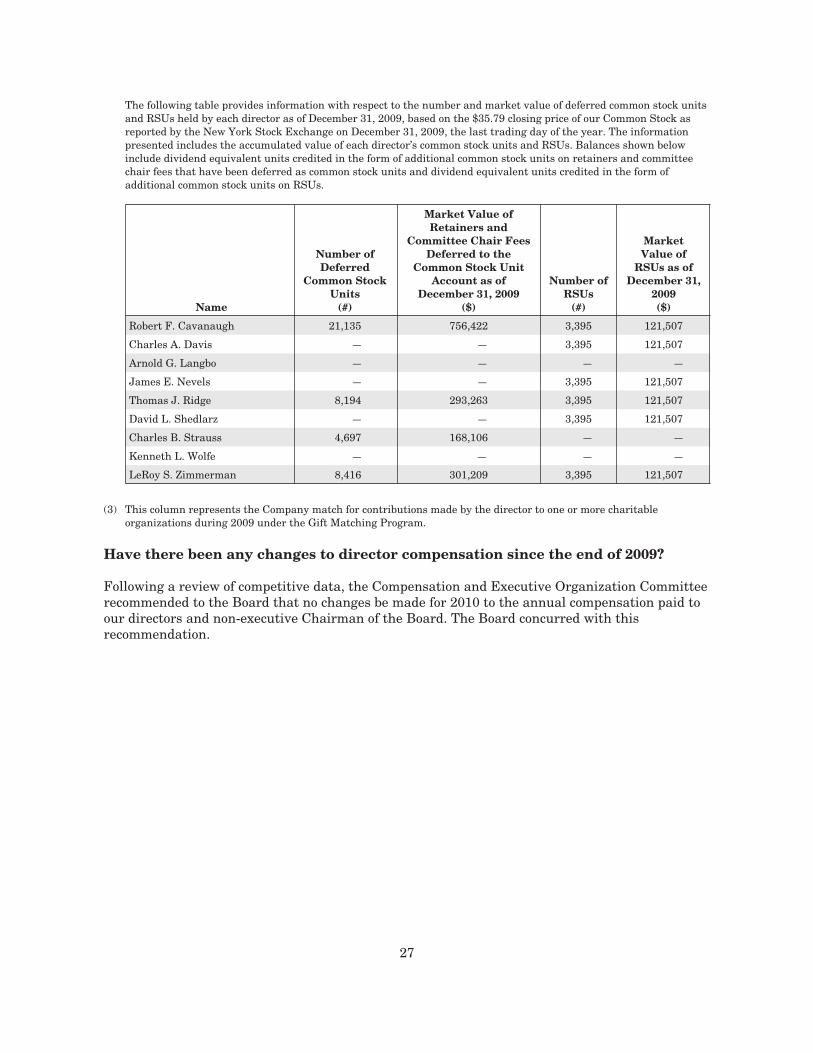
The following table provides information with respect to the number and market value of deferred common stock unitsand RSUs held by each director as of December 31, 2009, based on the $35.79 closing price of our Common Stock asreported by the New York Stock Exchange on December 31, 2009, the last trading day of the year. The informationpresented includes the accumulated value of each director’s common stock units and RSUs. Balances shown belowinclude dividend equivalent units credited in the form of additional common stock units on retainers and committeechair fees that have been deferred as common stock units and dividend equivalent units credited in the form ofadditional common stock units on RSUs.
Name
Number ofDeferred
Common StockUnits
(#)
Market Value ofRetainers and
Committee Chair FeesDeferred to the
Common Stock UnitAccount as of
December 31, 2009($)
Number ofRSUs
(#)
MarketValue of
RSUs as ofDecember 31,
2009($)
Robert F. Cavanaugh 21,135 756,422 3,395 121,507
Charles A. Davis — — 3,395 121,507
Arnold G. Langbo — — — —
James E. Nevels — — 3,395 121,507
Thomas J. Ridge 8,194 293,263 3,395 121,507
David L. Shedlarz — — 3,395 121,507
Charles B. Strauss 4,697 168,106 — —
Kenneth L. Wolfe — — — —
LeRoy S. Zimmerman 8,416 301,209 3,395 121,507
(3) This column represents the Company match for contributions made by the director to one or more charitableorganizations during 2009 under the Gift Matching Program.
Have there been any changes to director compensation since the end of 2009?
Following a review of competitive data, the Compensation and Executive Organization Committeerecommended to the Board that no changes be made for 2010 to the annual compensation paid toour directors and non-executive Chairman of the Board. The Board concurred with thisrecommendation.
27

PROPOSAL NO. 1 – ELECTION OF DIRECTORS
How many directors are standing for election?
Eight directors are to be elected at the annual meeting. Each director is expected to serve untilthe next annual meeting and until his or her successor has been elected and qualified.
Which of the nominees currently serve on the Board?
Seven of the nominees are currently members of the Board. Nominee Pamela M. Arway is standingfor election by the stockholders for the first time at the 2010 annual meeting. Our Board nominatedMs. Arway to be a director upon the recommendation of the Governance Committee. She wasrecommended to the Governance Committee by a third-party consultant retained by the Committee.
What happens if a nominee becomes unavailable for election?
If a nominee becomes unavailable for election for any reason, the proxies will have discretionaryauthority to vote for a substitute.
Who are the nominees?
The Board unanimously recommends the following nominees for election at the annual meeting.These nominees were recommended to the Board by the Governance Committee. In making itsrecommendation, the Governance Committee considered the experience, qualifications, attributesand skills of each nominee as set forth in the biographies below. In the case of directors standingfor reelection, the Governance Committee also reviewed each director’s past performance on ourBoard, as reflected in the Committee’s annual evaluation of Board and individual directorperformance. This evaluation considers, among other things, each director’s individualcontributions to the Board, the director’s ability to work collaboratively with other directors andthe effectiveness of the Board as a whole.
PAMELA M. ARWAY, age 56, has been nominated for election as a newHershey director at the annual meeting. If elected, she will serve on the AuditCommittee and the Compensation and Executive Organization Committee.Ms. Arway retired in October 2008 as Senior Advisor to the Chairman andChief Executive Officer of American Express Company, Inc., New York, NewYork, a global payments, network and travel company. She held that positionduring 2008 until her retirement. From October 2005 to January 2008, shewas President, Japan/Asia Pacific/Australia Region, American ExpressInternational, Inc., Singapore; from December 2004 to October 2005, she wasChief Executive Officer, American Express Australia Ltd., Sydney, Australia;and from July 2000 to December 2004 she was Executive Vice President andGeneral Manager, Corporate Travel North America, American ExpressCompany, Inc. Throughout her twenty-one year career with American ExpressCompany, Inc., Ms. Arway gained experience in the areas of finance,marketing, international business, government affairs, consumer productsand human resources. She has been a director of DaVita, Inc., since July 2009.Ms. Arway holds a bachelor’s degree in languages from Memorial Universityof Newfoundland and a Masters of Business Administration degree inmarketing from Queen’s University, Kingston, Ontario.
28

ROBERT F. CAVANAUGH, age 51, has been a Hershey director sinceOctober 2003. He chairs the Compensation and Executive OrganizationCommittee and is a member of the Audit Committee, the Finance and RiskManagement Committee and the Executive Committee. Mr. Cavanaugh is adirector of Hershey Trust Company and the board of managers of MiltonHershey School. He is one of three representatives of the Milton HersheySchool Trust serving on our Board. Mr. Cavanaugh, a 1977 graduate of MiltonHershey School, brings unique perspectives to our Board not only as arepresentative of our largest stockholder, but also of the school that is its solebeneficiary. Mr. Cavanaugh is Managing Director of DLJ Real Estate CapitalPartners, Los Angeles, California, a subsidiary of Credit Suisse, a leadingglobal banking firm. He has held that position since October 1999. Prior tojoining DLJ Real Estate Capital Partners, Mr. Cavanaugh held positions withDeutsche Banc Alex Brown (where he founded and oversaw that firm’s realestate investment banking effort on the West Coast), Goldman Sachs and Co.and LaSalle Partners. He has experience in investment banking, finance, realestate and risk management and qualifies as an audit committee financialexpert. Mr. Cavanaugh holds a bachelor’s degree, cum laude, in economicsfrom the Wharton School of the University of Pennsylvania and a Masters ofBusiness Administration degree from Harvard Business School.
CHARLES A. DAVIS, age 61, has been a Hershey director since November2007. He chairs the Finance and Risk Management Committee and is amember of the Audit Committee and the Executive Committee. Mr. Davis isChief Executive Officer of Stone Point Capital LLC, Greenwich, Connecticut, aglobal private equity firm. Mr. Davis has held that position since June 2005when the firm was established. Prior to that, Mr. Davis was with MMCCapital, Inc., the private equity business of Marsh & McLennan Companies,Inc., serving as President from April 1998 to December 2002, Chief ExecutiveOfficer from January 1999 to May 2005 and Chairman from January 2002 toMay 2005. He also served as a Vice Chairman of Marsh & McLennanCompanies, Inc., a global professional services firm and the parent of MMCCapital, Inc., from September 1999 to May 2005. Prior to joining MMCCapital, Inc. in 1998, Mr. Davis was with Goldman, Sachs & Co. for twenty-three years where he served as head of Investment Banking Servicesworldwide, co-head of the Americas Group, head of the Financial ServicesIndustry Group, a member of the International Executive Committee and aGeneral Partner. He has experience in finance, investment banking,international business and real estate, in addition to having experience as achief executive officer, and qualifies as an audit committee financial expert.Mr. Davis has been a director of AXIS Capital Holdings Limited sinceNovember 2001 and a director of The Progressive Corporation since October1996. Mr. Davis was formerly a director of Merchants Bancshares, Inc., fromJune 1985 to February 2008. Mr. Davis holds a bachelor’s degree from theUniversity of Vermont and a Masters of Business Administration degree fromColumbia University Graduate School of Business.
29

JAMES E. NEVELS, age 58, has been a Hershey director since 2007. He chairsthe Governance Committee and the Executive Committee and is a member of theCompensation and Executive Organization Committee. Mr. Nevels was electedthe non-executive Chairman of the Board of Directors of The Hershey Companyeffective February 16, 2009. Mr. Nevels is a director of Hershey Trust Companyand the board of managers of Milton Hershey School. He is one of threerepresentatives of the Milton Hershey School Trust serving on our Board. Inaddition to bringing to our Board the perspectives of the Milton Hershey SchoolTrust, Mr. Nevels has extensive finance and leadership experience. He isChairman of The Swarthmore Group, Philadelphia, Pennsylvania, a minority-owned investment-advisory firm, which he founded in 1991. In 2004, he wasappointed by the President of the United States to the Advisory Committee to thePension Benefit Guaranty Corporation, where he served a three-year term. In2001, he was appointed by the Governor of Pennsylvania as Chairman of thePhiladelphia School Reform Commission overseeing the turnaround of thePhiladelphia School System, the eighth largest school district in the UnitedStates. Recently, he was appointed by the Federal Reserve Board of Governors toa two-year term on the board of directors of the Federal Reserve Bank ofPhiladelphia, beginning January 1, 2010. Mr. Nevels has been a director of TastyBaking Company since May 2005. He holds a bachelor’s degree, cum laude andPhi Beta Kappa, in political science and philosophy from Bucknell University, aMasters of Business Administration degree from the Wharton School of theUniversity of Pennsylvania and a Juris Doctor degree from University ofPennsylvania Law School.
THOMAS J. RIDGE, age 64, has been a Hershey director since November 2007and is a member of the Finance and Risk Management Committee and theGovernance Committee. Mr. Ridge is President and Chief Executive Officer ofRidge Global, LLC, Washington, D.C., a global strategic consulting company. Hehas held that position since July 2006. From April 2005 to July 2006, he wasPresident and Chief Executive Officer of Thomas Ridge LLC. From October 2001to February 2005, Mr. Ridge was Secretary of the U.S. Department of HomelandSecurity. Prior to his service as Secretary of Homeland Security, he was Governorof Pennsylvania from 1995 to 2001. Mr. Ridge’s background and experience haveprepared him well for membership on our Board. As President and ChiefExecutive Officer of Ridge Global, he leads a team of international experts thathelps businesses and governments address issues such as risk management,global trade security, technology integration and crisis management. As twice-elected Governor of Pennsylvania, he earned a reputation for high standards andresults and championed issues such as health care and the environment. AsSecretary of the Department of Homeland Security, he formed a new agency from22 agencies employing more than 180,000 employees. Mr. Ridge has been adirector of Exelon Corporation since May 2005, a director of Vonage since August2005 and a director of Brightpoint Inc. since September 2009. He served as adirector of Home Depot, Inc. from May 2005 to May 2007. Mr. Ridge holds abachelor’s degree, cum laude, from Harvard University and a Juris Doctor degreefrom The Dickinson School of Law.
30

DAVID L. SHEDLARZ, age 61, has been a Hershey director since August2008. He chairs the Audit Committee and is a member of the Compensationand Executive Organization Committee, the Finance and Risk ManagementCommittee and the Executive Committee. He has been nominated forelection by the holders of the Common Stock voting separately as a class.Mr. Shedlarz retired in December 2007 as Vice Chairman of Pfizer Inc., NewYork, New York, a pharmaceutical, consumer and animal products healthcompany. He held that position from July 2005. From January 1999 to July2005, he was Pfizer’s Executive Vice President and Chief Financial Officer.Mr. Shedlarz spent the majority of his professional career with Pfizer, Inc.At the time of his retirement in 2007, Mr. Shedlarz was responsible foroperations including animal health business, finance, accounting, strategicplanning, business development, global sourcing, manufacturing,information systems and human resources. During his time at Pfizer,Mr. Shedlarz also gained extensive experience in international business. Hequalifies as an audit committee financial expert. Mr. Shedlarz has been adirector of Pitney Bowes, Inc. since May 2001 and a member of the TeachersInsurance and Annuity Association Board of Trustees since March 2007. Mr.Shedlarz holds a bachelor’s degree in economics and mathematics fromOakland/Michigan State University and a Masters of BusinessAdministration degree in finance and accounting from the New YorkUniversity, Leonard N. Stern School of Business.
DAVID J. WEST, age 46, has been a Hershey director since October 2007and was elected President and Chief Executive Officer of The HersheyCompany, effective December 1, 2007. From October to November 2007, hewas President of the Company; from January until October 2007, he wasExecutive Vice President, Chief Operating Officer; from January 2005 toJanuary 2007, he was Senior Vice President, Chief Financial Officer and hecontinued to hold the position of Chief Financial Officer until July 2007when his successor to that position was elected. He was Senior VicePresident, Chief Customer Officer from June 2004 to January 2005 and wasSenior Vice President, Sales from December 2002 to June 2004. As ourPresident and Chief Executive Officer, Mr. West has a thorough andcomprehensive knowledge of all aspects of the Company’s business. Duringhis time at Hershey, Mr. West has held leadership roles in many key areasof the business. He has extensive experience in finance, sales and marketingand has the benefit of having served as both a Chief Executive Officer andChief Financial Officer of the Company. Prior to joining Hershey, Mr. Westserved as Senior Vice President, Chief Financial Officer, Nabisco Biscuit andSnacks Group, with responsibility for leading the financial function of KraftFoods’ biscuits, confections and snacks businesses. Mr. West has been adirector of Tasty Baking Company since December 2003. He holds abachelor’s degree, cum laude, in business administration from BucknellUniversity.
31
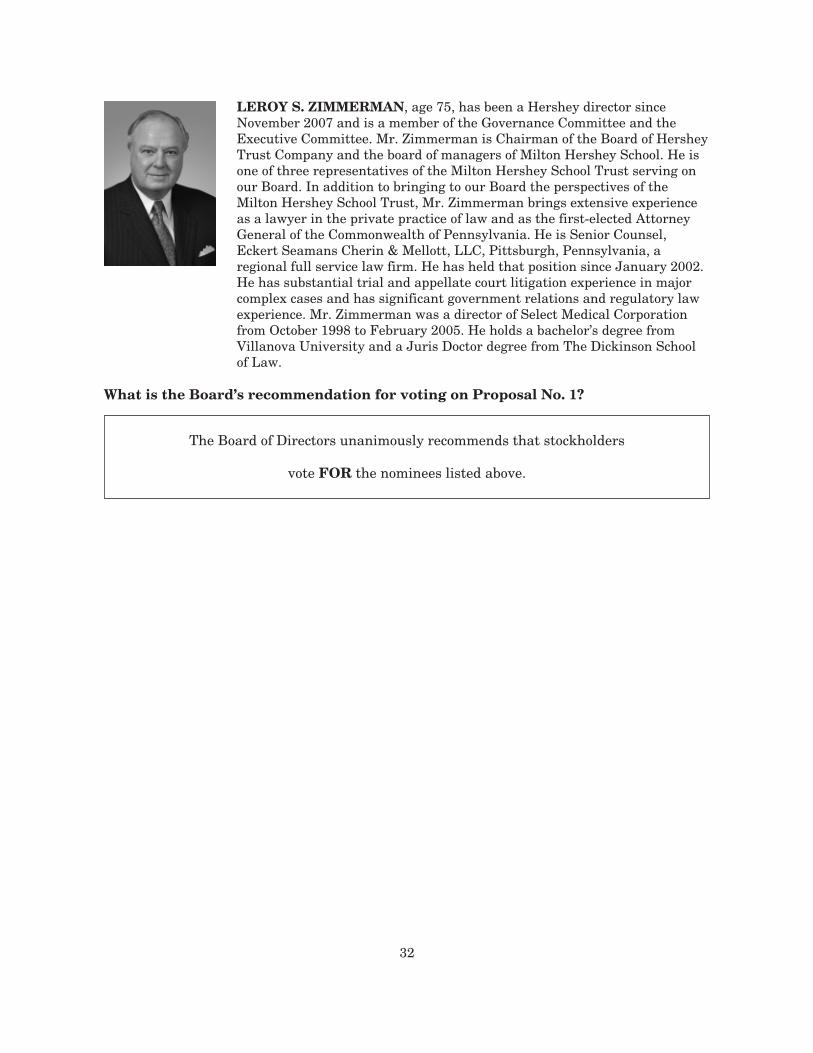
LEROY S. ZIMMERMAN, age 75, has been a Hershey director sinceNovember 2007 and is a member of the Governance Committee and theExecutive Committee. Mr. Zimmerman is Chairman of the Board of HersheyTrust Company and the board of managers of Milton Hershey School. He isone of three representatives of the Milton Hershey School Trust serving onour Board. In addition to bringing to our Board the perspectives of theMilton Hershey School Trust, Mr. Zimmerman brings extensive experienceas a lawyer in the private practice of law and as the first-elected AttorneyGeneral of the Commonwealth of Pennsylvania. He is Senior Counsel,Eckert Seamans Cherin & Mellott, LLC, Pittsburgh, Pennsylvania, aregional full service law firm. He has held that position since January 2002.He has substantial trial and appellate court litigation experience in majorcomplex cases and has significant government relations and regulatory lawexperience. Mr. Zimmerman was a director of Select Medical Corporationfrom October 1998 to February 2005. He holds a bachelor’s degree fromVillanova University and a Juris Doctor degree from The Dickinson Schoolof Law.
What is the Board’s recommendation for voting on Proposal No. 1?
The Board of Directors unanimously recommends that stockholders
vote FOR the nominees listed above.
32
AUDIT COMMITTEE REPORT
To Our Stockholders:
Our role as the Audit Committee of the Board of Directors is to prepare this report and to assistthe Board in its oversight of:
• The integrity of the Company’s financial statements;• The Company’s compliance with legal and regulatory requirements;• The independent auditors’ qualifications and independence; and• The performance of the independent auditors and the Company’s internal audit function.
Our Committee operates under a written charter that was last amended and restated by theBoard on February 23, 2010. The charter may be viewed on the Company’s website atwww.hersheys.com in the Investor Relations section.
Our duties as a Committee include overseeing the Company’s management, internal auditors andindependent auditors in their performance of the following functions, for which they areresponsible:
Management
• Preparing the Company’s financial statements;• Establishing effective financial reporting systems and internal controls and
procedures; and• Reporting on the effectiveness of the Company’s internal control over financial
reporting.
Internal Audit Department
• Independently assessing management’s system of internal controls and procedures;and
• Reporting on the effectiveness of that system.
Independent Auditors
• Auditing the Company’s financial statements;• Expressing an opinion about the financial statements’ conformity with U.S. generally
accepted accounting principles; and• Annually auditing the effectiveness of the Company’s internal control over financial
reporting.
We meet periodically with management, the internal auditors and independent auditors,independently and collectively, to discuss the quality of the Company’s financial reporting processand the adequacy and effectiveness of the Company’s internal controls. Prior to the Companyfiling its Annual Report on Form 10-K for the year ended December 31, 2009, with the SEC, wealso:
• Reviewed and discussed the audited financial statements with management and theindependent auditors;
33

• Discussed with the independent auditors the matters required to be discussed byStatement on Auditing Standards No. 61, Communication with Audit Committees, ascurrently in effect;
• Received the written disclosures and the letter from the independent auditors inaccordance with applicable requirements of the Public Company AccountingOversight Board regarding the independent auditors’ communications with the AuditCommittee concerning independence; and
• Discussed with the independent auditors their independence from the Company.
We are not employees of the Company and are not performing the functions of auditors oraccountants. We are not responsible as a Committee or individually to conduct “field work” orother types of auditing or accounting reviews or procedures or to set auditor independencestandards. In carrying out our duties as Audit Committee members, we have relied on theinformation provided to us by management and the independent auditors. Consequently, we donot assure that the audit of the Company’s financial statements has been carried out inaccordance with generally accepted auditing standards, that the financial statements arepresented in accordance with U.S. generally accepted accounting principles or that the Company’sauditors are in fact “independent.”
Based on the reports and discussions described in this report, and subject to the limitations on ourrole and responsibilities as a Committee referred to above and in our charter, we recommended tothe Board that the audited financial statements be included in the Company’s Annual Report onForm 10-K for the year ended December 31, 2009, filed with the SEC on February 19, 2010.
Submitted by the Audit Committee of the Company’s Board of Directors:
David L. Shedlarz, ChairRobert F. CavanaughCharles A. Davis
34
INFORMATION ABOUT OUR INDEPENDENT AUDITORS
Who are the Company’s current independent auditors?
KPMG LLP, an independent registered public accounting firm, has audited the Company’sfinancial statements since May 10, 2002.
What were KPMG LLP’s fees for professional services to the Company in fiscalyears 2008 and 2009?
KPMG LLP’s fees were as follows:
For the Fiscal Year Ended December 31, 2009 2008Audit Fees $2,692,000 $2,572,000Audit-Related Fees(1) 2,022,865 230,217Tax Fees(2) 39,065 63,558All Other Fees — —
Total Fees $4,753,930 $2,865,775
(1) Fees associated primarily with the following services:• In 2009, regulatory reporting and due diligence associated with a potential business acquisition and
auditing of employee benefit plans.• In 2008, auditing of employee benefit plans and securities offering procedures.
(2) Fees pertaining primarily to assistance with the preparation of tax returns for the Company’s foreignsubsidiaries.
What is the Audit Committee’s policy regarding pre-approval of audit andnon-audit services performed by the Company’s independent auditors?
The Audit Committee pre-approves all audit and non-audit services performed by KPMG LLP.The Committee is authorized by its charter to delegate to one or more of its members theauthority to pre-approve any audit or non-audit services, provided that the approval is presentedto the Audit Committee at its next scheduled meeting.
The Audit Committee pre-approved all services provided by KPMG LLP in 2009.
35
PROPOSAL NO. 2 – APPOINTMENT OF INDEPENDENT AUDITORS
What is the Board proposing?
The Board is proposing that you ratify the Audit Committee’s appointment of KPMG LLP as theCompany’s independent auditors for 2010. The Audit Committee and the Board considerKPMG LLP to be well-qualified for that role.
Is stockholder ratification necessary or required?
The Audit Committee is not required to obtain stockholder ratification of its appointment ofKPMG LLP. However, the Audit Committee recommended to the Board that stockholders be giventhe opportunity to vote on KPMG LLP’s appointment at the annual meeting.
What will happen if the appointment of KPMG LLP is not ratified by thestockholders?
If stockholders do not ratify the appointment of KPMG LLP as the Company’s independentauditors for 2010, the Audit Committee will reconsider its appointment.
How many votes will be required for ratification?
KPMG LLP’s appointment as the Company’s independent auditors for 2010 will be consideredratified if the holders of record of the Common Stock and Class B Common Stock present (inperson or by proxy) at the annual meeting cast more votes for the proposal than against theproposal.
Will representatives of KPMG LLP attend the annual meeting?
Representatives of KPMG LLP will attend the annual meeting, will have the opportunity to makea statement, if they so desire, and will respond to questions.
What is the Board’s recommendation for voting on Proposal No. 2?
The Board of Directors unanimously recommends that stockholders
vote FOR Proposal No. 2.
36
OWNERSHIP OF THE COMPANY’S SECURITIES
When are shares “beneficially owned”?
Shares are beneficially owned when a person has voting or investment power over the shares orthe right to acquire voting or investment power within 60 days. Voting power is the power to votethe shares. Investment power is the power to direct the sale or other disposition of the shares.
What information is presented in the following table?
This table shows the number of Company shares beneficially owned by:
• Stockholders who we believe owned more than 5% of our outstanding Common Stock orClass B Common Stock, as of the dates indicated; and
• Our directors, the executive officers named in the Summary Compensation Table onpage 62 (we refer to these officers as “named executive officers”), and all directors andexecutive officers as a group, as of March 8, 2010.
Unless we have indicated otherwise in a footnote, the individuals and entities listed in the tablehave sole voting and investment power over the shares listed.
37
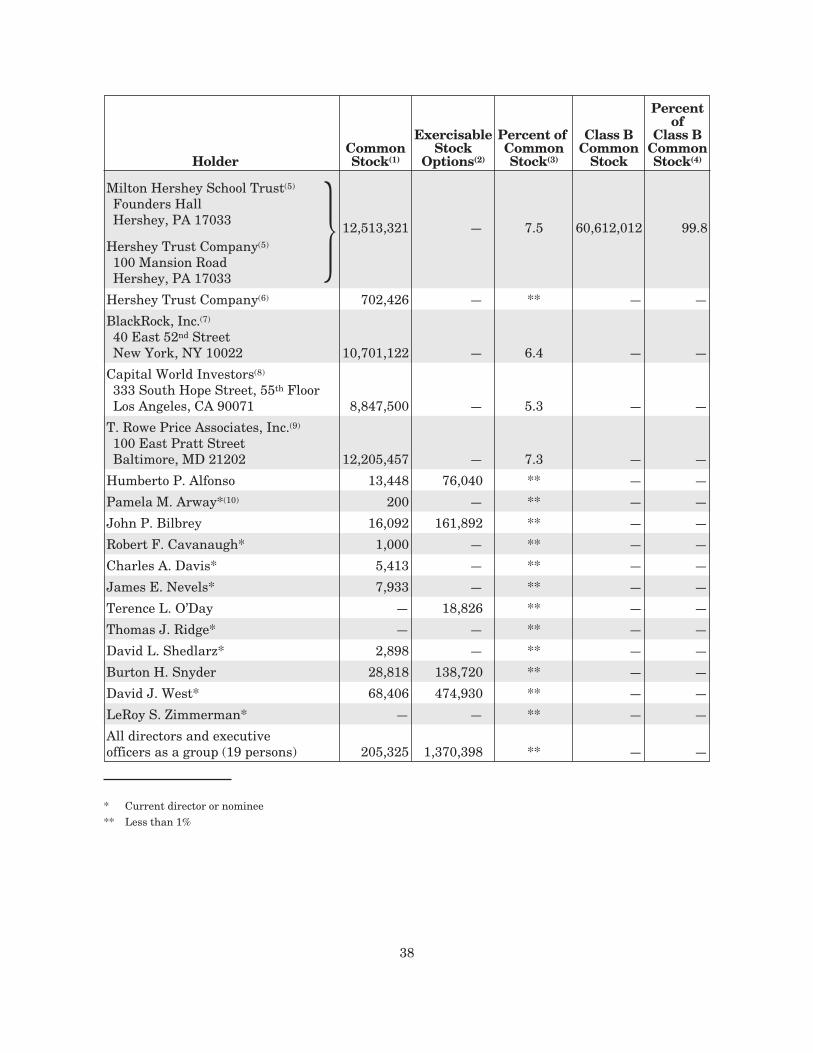
HolderCommonStock(1)
ExercisableStock
Options(2)
Percent ofCommonStock(3)
Class BCommon
Stock
Percentof
Class BCommonStock(4)
Milton Hershey School Trust(5)
Founders HallHershey, PA 17033 12,513,321 — 7.5 60,612,012 99.8
Hershey Trust Company(5)
100 Mansion RoadHershey, PA 17033
Hershey Trust Company(6) 702,426 — ** — —
BlackRock, Inc.(7)
40 East 52nd StreetNew York, NY 10022 10,701,122 — 6.4 — —
Capital World Investors(8)
333 South Hope Street, 55th FloorLos Angeles, CA 90071 8,847,500 — 5.3 — —
T. Rowe Price Associates, Inc.(9)
100 East Pratt StreetBaltimore, MD 21202 12,205,457 — 7.3 — —
Humberto P. Alfonso 13,448 76,040 ** — —
Pamela M. Arway*(10) 200 — ** — —
John P. Bilbrey 16,092 161,892 ** — —
Robert F. Cavanaugh* 1,000 — ** — —
Charles A. Davis* 5,413 — ** — —
James E. Nevels* 7,933 — ** — —
Terence L. O’Day — 18,826 ** — —
Thomas J. Ridge* — — ** — —
David L. Shedlarz* 2,898 — ** — —
Burton H. Snyder 28,818 138,720 ** — —
David J. West* 68,406 474,930 ** — —
LeRoy S. Zimmerman* — — ** — —
All directors and executiveofficers as a group (19 persons) 205,325 1,370,398 ** — —
* Current director or nominee** Less than 1%
38
(1) Amounts listed for executive officers include shares of Common Stock allocated by the Company to the officer’s accountin The Hershey Company 401(k) Plan under section 401(k) of the Internal Revenue Code. Amounts listed also includethe following restricted stock units that will vest within 60 days of March 8, 2010 and for which the holder hasrequested immediate payment:
• RSUs held by directors:
Charles A. Davis 883
James E. Nevels 883
David L. Shedlarz 883
Amounts listed also include shares for which certain of the directors, nominees for director and named executiveofficers share voting and/or investment power with one or more other persons as follows: Mr. Alfonso, 13,353 sharesowned jointly with his spouse; Ms. Arway, 200 shares owned jointly with her spouse; Mr. Bilbrey, 15,802 shares ownedjointly with his spouse; Mr. Cavanaugh, 1,000 shares owned jointly with his spouse; Mr. Nevels, 5,675 shares ownedjointly with his spouse and 1,374 shares owned jointly with another individual; and Mr. West, 67,508 shares held in arevocable trust for the benefit of family members for which Mr. West is trustee.
(2) This column reflects stock options that were exercisable by the named executive officers and the executive officers as agroup on March 8, 2010, as well as the following stock options that will become exercisable within 60 days of March 8, 2010:
• Stock options held by the named executive officers:
David J. West 14,062
Humberto P. Alfonso 3,700
John P. Bilbrey 6,187
Burton H. Snyder 5,637
• 34,180 stock options held, in the aggregate, by six executive officers who are not named executive officers.
(3) Based upon 166,182,457 shares of Common Stock outstanding on March 8, 2010, unless indicated otherwise in afootnote.
(4) Based upon 60,708,908 shares of Class B Common Stock outstanding on March 8, 2010.
(5) Reflects stockholdings as of March 8, 2010. The Milton Hershey School Trust has the right at any time to convert itsClass B Common Stock shares into Common Stock shares on a share-for-share basis. If on March 8, 2010, the MiltonHershey School Trust converted all of its Class B Common Stock shares to Common Stock, Hershey Trust Company, in itscapacity as trustee for the Milton Hershey School Trust, would own beneficially 73,125,333 shares of our Common Stock(12,513,321 Common Stock shares plus 60,612,012 converted Class B Common Stock shares), or 32.2% of the 226,794,469shares of Common Stock outstanding following the conversion (calculated as 166,182,457 Common Stock sharesoutstanding prior to the conversion plus 60,612,012 converted Class B Common Stock shares). For more information aboutthe Milton Hershey School Trust, Hershey Trust Company and the voting of these securities, please turn to page 41.
(6) Reflects stockholdings as of March 8, 2010. Please turn to page 41 for more information about shares of Common Stockheld by Hershey Trust Company in its capacity as institutional fiduciary for estates and trusts unrelated to the MiltonHershey School Trust and as investments.
(7) Information regarding BlackRock, Inc. and its beneficial holdings was obtained from a Schedule 13G filed with theSEC on January 29, 2010. The filing indicated that, as of December 31, 2009, BlackRock, Inc. had sole voting andinvestment power over 10,701,122 shares of Common Stock. The filing indicated that BlackRock, Inc. is a parentholding company or control person in accordance with Rule 13d-1(b)(1)(ii)(G) and that various persons have the rightto receive or the power to direct the receipt of dividends from, or the proceeds from the sale of, our Common Stock.
(8) Information regarding Capital World Investors and its beneficial holdings was obtained from a Schedule 13G/A filedwith the SEC on February 11, 2010. The filing indicated that, as of December 31, 2009, Capital World Investors hadsole voting power over 26,500 shares, and sole investment power over 8,847,500 shares, of Common Stock. CapitalWorld Investors disclaimed beneficial ownership over these shares on the basis that it is a beneficial holder solelybecause its affiliate, Capital Research and Management Company, acts as an investment advisor and manages equityassets for various investment companies.
(9) Information regarding T. Rowe Price Associates, Inc. and its beneficial holdings was obtained from a Schedule 13G/A filedwith the SEC on February 12, 2010. The filing indicated that, as of December 31, 2009, T. Rowe Price Associates, Inc. had
39
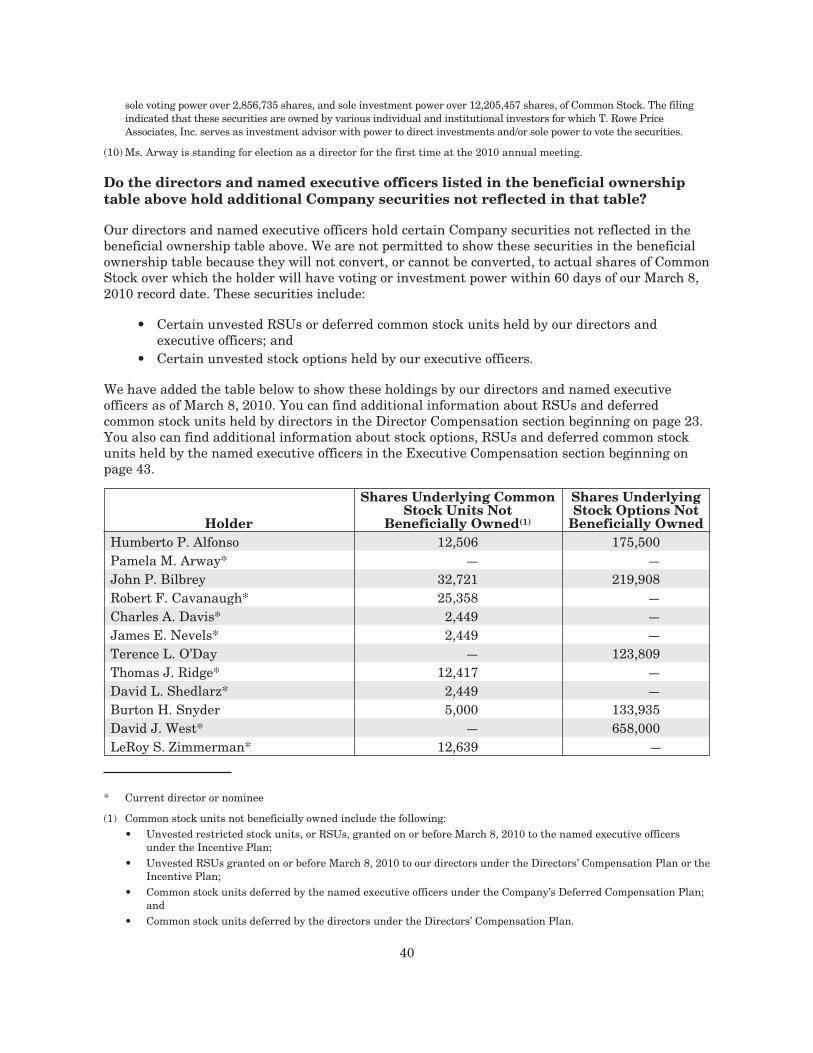
sole voting power over 2,856,735 shares, and sole investment power over 12,205,457 shares, of Common Stock. The filingindicated that these securities are owned by various individual and institutional investors for which T. Rowe PriceAssociates, Inc. serves as investment advisor with power to direct investments and/or sole power to vote the securities.
(10) Ms. Arway is standing for election as a director for the first time at the 2010 annual meeting.
Do the directors and named executive officers listed in the beneficial ownershiptable above hold additional Company securities not reflected in that table?
Our directors and named executive officers hold certain Company securities not reflected in thebeneficial ownership table above. We are not permitted to show these securities in the beneficialownership table because they will not convert, or cannot be converted, to actual shares of CommonStock over which the holder will have voting or investment power within 60 days of our March 8,2010 record date. These securities include:
• Certain unvested RSUs or deferred common stock units held by our directors andexecutive officers; and
• Certain unvested stock options held by our executive officers.
We have added the table below to show these holdings by our directors and named executiveofficers as of March 8, 2010. You can find additional information about RSUs and deferredcommon stock units held by directors in the Director Compensation section beginning on page 23.You also can find additional information about stock options, RSUs and deferred common stockunits held by the named executive officers in the Executive Compensation section beginning onpage 43.
Holder
Shares Underlying CommonStock Units Not
Beneficially Owned(1)
Shares UnderlyingStock Options Not
Beneficially OwnedHumberto P. Alfonso 12,506 175,500Pamela M. Arway* — —John P. Bilbrey 32,721 219,908Robert F. Cavanaugh* 25,358 —Charles A. Davis* 2,449 —James E. Nevels* 2,449 —Terence L. O’Day — 123,809Thomas J. Ridge* 12,417 —David L. Shedlarz* 2,449 —Burton H. Snyder 5,000 133,935David J. West* — 658,000LeRoy S. Zimmerman* 12,639 —
* Current director or nominee
(1) Common stock units not beneficially owned include the following:• Unvested restricted stock units, or RSUs, granted on or before March 8, 2010 to the named executive officers
under the Incentive Plan;• Unvested RSUs granted on or before March 8, 2010 to our directors under the Directors’ Compensation Plan or the
Incentive Plan;• Common stock units deferred by the named executive officers under the Company’s Deferred Compensation Plan;
and• Common stock units deferred by the directors under the Directors’ Compensation Plan.
40

What is the Milton Hershey School Trust?
In 1909, Milton S. and Catherine S. Hershey established a trust (the “Milton Hershey SchoolTrust”) having as its sole beneficiary Milton Hershey School, a non-profit school for the full-timecare and education of disadvantaged children located in Hershey, Pennsylvania. Hershey TrustCompany, a state-chartered trust company, is trustee of the Milton Hershey School Trust.
What is the relationship of the Milton Hershey School Trust and Hershey TrustCompany to The Hershey Company?
The Milton Hershey School Trust is our controlling stockholder. It will have the right to cast 7.5%of all of the votes entitled to be cast on matters requiring the vote of the Common Stock votingseparately and 80% of all of the votes entitled to be cast on matters requiring the vote of theCommon Stock and Class B Common Stock voting together. The board of directors of HersheyTrust Company, with the approval of the board of managers (governing body) of Milton HersheySchool, decides how funds held by the Milton Hershey School Trust will be invested. The board ofdirectors of Hershey Trust Company decides how shares of The Hershey Company held by theMilton Hershey School Trust will be voted.
As of the record date, Hershey Trust Company also held 313,426 shares of our Common Stock inits capacity as institutional fiduciary for 102 estates and trusts unrelated to the Milton HersheySchool Trust. Hershey Trust Company also held 389,000 shares of our Common Stock asinvestments on that date. The board of directors or management of Hershey Trust Companydecides how these shares will be invested and voted.
In all, Hershey Trust Company, as trustee for the Milton Hershey School Trust, as fiduciary forthe individual estates and trusts noted above, and as direct owner of investment shares, will beentitled to vote 13,215,747 shares of our Common Stock and 60,612,012 shares of our Class BCommon Stock at the annual meeting. Stated in terms of voting power, Hershey Trust Companywill have the right to cast 8% of all of the votes entitled to be cast on matters requiring the vote ofthe Common Stock voting separately and 80% of all of the votes entitled to be cast on mattersrequiring the vote of the Common Stock and Class B Common Stock voting together at the annualmeeting.
Our certificate of incorporation contains the following important provisions regarding Class BCommon Stock and the Milton Hershey School Trust’s ownership of that stock:
• All holders of Class B Common Stock, including the Milton Hershey School Trust, mayconvert any of their Class B Common Stock shares into shares of our Common Stock atany time on a share-for-share basis.
• All shares of Class B Common Stock will automatically be converted to shares of CommonStock on a share-for-share basis if the Milton Hershey School Trust ceases to hold morethan 50% of the total Class B Common Stock shares outstanding and at least 15% of thetotal Common Stock and Class B Common Stock shares outstanding.
• We must obtain the approval of the Milton Hershey School Trust before we issue anyCommon Stock or take any other action that would deprive the Milton Hershey SchoolTrust of the ability to cast a majority of the votes on any matter where the Class BCommon Stock is entitled to vote, either separately as a class or together with any otherclass.
41
What is the governance structure of Milton Hershey School and Hershey TrustCompany?
All of the outstanding shares of Hershey Trust Company are owned by the Milton Hershey SchoolTrust. The members of the board of managers of Milton Hershey School are appointed by andfrom the board of directors of Hershey Trust Company. There are eight members of the board ofdirectors of Hershey Trust Company. There are eight members of the board of managers of MiltonHershey School. Robert F. Cavanaugh, James E. Nevels and LeRoy S. Zimmerman, each adirector of our Company, are members of the board of directors of Hershey Trust Company andboard of managers of Milton Hershey School. Directors of Hershey Trust Company and membersof the Milton Hershey School board of managers individually are not considered to be beneficialowners of the shares of Hershey Common Stock and Class B Common Stock held by the MiltonHershey School Trust.
42
EXECUTIVE COMPENSATION
Compensation Discussion and Analysis
This section discusses the principles underlying our policies and provides information andanalysis of decisions we made concerning the compensation of Hershey’s executive officers. Thisinformation describes the process and considerations on which compensation is awarded to andearned by our executive officers and provides perspective on the tables and narrative that follow.
What material factors or events affected the executive compensation process anddecision-making regarding 2009 compensation? What was the response to thosefactors and events?
During 2009 we continued our brand-building initiatives from 2008 and the transformation of ouroperations and organization that began in 2007. We made significant progress in implementingour consumer-driven demand model, significantly increased levels of investment in advertisingand promoting our brands and strengthened Hershey's leadership position in the marketplace. Wealso successfully rolled out our “One Hershey Incentive Program” and its focus on unifyingemployees globally with respect to Company-wide financial performance and Hershey Values. Allof these efforts resulted in strong financial performance.
• During 2008, the Compensation and Executive Organization Committee of our Board,which we refer to in this section as the Committee, engaged Mercer (US) Inc., or Mercer,to serve as compensation consultant to the Committee and to work with managementwith respect to our executive and Board compensation programs. Throughout the latterhalf of 2008, with the assistance of Mercer, the Committee and management reviewedour executive compensation programs, including the design of our annual incentiveprogram and equity award programs in light of market trends, our updated strategicfocus and outlook, and the peer groups used for benchmarking compensation andperformance. In early 2009, we launched redesigned performance management andcompensation programs to ensure alignment of our executives and all employees with ourCompany’s strategic goals and values.
• In January 2009, we announced projected 2009 performance that would reflect net salesgrowth in a range of 2% to 3%. We also announced our expectation that 2009 “adjustedearnings per share-diluted,” which we define as diluted earnings per share of our CommonStock excluding adjustments as described beginning on page 19 of the 2009 Annual Reportto Stockholders that accompanies this proxy statement, would increase from 2008, but theamount of increase would be below our long-term objective for growth of 6% to 8%. We usedthese expectations in establishing the performance goals for our annual incentive programfor 2009, the One Hershey Incentive Program, and contingent target performance stockunit, or PSU, awards made in February 2009. We also incorporated an ability for theCommittee to exercise discretion to reduce or increase year-end funding levels for the OneHershey Incentive Program to enable the Committee to assess the quality of results andadjust the final awards based on the Committee’s evaluation of how difficult it was, givenunexpected events, to achieve the actual financial results.
• During 2009, we experienced strong core brand growth and increased performance in theretail channels due to our focus on brand-building and our marketing and advertisinginvestments. We also secured productivity gains from our global supply chaintransformation program and execution of our operating plan. Excluding the impact ofacquisitions, this success translated into net sales growth of 3%, adjusted earnings per
43
share-diluted of $2.16 and over $750 million of operating cash flow. This performance waswell above the targets we established at the beginning of the year. As a result, above-target annual bonuses under the One Hershey Incentive Program were earned by ourCEO and all other executive officers for 2009.
• Despite above-target results for 2009, due to the significant shortfall in results in 2007,no PSU payments were made to any of our senior executives under our long-termincentive program for the 2007-2009 performance cycle. However, the combination of our2008 and 2009 performance did result in a payment for PSUs awarded under the specialtwo-year 2008-2009 performance cycle.
• As part of its on-going review of the Company’s compensation programs, the Committeeevaluated the Company’s programs which provide benefits for executive officers andemployees in the event of severance or a change in control. As a result of this review, theCommittee approved modifications to our severance and change in control benefits.
Additional information and analysis regarding these events and actions is provided in the series ofquestions and answers below.
Who is responsible for our decision-making concerning executive compensation?
The Committee has primary responsibility for decision-making concerning executivecompensation. Our CEO’s compensation is approved by the independent members of the Board ofDirectors based on recommendations of the Committee.
What are the objectives of the Company’s executive compensation program?
We seek to create a strong alignment between Hershey’s executive officers and its stockholders.We use our compensation programs to support the Company’s business strategies, which aim tobuild stockholder value over the long term. We do this by:
• Considering industry-specific and broader market practices to establish pay levels thatattract, retain and motivate executive talent;
• Tying a significant portion of executive compensation to overall Company performance;• Setting individual goals for executives that support the Company’s overall goals and
strategies, and linking the executives’ compensation to those measures;• Using our Common Stock for long-term incentive compensation to tie a significant
amount of the executive officers’ total compensation to the market value of our CommonStock; and
• Requiring stock ownership by all executives.
These actions are described in the discussion that follows.
What is the Company’s executive compensation program designed to reward?
We reward results. We link a significant amount of our executive officers’ pay to achievement ofour financial goals. We use stock options, PSUs and restricted stock units, or RSUs, for long-termcompensation. If we achieve strong financial performance relative to our goals and our stock priceappreciates, our executives will earn significant rewards. If our stock price lags, compensationunder these equity programs will be lower or eliminated. If our annual financial performance fallsbelow our annual target goals, our executives do not receive awards at target and may not receiveany award at all.
44
We also reward individual performance and expect our executives to demonstrate the HersheyValues. Achievement of individual performance objectives is considered in the determination of basesalary and annual incentive compensation. Based on management’s recommendation, weincorporated a values modifier in the One Hershey Incentive Program to reinforce the expectationthat our executive officers and salaried employees globally, consistently demonstrate the HersheyValues. The Company values upon which all employees, including our executive officers, areevaluated support our mission of “Bringing sweet moments of Hershey happiness to the world everyday.” One Hershey Incentive Program award payments are decreased by 10% for executive officersreporting to Mr. West who do not demonstrate the Hershey Values. We believe our redesignedperformance management and compensation programs better align all of our employees withrespect to Company performance which brings increased value to our stockholders.
What process does the Committee follow to implement the executive compensationprogram? How does the Committee use benchmarking in its decision-making?
The Committee operates under a charter approved by the Board of Directors and carries out theresponsibilities outlined on pages 17 through 18. The Committee receives studies, reports andother information from its consultant, input from our CEO, and input and assistance from ourChief People Officer and the staff of the Company’s Global Total Rewards Department. TheCommittee uses this information in making decisions and conducting its annual review of theCompany’s executive compensation program.
For 2009, the annual compensation review included an analysis of survey data compiled byMercer, comparing the Company’s levels of executive compensation against a peer group of 41consumer products companies and general industry companies in Mercer’s compensation databasethat we call the Consumer Products Group peer group, or CPG peer group. We use this broadsurvey data because it provides us with industry-specific information regarding competitive paylevels not only for our executive officers, but also for employees throughout the organization. Weuse this information to assess, or benchmark, our compensation levels to those offered by othercompanies. A list of these companies appears on the following page. At $5.1 billion for 2008, theCompany’s revenues were slightly below the median revenues of the CPG peer group of$5.3 billion. Therefore, Mercer utilized regression analysis to adjust the CPG peer groupcompensation data for this difference.
In addition to the size-adjusted CPG peer group survey data, Mercer also provided the Committeewith an analysis of the financial performance and compensation data for 14 food, beverage andconsumer products companies. We refer to this smaller group as our “financial peer group.” Weuse this group primarily for assessing our Company’s financial performance against the food,beverage and consumer products industry. These companies also represent a more focused set ofcompanies with which we compete for executive talent. Companies in the 2009 financial peergroup had a median revenue of $9 billion.
To increase the effectiveness of the financial peer group as a reference for measuring the Company’sfinancial results, Mercer recommended, and the Committee agreed, to change the financial peer groupfor 2009 by adding consumer product companies with revenues similar in amount to the Company(Del Monte Foods Company, Dr Pepper Snapple Group, Inc., Hormel Foods Company,The J. M. Smucker Company, McCormick & Company, Incorporated and Molson Coors BrewingCompany), while removing companies substantially larger than the Company (The Coca-ColaCompany, PepsiCo, Inc. and The Procter & Gamble Company), those being acquired(Anheuser-Busch Companies, Inc. and Wm. Wrigley Jr. Company), and companies that do not produceor manufacture food or beverage products (Colgate-Palmolive Company and The Clorox Company).
45
Since the companies in the financial peer group are generally larger than Hershey in terms ofrevenue, the compensation data for this group are used as secondary reference points for purposesof assessing Hershey’s compensation levels for our executive officers. We do not size-adjust thedata because we use the data to assess the actual compensation levels available at the financialpeer group companies.
Mercer provided the Committee and Company with a report summarizing executive compensationlevels at the size-adjusted 25th, 50th and 75th percentile of the CPG peer group and of the financialpeer group. We compared the target compensation we set for our executive officers against these“benchmarks.” The Committee also received an analysis from Mercer comparing the target totalcash compensation (base salary plus target annual incentive) and target total direct compensation(base salary plus target annual incentive plus value of long-term incentives) for each of theexecutive officers against these benchmarks. For retention and competitive considerations, theCompany targets each executive officer’s target total cash compensation and target total directcompensation levels to fall within the range of the size-adjusted 50th and 75th percentile of theCPG peer group data for his or her position. The Committee’s final determinations with respect tobase salary, target annual incentive compensation and target long-term incentive compensationreflect consideration of the Company’s and executive officer’s performance, internal comparisonsand other factors. The amount the executive officer receives depends upon actual Company andindividual performance.
Companies included in the 2009 CPG peer group are as follows:
Anheuser-Busch Companies, Inc. International Dairy Queen, Inc. S. C. Johnson & Son, Inc.Arby’s Restaurant Group, Inc. Interstate Bakeries Corporation Sara Lee CorporationBob Evans Farms, Inc. Jack in the Box Inc. Smithfield Foods, Inc.Burger King Holdings, Inc. Kellogg Company The Coca-Cola CompanyCalifornia Pizza Kitchen, Inc. Kimberly-Clark Corporation The Estée Lauder Companies Inc.Chiquita Brands International, Inc. Land O’Lakes, Inc. The Schwan Food CompanyColgate-Palmolive Company Mars North America Tyson Foods, Inc.ConAgra Foods, Inc. McDonald’s Corporation Unilever United States, Inc.Darden Restaurants, Inc. Nestlé USA, Inc. Welch Foods Inc.Del Monte Foods Company Pernod Ricard USA, LLC Wells’ Dairy, Inc.Dunkin’ Brands, Inc. Ralcorp Holdings, Inc. Wendy’s International, Inc.Energizer Holdings, Inc. Reckitt Benckiser, Inc. Wm. Wrigley Jr. CompanyFarmland Foods, Inc. Reynolds American Inc. Yum! Brands, Inc.H.J. Heinz Company Rich Products Corporation
Companies included in the 2009 financial peer group are as follows:
Cadbury plc General Mills, Inc. McCormick & Company, IncorporatedCampbell Soup Company H.J. Heinz Company Molson Coors Brewing CompanyDean Foods Company Hormel Foods Corporation Sara Lee CorporationDel Monte Foods Company Kellogg Company The J. M. Smucker CompanyDr Pepper Snapple Group, Inc. Kraft Foods Inc.
What other information does the Committee consider when making executivecompensation decisions?
In addition to survey and other data relating to the competitive landscape, the Committee alsoreceives and considers compensation-related information relating to the CEO and each member ofthe senior leadership team. Much of this information is reflected on pages 62 through 83 of thisproxy statement.
46
During 2009, the Committee received detailed tally sheets prepared by management and reviewedby Mercer. Each tally sheet captures comprehensive compensation, benefits and stock ownershipdata for each member of the senior executive team, including the CEO. The tally sheets providethe Committee with a complete picture of each executive’s current and projected compensationand the amount of each element of compensation or other benefit the executive would receive inthe event of termination, retirement, disability or death. The Committee considers thisinformation, as well as the benchmark information, when making compensation decisions.
Do costs and tax rules play a role?
An important factor in the Committee’s deliberations is the anticipated cost of the variouscomponents of executive compensation. Accounting treatment is also taken into consideration inthe design and implementation of the annual and long-term incentive programs.
Section 162(m) of the Internal Revenue Code (Code) limits the Company’s ability to deduct certaincompensation in excess of $1 million paid to our CEO or to other named executive officers. Thislimitation does not apply to compensation that qualifies under applicable regulations as“performance-based.” The Committee has considered the effect of section 162(m) on the Company’sexecutive compensation program. It is the Committee’s opinion that, in administering the“performance-based” components of the Company’s executive compensation program (the annualincentive program, stock options and PSUs described below), it will attempt to satisfy therequirements for deductibility under section 162(m). However, the Committee is authorized toexercise discretion in determining payments in relation to levels of achievement of performancegoals and believes that the total compensation program for executive officers should be managedin accordance with the objectives outlined in the Company’s compensation philosophy and in thebest overall interests of the Company’s stockholders. Accordingly, some compensation may exceedthe limitations or not meet the requirements for deductibility under section 162(m).
Section 409A of the Code prescribes certain rules and limitations upon the operation of ourdeferred incentive and other compensation plans. Failure to comply with these rules could subjectparticipants in those plans and programs to additional income tax and interest penalties. During2008, we updated our plans and programs to the extent we believed necessary for compliance withsection 409A, based on rules and interpretations relating to section 409A as published through theend of the year.
What role does the Committee have with respect to incentive programs and thecompensation of employees beyond the executive officers?
The Committee reviews and approves the design of various incentive programs maintainedthroughout the Company and total incentive awards, if any, paid out under those programs. Insome instances, the incentive programs are extensions of the annual or long-term incentiveprograms in which the executive officers participate. All salaried employees globally participate inthe One Hershey Incentive Program and hourly employees in our manufacturing facilitiesparticipate in a Manufacturing Incentive Program or Quality Retention Program. For 2009, inkeeping with our “One Hershey” focus each of these incentive programs included performancemetrics tied to Company-wide financial performance. These programs also placed significantemphasis on customer, production, quality and safety measures.
47
What are the individual components of the executive compensation program andwhy does the Company choose to pay them?
Our executive compensation program includes three key components: base salary and benefits, anannual cash incentive program and a long-term incentive program consisting of stock-basedawards. The total compensation package provided by the Company (including pension benefits,supplemental retirement benefits and other benefits) is considered by the Committee whendetermining each component of an executive officer’s compensation.
Base salary and related benefits are the foundation of the overall pay package. We set basesalaries and establish benefit programs primarily to attract and retain executives with provenskills and leadership abilities that will enable us to be successful. Annual and long-termincentives – variable or “at-risk” pay – play an important role in motivating executive performanceand in aligning executive pay opportunities with the interests of stockholders. The variable orat-risk elements are designed to reward the achievement of both short- and long-term goals. Thelong-term incentives link a significant portion of each executive officer’s total compensationdirectly to long-term Company performance versus internal objectives, to individual performanceevaluations, and to relative total stockholder return. At the executive officer level, at-risk payoften will represent 60% to 80% of the executive’s total target compensation.
How are base salaries determined?
We set the initial base salary for a new executive officer based upon an evaluation of his or herresponsibilities and experience, as well as upon the salaries paid by other companies forcomparable executive talent and the base salary necessary to recruit the individual to Hershey.We apply a similar approach when adjusting an executive’s base salary in response to a promotionor significant change in job responsibilities.
Salary reviews for incumbent officers are generally conducted at the beginning of each year. Theofficer’s base salary is benchmarked against the range of the 50th to 75th percentile of the basesalary level for the comparable position at the companies in our size-adjusted CPG peer group.Base salary adjustments, if any, are made after considering peer group comparisons, Companyperformance against financial goals and individual executive performance as evaluated by theCommittee and independent members of the Board, in the case of our CEO, or by the CEO in thecase of other members of the leadership team. If an executive officer has responsibility for aparticular business unit, the business unit’s financial results also will be strongly considered.
Each executive officer’s base salary has been targeted to be at the 50th percentile level of his or hercounterparts in the size-adjusted CPG peer group. In anticipation of increases in our coststructure caused by continuing volatility in commodities and the uncertainties in the broaderglobal economy in 2009, Mr. West and the executives reporting directly to him, collectivelyrecommended to the Committee that they be given no merit increases for 2009. The Committeeconcurred with this recommendation and approved no base salary increase for Messrs. Alfonso,Bilbrey, O’Day and Snyder for 2009. The adjustment made to Mr. Bilbrey’s base salary inmid-2008 resulted in a difference in his annual base salary for 2008 versus 2009, as reported inColumn (c) of the Summary Compensation Table on page 62. Based upon the recommendation ofthe Committee, the independent directors of the Board approved continuing Mr. West’s 2009 basesalary at the same level as 2008. See Column (c) of the Summary Compensation Table forinformation regarding the base salary earned by each of our named executive officers during 2009.
48
How is the Company’s annual incentive program designed? How are target annualincentive amounts and required performance goals established?
Our executive officers, as well as all other salaried employees globally, are eligible to receive anannual cash incentive award under the annual incentive program, which we refer to as the OneHershey Incentive Program, of the stockholder-approved Equity and Incentive CompensationPlan, which we refer to in this section as the EICP or Incentive Plan.
Our philosophy in setting One Hershey Incentive Program objectives is to link, where appropriate,the executive’s payout opportunity directly to measures he or she can affect most directly. OurCEO and all executive officers reporting directly to him (including the named executive officers)have common financial objectives tied to total Company performance consistent with theirresponsibility to manage the entire Company and not specific business units. The Committeeemphasizes a limited number of goals to better focus actions on identified, strategic businessobjectives. Performance targets are established in the context of our announced expectations forfinancial performance, prior year results and market conditions. Little or no incentivecompensation is payable for missing targets, and an appropriate degree of upside is included tomotivate and reward above-target performance.
In 2009, participating executive officers were eligible to earn individual One Hershey IncentiveProgram awards, expressed as a percentage of base salary, based on attainment of Company and,except for Mr. West, individual performance objectives. The percentages for meeting targetperformance levels were 70% for Mr. Alfonso, 75% for Mr. Bilbrey, 60% for Messrs. O’Day andSnyder, and 100% for Mr. West. In determining the target percentage for each of the executiveofficers, the Committee compared the level of total target cash compensation (base salary andtarget One Hershey Incentive Program percentage) to the benchmark range of the size-adjusted50th to 75th percentile level of his or her counterparts in the CPG peer group.
The final award earned under the One Hershey Incentive Program by participating executiveofficers, with the exception of Mr. West, is determined by multiplying the executive officer’s basesalary, the applicable target percentage, and performance scores ranging from 0% to 200% basedon Company and individual performance against the established performance goals. TheCompany performance goals are established at the beginning of each year by the Committee.Individual performance goals are also established at that time. If performance scores exceed theobjectives, an individual executive officer might receive more than his or her target percentageand, if scores are below target, the executive’s One Hershey Incentive Program payout will bebelow his or her target percentage, subject to no award if performance is below threshold levels.
In establishing the 2009 One Hershey Incentive Program, the Committee approved changes to thedesign of the annual incentive program for executive officers with the exception of Mr. West.Under the One Hershey Incentive Program, a portion of each executive officer’s incentive awardpayment is based upon achievement of individual Strategic Bonus Goals in addition to theachievement of Company financial metrics. For executive officers, the weighting of Companyfinancial performance metrics accounts for 75% of their target award under the program. Theremaining 25% of the target award was based upon individual performance toward achievementof up to five Strategic Bonus Goals. The Committee recommended and the independent directorsapproved no changes to the structure of Mr. West’s 2009 annual incentive target award. TheCommittee determined Mr. West’s annual incentive should continue to be based entirely upon theachievement of Company financial results. Under the One Hershey Incentive Program, the fundsallocated for payment of the component of the annual incentive program awards for 2009 for allemployees excluding Mr. West, based upon the Company’s financial performance metrics weresubject to increase or decrease up to 30% based upon the Committee’s discretion. The Committee
49
retained the flexibility to reduce or increase One Hershey Incentive Program funding levels basedon the quality of results achieved and adjust final awards based on the Committee’s evaluation ofhow difficult it was, given unexpected events, to achieve the actual financial results. Based uponthe recommendation of the Committee, the independent directors of the Board provided thatfunds allocated for payment of Mr. West’s bonus could be increased or decreased up to 30% basedupon the discretion of the independent directors of the Board. The maximum performance scorefor our executive officers without adjustment to the Company financial performance score for 2009was 200%. The maximum performance scoring for the executive officers (other than Mr. West) andfor Mr. West in the event the Committee or independent members of the Board made a maximumadjustment to the Company financial performance score was 245% and 260% respectively.
The Committee also approved the inclusion of a values modifier in the One Hershey IncentiveProgram award calculations for executive officers, excluding Mr. West. One Hershey IncentiveProgram award payments for 2009, if any, were subject to a 10% reduction for any executiveofficer judged to need to improve upon his or her adherence to the Hershey Values. In 2009, all ofthe executives reporting to Mr. West, including all of the named executive officers, demonstratedthe Hershey Values. Therefore, no reduction for the values modifier was made to the 2009 OneHershey Incentive Program awards for any of the executives reporting to Mr. West.
What were the performance targets under the 2009 One Hershey IncentiveProgram? Were they achieved? What were the final One Hershey IncentiveProgram awards for 2009?
The Committee determined that the financial performance metrics for our executive officers’ OneHershey Incentive Program awards should be consistent with our “pay for performance”compensation philosophy. The corporate performance objectives for 2009 One Hershey IncentiveProgram participants were centered around the following targets: adjusted earnings per share-diluted of $1.94 (weighted 40%), consolidated net sales of $5.24 billion (weighted 40%) andoperating cash flow of $587 million (weighted 20%). The targets were based on the Company’s2009 business plan and goals, which called for adjusted earnings per share-diluted of $1.88 to$2.00 and net sales growth of 2% to 3%. Operating cash flow replaced free cash flow as a metric.Free cash flow is defined as cash from operations, excluding cash flows associated with derivativeinstruments, less capital expenditures and dividends. Operating cash flow is defined as theaverage of cash from operations less pension contributions and commodities hedging transactions,measured in five 12-month periods ending on December 31, 2008, April 5, 2009, July 5, 2009,October 4, 2009 and December 31, 2009. The Committee made the change to reinforce continuedemphasis on working capital improvement and cash required for capital investments in 2009,including those associated with its global supply chain transformation program.
Excluding the impact of acquisitions that were not included in the performance goals establishedat the start of 2009 for the One Hershey Incentive Program, our financial performance during2009 was $2.16 adjusted earnings per share-diluted, consolidated net sales of $5.29 billion andoperating cash flow of $756.3 million. This resulted in a combined Company financial performancescore of 167.98% against the established performance goals. Based on these results, theCommittee recommended to the independent directors as a group that Mr. West’s 2009 OneHershey Incentive Program award be approved at $2,267,730, reflecting a full 30% Companyfinancial performance adjustment in recognition of Mr. West’s leadership in the achievement ofearnings and cash flow well above maximum expectations, while devoting significant time andeffort examining and evaluating potential merger and acquisition transactions. The independentdirectors approved the Committee’s recommendation.
50
The award under the One Hershey Incentive Program for the other named executive officers wasbased 75% on the Company performance score with the remainder of the award determined byindividual performance ratings based on attainment of individual Strategic Bonus Goals andadherence to the Hershey Values. In February 2009, individual Strategic Bonus Goals andweightings were approved by Mr. West for each of the named executive officers based on theofficer’s strategic objectives for 2009. Following the close of 2009, Mr. West provided theCommittee with his assessment and scoring of each named executive officer’s performancerelative to these performance goals and the officer’s demonstration of the Hershey Values.
For Mr. Alfonso, our Senior Vice President, Chief Financial Officer, the individual performancegoals focused on enhancing financial forecasting and planning, implementing certain financialprocess improvements, safeguarding the Company’s credit rating, improving cost reductionprocesses and enterprise risk management. Based on Mr. Alfonso’s effort and achievement in theareas of cash management, enterprise risk management and financial process improvements, hewas awarded an individual performance score of 130%. Based on the 75% weighting of theCompany financial score and the 25% weighting of his individual performance score, theCommittee approved a 2009 One Hershey Incentive Program award for Mr. Alfonso of 158% of hisOne Hershey Incentive Program target.
For Mr. Bilbrey, our Senior Vice President, President Hershey North America, the individualperformance goals centered on delivery of the 2009 North American financial plan, achievement ofpricing levels, focus on strategic growth brands, optimizing direct marketing expense andleveraging organization capabilities. Based on Mr. Bilbrey’s effort and achievement in the areas ofsales growth, price conversion and strategic brand development, he was awarded an individualperformance score of 160%. Based on the 75% weighting of the Company financial score and the25% weighting of his individual performance score, the Committee approved a 2009 One HersheyIncentive Program award for Mr. Bilbrey of 166% of his One Hershey Incentive Program target.
For Mr. O’Day, our Senior Vice President, Global Operations, the individual performance goalscentered on improving the supply chain network, consistent product quality and safety throughoutthe global network, delivery of global product plan, enhancing effectiveness of global operationsand personnel management. Based on Mr. O’Day’s effort and achievement in the areas ofcustomer service, completion of the global supply chain transformation program and processimprovements, he was awarded an individual performance score of 150%. Based on the 75%weighting of the Company financial score and the 25% weighting of his individual performancescore, the Committee approved a 2009 One Hershey Incentive Program award for Mr. O’Day of163% of his One Hershey Incentive Program target.
For Mr. Snyder, our Senior Vice President, General Counsel and Secretary, the individualperformance goals centered on legal support for strategic initiatives, litigation risk management,electronic discovery, risk management and special projects. Based on Mr. Snyder’s effort andachievement in the areas of legal support of the Company’s strategic business initiatives and hiswork in 2009 on Board-designated special projects, he was awarded an individual performancescore of 140%. Based on the 75% weighting of the Company financial score and the 25% weightingof his individual performance score, the Committee approved a 2009 One Hershey IncentiveProgram award for Mr. Snyder of 161% of his One Hershey Incentive Program target.
See Column (g) of the Summary Compensation Table for information relating to the amount ofOne Hershey Incentive Program payments made to the named executive officers.
51
What are the elements of the long-term incentive program?
To date, we have used awards of PSUs, stock options and RSUs to provide long-term incentivecompensation. These awards are made under the long-term incentive program of the IncentivePlan. The Committee customarily awards the long-term incentive awards, including stock options,to executive officers and various other management and professional employees in February ofeach year, two to three weeks after the release of fourth quarter and full-year financial results.
The Committee determines the amount of long-term incentive awards made to an executive officerby comparing the executive’s target total direct compensation (the sum of base salary, targetOne Hershey Incentive Program award and the value of the long-term incentive award) to the 50th
to 75th percentile level of target total direct compensation of his or her counterparts in the size-adjusted CPG peer group. In determining the value of the long-term incentive awards, theCommittee values PSUs using the average of the daily closing prices of the Company’s CommonStock in the December preceding the start of the performance cycle. The Committee values RSUsusing the fair market value of our Common Stock at the time of award and values stock optionsusing the value of the stock options at the date of grant as determined for financial reportingpurposes (the Black-Scholes value). Overall, after taking into account the long-term incentiveawards made in 2009, the target total direct compensation of our executive officers was generallybetween the 50th and 75th percentile of total direct compensation of executives employed by thesize-adjusted CPG peer group in similar positions.
How were the PSU awards vesting in 2009 structured? What performance goalswere used? What were the results at year-end 2009?
PSUs are granted to those executive officers and other senior officers in a position to affect theCompany’s long-term results. PSUs have been awarded annually and, with the exception of thespecial 2008-2009 performance cycle described below, are earned based upon the Company’sperformance over a three-year cycle. Each year begins a new three-year cycle.
At the start of each three-year cycle, a contingent target number of PSUs is established for eachexecutive. This target is expressed as a percentage of the executive’s annual base salary anddetermined as part of a total compensation package based on size-adjusted CPG peer groupbenchmarks. The PSU award generally represents one-half of the long-term incentive portion ofthat year’s target total direct compensation package.
At the end of each three-year cycle, the Committee reviews whether the Company has achievedthe established performance objectives to determine the percentage of the target number of PSUsearned, which may range from 0% to 250% of target depending upon performance. In determiningwhether performance objectives have been achieved, specific adjustments may be made by theCommittee to the Company’s performance to take into account extraordinary or unusual itemsoccurring during the cycle.
The performance objectives for the three-year 2007-2009 performance cycle were based upon twoequally-weighted metrics:
(1) The Company’s three-year compound annual growth in adjusted earnings per share-diluted measured against an internal target based on a long-term financial goal of 9% to11% annual growth; and
(2) The Company’s total stockholder return, or TSR, over the three-year period measuredagainst the TSR for the financial peer group.
52
Due to the 2007 financial results, the Company’s performance during the 2007-2009 performancecycle resulted in a compound annual decline in adjusted earnings per share-diluted (excluding theimpact of acquisitions) of 3.1%, significantly below the target growth rate of 8.7%. Three-yearrelative Company TSR was at the 18.6 percentile, placing the Company below the threshold level(35th percentile of our peer companies) required to earn an award for the 2007-2009 performancecycle. As a result, management recommended and the Committee concurred that no payment withrespect to the 2007-2009 performance cycle would be made to Mr. West or any of our otherexecutive officers.
In February 2008, the Committee approved additional contingent target PSU awards with atwo-year 2008-2009 performance cycle for all active executives participating in the 2007-2009performance cycle with the exception of Mr. West. The Committee recommended and theindependent directors approved a contingent target PSU award for the 2008-2009 performancecycle for Mr. West on the same basis as other executives participating in this performance cycle.The special awards were made to aid in retention of these executive officers as the potentialretention value of the 2007-2009 PSUs was diminished in light of the Company’s 2007 financialperformance. The 2008-2009 performance cycle PSU awards were based on achieving two-yearcompound annual growth in adjusted earnings per share-diluted in line with the upper end of theexpected adjusted earnings per share-diluted range of $1.85 to $1.90 for 2008, coupled withimprovement in 2009. The maximum payout from the cycle was 150% of target. Based uponcompound annual growth in adjusted earnings per share-diluted (excluding the impact ofacquisitions) of 1.9% during the two-year performance period, 150% of target PSUs were earnedand paid to the executives in February 2010. To prevent possible duplication, any PSUs earnedunder the original 2007-2009 performance cycle would have reduced the total PSUs earned for the2008-2009 performance cycle.
As a condition to receiving the additional contingent target PSU award for the 2008-2009performance cycle, the executive officers were required to sign an Executive Confidentiality andRestrictive Covenant Agreement, or ECRCA. The terms of the ECRCA prohibit the executive fromdisclosing the Company’s confidential information, competing with the Company in specificcategories for a period of 12 months following termination of the executive’s employment,recruiting or soliciting the Company’s employees, or disparaging the Company’s reputation in anyway. All executive officers were required to sign a new ECRCA at the start of 2009 as a conditionto receiving future equity awards from the Company. New executive officers are required to signthe ECRCA as a condition of employment. The ECRCA supersedes the Long-Term IncentiveProgram Participation Agreement previously signed by each executive upon appointment orelection. Mr. West was not required to sign the ECRCA because he is bound by non-disclosure,non-competition, non-solicitation and non-disparagement provisions under his employmentagreement.
See Columns (f) through (h) of the Grants of Plan-Based Awards table on page 66, Columns(i) and (j) of the Outstanding Equity Awards table on page 68 and Columns (d) and (e) of theOption Exercises and Stock Vested table on page 70 for more information about PSUs awarded tothe named executive officers.
How were the contingent target PSU grants for the 2009-2011 performance cycledesigned? What performance targets were set?
In February 2009, the Committee established a modified design for the 2009-2011 performancecycle based upon Mercer’s recommendations. Awards for the 2009-2011 performance cycle arebased upon the following metrics: three-year relative TSR versus the financial peer group (50% ofthe target award); three-year compound annual growth in adjusted earnings per share-diluted
53
measured against an internal target (12.5% of the target award); and annual growth in adjustedearnings per share-diluted measured against an internal target for each year of the three-yearperformance cycle (12.5% of the target award per year). The metrics approved by the Committeefor TSR provide target-level awards for achieving performance at the median (50th percentile) ofthe financial peer group. Targets for our compound three-year and 2009 annual growth rate inadjusted earnings per share-diluted reflected our publicly-announced financial expectations ofgrowth below our long-term goals of 6% to 8%. Excluding the impact of acquisitions, actualCompany results for 2009 of $2.16 adjusted earnings per share-diluted exceeded the target set for2009 adjusted earnings per share-diluted. Payment, if any, for awards will be made in shares ofthe Company’s Common Stock at the conclusion of the three-year performance cycle. TheCommittee will approve the targets for the annual adjusted earnings per share-diluted metrics forthe second and third years in the performance cycle at the beginning of those years. TheCommittee believes the annual setting of targets for a portion of the performance cycle provides astronger link between performance and payout in that the Committee can set performance targetsfor a portion of the award that reflects current business conditions at the start of each year. Themaximum award for any participant in the 2009-2011 performance cycle is 250% of the contingenttarget award.
On February 16, 2009, the Committee approved contingent target awards of PSUs under theIncentive Plan for the 2009-2011 performance cycle for the executive officers with the exception ofMr. West. On February 17, 2009, the independent directors as a group approved the Committee’srecommendation for a contingent target award of PSUs for the 2009-2011 performance cycle forMr. West consistent with the targets recommended by the Committee, as described above.
See Column (e) of the Summary Compensation Table for information relating to the value of PSUawards made to the named executive officers during 2009.
How are stock options used within the Company’s long-term incentive program?What process is followed in the granting of stock options?
Another important element of our long-term incentive compensation program is stock options.Stock options are designed to align the interests of executives with those of stockholders. Stockoptions generally are awarded annually to the Company’s senior executive group as well as toother key managerial and professional employees. Stock options entitle the holder to purchase afixed number of shares of Common Stock at a set price during a specified period of time. Becausestock options only have value if the value of our Common Stock increases, they encourage effortsto enhance long-term stockholder value.
The Committee sets guidelines for the number of stock options to be awarded based on the targettotal direct compensation package established in relation to the competitive compensation data. In2009, the number of stock options awarded to our executive officers was determined bymultiplying base pay by the “market-competitive option target level,” divided by the Black-Scholesvalue. The “market-competitive option target level” for each executive officer position is targetedto be one-half of the recipient’s long-term incentive compensation target award. The value of anoption is determined using the Black-Scholes option-pricing model, as described in Note 17 of theConsolidated Financial Statements contained in the 2009 Annual Report to Stockholders thataccompanies this proxy statement. The actual number of options awarded may vary from thetarget level based on an executive’s individual performance evaluation.
Stock options awarded in 2009 vest in equal increments over four years and have a ten-year term.As required by the Incentive Plan approved by the stockholders at the 2007 annual meeting of
54
stockholders, the options awarded in 2009 have an exercise price equal to the closing market priceof the Common Stock on the New York Stock Exchange on the date of award.
Stock options are awarded annually under the Incentive Plan to all eligible recipients; however,the Committee may elect not to award stock options in a given year. In addition, in order to haveflexibility to provide equity awards as recruitment, retention, performance recognition orpromotion awards, the Committee is authorized under the Incentive Plan to establish a stockoption pool, an RSU pool and a separate CEO discretionary equity pool (described below) for useby our CEO for such purposes. The pools are available for use for approximately 12 months fromthe date established and the Committee determines whether to establish any or all of these threepools annually. Options and RSUs remaining in any pool at the end of the period do not carry overto any pool established by the Committee for a subsequent period.
In February 2009, the Committee authorized the CEO to award up to 600,000 stock options andup to 100,000 RSUs from the stock option and RSU pools during the year. The Committee alsoauthorized a CEO discretionary equity pool for recruitment or retention purposes up to anaggregate value to the recipients (as measured at the time of grant) of $2 million in addition to thestock option and RSU pools. Recipients of awards from the CEO discretionary equity pool werepermitted to select a mix of options and/or RSUs equaling the value of the award. The value ofoption awards made from the pools is determined using the value determined for financialreporting purposes (the Black-Scholes value). The CEO may not make discretionary awards fromany pool to the Company’s executive officers. Stock option and RSU awards from the CEO pools aswell as awards from the CEO discretionary equity pool are made one time per month according toan annually pre-determined schedule and the exercise price for the options is based on the closingprice of our Common Stock on the date of the award. Individual awards in any month may notexceed 12,000 stock options or 7,500 RSUs without further approval by the Chair of theCommittee.
See Column (f) of the Summary Compensation Table, Columns (j) through (l) of the Grants ofPlan-Based Awards table, Columns (b) through (f) of the Outstanding Equity Awards table andColumns (b) and (c) of the Option Exercises and Stock Vested table for more information on stockoptions awarded to the named executive officers.
How are RSUs used within the long-term incentive program?
The Committee awards RSUs to executive officers and other senior executives from time to timeas special incentives. RSUs also are awarded to replace compensation forfeited by newly-hiredexecutive officers and key managers of the Company upon leaving a prior employer to joinHershey. In addition, in 2009 the Committee used a mix of RSUs and stock options in makingannual long-term incentive awards to eligible employees below the senior leadership level. EachRSU awarded under the Incentive Plan represents a value equal to that of a share of CommonStock. Generally RSUs vest if the award recipient remains in the Company’s employment for aprescribed period of time.
At the time of award, the Committee determines if an RSU award is payable upon vesting inshares of Common Stock, net of applicable taxes, or if the recipient may elect to receive paymentfor vested RSUs in cash or in shares of Common Stock, net of applicable taxes. The value forfinancial reporting purposes of an RSU payable in shares is based upon the closing price of theCommon Stock on the New York Stock Exchange on the grant date. The value for financialreporting purposes of an RSU payable in cash or shares is adjusted based upon the closing price ofthe Common Stock on the New York Stock Exchange at the end of each fiscal quarter.
During 2009, the Committee approved a special award of 2,500 RSUs for Mr. Bilbrey inrecognition of his leadership of the North American business unit. The award will vest in equalproportions over the next four years.
55
As described in the discussion of stock options, the Committee is authorized under the IncentivePlan to allocate a pool of RSUs for our CEO to use as recruitment, retention, performancerecognition or promotion awards. The Committee determines whether to establish an RSU poolannually. The Committee authorized a pool of up to 100,000 RSUs for 2009. In addition, RSUsmay also be awarded from the CEO discretionary equity pool established for recruitment orretention purposes. The CEO may not make discretionary awards from any of the pools to theCompany’s executive officers. RSUs remaining in the pool at the end of the period do not carryover to any pool established by the Committee for a subsequent period.
What retirement benefits are provided to the executive officers?
Executive officers participate in the same defined benefit pension and defined contribution 401(k)plans as do other salaried employees of the Company. Because the Internal Revenue Code rules donot permit the Company to use base salary and other compensation paid above certain limitationsin determining the benefits earned by the executive officers under tax-qualified plans, theCompany maintains a defined benefit Supplemental Executive Retirement Plan, or DB SERP, adefined contribution Supplemental Executive Retirement Plan, or DC SERP, and a DeferredCompensation Plan to provide these and additional benefits. The Company believes that the DBSERP, DC SERP and Deferred Compensation Plan help attract and retain executive talent, assimilar plans are often components of the executive compensation programs within our financialpeer group. The DC SERP was established as part of our Deferred Compensation Plan and is not aseparate plan.
See the Pension Benefits table and accompanying narrative beginning on page 71 and theNon-Qualified Deferred Compensation table and accompanying narrative beginning on page 73 formore information regarding the DB SERP, DC SERP and retirement benefits.
What role do executive perquisites play in the total compensation package for theexecutive officers?
Executive perquisites are kept by the Committee to a minimal level relative to an executive’s totalcompensation and do not play a significant role in our executive compensation. See the footnotesto Column (i) of the Summary Compensation Table for information regarding the perquisitesreceived by our named executive officers.
In addition, our CEO and the other named executive officers are eligible to participate in our GiftMatching Program on the same basis as other employees, retirees or their spouses. Through theGift Matching Program, we match contributions made to one or more accredited colleges oruniversities on a dollar-for-dollar basis up to a maximum aggregate contribution of $5,000annually.
Has the Company entered into any employment agreements, severance or changein control agreements with its executive officers?
We have not entered into employment agreements with any named executive officer other thanMr. West.
We entered into an employment agreement with Mr. West upon his promotion to President andCEO in 2007. The Committee and independent members of the Board determined that doing sowas appropriate in light of the fact that we had entered into an employment agreement withMr. West’s predecessor, and believed we would have been required to enter into an employment
56
agreement with any individual recruited to become our CEO from another company. Wedetermined the terms of Mr. West’s employment agreement by reference to the benchmarking wehad done with respect to Mr. West’s predecessor.
Mr. West’s employment agreement has been amended twice. In February 2008, the Boardapproved an amendment to Mr. West’s employment agreement to reduce the lump-sum severanceamount payable to him if his employment with the Company is terminated as a result of a changein control from three times the sum of annual base salary and annual incentive pay to two timesthe sum of annual base salary and annual incentive pay. In December 2008, the Board approvedan additional amendment to Mr. West’s employment agreement to conform its terms to therequirements of Code section 409A.
We provide an Executive Benefits Protection Plan, or EBPP, for the named executive officers. Theterms of the plan generally provide that a covered executive, whose employment with theCompany terminates within two years after a change in control of the Company, is entitled tocertain severance payments and benefits. The EBPP also provides severance benefits in the eventof involuntary termination unrelated to a change in control. The EBPP was amended in February2008 to reduce the severance benefit in a manner comparable to the amendment to Mr. West’semployment agreement. The EBPP was further amended in 2009 as part of Company-widechanges to our severance programs that included the addition of pro rata vesting of long-termincentive awards and lump sum settlement of severance benefits upon qualifying termination ofemployment, along with reductions in certain severance benefits. In addition, the EBPP was alsoamended to limit the applicability of the excise tax gross-up feature to only those circumstanceswhere the total payments potentially subject to the excise tax exceed by more than 10% the levelat which the excise tax payments are required. The EBPP is intended to help us attract and retainqualified management employees and maintain a stable work environment in connection with achange in control.
See the discussion beginning on page 76 for information regarding Mr. West’s employmentagreement and potential payments due to him and the other named executive officers in the eventof termination of employment or a change in control.
Have any further changes been made to the CPG or financial peer groups during 2009or since the end of 2009 which impact the Committee’s decision-making? Why werethese changes made?
As described on pages 45 and 46, the Committee relies upon Mercer to provide benchmarking forsenior executives and utilizes consumer products companies that are part of Mercer’s proprietarydatabase as the basis for the primary peer group (the CPG peer group). The participants in thesurvey that Mercer uses to generate the database vary over time, with some companies choosingto participate every two to three years, rather than every year. As a result, the composition ofMercer’s database changes each year. Due to changes in survey participants, Mercerrecommended and the Committee approved changes to the CPG peer group to be used inconnection with compensation decisions made for 2010. The CPG peer group for 2010 will havethe 40 companies listed below, one fewer than the group used for 2009. Of the 40 companies, 28were included in the 2009 CPG peer group. The 40 companies in the group have a median revenueof $6 billion. The Committee believes the CPG peer group continues to contain organizations thathave comparable business characteristics to the Company in that the peer group focuses on foodand beverage companies which are the Company’s key talent and business competitors.
57

Companies included in the 2010 CPG peer group are as follows:
ACH Food Companies, Inc. H.J. Heinz Company Reckitt Benckiser, Inc.Bacardi U.S.A., Inc. Kellogg Company Reynolds American, Inc.Bob Evans Farms, Inc. Keystone Foods LLC Rich Products CorporationBrown-Forman Corporation Kimberly-Clark Corporation Riviana Foods Inc.California Pizza Kitchen, Inc. Lance, Inc. Sara Lee CorporationChiquita Brands International, Inc. Land O’Lakes, Inc. The Coca-Cola CompanyColgate-Palmolive Company Mars North America The Dannon Company, Inc.ConAgra Foods, Inc. McDonald’s Corporation The Estée Lauder Companies Inc.Darden Restaurants, Inc. MillerCoors LLC The Schwan Food CompanyDean Foods Company Molson Coors Brewing Company Unilever United States, Inc.Del Monte Foods Company Nestlé USA, Inc. Wells’ Dairy, Inc.Dole Food Company, Inc. Ocean Spray Cranberries, Inc. Wendy’s/Arby’s Group, Inc.Dunkin’ Brands, Inc. Ralcorp Holdings, Inc. Wm. Wrigley Jr. CompanyFarmland Foods, Inc.
As discussed above, based on changes in participants in the survey that Mercer uses to generatetheir proprietary database and the consolidation of reporting by two of the companies in the 2009database (Wendy’s International, Inc. and Arby’s Restaurant Group, Inc.) a total of 40 companiesare included in the 2010 CPG peer group. The 12 companies added to the 2009 CPG peer groupare as follows:
ACH Food Companies, Inc. Lance, Inc.Bacardi U.S.A., Inc. MillerCoors LLCBrown-Forman Corporation Molson Coors Brewing CompanyDean Foods Company Ocean Spray Cranberries, Inc.Dole Food Company, Inc. Riviana Foods Inc.Keystone Foods LLC The Dannon Company, Inc.
The 12 companies deleted from the 2009 CPG peer group are as follows:
Anheuser-Busch Companies, Inc. Pernod Ricard USA, LLCBurger King Holdings, Inc. S. C. Johnson & Son, Inc.Energizer Holdings, Inc. Smithfield Foods, Inc.International Dairy Queen, Inc. Tyson Foods, Inc.Interstate Bakeries Corporation Welch Foods, Inc.Jack in the Box Inc. Yum! Brands, Inc.
Based upon the acquisition of Cadbury plc by Kraft Foods Inc., the Committee removedCadbury plc from the financial peer group for the purpose of measuring three-year relative TSRfor the 2010-2012 performance cycle PSU awards. Data from Cadbury plc was included in thefinancial performance and compensation data provided by Mercer for the financial peer group thatwas used by the Committee as a secondary reference point in assessing 2010 compensation levelsfor Hershey’s executive officers.
Have there been any other actions with respect to executive compensation sincethe end of 2009?
Based upon the recommendation of the Committee, the independent directors of the Boardapproved a 3% increase to Mr. West’s base salary and an increase in his annual incentive awardtarget from 100% to 120% of base salary. The Committee approved increases in base salaryaveraging 4% for all of the executive officers reporting to Mr. West, and an increase in the annualand long-term incentive award targets for Messrs. Bilbrey and O’Day. These changes move
58
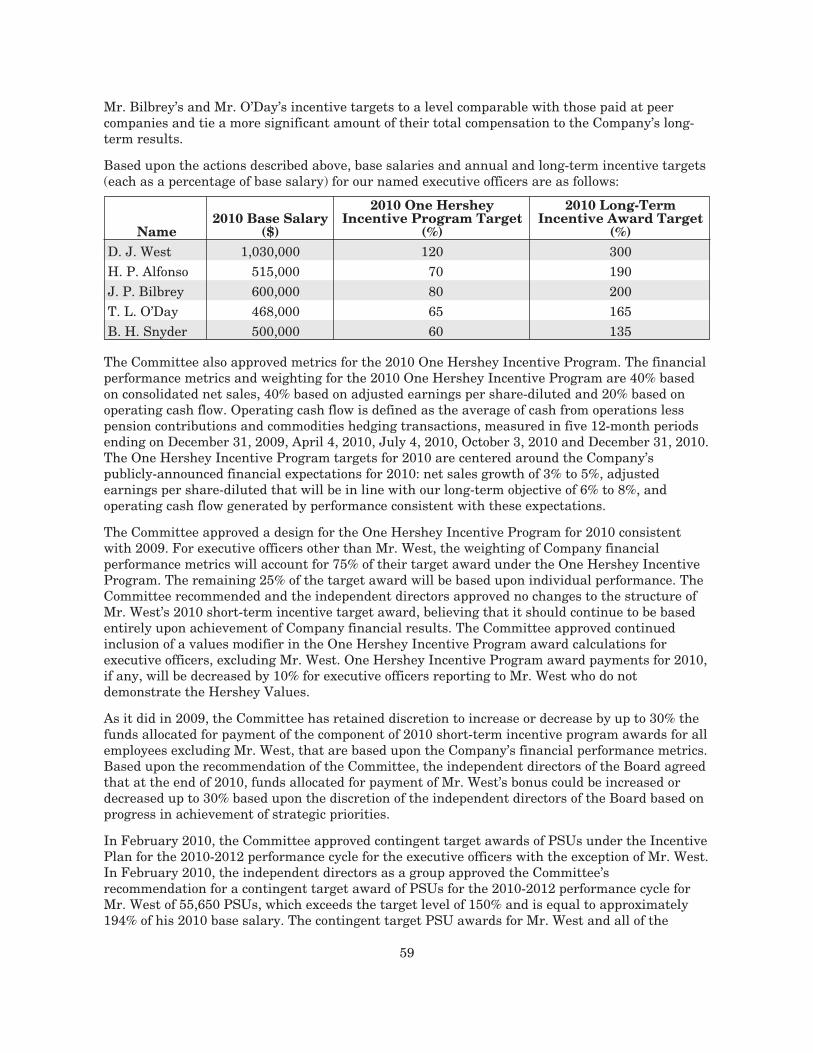
Mr. Bilbrey’s and Mr. O’Day’s incentive targets to a level comparable with those paid at peercompanies and tie a more significant amount of their total compensation to the Company’s long-term results.
Based upon the actions described above, base salaries and annual and long-term incentive targets(each as a percentage of base salary) for our named executive officers are as follows:
Name2010 Base Salary
($)
2010 One HersheyIncentive Program Target
(%)
2010 Long-TermIncentive Award Target
(%)D. J. West 1,030,000 120 300H. P. Alfonso 515,000 70 190J. P. Bilbrey 600,000 80 200T. L. O’Day 468,000 65 165B. H. Snyder 500,000 60 135
The Committee also approved metrics for the 2010 One Hershey Incentive Program. The financialperformance metrics and weighting for the 2010 One Hershey Incentive Program are 40% basedon consolidated net sales, 40% based on adjusted earnings per share-diluted and 20% based onoperating cash flow. Operating cash flow is defined as the average of cash from operations lesspension contributions and commodities hedging transactions, measured in five 12-month periodsending on December 31, 2009, April 4, 2010, July 4, 2010, October 3, 2010 and December 31, 2010.The One Hershey Incentive Program targets for 2010 are centered around the Company’spublicly-announced financial expectations for 2010: net sales growth of 3% to 5%, adjustedearnings per share-diluted that will be in line with our long-term objective of 6% to 8%, andoperating cash flow generated by performance consistent with these expectations.
The Committee approved a design for the One Hershey Incentive Program for 2010 consistentwith 2009. For executive officers other than Mr. West, the weighting of Company financialperformance metrics will account for 75% of their target award under the One Hershey IncentiveProgram. The remaining 25% of the target award will be based upon individual performance. TheCommittee recommended and the independent directors approved no changes to the structure ofMr. West’s 2010 short-term incentive target award, believing that it should continue to be basedentirely upon achievement of Company financial results. The Committee approved continuedinclusion of a values modifier in the One Hershey Incentive Program award calculations forexecutive officers, excluding Mr. West. One Hershey Incentive Program award payments for 2010,if any, will be decreased by 10% for executive officers reporting to Mr. West who do notdemonstrate the Hershey Values.
As it did in 2009, the Committee has retained discretion to increase or decrease by up to 30% thefunds allocated for payment of the component of 2010 short-term incentive program awards for allemployees excluding Mr. West, that are based upon the Company’s financial performance metrics.Based upon the recommendation of the Committee, the independent directors of the Board agreedthat at the end of 2010, funds allocated for payment of Mr. West’s bonus could be increased ordecreased up to 30% based upon the discretion of the independent directors of the Board based onprogress in achievement of strategic priorities.
In February 2010, the Committee approved contingent target awards of PSUs under the IncentivePlan for the 2010-2012 performance cycle for the executive officers with the exception of Mr. West.In February 2010, the independent directors as a group approved the Committee’srecommendation for a contingent target award of PSUs for the 2010-2012 performance cycle forMr. West of 55,650 PSUs, which exceeds the target level of 150% and is equal to approximately194% of his 2010 base salary. The contingent target PSU awards for Mr. West and all of the
59
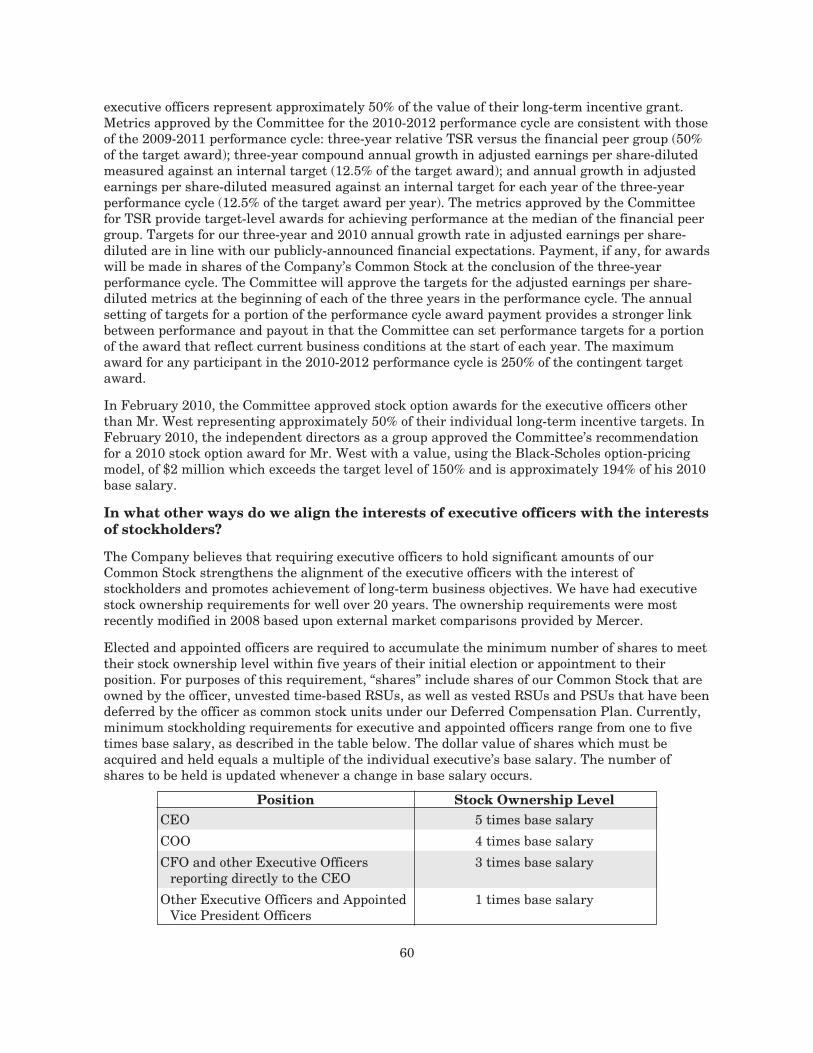
executive officers represent approximately 50% of the value of their long-term incentive grant.Metrics approved by the Committee for the 2010-2012 performance cycle are consistent with thoseof the 2009-2011 performance cycle: three-year relative TSR versus the financial peer group (50%of the target award); three-year compound annual growth in adjusted earnings per share-dilutedmeasured against an internal target (12.5% of the target award); and annual growth in adjustedearnings per share-diluted measured against an internal target for each year of the three-yearperformance cycle (12.5% of the target award per year). The metrics approved by the Committeefor TSR provide target-level awards for achieving performance at the median of the financial peergroup. Targets for our three-year and 2010 annual growth rate in adjusted earnings per share-diluted are in line with our publicly-announced financial expectations. Payment, if any, for awardswill be made in shares of the Company’s Common Stock at the conclusion of the three-yearperformance cycle. The Committee will approve the targets for the adjusted earnings per share-diluted metrics at the beginning of each of the three years in the performance cycle. The annualsetting of targets for a portion of the performance cycle award payment provides a stronger linkbetween performance and payout in that the Committee can set performance targets for a portionof the award that reflect current business conditions at the start of each year. The maximumaward for any participant in the 2010-2012 performance cycle is 250% of the contingent targetaward.
In February 2010, the Committee approved stock option awards for the executive officers otherthan Mr. West representing approximately 50% of their individual long-term incentive targets. InFebruary 2010, the independent directors as a group approved the Committee’s recommendationfor a 2010 stock option award for Mr. West with a value, using the Black-Scholes option-pricingmodel, of $2 million which exceeds the target level of 150% and is approximately 194% of his 2010base salary.
In what other ways do we align the interests of executive officers with the interestsof stockholders?
The Company believes that requiring executive officers to hold significant amounts of ourCommon Stock strengthens the alignment of the executive officers with the interest ofstockholders and promotes achievement of long-term business objectives. We have had executivestock ownership requirements for well over 20 years. The ownership requirements were mostrecently modified in 2008 based upon external market comparisons provided by Mercer.
Elected and appointed officers are required to accumulate the minimum number of shares to meettheir stock ownership level within five years of their initial election or appointment to theirposition. For purposes of this requirement, “shares” include shares of our Common Stock that areowned by the officer, unvested time-based RSUs, as well as vested RSUs and PSUs that have beendeferred by the officer as common stock units under our Deferred Compensation Plan. Currently,minimum stockholding requirements for executive and appointed officers range from one to fivetimes base salary, as described in the table below. The dollar value of shares which must beacquired and held equals a multiple of the individual executive’s base salary. The number ofshares to be held is updated whenever a change in base salary occurs.
Position Stock Ownership LevelCEO 5 times base salary
COO 4 times base salary
CFO and other Executive Officersreporting directly to the CEO
3 times base salary
Other Executive Officers and AppointedVice President Officers
1 times base salary
60
Failure to reach the minimum within the five-year period results in a notification letter to theexecutive, with a copy to the CEO, and a requirement that future stock option exercises and PSUpayments be settled by retaining at least 50% of the shares of Common Stock received until theminimum ownership level is reached. The Committee receives an annual summary of eachindividual officer’s ownership status to monitor compliance.
As of March 8, 2010, the record date for the annual meeting, the value of Common Stock owned byMr. West totaled approximately 2.7 times his base salary. He is required to accumulate sharesequal to five times his base salary by October 2, 2012.
Compensation Committee Report
To Our Stockholders:
We have reviewed and discussed with management the Compensation Discussion and Analysis,beginning on page 43. Based on that review and discussion, we have recommended to the Board ofDirectors that the Compensation Discussion and Analysis be included in this proxy statement.
Submitted by the Compensation and Executive Organization Committee of the Board of Directors:
Robert F. Cavanaugh, ChairJames E. NevelsDavid L. Shedlarz
The independent members of the Board of Directors who are not members of the Compensationand Executive Organization Committee join in the Compensation Committee Report with respectto the approval of Mr. West’s compensation.
Charles A. DavisThomas J. RidgeLeRoy S. Zimmerman
61
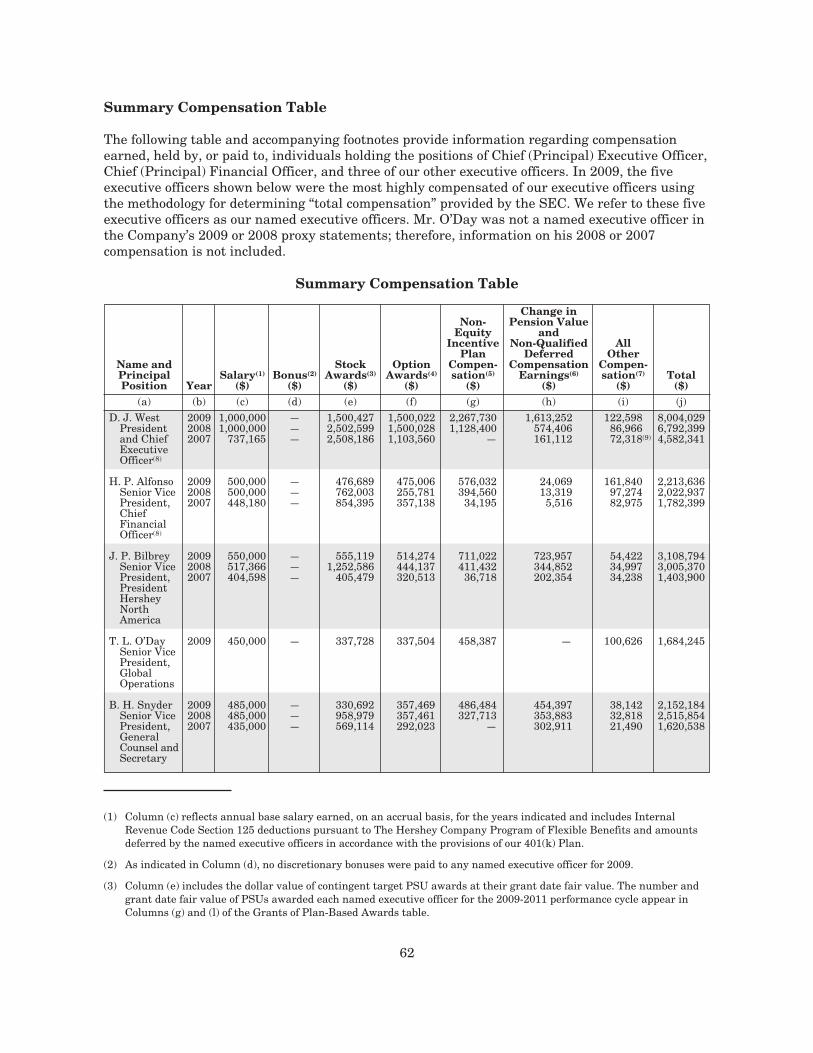
Summary Compensation Table
The following table and accompanying footnotes provide information regarding compensationearned, held by, or paid to, individuals holding the positions of Chief (Principal) Executive Officer,Chief (Principal) Financial Officer, and three of our other executive officers. In 2009, the fiveexecutive officers shown below were the most highly compensated of our executive officers usingthe methodology for determining “total compensation” provided by the SEC. We refer to these fiveexecutive officers as our named executive officers. Mr. O’Day was not a named executive officer inthe Company’s 2009 or 2008 proxy statements; therefore, information on his 2008 or 2007compensation is not included.
Summary Compensation Table
Name andPrincipalPosition Year
Salary(1)
($)Bonus(2)
($)
StockAwards(3)
($)
OptionAwards(4)
($)
Non-Equity
IncentivePlan
Compen-sation(5)
($)
Change inPension Value
andNon-Qualified
DeferredCompensation
Earnings(6)
($)
AllOther
Compen-sation(7)
($)Total
($)(a) (b) (c) (d) (e) (f) (g) (h) (i) (j)
D. J. WestPresidentand ChiefExecutiveOfficer(8)
200920082007
1,000,0001,000,000
737,165
———
1,500,4272,502,5992,508,186
1,500,0221,500,0281,103,560
2,267,7301,128,400
—
1,613,252574,406161,112
122,59886,96672,318(9)
8,004,0296,792,3994,582,341
H. P. AlfonsoSenior VicePresident,ChiefFinancialOfficer(8)
200920082007
500,000500,000448,180
———
476,689762,003854,395
475,006255,781357,138
576,032394,560
34,195
24,06913,319
5,516
161,84097,27482,975
2,213,6362,022,9371,782,399
J. P. BilbreySenior VicePresident,PresidentHersheyNorthAmerica
200920082007
550,000517,366404,598
———
555,1191,252,586
405,479
514,274444,137320,513
711,022411,432
36,718
723,957344,852202,354
54,42234,99734,238
3,108,7943,005,3701,403,900
T. L. O’DaySenior VicePresident,GlobalOperations
2009 450,000 — 337,728 337,504 458,387 — 100,626 1,684,245
B. H. SnyderSenior VicePresident,GeneralCounsel andSecretary
200920082007
485,000485,000435,000
———
330,692958,979569,114
357,469357,461292,023
486,484327,713
—
454,397353,883302,911
38,14232,81821,490
2,152,1842,515,8541,620,538
(1) Column (c) reflects annual base salary earned, on an accrual basis, for the years indicated and includes InternalRevenue Code Section 125 deductions pursuant to The Hershey Company Program of Flexible Benefits and amountsdeferred by the named executive officers in accordance with the provisions of our 401(k) Plan.
(2) As indicated in Column (d), no discretionary bonuses were paid to any named executive officer for 2009.
(3) Column (e) includes the dollar value of contingent target PSU awards at their grant date fair value. The number andgrant date fair value of PSUs awarded each named executive officer for the 2009-2011 performance cycle appear inColumns (g) and (l) of the Grants of Plan-Based Awards table.
62
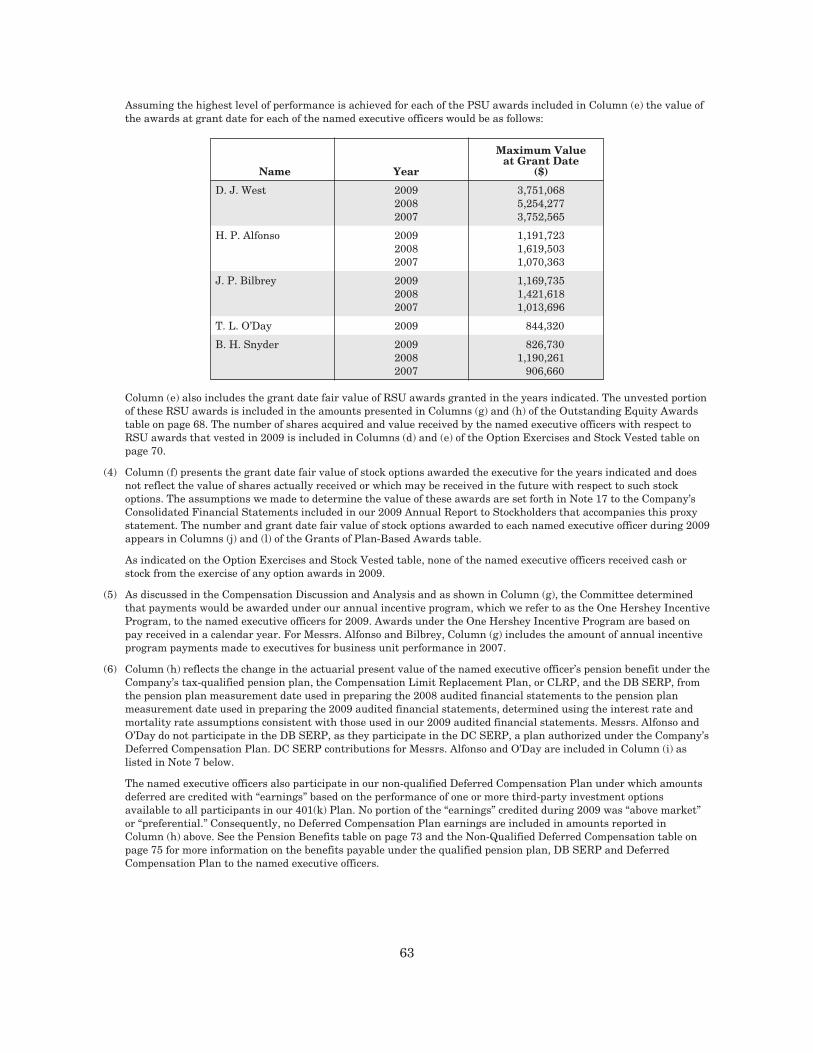
Assuming the highest level of performance is achieved for each of the PSU awards included in Column (e) the value ofthe awards at grant date for each of the named executive officers would be as follows:
Name Year
Maximum Valueat Grant Date
($)
D. J. West 2009 3,751,0682008 5,254,2772007 3,752,565
H. P. Alfonso 2009 1,191,7232008 1,619,5032007 1,070,363
J. P. Bilbrey 2009 1,169,7352008 1,421,6182007 1,013,696
T. L. O’Day 2009 844,320
B. H. Snyder 2009 826,7302008 1,190,2612007 906,660
Column (e) also includes the grant date fair value of RSU awards granted in the years indicated. The unvested portionof these RSU awards is included in the amounts presented in Columns (g) and (h) of the Outstanding Equity Awardstable on page 68. The number of shares acquired and value received by the named executive officers with respect toRSU awards that vested in 2009 is included in Columns (d) and (e) of the Option Exercises and Stock Vested table onpage 70.
(4) Column (f) presents the grant date fair value of stock options awarded the executive for the years indicated and doesnot reflect the value of shares actually received or which may be received in the future with respect to such stockoptions. The assumptions we made to determine the value of these awards are set forth in Note 17 to the Company’sConsolidated Financial Statements included in our 2009 Annual Report to Stockholders that accompanies this proxystatement. The number and grant date fair value of stock options awarded to each named executive officer during 2009appears in Columns (j) and (l) of the Grants of Plan-Based Awards table.
As indicated on the Option Exercises and Stock Vested table, none of the named executive officers received cash orstock from the exercise of any option awards in 2009.
(5) As discussed in the Compensation Discussion and Analysis and as shown in Column (g), the Committee determinedthat payments would be awarded under our annual incentive program, which we refer to as the One Hershey IncentiveProgram, to the named executive officers for 2009. Awards under the One Hershey Incentive Program are based onpay received in a calendar year. For Messrs. Alfonso and Bilbrey, Column (g) includes the amount of annual incentiveprogram payments made to executives for business unit performance in 2007.
(6) Column (h) reflects the change in the actuarial present value of the named executive officer’s pension benefit under theCompany’s tax-qualified pension plan, the Compensation Limit Replacement Plan, or CLRP, and the DB SERP, fromthe pension plan measurement date used in preparing the 2008 audited financial statements to the pension planmeasurement date used in preparing the 2009 audited financial statements, determined using the interest rate andmortality rate assumptions consistent with those used in our 2009 audited financial statements. Messrs. Alfonso andO’Day do not participate in the DB SERP, as they participate in the DC SERP, a plan authorized under the Company’sDeferred Compensation Plan. DC SERP contributions for Messrs. Alfonso and O’Day are included in Column (i) aslisted in Note 7 below.
The named executive officers also participate in our non-qualified Deferred Compensation Plan under which amountsdeferred are credited with “earnings” based on the performance of one or more third-party investment optionsavailable to all participants in our 401(k) Plan. No portion of the “earnings” credited during 2009 was “above market”or “preferential.” Consequently, no Deferred Compensation Plan earnings are included in amounts reported inColumn (h) above. See the Pension Benefits table on page 73 and the Non-Qualified Deferred Compensation table onpage 75 for more information on the benefits payable under the qualified pension plan, DB SERP and DeferredCompensation Plan to the named executive officers.
63
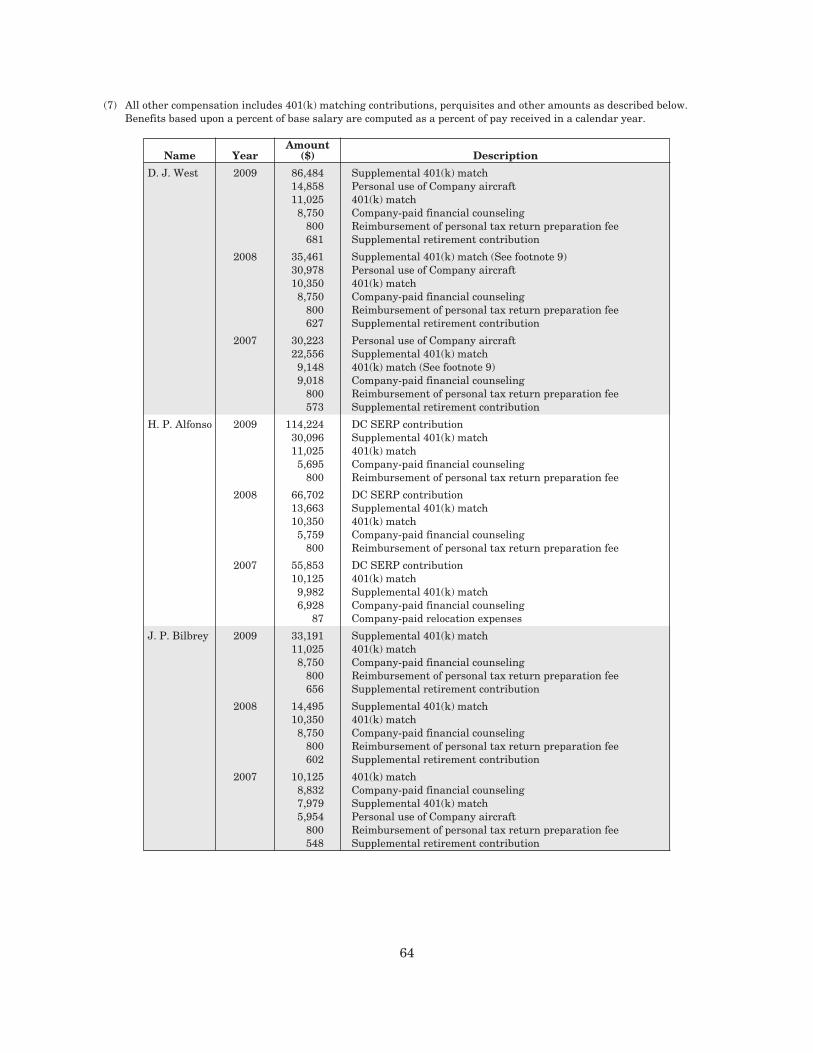
(7) All other compensation includes 401(k) matching contributions, perquisites and other amounts as described below.Benefits based upon a percent of base salary are computed as a percent of pay received in a calendar year.
Name YearAmount
($) Description
D. J. West 2009 86,48414,85811,025
8,750800681
Supplemental 401(k) matchPersonal use of Company aircraft401(k) matchCompany-paid financial counselingReimbursement of personal tax return preparation feeSupplemental retirement contribution
2008 35,46130,97810,350
8,750800627
Supplemental 401(k) match (See footnote 9)Personal use of Company aircraft401(k) matchCompany-paid financial counselingReimbursement of personal tax return preparation feeSupplemental retirement contribution
2007 30,22322,556
9,1489,018
800573
Personal use of Company aircraftSupplemental 401(k) match401(k) match (See footnote 9)Company-paid financial counselingReimbursement of personal tax return preparation feeSupplemental retirement contribution
H. P. Alfonso 2009 114,22430,09611,025
5,695800
DC SERP contributionSupplemental 401(k) match401(k) matchCompany-paid financial counselingReimbursement of personal tax return preparation fee
2008 66,70213,66310,350
5,759800
DC SERP contributionSupplemental 401(k) match401(k) matchCompany-paid financial counselingReimbursement of personal tax return preparation fee
2007 55,85310,125
9,9826,928
87
DC SERP contribution401(k) matchSupplemental 401(k) matchCompany-paid financial counselingCompany-paid relocation expenses
J. P. Bilbrey 2009 33,19111,025
8,750800656
Supplemental 401(k) match401(k) matchCompany-paid financial counselingReimbursement of personal tax return preparation feeSupplemental retirement contribution
2008 14,49510,350
8,750800602
Supplemental 401(k) match401(k) matchCompany-paid financial counselingReimbursement of personal tax return preparation feeSupplemental retirement contribution
2007 10,1258,8327,9795,954
800548
401(k) matchCompany-paid financial counselingSupplemental 401(k) matchPersonal use of Company aircraftReimbursement of personal tax return preparation feeSupplemental retirement contribution
64
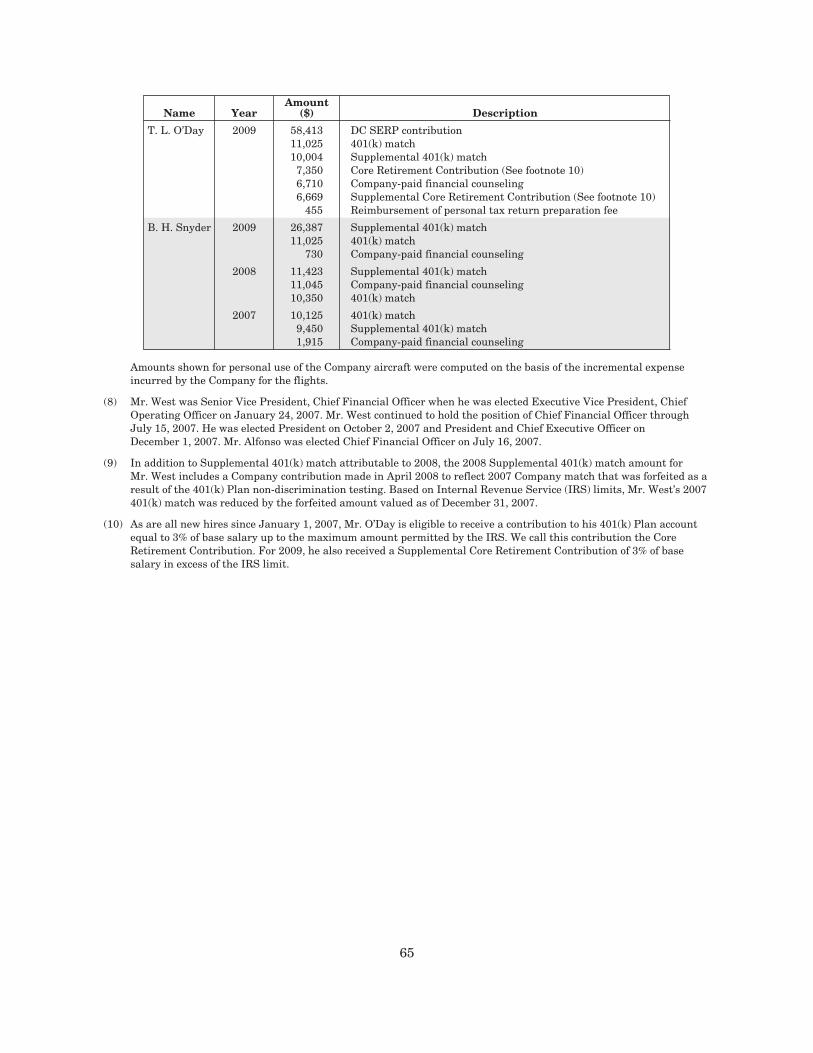
Name YearAmount
($) Description
T. L. O’Day 2009 58,41311,02510,004
7,3506,7106,669
455
DC SERP contribution401(k) matchSupplemental 401(k) matchCore Retirement Contribution (See footnote 10)Company-paid financial counselingSupplemental Core Retirement Contribution (See footnote 10)Reimbursement of personal tax return preparation fee
B. H. Snyder 2009 26,38711,025
730
Supplemental 401(k) match401(k) matchCompany-paid financial counseling
2008 11,42311,04510,350
Supplemental 401(k) matchCompany-paid financial counseling401(k) match
2007 10,1259,4501,915
401(k) matchSupplemental 401(k) matchCompany-paid financial counseling
Amounts shown for personal use of the Company aircraft were computed on the basis of the incremental expenseincurred by the Company for the flights.
(8) Mr. West was Senior Vice President, Chief Financial Officer when he was elected Executive Vice President, ChiefOperating Officer on January 24, 2007. Mr. West continued to hold the position of Chief Financial Officer throughJuly 15, 2007. He was elected President on October 2, 2007 and President and Chief Executive Officer onDecember 1, 2007. Mr. Alfonso was elected Chief Financial Officer on July 16, 2007.
(9) In addition to Supplemental 401(k) match attributable to 2008, the 2008 Supplemental 401(k) match amount forMr. West includes a Company contribution made in April 2008 to reflect 2007 Company match that was forfeited as aresult of the 401(k) Plan non-discrimination testing. Based on Internal Revenue Service (IRS) limits, Mr. West’s 2007401(k) match was reduced by the forfeited amount valued as of December 31, 2007.
(10) As are all new hires since January 1, 2007, Mr. O’Day is eligible to receive a contribution to his 401(k) Plan accountequal to 3% of base salary up to the maximum amount permitted by the IRS. We call this contribution the CoreRetirement Contribution. For 2009, he also received a Supplemental Core Retirement Contribution of 3% of basesalary in excess of the IRS limit.
65
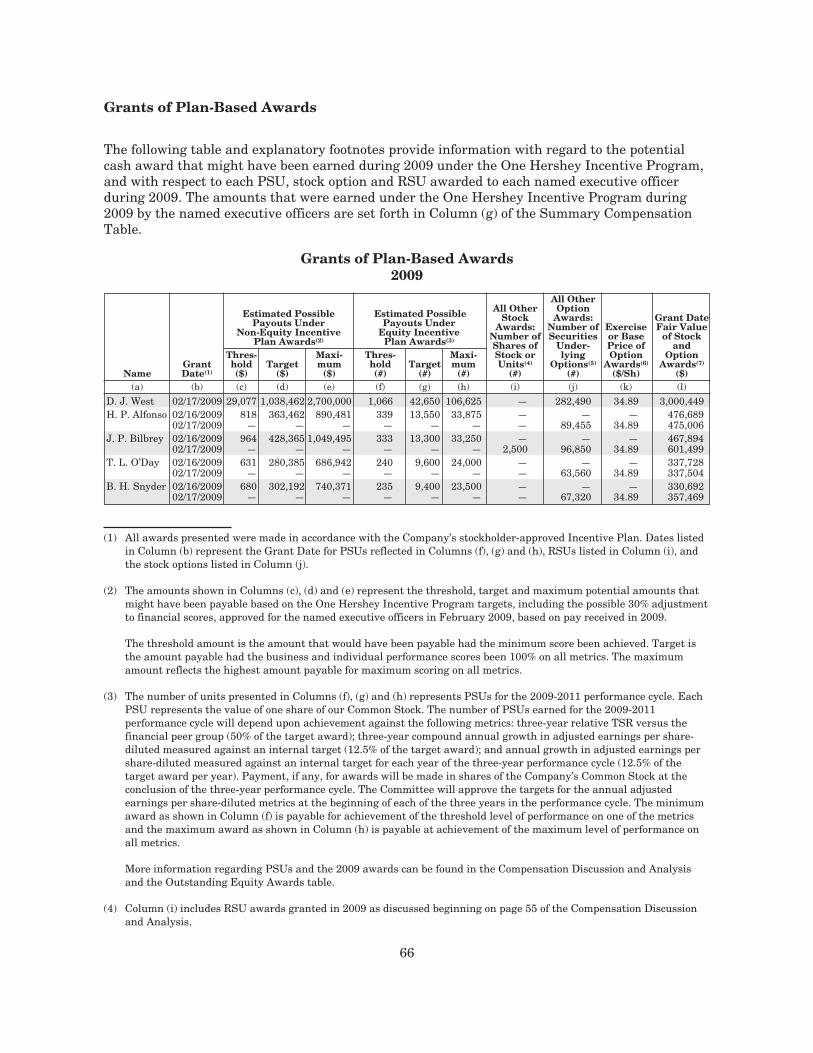
Grants of Plan-Based Awards
The following table and explanatory footnotes provide information with regard to the potentialcash award that might have been earned during 2009 under the One Hershey Incentive Program,and with respect to each PSU, stock option and RSU awarded to each named executive officerduring 2009. The amounts that were earned under the One Hershey Incentive Program during2009 by the named executive officers are set forth in Column (g) of the Summary CompensationTable.
Grants of Plan-Based Awards2009
NameGrantDate(1)
Estimated PossiblePayouts Under
Non-Equity IncentivePlan Awards(2)
Estimated PossiblePayouts Under
Equity IncentivePlan Awards(3)
All OtherStock
Awards:Number ofShares ofStock orUnits(4)
(#)
All OtherOption
Awards:Number ofSecurities
Under-lying
Options(5)
(#)
Exerciseor BasePrice ofOption
Awards(6)
($/Sh)
Grant DateFair Value
of Stockand
OptionAwards(7)
($)
Thres-hold($)
Target($)
Maxi-mum
($)
Thres-hold(#)
Target(#)
Maxi-mum
(#)(a) (b) (c) (d) (e) (f) (g) (h) (i) (j) (k) (l)
D. J. West 02/17/2009 29,077 1,038,462 2,700,000 1,066 42,650 106,625 — 282,490 34.89 3,000,449H. P. Alfonso 02/16/2009 818 363,462 890,481 339 13,550 33,875 — — — 476,689
02/17/2009 — — — — — — — 89,455 34.89 475,006J. P. Bilbrey 02/16/2009 964 428,365 1,049,495 333 13,300 33,250 — — — 467,894
02/17/2009 — — — — — — 2,500 96,850 34.89 601,499T. L. O’Day 02/16/2009 631 280,385 686,942 240 9,600 24,000 — — — 337,728
02/17/2009 — — — — — — — 63,560 34.89 337,504B. H. Snyder 02/16/2009 680 302,192 740,371 235 9,400 23,500 — — — 330,692
02/17/2009 — — — — — — — 67,320 34.89 357,469
(1) All awards presented were made in accordance with the Company’s stockholder-approved Incentive Plan. Dates listedin Column (b) represent the Grant Date for PSUs reflected in Columns (f), (g) and (h), RSUs listed in Column (i), andthe stock options listed in Column (j).
(2) The amounts shown in Columns (c), (d) and (e) represent the threshold, target and maximum potential amounts thatmight have been payable based on the One Hershey Incentive Program targets, including the possible 30% adjustmentto financial scores, approved for the named executive officers in February 2009, based on pay received in 2009.
The threshold amount is the amount that would have been payable had the minimum score been achieved. Target isthe amount payable had the business and individual performance scores been 100% on all metrics. The maximumamount reflects the highest amount payable for maximum scoring on all metrics.
(3) The number of units presented in Columns (f), (g) and (h) represents PSUs for the 2009-2011 performance cycle. EachPSU represents the value of one share of our Common Stock. The number of PSUs earned for the 2009-2011performance cycle will depend upon achievement against the following metrics: three-year relative TSR versus thefinancial peer group (50% of the target award); three-year compound annual growth in adjusted earnings per share-diluted measured against an internal target (12.5% of the target award); and annual growth in adjusted earnings pershare-diluted measured against an internal target for each year of the three-year performance cycle (12.5% of thetarget award per year). Payment, if any, for awards will be made in shares of the Company’s Common Stock at theconclusion of the three-year performance cycle. The Committee will approve the targets for the annual adjustedearnings per share-diluted metrics at the beginning of each of the three years in the performance cycle. The minimumaward as shown in Column (f) is payable for achievement of the threshold level of performance on one of the metricsand the maximum award as shown in Column (h) is payable at achievement of the maximum level of performance onall metrics.
More information regarding PSUs and the 2009 awards can be found in the Compensation Discussion and Analysisand the Outstanding Equity Awards table.
(4) Column (i) includes RSU awards granted in 2009 as discussed beginning on page 55 of the Compensation Discussionand Analysis.
66
(5) The number of options awarded to each named executive officer on February 17, 2009 was calculated as one-half of theexecutive’s long-term incentive target percentage times his 2009 base salary divided by the Black-Scholes value of$5.31 for each option. The Black-Scholes value is based on the $34.89 exercise price for these options determined as theclosing price of the Company’s Common Stock on the award date, February 17, 2009.
All options awarded by the Company have a ten-year term, subject to earlier expiration in the event of termination ofemployment, and vest in 25% increments over four years, subject to acceleration in the event of a change in control ofthe Company and continued vesting in the event of retirement, death or disability.
More information regarding stock options and the 2009 award can be found in the Compensation Discussion andAnalysis and the Outstanding Equity Awards table below.
(6) This column presents the exercise price for each option award based upon the closing price of the Company’s CommonStock on the New York Stock Exchange on the award date shown in Column (b).
(7) Column (l) presents the aggregate grant date fair value of the target number of PSUs reported in Column (g), grantdate fair value of RSU awards reported in Column (i) and the stock options reported in Column (j), as determined inaccordance with Financial Accounting Standards Board Accounting Standards Codification Topic 718. Theassumptions used in determining these amounts are set forth in Note 17 to the Company’s Consolidated FinancialStatements included in our 2009 Annual Report to Stockholders that accompanies this proxy statement.
67
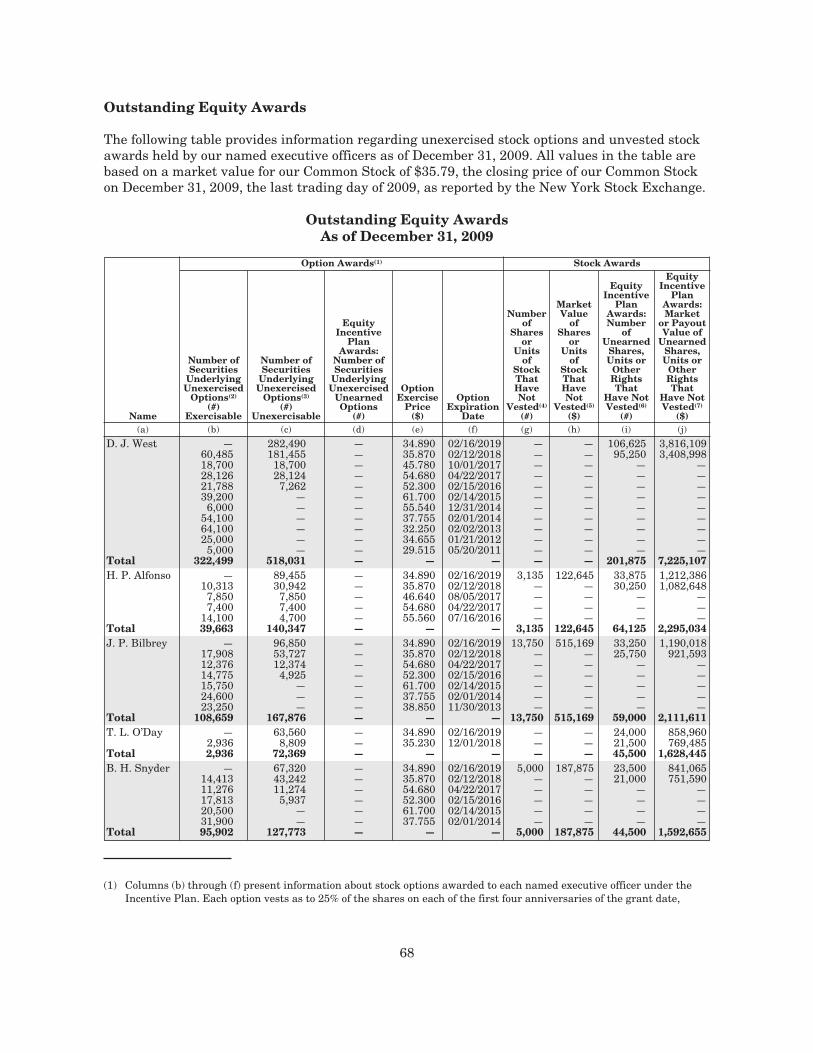
Outstanding Equity Awards
The following table provides information regarding unexercised stock options and unvested stockawards held by our named executive officers as of December 31, 2009. All values in the table arebased on a market value for our Common Stock of $35.79, the closing price of our Common Stockon December 31, 2009, the last trading day of 2009, as reported by the New York Stock Exchange.
Outstanding Equity AwardsAs of December 31, 2009
Name
Option Awards(1) Stock Awards
Number ofSecurities
UnderlyingUnexercised
Options(2)
(#)Exercisable
Number ofSecurities
UnderlyingUnexercised
Options(3)
(#)Unexercisable
EquityIncentive
PlanAwards:
Number ofSecurities
UnderlyingUnexercised
UnearnedOptions
(#)
OptionExercise
Price($)
OptionExpiration
Date
Numberof
Sharesor
Unitsof
StockThatHaveNot
Vested(4)
(#)
MarketValue
ofShares
orUnits
ofStockThatHaveNot
Vested(5)
($)
EquityIncentive
PlanAwards:Number
ofUnearned
Shares,Units or
OtherRightsThat
Have NotVested(6)
(#)
EquityIncentive
PlanAwards:Market
or PayoutValue of
UnearnedShares,Units or
OtherRightsThat
Have NotVested(7)
($)(a) (b) (c) (d) (e) (f) (g) (h) (i) (j)
D. J. West —60,48518,70028,12621,78839,200
6,00054,10064,10025,000
5,000
282,490181,455
18,70028,124
7,262——————
———————————
34.89035.87045.78054.68052.30061.70055.54037.75532.25034.65529.515
02/16/201902/12/201810/01/201704/22/201702/15/201602/14/201512/31/201402/01/201402/02/201301/21/201205/20/2011
———————————
———————————
106,62595,250
—————————
3,816,1093,408,998
—————————
Total 322,499 518,031 — — — — — 201,875 7,225,107H. P. Alfonso —
10,3137,8507,400
14,100
89,45530,942
7,8507,4004,700
—————
34.89035.87046.64054.68055.560
02/16/201902/12/201808/05/201704/22/201707/16/2016
3,135————
122,645————
33,87530,250
———
1,212,3861,082,648
———
Total 39,663 140,347 — — — 3,135 122,645 64,125 2,295,034J. P. Bilbrey —
17,90812,37614,77515,75024,60023,250
96,85053,72712,374
4,925———
———————
34.89035.87054.68052.30061.70037.75538.850
02/16/201902/12/201804/22/201702/15/201602/14/201502/01/201411/30/2013
13,750——————
515,169——————
33,25025,750
—————
1,190,018921,593
—————
Total 108,659 167,876 — — — 13,750 515,169 59,000 2,111,611T. L. O’Day —
2,93663,560
8,809——
34.89035.230
02/16/201912/01/2018
——
——
24,00021,500
858,960769,485
Total 2,936 72,369 — — — — — 45,500 1,628,445B. H. Snyder —
14,41311,27617,81320,50031,900
67,32043,24211,274
5,937——
——————
34.89035.87054.68052.30061.70037.755
02/16/201902/12/201804/22/201702/15/201602/14/201502/01/2014
5,000—————
187,875—————
23,50021,000
————
841,065751,590
————
Total 95,902 127,773 — — — 5,000 187,875 44,500 1,592,655
(1) Columns (b) through (f) present information about stock options awarded to each named executive officer under theIncentive Plan. Each option vests as to 25% of the shares on each of the first four anniversaries of the grant date,
68
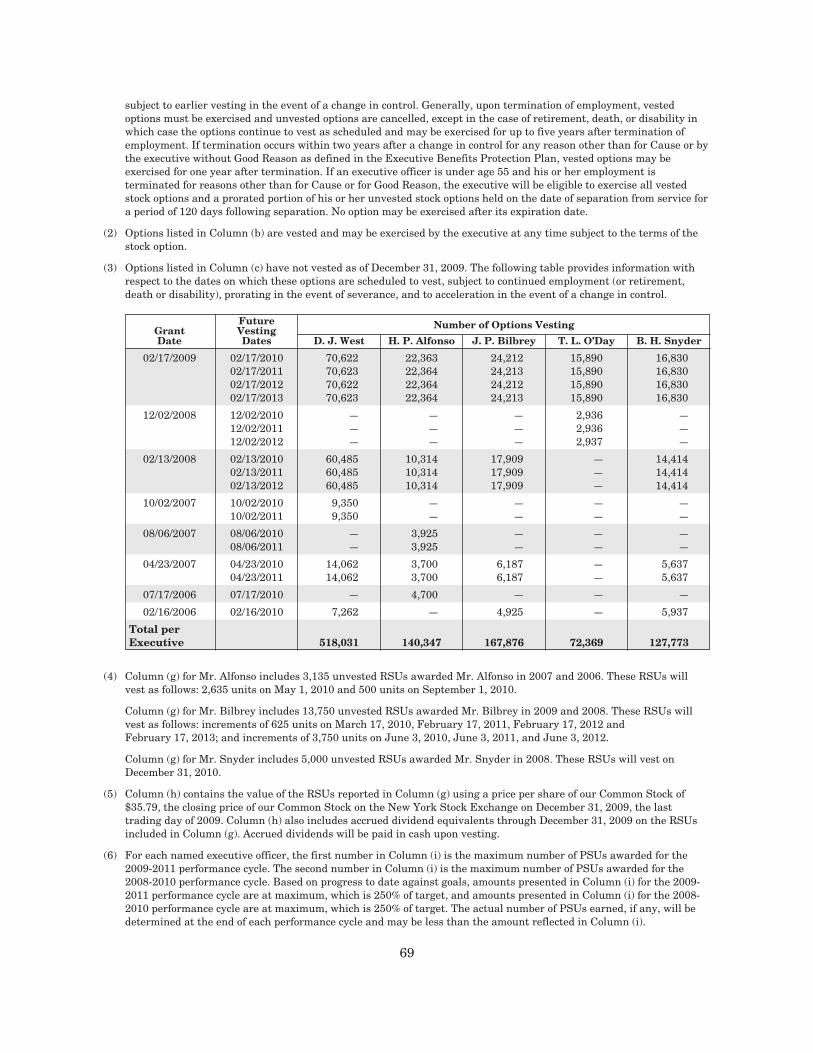
subject to earlier vesting in the event of a change in control. Generally, upon termination of employment, vestedoptions must be exercised and unvested options are cancelled, except in the case of retirement, death, or disability inwhich case the options continue to vest as scheduled and may be exercised for up to five years after termination ofemployment. If termination occurs within two years after a change in control for any reason other than for Cause or bythe executive without Good Reason as defined in the Executive Benefits Protection Plan, vested options may beexercised for one year after termination. If an executive officer is under age 55 and his or her employment isterminated for reasons other than for Cause or for Good Reason, the executive will be eligible to exercise all vestedstock options and a prorated portion of his or her unvested stock options held on the date of separation from service fora period of 120 days following separation. No option may be exercised after its expiration date.
(2) Options listed in Column (b) are vested and may be exercised by the executive at any time subject to the terms of thestock option.
(3) Options listed in Column (c) have not vested as of December 31, 2009. The following table provides information withrespect to the dates on which these options are scheduled to vest, subject to continued employment (or retirement,death or disability), prorating in the event of severance, and to acceleration in the event of a change in control.
GrantDate
FutureVestingDates
Number of Options Vesting
D. J. West H. P. Alfonso J. P. Bilbrey T. L. O’Day B. H. Snyder
02/17/2009 02/17/201002/17/201102/17/201202/17/2013
70,62270,62370,62270,623
22,36322,36422,36422,364
24,21224,21324,21224,213
15,89015,89015,89015,890
16,83016,83016,83016,830
12/02/2008 12/02/2010 — — — 2,936 —12/02/2011 — — — 2,936 —12/02/2012 — — — 2,937 —
02/13/2008 02/13/201002/13/201102/13/2012
60,48560,48560,485
10,31410,31410,314
17,90917,90917,909
———
14,41414,41414,414
10/02/2007 10/02/201010/02/2011
9,3509,350
——
——
——
——
08/06/2007 08/06/201008/06/2011
——
3,9253,925
——
——
——
04/23/2007 04/23/201004/23/2011
14,06214,062
3,7003,700
6,1876,187
——
5,6375,637
07/17/2006 07/17/2010 — 4,700 — — —
02/16/2006 02/16/2010 7,262 — 4,925 — 5,937
Total perExecutive 518,031 140,347 167,876 72,369 127,773
(4) Column (g) for Mr. Alfonso includes 3,135 unvested RSUs awarded Mr. Alfonso in 2007 and 2006. These RSUs willvest as follows: 2,635 units on May 1, 2010 and 500 units on September 1, 2010.
Column (g) for Mr. Bilbrey includes 13,750 unvested RSUs awarded Mr. Bilbrey in 2009 and 2008. These RSUs willvest as follows: increments of 625 units on March 17, 2010, February 17, 2011, February 17, 2012 andFebruary 17, 2013; and increments of 3,750 units on June 3, 2010, June 3, 2011, and June 3, 2012.
Column (g) for Mr. Snyder includes 5,000 unvested RSUs awarded Mr. Snyder in 2008. These RSUs will vest onDecember 31, 2010.
(5) Column (h) contains the value of the RSUs reported in Column (g) using a price per share of our Common Stock of$35.79, the closing price of our Common Stock on the New York Stock Exchange on December 31, 2009, the lasttrading day of 2009. Column (h) also includes accrued dividend equivalents through December 31, 2009 on the RSUsincluded in Column (g). Accrued dividends will be paid in cash upon vesting.
(6) For each named executive officer, the first number in Column (i) is the maximum number of PSUs awarded for the2009-2011 performance cycle. The second number in Column (i) is the maximum number of PSUs awarded for the2008-2010 performance cycle. Based on progress to date against goals, amounts presented in Column (i) for the 2009-2011 performance cycle are at maximum, which is 250% of target, and amounts presented in Column (i) for the 2008-2010 performance cycle are at maximum, which is 250% of target. The actual number of PSUs earned, if any, will bedetermined at the end of each performance cycle and may be less than the amount reflected in Column (i).
69
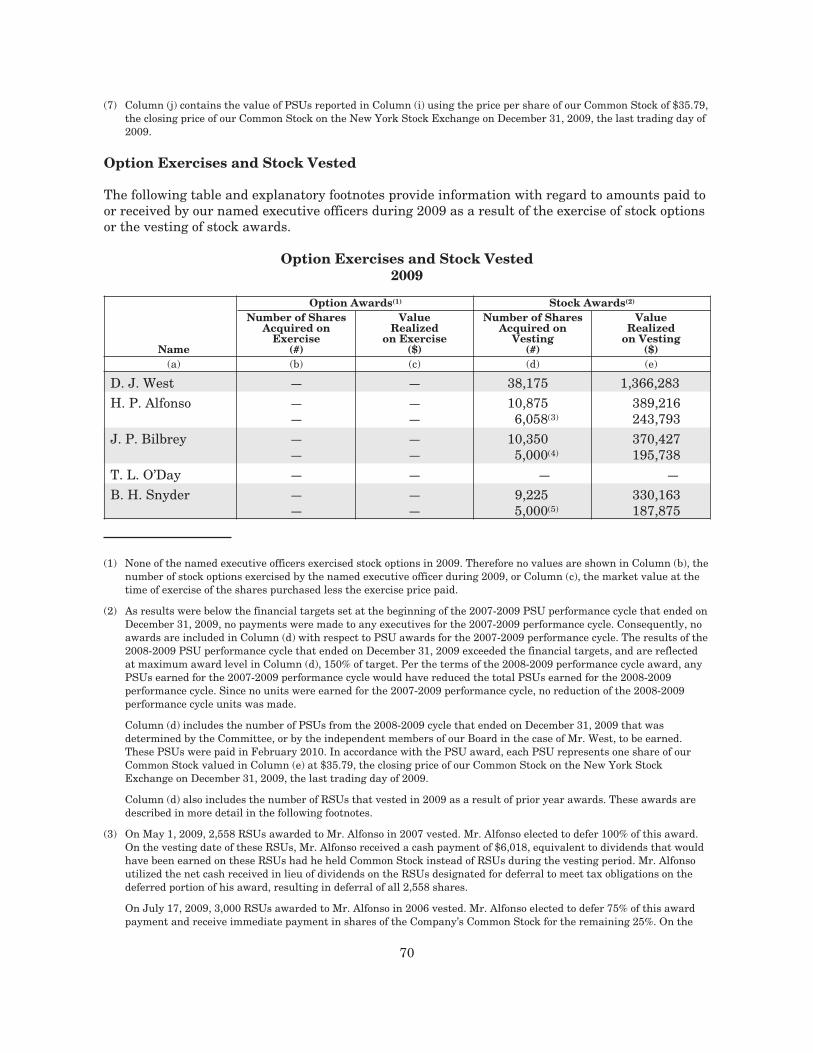
(7) Column (j) contains the value of PSUs reported in Column (i) using the price per share of our Common Stock of $35.79,the closing price of our Common Stock on the New York Stock Exchange on December 31, 2009, the last trading day of2009.
Option Exercises and Stock Vested
The following table and explanatory footnotes provide information with regard to amounts paid toor received by our named executive officers during 2009 as a result of the exercise of stock optionsor the vesting of stock awards.
Option Exercises and Stock Vested2009
Name
Option Awards(1) Stock Awards(2)
Number of SharesAcquired on
Exercise(#)
ValueRealized
on Exercise($)
Number of SharesAcquired on
Vesting(#)
ValueRealized
on Vesting($)
(a) (b) (c) (d) (e)
D. J. West — — 38,175 1,366,283H. P. Alfonso —
———
10,8756,058(3)
389,216243,793
J. P. Bilbrey ——
——
10,3505,000(4)
370,427195,738
T. L. O’Day — — — —B. H. Snyder —
———
9,2255,000(5)
330,163187,875
(1) None of the named executive officers exercised stock options in 2009. Therefore no values are shown in Column (b), thenumber of stock options exercised by the named executive officer during 2009, or Column (c), the market value at thetime of exercise of the shares purchased less the exercise price paid.
(2) As results were below the financial targets set at the beginning of the 2007-2009 PSU performance cycle that ended onDecember 31, 2009, no payments were made to any executives for the 2007-2009 performance cycle. Consequently, noawards are included in Column (d) with respect to PSU awards for the 2007-2009 performance cycle. The results of the2008-2009 PSU performance cycle that ended on December 31, 2009 exceeded the financial targets, and are reflectedat maximum award level in Column (d), 150% of target. Per the terms of the 2008-2009 performance cycle award, anyPSUs earned for the 2007-2009 performance cycle would have reduced the total PSUs earned for the 2008-2009performance cycle. Since no units were earned for the 2007-2009 performance cycle, no reduction of the 2008-2009performance cycle units was made.
Column (d) includes the number of PSUs from the 2008-2009 cycle that ended on December 31, 2009 that wasdetermined by the Committee, or by the independent members of our Board in the case of Mr. West, to be earned.These PSUs were paid in February 2010. In accordance with the PSU award, each PSU represents one share of ourCommon Stock valued in Column (e) at $35.79, the closing price of our Common Stock on the New York StockExchange on December 31, 2009, the last trading day of 2009.
Column (d) also includes the number of RSUs that vested in 2009 as a result of prior year awards. These awards aredescribed in more detail in the following footnotes.
(3) On May 1, 2009, 2,558 RSUs awarded to Mr. Alfonso in 2007 vested. Mr. Alfonso elected to defer 100% of this award.On the vesting date of these RSUs, Mr. Alfonso received a cash payment of $6,018, equivalent to dividends that wouldhave been earned on these RSUs had he held Common Stock instead of RSUs during the vesting period. Mr. Alfonsoutilized the net cash received in lieu of dividends on the RSUs designated for deferral to meet tax obligations on thedeferred portion of his award, resulting in deferral of all 2,558 shares.
On July 17, 2009, 3,000 RSUs awarded to Mr. Alfonso in 2006 vested. Mr. Alfonso elected to defer 75% of this awardpayment and receive immediate payment in shares of the Company’s Common Stock for the remaining 25%. On the
70
vesting date of these RSUs, Mr. Alfonso received a cash payment of $10,380, equivalent to dividends that would havebeen earned on these RSUs had he held Common Stock instead of RSUs during the vesting period. Mr. Alfonso utilizedthe net cash received in lieu of dividends on the RSUs designated for deferral to meet tax obligations on the deferredportion of his award, resulting in deferral of 2,250 shares. Based on Mr. Alfonso’s deferral election, these 2,250 RSUswill be paid as shares of Common Stock, net of applicable taxes in 2013. Mr. Alfonso utilized the remaining net cashreceived in lieu of dividends on the RSUs designated for deferral along with the net cash received in lieu of dividendson the RSUs designated for immediate payment in shares and liquidated 75 RSUs to meet tax obligations on theportion designated for immediate payment, resulting in his receipt of 675 shares of the Company’s Common Stock.
On September 1, 2009, 500 RSUs awarded to Mr. Alfonso in 2006 vested. Mr. Alfonso elected to defer 75% of thisaward payment and receive immediate payment in shares of the Company’s Common Stock for the remaining 25%. Onthe vesting date of these RSUs, Mr. Alfonso received a cash payment of $1,744, equivalent to dividends that wouldhave been earned on these RSUs had he held Common Stock instead of RSUs during the vesting period. Mr. Alfonsoutilized the net cash received in lieu of dividends on the RSUs designated for deferral to meet tax obligations on thedeferred portion of his award, resulting in deferral of 375 shares. Based on Mr. Alfonso’s deferral election, these 375RSUs will be paid as shares of Common Stock, net of applicable taxes in 2011. Mr. Alfonso utilized the remaining netcash received in lieu of dividends on the RSUs designated for deferral along with the net cash received in lieu ofdividends on the RSUs designated for immediate payment in shares and liquidated 14 RSUs to meet tax obligations onthe portion designated for immediate payment, resulting in his receipt of 111 shares of the Company’s Common Stock.
The value of the RSUs paid to or deferred by Mr. Alfonso was based on the closing price of the Company’s CommonStock on the trading day prescribed by the Incentive Plan. Required tax withholdings were deducted from allpayments. Column (e) reflects the value of the 6,058 shares realized by Mr. Alfonso as the result of vesting of RSUs in2009 and the cash equivalent of dividends payable on the RSUs vesting in 2009.
(4) On July 3, 2009, 3,750 RSUs awarded to Mr. Bilbrey in 2008 vested. Mr. Bilbrey elected to receive immediate paymentin shares of the Company’s Common Stock. In addition, Mr. Bilbrey received a cash payment of $4,463, equivalent todividends that would have been earned on these RSUs had he held Common Stock instead of RSUs during the vestingperiod. Mr. Bilbrey utilized the net cash received in lieu of dividends on the RSUs and liquidated 1,086 RSUs to meettax obligations, resulting in his receipt of 2,664 shares of the Company’s Common Stock.
On August 8, 2009, 1,250 RSUs awarded to Mr. Bilbrey in 2005 vested. Mr. Bilbrey elected to receive payment for hisRSUs in cash and received a gross payment of $48,925. On the vesting date of these RSUs, Mr. Bilbrey also received acash payment of $5,550, equivalent to dividends that would have been earned on the RSUs had he held Common Stockinstead of RSUs during the vesting period. Required tax withholdings were deducted from both payments.
The value of the RSUs paid to Mr. Bilbrey was based on the closing price of the Company’s Common Stock on thetrading day prescribed by the Incentive Plan. Required tax withholdings were deducted from all payments. Column (e)reflects the value of the 5,000 shares realized by Mr. Bilbrey as the result of vesting of RSUs in 2009 and the cashequivalent of dividends payable on the RSUs vesting in 2009.
(5) On December 31, 2009, 5,000 RSUs awarded to Mr. Snyder in 2008 vested. Mr. Snyder elected to receive immediatepayment in shares of the Company’s Common Stock. In addition, Mr. Snyder received a cash payment of $8,925,equivalent to dividends that would have been earned on these RSUs had he held Common Stock instead of RSUsduring the vesting period. Mr. Snyder utilized the net cash received in lieu of dividends on the RSUs and liquidated1,409 RSUs to meet tax obligations, resulting in his receipt of 3,591 shares of the Company’s Common Stock.Column (e) reflects the market value of the 5,000 shares on the vesting date and the cash equivalent of dividends paidon the vesting date.
Pension Benefits
Each of the named executive officers, with the exception of Mr. O’Day, is a participant in ourtax-qualified defined benefit pension plan and is fully vested in his benefit under that plan.Messrs. West, Bilbrey and Snyder, were eligible to participate in our non-qualified defined benefitSupplemental Executive Retirement Plan, or DB SERP. With the exception of Mr. West, whoseeligibility for a DB SERP benefit is described below, no benefit is payable under the DB SERP ifthe executive officer terminates employment prior to age 55 or if he or she does not have five yearsof service with the Company. As of December 31, 2009, Mr. Snyder had attained age 55 with fiveyears of service.
The combination of the tax-qualified and DB SERP plans was designed to provide a benefit onretirement at or after reaching age 60 based on a joint and survivor annuity equal to 55% of final
71
average compensation for an executive officer with 15 or more years of service (reduced pro ratafor each year of service under 15). Effective January 1, 2007, the benefit payable under the DBSERP to an executive officer who was age 50 or over as of January 1, 2007 was reduced by 10%,and the benefit payable to an executive officer who had not attained age 50 as of January 1, 2007,was reduced by 20%. The benefits payable to Messrs. Bilbrey and Snyder were reduced by 10%and the benefit payable to Mr. West was reduced by 20%.
Final average compensation is calculated as the sum of (i) the average of the highest threecalendar years of base salary paid over the last five years of employment with the Company and(ii) the average of the highest three annual incentive program awards for the last five years ofemployment with the Company, whether received or deferred. The benefit accrued under the DBSERP is payable upon retirement in a lump sum, a life annuity with 50% benefit continuation tothe participant’s surviving spouse, or payment may be deferred in accordance with the provisionsof the Company’s Deferred Compensation Plan. The lump sum is equal to the actuarial presentvalue of the joint and survivor pension earned, reduced by the lump sum value of the benefits tobe paid under the tax-qualified defined benefit pension plan and the value of the executive’s SocialSecurity benefits. If the executive officer terminates employment after age 55 but before age 60,the benefit is reduced for early retirement at a rate of 5% per year for the period until theexecutive would have turned 60.
Our employment agreement with Mr. West contains special provisions relating to the vesting ofhis benefit under the DB SERP. Under the employment agreement, Mr. West was fully vested inhis accrued DB SERP benefit as of January 2, 2008. If Mr. West terminates employment prior toage 60, the benefit payable upon termination is reduced for early retirement at a rate of 5% peryear for the period between termination and attainment of age 60.
The CLRP provides eligible participants the defined benefit he or she would have earned underour tax-qualified defined benefit pension plan were it not for the legal limitation on compensationused to determine benefits. An executive officer who is a participant in DB SERP is not eligible toparticipate in the CLRP, unless he or she (i) ceases to be designated by the Committee as eligibleto participate in the DB SERP prior to his or her termination of employment with the Company,or (ii) has his or her employment involuntarily terminated by the Company, other than for Cause.Such executive officer would then become eligible to participate in the CLRP and to receive abenefit for all years in which he or she would have been a participant of the CLRP, but for his orher designation by the Committee to be eligible to participate in the DB SERP. Executive officerswho are eligible for both the DC SERP (described under Non-Qualified Deferred Compensationbelow) and the tax-qualified defined benefit pension plan receive an additional credit under theCLRP equal to 3% of eligible earnings less the IRS annual limitation on compensation.Mr. Alfonso is the only named executive officer eligible for the CLRP. Upon separation, benefitsunder the CLRP are payable in a single lump sum or may be deferred into the DeferredCompensation Plan. A participant is eligible for his or her CLRP benefit upon separation fromservice (subject to the provisions of section 409A) after five years of service or attaining age 55(unless the participant is terminated for Cause). Payment is also made to the estate of aparticipant who dies prior to separation from service. Participants who become disabled are 100%vested in their benefit and continue to accrue additional benefits for up to two additional years.
72
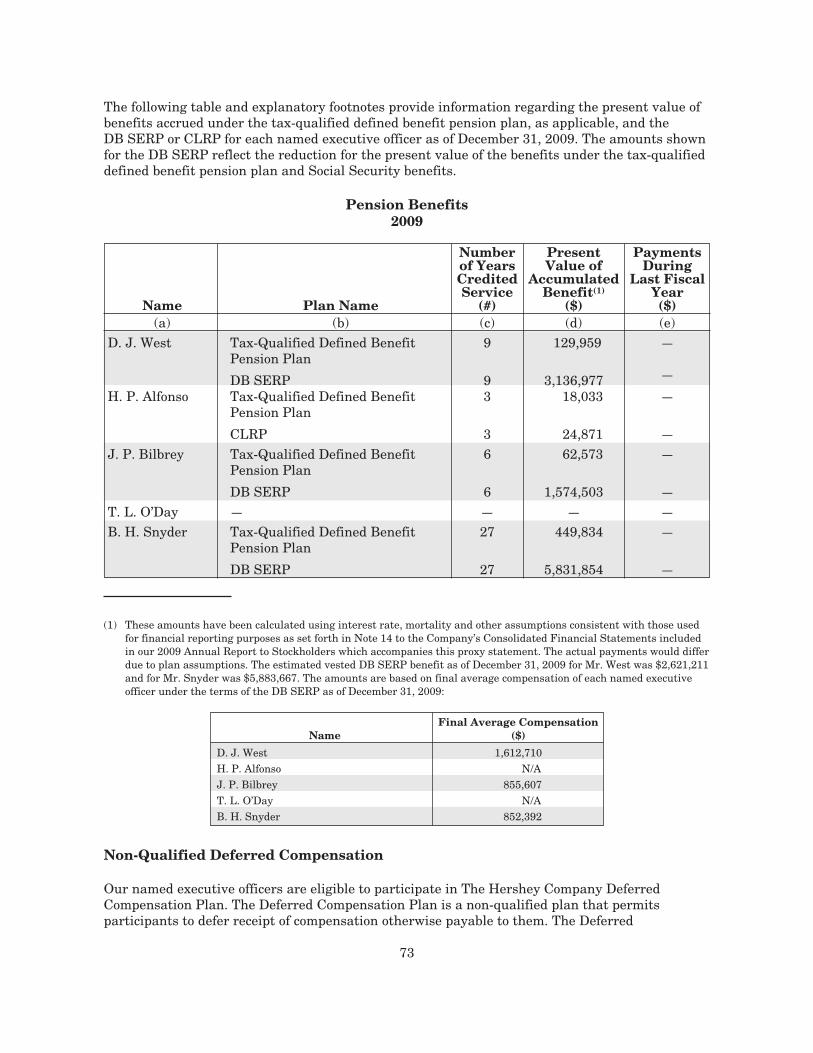
The following table and explanatory footnotes provide information regarding the present value ofbenefits accrued under the tax-qualified defined benefit pension plan, as applicable, and theDB SERP or CLRP for each named executive officer as of December 31, 2009. The amounts shownfor the DB SERP reflect the reduction for the present value of the benefits under the tax-qualifieddefined benefit pension plan and Social Security benefits.
Pension Benefits2009
Name Plan Name
Numberof YearsCreditedService
(#)
PresentValue of
AccumulatedBenefit(1)
($)
PaymentsDuring
Last FiscalYear($)
(a) (b) (c) (d) (e)D. J. West Tax-Qualified Defined Benefit
Pension Plan9 129,959 —
DB SERP 9 3,136,977 —
H. P. Alfonso Tax-Qualified Defined BenefitPension Plan
3 18,033 —
CLRP 3 24,871 —J. P. Bilbrey Tax-Qualified Defined Benefit
Pension Plan6 62,573 —
DB SERP 6 1,574,503 —T. L. O’Day — — — —B. H. Snyder Tax-Qualified Defined Benefit
Pension Plan27 449,834 —
DB SERP 27 5,831,854 —
(1) These amounts have been calculated using interest rate, mortality and other assumptions consistent with those usedfor financial reporting purposes as set forth in Note 14 to the Company’s Consolidated Financial Statements includedin our 2009 Annual Report to Stockholders which accompanies this proxy statement. The actual payments would differdue to plan assumptions. The estimated vested DB SERP benefit as of December 31, 2009 for Mr. West was $2,621,211and for Mr. Snyder was $5,883,667. The amounts are based on final average compensation of each named executiveofficer under the terms of the DB SERP as of December 31, 2009:
NameFinal Average Compensation
($)
D. J. West 1,612,710H. P. Alfonso N/AJ. P. Bilbrey 855,607T. L. O’Day N/AB. H. Snyder 852,392
Non-Qualified Deferred Compensation
Our named executive officers are eligible to participate in The Hershey Company DeferredCompensation Plan. The Deferred Compensation Plan is a non-qualified plan that permitsparticipants to defer receipt of compensation otherwise payable to them. The Deferred
73
Compensation Plan is intended to secure the goodwill and loyalty of participants by enabling themto defer compensation when the participants deem it to be beneficial to do so and by providing avehicle for the Company to provide, on a non-qualified basis, contributions which could not bemade on the participants’ behalf to the tax-qualified 401(k) Plan. The Company credits theDeferred Compensation Plan with a specified percentage of compensation for executive officersparticipating in the non-qualified DC SERP.
Our named executive officers may elect to defer payments to be received as a result of DB SERP,CLRP, the One Hershey Incentive Program, PSU and RSU awards, but not stock options.Amounts deferred are credited to the participant’s account under the Deferred CompensationPlan. Amounts deferred are fully vested and will be paid at a future date or at termination ofemployment, as the participant may elect. DB SERP and CLRP payments designated for deferralare not credited as earned, but are credited in full upon the participant’s retirement.
Payments are distributed in a lump sum or in annual installments of up to 15 years. All amountsare payable in a lump sum following a change in control. All elections and payments under theDeferred Compensation Plan are subject to compliance with section 409A which may limitelections and require a delay in payment of benefits in certain circumstances.
While deferred, amounts are credited with “earnings” as if they were invested as the participantelects in one or more investment options available under the Deferred Compensation Plan. Theinvestment options under the Deferred Compensation Plan consist of investment in shares of ourCommon Stock or in mutual funds or other investments available to participants in our 401(k)Plan. The participants’ accounts under the Deferred Compensation Plan will be adjusted daily, upor down, depending upon performance of the investment options elected.
Effective January 1, 2007, we began crediting the deferred compensation accounts of allemployees, including the named executive officers, with the amount of employer matchingcontributions that exceed the limits established by the IRS for contribution to the 401(k) Plan.These amounts are credited in the first quarter of the year after they are earned. As shown in theNotes to the Summary Compensation Table beginning on page 62, these amounts are designatedas “Supplemental 401(k) match” and are included as “All Other Compensation” in the yearearned. These amounts are also included in Column (c) of the Non-Qualified DeferredCompensation table in the year earned. With the exception of Mr. O’Day, the named executiveofficers are fully vested in the Supplemental 401(k) match credits and will be paid at a future dateor at termination of employment, as elected by the officer.
Effective January 1, 2007, we began crediting the deferred compensation accounts of allemployees hired on or after January 1, 2007, including eligible named executive officers, with theamount of core retirement contributions that exceed the limits established by the IRS forcontribution to the 401(k) Plan. These amounts are credited in the first quarter of the year afterthey are earned. As shown in the Notes to the Summary Compensation Table, these amounts aredesignated as “Supplemental Core Retirement Contribution” and are included as “All OtherCompensation” in the year earned. These amounts are also included in Column (c) of theNon-Qualified Deferred Compensation table in the year earned. Mr. O’Day is the only namedexecutive officer eligible for the Supplemental Core Retirement Contribution credit. Mr. O’Daywill vest in the Supplemental Core Retirement Contribution credit on the third anniversary of hisemployment.
Messrs. Alfonso and O’Day are eligible to participate in our DC SERP, a part of the DeferredCompensation Plan. The DC SERP provides annual allocations to the Deferred Compensation
74
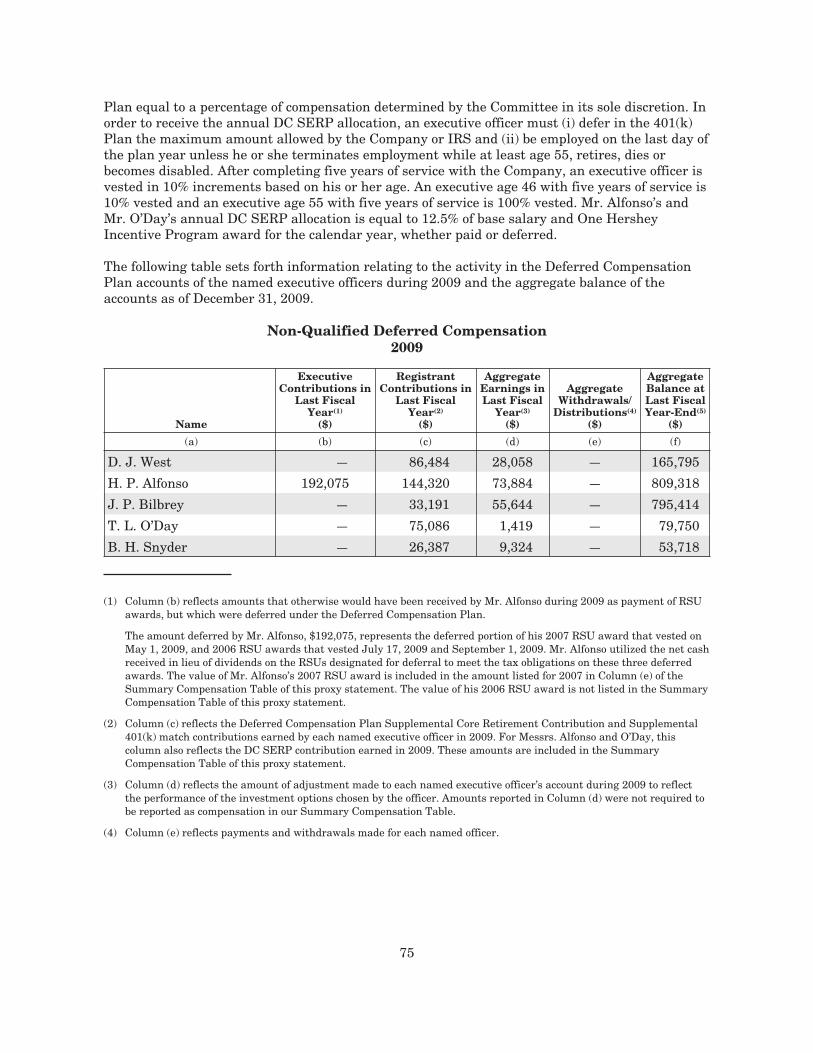
Plan equal to a percentage of compensation determined by the Committee in its sole discretion. Inorder to receive the annual DC SERP allocation, an executive officer must (i) defer in the 401(k)Plan the maximum amount allowed by the Company or IRS and (ii) be employed on the last day ofthe plan year unless he or she terminates employment while at least age 55, retires, dies orbecomes disabled. After completing five years of service with the Company, an executive officer isvested in 10% increments based on his or her age. An executive age 46 with five years of service is10% vested and an executive age 55 with five years of service is 100% vested. Mr. Alfonso’s andMr. O’Day’s annual DC SERP allocation is equal to 12.5% of base salary and One HersheyIncentive Program award for the calendar year, whether paid or deferred.
The following table sets forth information relating to the activity in the Deferred CompensationPlan accounts of the named executive officers during 2009 and the aggregate balance of theaccounts as of December 31, 2009.
Non-Qualified Deferred Compensation2009
Name
ExecutiveContributions in
Last FiscalYear(1)
($)
RegistrantContributions in
Last FiscalYear(2)
($)
AggregateEarnings inLast Fiscal
Year(3)
($)
AggregateWithdrawals/
Distributions(4)
($)
AggregateBalance atLast FiscalYear-End(5)
($)
(a) (b) (c) (d) (e) (f)
D. J. West — 86,484 28,058 — 165,795
H. P. Alfonso 192,075 144,320 73,884 — 809,318
J. P. Bilbrey — 33,191 55,644 — 795,414
T. L. O’Day — 75,086 1,419 — 79,750
B. H. Snyder — 26,387 9,324 — 53,718
(1) Column (b) reflects amounts that otherwise would have been received by Mr. Alfonso during 2009 as payment of RSUawards, but which were deferred under the Deferred Compensation Plan.
The amount deferred by Mr. Alfonso, $192,075, represents the deferred portion of his 2007 RSU award that vested onMay 1, 2009, and 2006 RSU awards that vested July 17, 2009 and September 1, 2009. Mr. Alfonso utilized the net cashreceived in lieu of dividends on the RSUs designated for deferral to meet the tax obligations on these three deferredawards. The value of Mr. Alfonso’s 2007 RSU award is included in the amount listed for 2007 in Column (e) of theSummary Compensation Table of this proxy statement. The value of his 2006 RSU award is not listed in the SummaryCompensation Table of this proxy statement.
(2) Column (c) reflects the Deferred Compensation Plan Supplemental Core Retirement Contribution and Supplemental401(k) match contributions earned by each named executive officer in 2009. For Messrs. Alfonso and O’Day, thiscolumn also reflects the DC SERP contribution earned in 2009. These amounts are included in the SummaryCompensation Table of this proxy statement.
(3) Column (d) reflects the amount of adjustment made to each named executive officer’s account during 2009 to reflectthe performance of the investment options chosen by the officer. Amounts reported in Column (d) were not required tobe reported as compensation in our Summary Compensation Table.
(4) Column (e) reflects payments and withdrawals made for each named officer.
75
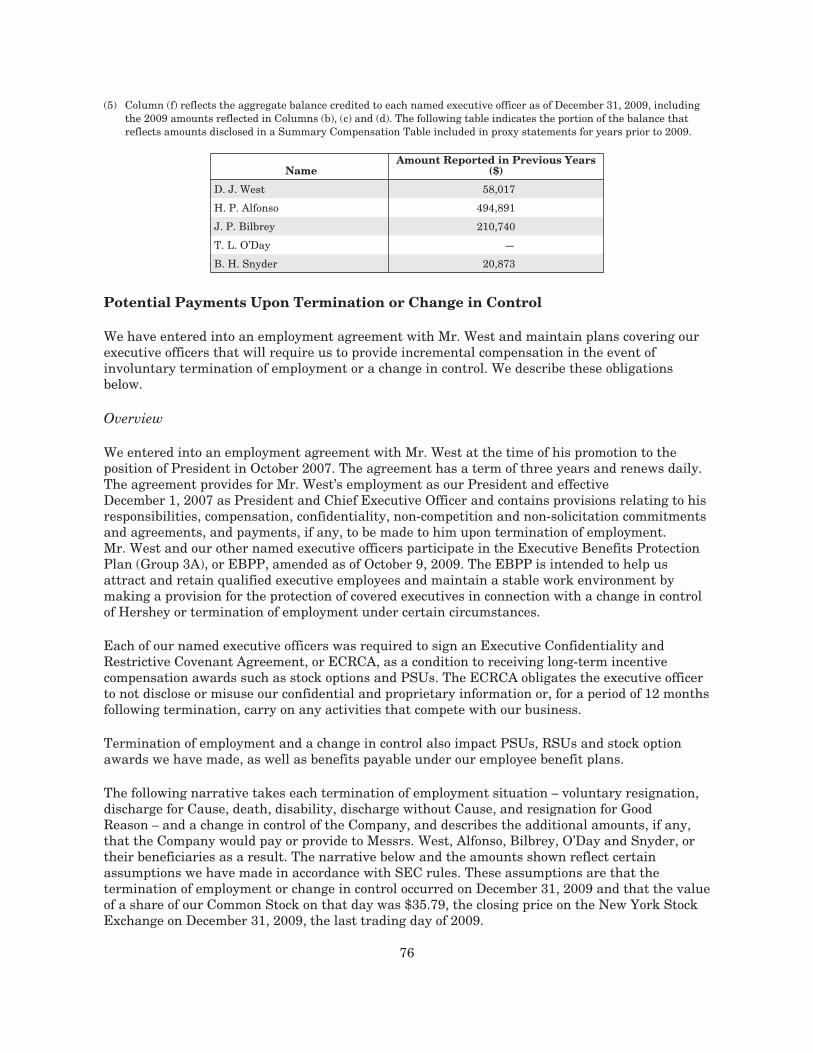
(5) Column (f) reflects the aggregate balance credited to each named executive officer as of December 31, 2009, includingthe 2009 amounts reflected in Columns (b), (c) and (d). The following table indicates the portion of the balance thatreflects amounts disclosed in a Summary Compensation Table included in proxy statements for years prior to 2009.
NameAmount Reported in Previous Years
($)
D. J. West 58,017
H. P. Alfonso 494,891
J. P. Bilbrey 210,740
T. L. O’Day —
B. H. Snyder 20,873
Potential Payments Upon Termination or Change in Control
We have entered into an employment agreement with Mr. West and maintain plans covering ourexecutive officers that will require us to provide incremental compensation in the event ofinvoluntary termination of employment or a change in control. We describe these obligationsbelow.
Overview
We entered into an employment agreement with Mr. West at the time of his promotion to theposition of President in October 2007. The agreement has a term of three years and renews daily.The agreement provides for Mr. West’s employment as our President and effectiveDecember 1, 2007 as President and Chief Executive Officer and contains provisions relating to hisresponsibilities, compensation, confidentiality, non-competition and non-solicitation commitmentsand agreements, and payments, if any, to be made to him upon termination of employment.Mr. West and our other named executive officers participate in the Executive Benefits ProtectionPlan (Group 3A), or EBPP, amended as of October 9, 2009. The EBPP is intended to help usattract and retain qualified executive employees and maintain a stable work environment bymaking a provision for the protection of covered executives in connection with a change in controlof Hershey or termination of employment under certain circumstances.
Each of our named executive officers was required to sign an Executive Confidentiality andRestrictive Covenant Agreement, or ECRCA, as a condition to receiving long-term incentivecompensation awards such as stock options and PSUs. The ECRCA obligates the executive officerto not disclose or misuse our confidential and proprietary information or, for a period of 12 monthsfollowing termination, carry on any activities that compete with our business.
Termination of employment and a change in control also impact PSUs, RSUs and stock optionawards we have made, as well as benefits payable under our employee benefit plans.
The following narrative takes each termination of employment situation – voluntary resignation,discharge for Cause, death, disability, discharge without Cause, and resignation for GoodReason – and a change in control of the Company, and describes the additional amounts, if any,that the Company would pay or provide to Messrs. West, Alfonso, Bilbrey, O’Day and Snyder, ortheir beneficiaries as a result. The narrative below and the amounts shown reflect certainassumptions we have made in accordance with SEC rules. These assumptions are that thetermination of employment or change in control occurred on December 31, 2009 and that the valueof a share of our Common Stock on that day was $35.79, the closing price on the New York StockExchange on December 31, 2009, the last trading day of 2009.
76
In addition, in keeping with SEC rules, the following narrative and amounts do not includepayments and benefits which are not enhanced by the termination of employment or change incontrol. These payments and benefits include:
• Benefits accrued under the Company’s broad-based tax-qualified 401(k) Plan andtax-qualified defined benefit pension plan;
• Accrued vacation pay, health plan continuation and other similar amounts payable whenemployment terminates under programs applicable to the Company’s salaried employeesgenerally;
• Supplemental 401(k) match provided to the named executive officers on the same basis asall other employees eligible for Supplemental 401(k) match;
• Vested benefits accrued under the DB SERP and account balances held under theDeferred Compensation Plan as described above beginning on pages 71 and 73; and
• Stock options which have vested and become exercisable prior to the employmenttermination or change in control.
The payments and benefits described in the five bullet points above are referred to in thefollowing discussion as the executive officer’s “vested benefits.”
Voluntary Resignation
We are not obligated to pay amounts over and above vested benefits to a named executive officerwho voluntarily resigns. Vested stock options may not be exercised after the named executiveofficer’s resignation date unless the officer is age 55 or older, as described in Treatment of StockOptions upon Retirement, Death or Disability below. Mr. West’s vested benefits include hisDB SERP benefit per the terms of his employment agreement.
Discharge for Cause
If we terminate a named executive officer’s employment for Cause, we are not obligated to pay theofficer any amounts over and above the vested benefits. The named executive officer’s right toexercise vested options expires upon discharge for Cause, and amounts otherwise payable underthe DB SERP are subject to forfeiture at the Company’s discretion. In general, a discharge will befor Cause if the executive has intentionally failed to perform his or her duties or engaged in illegalor gross misconduct that harms the Company. Mr. West’s vested benefits include his DB SERPbenefit per the terms of his employment agreement.
Death or Disability
If an executive officer dies and has not met the vesting requirements to be eligible to receive abenefit from the DB SERP, no benefits are paid. Messrs. West and Snyder were fully vested intheir DB SERP benefits as of December 31, 2009.
A maximum monthly long-term disability benefit of $35,000 is provided for Mr. West and $25,000for all other named executive officers in the event of long-term disability. Long-term disabilitybenefits are payable until age 65. Long-term disability benefits are offset by other benefits such asSocial Security. The maximum amount of the monthly long-term disability payments from allsources, assuming long-term disability on December 31, 2009, is set forth in the tables below. Theadditional lump sum DB SERP amount that would be payable for Messrs. West and Bilbrey at age65, attributable to vesting and benefit service credited during the disability period for theDB SERP, if the executive’s disability started on December 31, 2009, is shown on the table below.
77
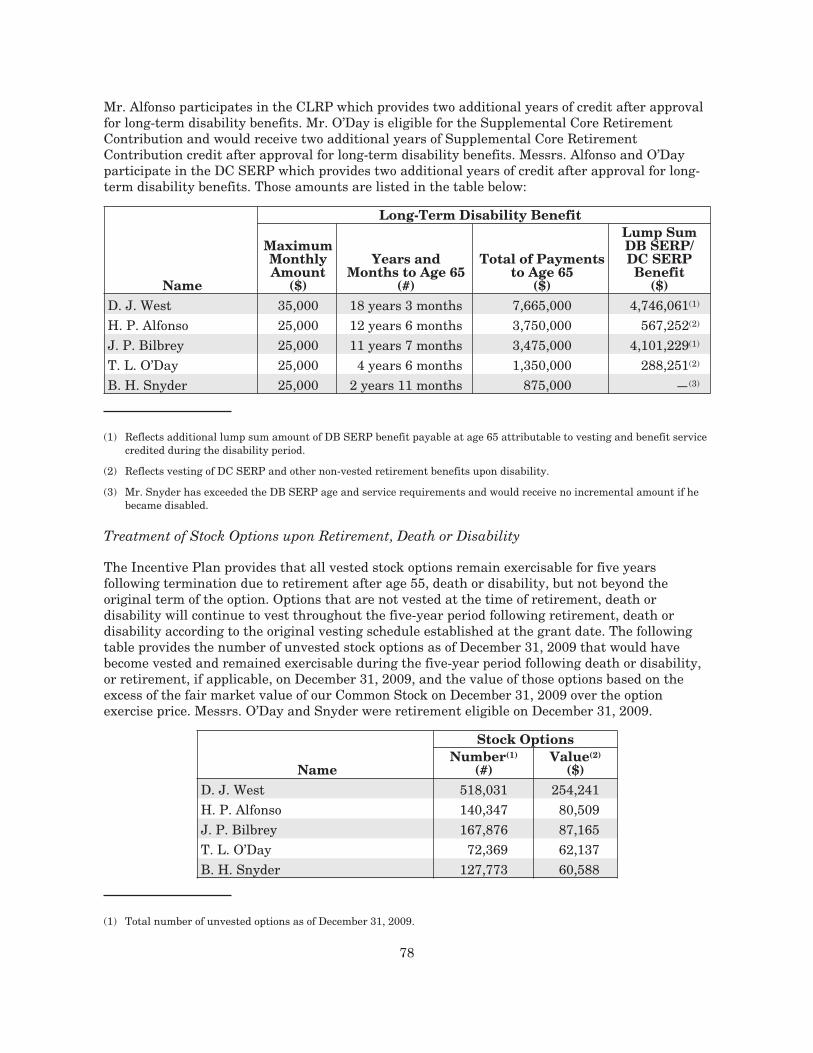
Mr. Alfonso participates in the CLRP which provides two additional years of credit after approvalfor long-term disability benefits. Mr. O’Day is eligible for the Supplemental Core RetirementContribution and would receive two additional years of Supplemental Core RetirementContribution credit after approval for long-term disability benefits. Messrs. Alfonso and O’Dayparticipate in the DC SERP which provides two additional years of credit after approval for long-term disability benefits. Those amounts are listed in the table below:
Name
Long-Term Disability Benefit
MaximumMonthlyAmount
($)
Years andMonths to Age 65
(#)
Total of Paymentsto Age 65
($)
Lump SumDB SERP/DC SERPBenefit
($)D. J. West 35,000 18 years 3 months 7,665,000 4,746,061(1)
H. P. Alfonso 25,000 12 years 6 months 3,750,000 567,252(2)
J. P. Bilbrey 25,000 11 years 7 months 3,475,000 4,101,229(1)
T. L. O’Day 25,000 4 years 6 months 1,350,000 288,251(2)
B. H. Snyder 25,000 2 years 11 months 875,000 —(3)
(1) Reflects additional lump sum amount of DB SERP benefit payable at age 65 attributable to vesting and benefit servicecredited during the disability period.
(2) Reflects vesting of DC SERP and other non-vested retirement benefits upon disability.
(3) Mr. Snyder has exceeded the DB SERP age and service requirements and would receive no incremental amount if hebecame disabled.
Treatment of Stock Options upon Retirement, Death or Disability
The Incentive Plan provides that all vested stock options remain exercisable for five yearsfollowing termination due to retirement after age 55, death or disability, but not beyond theoriginal term of the option. Options that are not vested at the time of retirement, death ordisability will continue to vest throughout the five-year period following retirement, death ordisability according to the original vesting schedule established at the grant date. The followingtable provides the number of unvested stock options as of December 31, 2009 that would havebecome vested and remained exercisable during the five-year period following death or disability,or retirement, if applicable, on December 31, 2009, and the value of those options based on theexcess of the fair market value of our Common Stock on December 31, 2009 over the optionexercise price. Messrs. O’Day and Snyder were retirement eligible on December 31, 2009.
Name
Stock OptionsNumber(1)
(#)Value(2)
($)D. J. West 518,031 254,241H. P. Alfonso 140,347 80,509J. P. Bilbrey 167,876 87,165T. L. O’Day 72,369 62,137B. H. Snyder 127,773 60,588
(1) Total number of unvested options as of December 31, 2009.
78
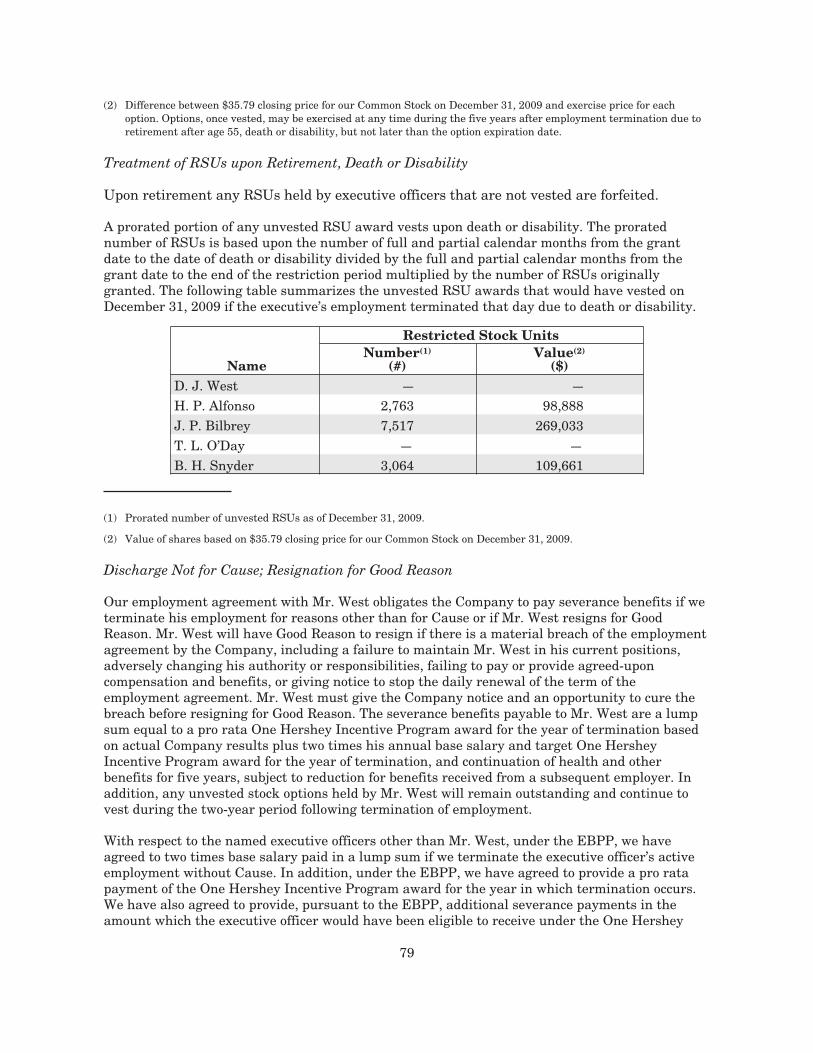
(2) Difference between $35.79 closing price for our Common Stock on December 31, 2009 and exercise price for eachoption. Options, once vested, may be exercised at any time during the five years after employment termination due toretirement after age 55, death or disability, but not later than the option expiration date.
Treatment of RSUs upon Retirement, Death or Disability
Upon retirement any RSUs held by executive officers that are not vested are forfeited.
A prorated portion of any unvested RSU award vests upon death or disability. The proratednumber of RSUs is based upon the number of full and partial calendar months from the grantdate to the date of death or disability divided by the full and partial calendar months from thegrant date to the end of the restriction period multiplied by the number of RSUs originallygranted. The following table summarizes the unvested RSU awards that would have vested onDecember 31, 2009 if the executive’s employment terminated that day due to death or disability.
Name
Restricted Stock UnitsNumber(1)
(#)Value(2)
($)D. J. West — —H. P. Alfonso 2,763 98,888J. P. Bilbrey 7,517 269,033T. L. O’Day — —B. H. Snyder 3,064 109,661
(1) Prorated number of unvested RSUs as of December 31, 2009.
(2) Value of shares based on $35.79 closing price for our Common Stock on December 31, 2009.
Discharge Not for Cause; Resignation for Good Reason
Our employment agreement with Mr. West obligates the Company to pay severance benefits if weterminate his employment for reasons other than for Cause or if Mr. West resigns for GoodReason. Mr. West will have Good Reason to resign if there is a material breach of the employmentagreement by the Company, including a failure to maintain Mr. West in his current positions,adversely changing his authority or responsibilities, failing to pay or provide agreed-uponcompensation and benefits, or giving notice to stop the daily renewal of the term of theemployment agreement. Mr. West must give the Company notice and an opportunity to cure thebreach before resigning for Good Reason. The severance benefits payable to Mr. West are a lumpsum equal to a pro rata One Hershey Incentive Program award for the year of termination basedon actual Company results plus two times his annual base salary and target One HersheyIncentive Program award for the year of termination, and continuation of health and otherbenefits for five years, subject to reduction for benefits received from a subsequent employer. Inaddition, any unvested stock options held by Mr. West will remain outstanding and continue tovest during the two-year period following termination of employment.
With respect to the named executive officers other than Mr. West, under the EBPP, we haveagreed to two times base salary paid in a lump sum if we terminate the executive officer’s activeemployment without Cause. In addition, under the EBPP, we have agreed to provide a pro ratapayment of the One Hershey Incentive Program award for the year in which termination occurs.We have also agreed to provide, pursuant to the EBPP, additional severance payments in theamount which the executive officer would have been eligible to receive under the One Hershey
79
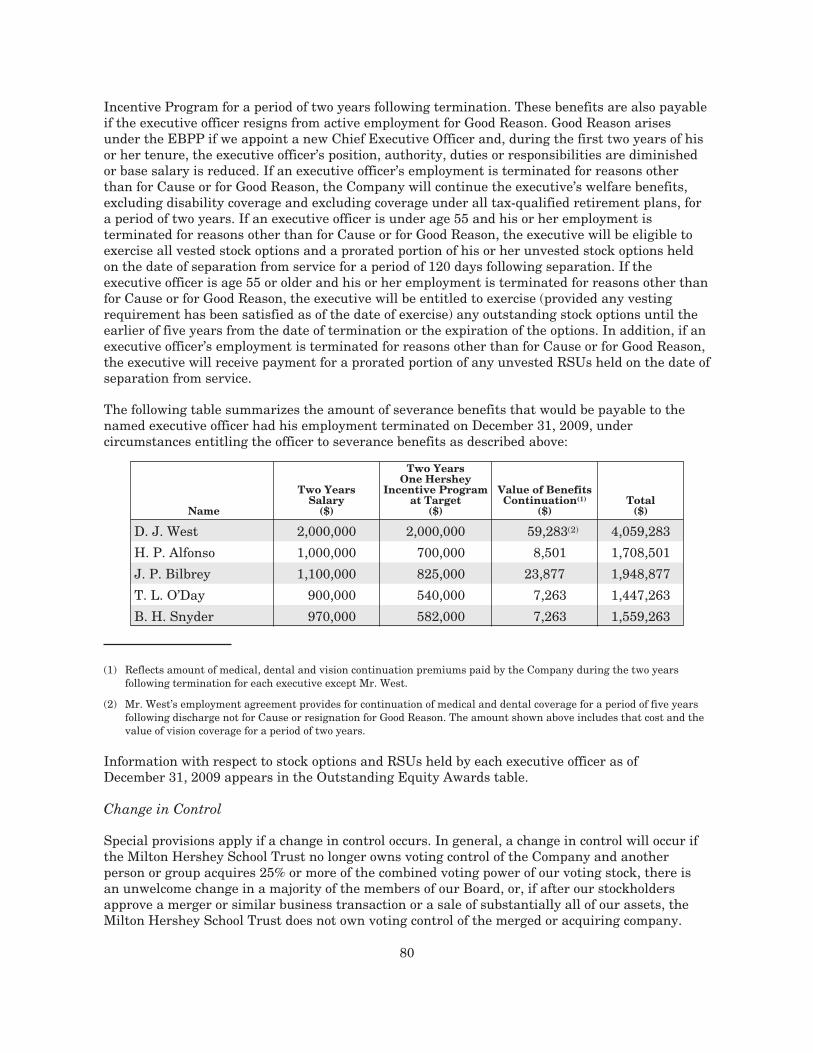
Incentive Program for a period of two years following termination. These benefits are also payableif the executive officer resigns from active employment for Good Reason. Good Reason arisesunder the EBPP if we appoint a new Chief Executive Officer and, during the first two years of hisor her tenure, the executive officer’s position, authority, duties or responsibilities are diminishedor base salary is reduced. If an executive officer’s employment is terminated for reasons otherthan for Cause or for Good Reason, the Company will continue the executive’s welfare benefits,excluding disability coverage and excluding coverage under all tax-qualified retirement plans, fora period of two years. If an executive officer is under age 55 and his or her employment isterminated for reasons other than for Cause or for Good Reason, the executive will be eligible toexercise all vested stock options and a prorated portion of his or her unvested stock options heldon the date of separation from service for a period of 120 days following separation. If theexecutive officer is age 55 or older and his or her employment is terminated for reasons other thanfor Cause or for Good Reason, the executive will be entitled to exercise (provided any vestingrequirement has been satisfied as of the date of exercise) any outstanding stock options until theearlier of five years from the date of termination or the expiration of the options. In addition, if anexecutive officer’s employment is terminated for reasons other than for Cause or for Good Reason,the executive will receive payment for a prorated portion of any unvested RSUs held on the date ofseparation from service.
The following table summarizes the amount of severance benefits that would be payable to thenamed executive officer had his employment terminated on December 31, 2009, undercircumstances entitling the officer to severance benefits as described above:
Name
Two YearsSalary
($)
Two YearsOne Hershey
Incentive Programat Target
($)
Value of BenefitsContinuation(1)
($)Total
($)
D. J. West 2,000,000 2,000,000 59,283(2) 4,059,283
H. P. Alfonso 1,000,000 700,000 8,501 1,708,501
J. P. Bilbrey 1,100,000 825,000 23,877 1,948,877
T. L. O’Day 900,000 540,000 7,263 1,447,263
B. H. Snyder 970,000 582,000 7,263 1,559,263
(1) Reflects amount of medical, dental and vision continuation premiums paid by the Company during the two yearsfollowing termination for each executive except Mr. West.
(2) Mr. West’s employment agreement provides for continuation of medical and dental coverage for a period of five yearsfollowing discharge not for Cause or resignation for Good Reason. The amount shown above includes that cost and thevalue of vision coverage for a period of two years.
Information with respect to stock options and RSUs held by each executive officer as ofDecember 31, 2009 appears in the Outstanding Equity Awards table.
Change in Control
Special provisions apply if a change in control occurs. In general, a change in control will occur ifthe Milton Hershey School Trust no longer owns voting control of the Company and anotherperson or group acquires 25% or more of the combined voting power of our voting stock, there isan unwelcome change in a majority of the members of our Board, or, if after our stockholdersapprove a merger or similar business transaction or a sale of substantially all of our assets, theMilton Hershey School Trust does not own voting control of the merged or acquiring company.
80
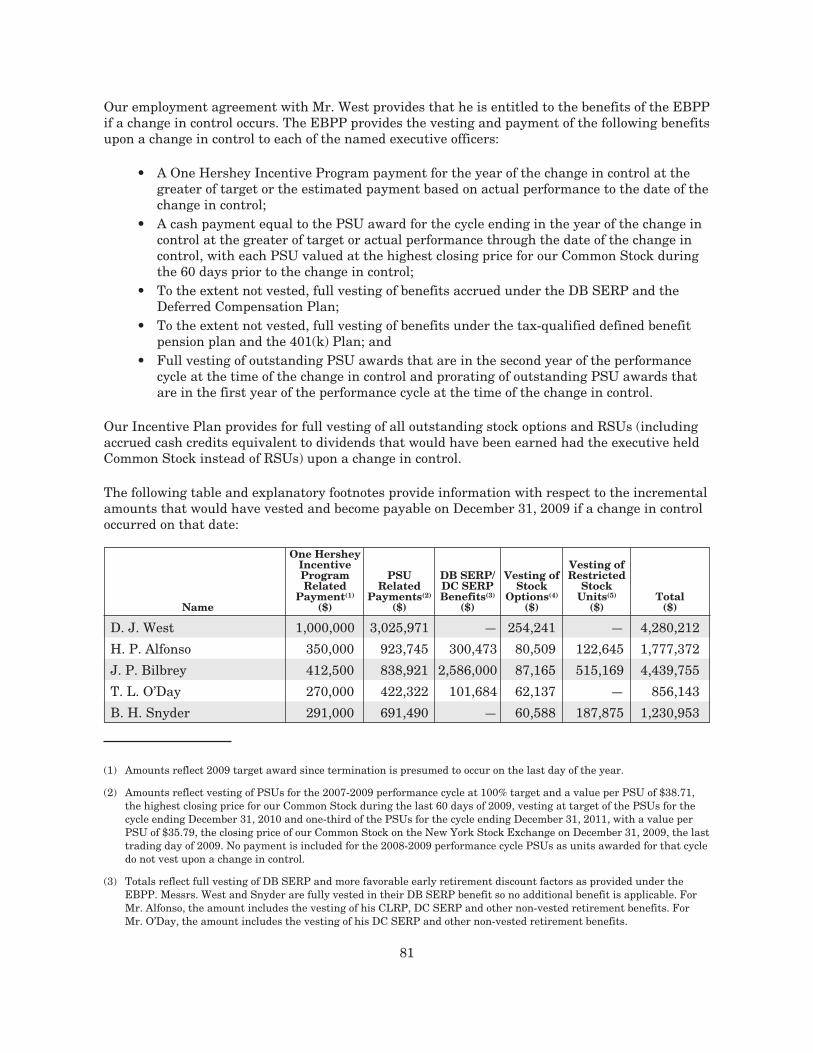
Our employment agreement with Mr. West provides that he is entitled to the benefits of the EBPPif a change in control occurs. The EBPP provides the vesting and payment of the following benefitsupon a change in control to each of the named executive officers:
• A One Hershey Incentive Program payment for the year of the change in control at thegreater of target or the estimated payment based on actual performance to the date of thechange in control;
• A cash payment equal to the PSU award for the cycle ending in the year of the change incontrol at the greater of target or actual performance through the date of the change incontrol, with each PSU valued at the highest closing price for our Common Stock duringthe 60 days prior to the change in control;
• To the extent not vested, full vesting of benefits accrued under the DB SERP and theDeferred Compensation Plan;
• To the extent not vested, full vesting of benefits under the tax-qualified defined benefitpension plan and the 401(k) Plan; and
• Full vesting of outstanding PSU awards that are in the second year of the performancecycle at the time of the change in control and prorating of outstanding PSU awards thatare in the first year of the performance cycle at the time of the change in control.
Our Incentive Plan provides for full vesting of all outstanding stock options and RSUs (includingaccrued cash credits equivalent to dividends that would have been earned had the executive heldCommon Stock instead of RSUs) upon a change in control.
The following table and explanatory footnotes provide information with respect to the incrementalamounts that would have vested and become payable on December 31, 2009 if a change in controloccurred on that date:
Name
One HersheyIncentiveProgramRelated
Payment(1)
($)
PSURelated
Payments(2)
($)
DB SERP/DC SERPBenefits(3)
($)
Vesting ofStock
Options(4)
($)
Vesting ofRestricted
StockUnits(5)
($)Total
($)
D. J. West 1,000,000 3,025,971 — 254,241 — 4,280,212
H. P. Alfonso 350,000 923,745 300,473 80,509 122,645 1,777,372
J. P. Bilbrey 412,500 838,921 2,586,000 87,165 515,169 4,439,755
T. L. O’Day 270,000 422,322 101,684 62,137 — 856,143
B. H. Snyder 291,000 691,490 — 60,588 187,875 1,230,953
(1) Amounts reflect 2009 target award since termination is presumed to occur on the last day of the year.
(2) Amounts reflect vesting of PSUs for the 2007-2009 performance cycle at 100% target and a value per PSU of $38.71,the highest closing price for our Common Stock during the last 60 days of 2009, vesting at target of the PSUs for thecycle ending December 31, 2010 and one-third of the PSUs for the cycle ending December 31, 2011, with a value perPSU of $35.79, the closing price of our Common Stock on the New York Stock Exchange on December 31, 2009, the lasttrading day of 2009. No payment is included for the 2008-2009 performance cycle PSUs as units awarded for that cycledo not vest upon a change in control.
(3) Totals reflect full vesting of DB SERP and more favorable early retirement discount factors as provided under theEBPP. Messrs. West and Snyder are fully vested in their DB SERP benefit so no additional benefit is applicable. ForMr. Alfonso, the amount includes the vesting of his CLRP, DC SERP and other non-vested retirement benefits. ForMr. O’Day, the amount includes the vesting of his DC SERP and other non-vested retirement benefits.
81
(4) Reflects the value of unvested options that would vest upon a change in control based on the excess, if any, of themarket value of our Common Stock of $35.79 on December 31, 2009 over the exercise price for the options. Informationregarding unvested options as of December 31, 2009 can be found in the Outstanding Equity Awards table.
(5) Reflects the value of unvested RSUs that would vest upon a change in control based on the market value of ourCommon Stock of $35.79 on December 31, 2009, as well as the accrued cash credits equivalent to dividends that wouldhave been earned had the executive held Common Stock instead of RSUs. Information regarding unvested RSUs as ofDecember 31, 2009 can be found in the Outstanding Equity Awards table.
Discharge Not for Cause or Resignation for Good Reason after Change in Control
If the named executive officer’s employment is terminated by the Company without Cause or bythe executive for Good Reason within two years after a change in control, we pay severancebenefits to assist the executive in transitioning to new employment. Good Reason for this purposemeans diminution of the executive’s position, authority, duties or responsibilities; a reduction inbase salary; the requirement that the executive engage in substantially greater business travel;failure to pay current compensation or to continue in effect short- and long-term compensationand employee and retirement benefits; or the failure to fund a grantor trust to support payment ofamounts under the EBPP. The severance benefits under the EBPP for termination after a changein control in 2009 consist of:
• A lump sum cash payment equal to two (or, if less, the number of full and fractional yearsfrom the date of termination to the executive’s 65th birthday, but not less than one) timesthe executive’s base salary and the highest annual incentive program payment paid orpayable during the three years preceding the year of the change in control (but not lessthan the annual incentive program target for the year of the change in control);
• Continuation of medical and other benefits for 24 months (or if less, the number ofmonths until the executive attains age 65, but not less than 12 months), or payment ofthe value of such benefits if continuation is not permitted under the terms of theapplicable plan;
• Outplacement services up to $35,000 and reimbursement for financial and taxpreparation services;
• For participants in the DB SERP an enhanced benefit reflecting an additional two years’credit; and
• For participants in the DC SERP an enhanced benefit reflecting a cash payment equal tothe applicable percentage rate multiplied by his or her annual base salary and lastannual incentive pay calculated as if such amounts were paid during the years in theexecutive’s severance period.
82
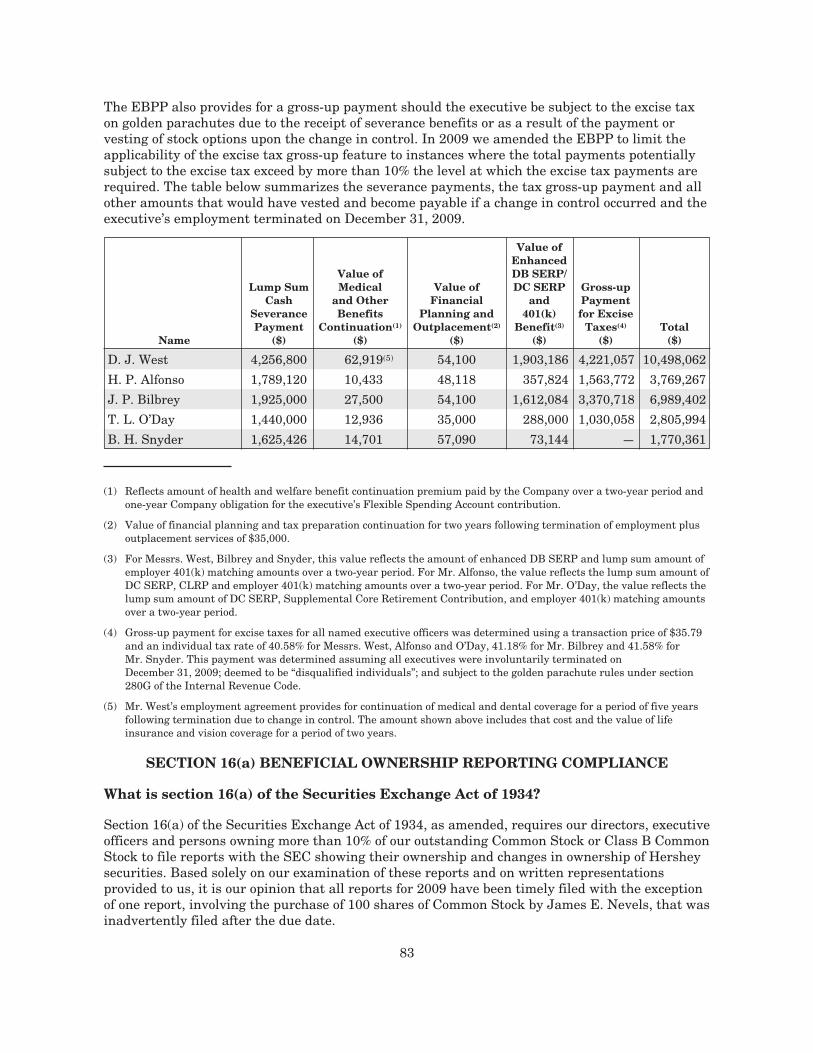
The EBPP also provides for a gross-up payment should the executive be subject to the excise taxon golden parachutes due to the receipt of severance benefits or as a result of the payment orvesting of stock options upon the change in control. In 2009 we amended the EBPP to limit theapplicability of the excise tax gross-up feature to instances where the total payments potentiallysubject to the excise tax exceed by more than 10% the level at which the excise tax payments arerequired. The table below summarizes the severance payments, the tax gross-up payment and allother amounts that would have vested and become payable if a change in control occurred and theexecutive’s employment terminated on December 31, 2009.
Name
Lump SumCash
SeverancePayment
($)
Value ofMedical
and OtherBenefits
Continuation(1)
($)
Value ofFinancial
Planning andOutplacement(2)
($)
Value ofEnhancedDB SERP/DC SERP
and401(k)
Benefit(3)
($)
Gross-upPaymentfor Excise
Taxes(4)
($)Total
($)
D. J. West 4,256,800 62,919(5) 54,100 1,903,186 4,221,057 10,498,062
H. P. Alfonso 1,789,120 10,433 48,118 357,824 1,563,772 3,769,267
J. P. Bilbrey 1,925,000 27,500 54,100 1,612,084 3,370,718 6,989,402
T. L. O’Day 1,440,000 12,936 35,000 288,000 1,030,058 2,805,994
B. H. Snyder 1,625,426 14,701 57,090 73,144 — 1,770,361
(1) Reflects amount of health and welfare benefit continuation premium paid by the Company over a two-year period andone-year Company obligation for the executive’s Flexible Spending Account contribution.
(2) Value of financial planning and tax preparation continuation for two years following termination of employment plusoutplacement services of $35,000.
(3) For Messrs. West, Bilbrey and Snyder, this value reflects the amount of enhanced DB SERP and lump sum amount ofemployer 401(k) matching amounts over a two-year period. For Mr. Alfonso, the value reflects the lump sum amount ofDC SERP, CLRP and employer 401(k) matching amounts over a two-year period. For Mr. O’Day, the value reflects thelump sum amount of DC SERP, Supplemental Core Retirement Contribution, and employer 401(k) matching amountsover a two-year period.
(4) Gross-up payment for excise taxes for all named executive officers was determined using a transaction price of $35.79and an individual tax rate of 40.58% for Messrs. West, Alfonso and O’Day, 41.18% for Mr. Bilbrey and 41.58% forMr. Snyder. This payment was determined assuming all executives were involuntarily terminated onDecember 31, 2009; deemed to be “disqualified individuals”; and subject to the golden parachute rules under section280G of the Internal Revenue Code.
(5) Mr. West’s employment agreement provides for continuation of medical and dental coverage for a period of five yearsfollowing termination due to change in control. The amount shown above includes that cost and the value of lifeinsurance and vision coverage for a period of two years.
SECTION 16(a) BENEFICIAL OWNERSHIP REPORTING COMPLIANCE
What is section 16(a) of the Securities Exchange Act of 1934?
Section 16(a) of the Securities Exchange Act of 1934, as amended, requires our directors, executiveofficers and persons owning more than 10% of our outstanding Common Stock or Class B CommonStock to file reports with the SEC showing their ownership and changes in ownership of Hersheysecurities. Based solely on our examination of these reports and on written representationsprovided to us, it is our opinion that all reports for 2009 have been timely filed with the exceptionof one report, involving the purchase of 100 shares of Common Stock by James E. Nevels, that wasinadvertently filed after the due date.
83
CERTAIN TRANSACTIONS AND RELATIONSHIPS
What is being disclosed in this section?
SEC regulations require that we disclose any transaction, or series of similar transactions, sincethe beginning of 2009, or any contemplated transactions, in which the Company was or is to be aparticipant, in which the amount involved exceeds $120,000 and in which any of the followingpersons had or will have a direct or indirect material interest:
• Our directors or nominees for director;• Our executive officers;• Persons owning more than 5% of any class of our outstanding voting securities; or• The immediate family members of any of the persons identified in the preceding three
bullets.
The SEC refers to these types of transactions as related person transactions and to the personslisted in the bullets as related persons. The SEC is concerned about related person transactionsbecause such transactions, if not properly monitored, may present risks of conflicts of interest orthe appearance of conflicts of interest.
Does the Company have a policy to review, approve or ratify related persontransactions?
Our Board has adopted a Related Person Transaction Policy that governs the review, approval orratification of related person transactions. The Related Person Transaction Policy may be viewedon our corporate website, www.hersheys.com, in the Investor Relations section.
Under our policy, each related person transaction, and any significant amendment or modificationto a related person transaction, must be reviewed and approved or ratified by a committee of ourBoard composed solely of independent directors who have no interest in the transaction. We referto each such committee as a Reviewing Committee. The policy also permits the disinterestedmembers of the full Board to act as a Reviewing Committee.
The Board has designated the Governance Committee as the Reviewing Committee primarilyresponsible for the administration of the Related Person Transaction Policy. In addition, theBoard has designated special Reviewing Committees to oversee certain transactions involving theCompany and Hershey Trust Company, the Milton Hershey School Trust and companies owned bythe Milton Hershey School Trust. To learn more about these special Reviewing Committees,please see the answer to the fourth question in this section below. Finally, the policy provides thatthe Compensation and Executive Organization Committee will review and approve, or review andrecommend to the Board for approval, any employment relationship or transaction involving anexecutive officer of the Company and any related compensation.
When reviewing, approving or ratifying a related person transaction, the Reviewing Committeewill examine several things, including the approximate dollar value of the transaction and allmaterial facts about the related person’s interest in, or relationship to, the transaction. If therelated person transaction involves an outside director or nominee for director, the ReviewingCommittee may also consider whether the transaction would compromise the director’s status asan “independent director,” “outside director” or “non-employee director” under our CorporateGovernance Guidelines and rules and regulations of the New York Stock Exchange, the InternalRevenue Code or the Securities Exchange Act of 1934, as amended.
84

Was the Company a participant in any related person transactions in 2009, or does theCompany currently contemplate being a participant in any related person transactionsin 2010, involving our directors, executive officers or their immediate family members?
We were not a participant in any related person transactions in 2009, and do not currentlycontemplate being a participant in any related person transactions in 2010, involving ourdirectors, executive officers or their immediate family members.
Was the Company a participant in any related person transactions in 2009, or does theCompany currently contemplate being a participant in any related person transactionsin 2010, involving a stockholder owning more than 5% of any class of the Company’ssecurities?
We engage in certain transactions with Milton Hershey School, the Milton Hershey School Trustand companies owned by the Milton Hershey School Trust. As discussed in the next question,many of these transactions are immaterial, ordinary course transactions and are not consideredrelated person transactions. However, from time to time we also engage in certain related persontransactions with the Milton Hershey School Trust and its affiliates.
Our Board has directed that a special Reviewing Committee composed of the directors elected bythe holders of the Common Stock voting separately as a class and having no affiliation with theMilton Hershey School Trust or its affiliates review and make recommendations to the Boardregarding these transactions. However, the Board has also directed that, if there are no directorson the Board who were elected by the holders of our Common Stock voting separately, suchtransactions will be reviewed by the independent members of the Executive Committee who haveno affiliation with the Milton Hershey School Trust or its affiliates.
We were not a participant in any related person transactions in 2009, and do not currentlycontemplate being a participant in any related person transactions in 2010, involving the MiltonHershey School Trust, its affiliates or any other stockholder owning more than 5% of any class ofthe Company’s securities.
Did the Company engage in other transactions with the Milton Hershey SchoolTrust or its affiliates during 2009?
During 2009, we engaged in transactions in the ordinary course of our business with MiltonHershey School, the Milton Hershey School Trust, and companies owned by the Milton HersheySchool Trust. These transactions involved the sale or purchase of goods and services. Thetransactions were primarily with Hershey Entertainment & Resorts Company, a company that iswholly-owned by the Milton Hershey School Trust. All sales and purchases were made on termsand at prices we believe were generally available in the marketplace and were in amounts thatare not material to us or to the Milton Hershey School Trust. Therefore, they are not relatedperson transactions and do not have to be approved under our Related Person Transaction Policy.However, because of our relationship with the Milton Hershey School Trust, we have elected todisclose the aggregate amounts of these transactions for your information. In this regard:
• Our total sales to these entities in 2009 were approximately $1,412,000.• Our total purchases from these entities in 2009 were approximately $2,779,000.
We do not expect that the types of transactions or the amount of payments will change materiallyin 2010.
85
The year 2009 marked the 100-year anniversary of Milton Hershey School. We participated in thecelebration of the anniversary in several ways. We provided a special on-pack message on allstandard and king-size HERSHEY’S Milk Chocolate and HERSHEY’S Milk Chocolate withAlmonds bars thanking consumers for supporting Milton Hershey School through the purchase ofour products. We also partnered with the celebrity, Queen Latifah, to help tell the story of MiltonHershey School and how the School has helped children in need for the past 100 years. QueenLatifah conducted a national media tour to share the School’s story with consumers and to thankthem for supporting the School through the purchase of our products. We also worked with ourmedia agency to place on two independent television channels a documentary film about theSchool that the School developed at its sole cost and conducted public relations events to promotethe premiere of the documentary. Our total expenditures in support of the anniversary wereapproximately $2,500,000 in 2009. During 2010, we expect to incur additional promotional costsassociated with the anniversary of approximately $5,000,000. The story of Milton Hershey and hislegacy reflects positively on our products and provides for us a unique promotional opportunity.Accordingly, we view expenditures related to the School’s 100-year anniversary as ordinarypromotional expenses and not transactions subject to approval under our Related PersonTransaction policy.
We made a $200,000 contribution in 2009 to the M. S. Hershey Foundation to support TheHershey Story, The Museum on Chocolate Avenue, a new facility constructed by the Foundationin Hershey, Pennsylvania, to honor the life and legacy of our founder, Milton S. Hershey. We alsomade a $200,000 contribution to support The Hershey Story in 2010 and may consider additionalcontributions to the Foundation to support The Hershey Story in subsequent years based uponbusiness conditions existing at that time. The Foundation was established by Mr. Hershey in 1935to provide educational and cultural benefits for the residents of Hershey. The Foundation operatesseparately from the Milton Hershey School Trust; however, it is governed by a board of managersappointed by Hershey Trust Company, as trustee for the trust established by Mr. Hershey tobenefit the Foundation, from the membership of the board of directors of Hershey Trust Company.LeRoy S. Zimmerman, an independent member of our Board of Directors and an independentmember of the board of directors of Hershey Trust Company and the board of managers of MiltonHershey School, is also a member of the board of managers of the Foundation. Mr. Zimmermanreceives no compensation for his service on the board of managers of the Foundation.
Finally, in 2009, we leased from the Milton Hershey School Trust a 14.5 acre parcel of landcontaining an 80,000 square foot distribution facility. The initial term of the lease expires in June2010. We have the right to extend the lease for three additional one-year terms; however, we havenotified the Milton Hershey School Trust that we do not intend to continue the lease beyond theinitial term. Rent during calendar year 2009 was $240,000, or $20,000 per month, plus operatingcosts, maintenance and property taxes. Rent from January 1, 2010 through June 30, 2010 will be$120,000, or $20,000 per month, plus operating costs, maintenance and property taxes. Total rentfor the entire period of our occupancy (including rent of $5,000 for a partial month’s occupancy inDecember 2008) will be $365,000, plus operating costs, maintenance and property taxes. The leasewas entered into on terms we believe were generally available in the marketplace and was notmaterial to us or the Milton Hershey School Trust.
86
INFORMATION ABOUT THE 2011 ANNUAL MEETING
When is the 2011 annual meeting of stockholders?
Our 2011 annual meeting of stockholders will be held on April 28, 2011.
What is the deadline to submit a proposal for inclusion in the proxy materials forthe 2011 annual meeting?
To be eligible for inclusion in the proxy materials for the 2011 annual meeting, a stockholderproposal must be received by our Corporate Secretary by the close of business on November 23,2010.
What procedure should I follow if I intend to present a proposal or nominate a directorfrom the floor at the 2011 annual meeting?
A stockholder may present a proposal not included in our 2011 proxy materials from the floor ofthe 2011 annual meeting only if our Corporate Secretary receives notice of the proposal, alongwith additional information required by our by-laws, during the time period beginning onJanuary 5, 2011 and ending on February 4, 2011. Notice should be addressed to The HersheyCompany, Attn: Corporate Secretary, 100 Crystal A Drive, Hershey, Pennsylvania 17033-0810.
The notice must contain the following additional information:
• The stockholder’s name and address;• The stockholder’s shareholdings;• A brief description of the proposal;• A brief description of any financial or other interest the stockholder has in the proposal;
and• Any additional information that the SEC would require if the proposal were presented in
a proxy statement.
A stockholder may nominate a director from the floor of the 2011 annual meeting only if ourCorporate Secretary receives notice of the nomination, along with additional information requiredby our by-laws, during the time period beginning on January 5, 2011 and ending on February 4,2011. The notice must contain the following additional information:
• The stockholder’s name and address;• A representation that the stockholder is a holder of record of any class of our equity
securities;• A representation that the stockholder intends to make the nomination in person or by
proxy at the meeting;• A description of any arrangement the stockholder has with the individual the stockholder
plans to nominate and the reason for making the nomination;• The nominee’s name, address and biographical information;• The written consent of the nominee to serve as a director if elected; and• Any additional information regarding the nominee that the SEC would require if the
nomination were included in a proxy statement regardless of whether the nominationmay be included in such proxy statement.
87
Any stockholder holding 25% or more of the votes entitled to be cast at the annual meeting is notrequired to comply with these pre-notification requirements.
By order of the Board of Directors,
Burton H. SnyderSenior Vice President,General Counsel and Secretary
March 22, 2010
88
APPENDIX A
THE HERSHEY COMPANY
CORPORATE GOVERNANCE GUIDELINES
I. ROLE OF THE BOARD OF DIRECTORS
The business of The Hershey Company (the “Company”) is carried out by its employeesunder the direction and supervision of its Chief Executive Officer (“CEO”). The businessshall be managed under the direction of the board of directors (“Board”). In accordancewith Delaware law, the role of the directors is to exercise their business judgment in thebest interests of the Company. This role includes:
• review of the Company’s performance, strategies and major decisions;• oversight of the Company’s compliance with legal and regulatory requirements and the
integrity of its financial statements;• oversight of management, including review of the CEO’s performance and succession
planning for key management roles; and• oversight of compensation for the CEO, key executives and the Board, as well as
oversight of compensation policies and programs for all employees.
II. SELECTION AND COMPOSITION OF THE BOARD
A. Board Size
As set forth in the By-Laws of the Company (“By-Laws”), the Board has the powerto fix the number of directors by resolution. The Company’s Restated Certificate ofIncorporation requires at least three directors. In fixing the number, the Board will beguided by the principle that a properly functioning Board is small enough to promotesubstantive discussions in which each member can actively participate, and large enoughto offer diversity of background and expertise. The Board will consider whether it is of theappropriate size as part of its annual performance evaluation.
B. Board Membership Criteria
In selecting directors, the Board generally seeks individuals with skills andbackgrounds that will complement those of other directors and maximize the diversity andeffectiveness of the Board as a whole. Directors should be of the highest integrity and well-respected in their fields, with superb judgment and the ability to learn the Company’sbusiness and express informed, useful and constructive views. In reviewing thequalifications of prospective directors, the Board will consider such factors as it deemsappropriate in light of these guidelines, which may include judgment, skill, diversity,experience with businesses and other organizations of comparable size, the interplay of thecandidate’s experience with the experience of the other Board members, and the extent towhich any candidate would be a desirable addition to the Board and any committees of theBoard. In general, the Board seeks individuals who are knowledgeable in fields includingfinance, international business, marketing, information technology, human resources andconsumer products. All members of the Audit Committee must be financially literate andat least one member must have accounting or related financial management expertise andbe an audit committee financial expert as defined in Item 407(d) of Regulation S-K of theSecurities and Exchange Commission (“SEC”), or any successor provision.
A-1
C. Independence
The Board shall be composed of a majority of independent directors. In addition, theCompany’s Audit Committee, Compensation and Executive Organization Committee,Finance and Risk Management Committee, and Governance Committee shall consistsolely of independent directors. At least annually, the directors shall determine whichdirectors are independent. Rather than have one set of criteria for Board members as awhole and additional criteria for Audit Committee members, the Board will judge theindependence of all directors based on the stringent standards applicable to AuditCommittee members. No director will be considered independent unless the Boardaffirmatively determines that the director has no material relationship with the Company.Additionally, the independence of directors shall be determined based on the followingcriteria:
1. A director who receives (or, in the last three years, received) directcompensation as an employee or any consulting, advisory or other compensatory fees fromthe Company, other than director or committee fees and pension or other forms of deferredcompensation for prior service (provided that such compensation is not contingent in anyway on continued service), is not independent. A director whose immediate familymember, other than an adult child who does not share a home with the director, receivesor in the past three years received such compensation or fees from the Company is notindependent. The receipt of such compensation or fees in any single year that does not (ordid not) exceed $120,000, by a director’s adult child who (i) does not share the director’shome and has not shared the director’s home within the last three years, and (ii) does notserve, and has not served within such period, as an elected or appointed officer of theCompany, will be deemed an immaterial relationship that shall not preclude anindependence determination for such director.
2. A director who is (or, within the last three years, was) a partner, member,an officer such as a managing director occupying a comparable position or executiveofficer, of an entity to whom the company pays (or within the last three years paid)consulting, advisory or other compensatory fees for legal, consulting, investment bankingor financial advisory services, is not independent. Payment of such fees to an entity wherethe director is a limited partner, non-managing member or a similar position where, ineach case, the director has no active role in providing services to the Company, will bedeemed an immaterial relationship that shall not preclude an independence determinationfor such director.
3. A director who is a current partner or employee of a firm that is theCompany’s internal or external auditor is not independent. A director whose immediatefamily member is a current partner of such a firm, or is a current employee of such a firmand personally works on the Company’s audit, is not independent. A director who was, orwhose immediate family member was, within the last three years a partner or employee ofsuch a firm and personally worked on the Company’s audit within that time is notindependent.
4. A director who is (or, within the last three years, was) employed, or whoseimmediate family member is (or, within the last three years, was) employed, as anexecutive officer of another company where any of the Company's present executivesserves (or, within the last three years, served) on that company's compensation committeeis not independent.
A-2
5. A director who is an executive officer or an employee, or whose immediatefamily member is an executive officer, of a company that makes (or, within the last threeyears, made) payments to or receives (or, within the last three years, received) paymentsfrom the Company for property or services in an amount which, in any single fiscal year,exceeds the greater of $1 million or 2% of such other company’s consolidated grossrevenues, is not independent. A director who is an executive officer or an employee, orwhose immediate family member is an executive officer, of a company that makes (or,within the last three years, made) payments to or receives (or, within the last three years,received) payments from the Company for property or services in an amount which, in anysingle fiscal year, is less than the greater of $1 million or 2% of such other company’sconsolidated gross revenues has an immaterial relationship that shall not preclude anindependence determination for such director.
6. A director who is (or, within the last three years, was) an employee or anon-employee executive officer of the Company is not independent.
7. A director who is an immediate family member of an individual who is (or,within the last three years, was) an executive officer of the Company, whether as anemployee or non-employee, is not independent.
8. A director who is an affiliated person of the Company, as defined under therules of the SEC, is not independent; provided, however, if the director is an affiliatedperson solely because he or she sits on the board of directors of an affiliate of theCompany, as defined under the rules of the SEC, then the director has an immaterialrelationship with the Company that shall not preclude an independence determination forsuch director if he or she, except for being a director on each such board of directors, doesnot accept directly or indirectly any consulting, advisory, or other compensatory fee fromeither such entity, other than the receipt of only ordinary-course compensation for servingas a member of the board of directors, or any board committee of each such entity, and thedirector satisfies all other standards.
9. A director who is, or whose immediate family member is, an officer oremployee of a non-profit organization to which the Company has donated more than$100,000 in any year within the last three years is not independent.
10. A director's participation in the Company's Charitable Awards Program orreceipt of compensation and benefits for service as a director of the Company in accordancewith Company policies and programs will be deemed an immaterial relationship with theCompany that shall not preclude an independence determination for such director.
For purposes of application of these criteria, (i) “immediate family” shall be defined asincluding all individuals who are considered immediate family of a director under theregulations implementing the Sarbanes-Oxley Act, as well as all individuals who areconsidered immediate family of a director under the NYSE listing standards, (ii) adirector’s receipt of compensation for former service as an interim Chairman or CEO orother executive officer is considered an immaterial relationship that shall not preclude anindependence determination for such director, and (iii) references to “Company” forpurposes of determining independence, include any parent or subsidiary in a consolidatedgroup with the Company. Directors shall notify the Chair of the Governance Committeeand the Chairman and/or CEO prior to accepting a board position on any otherorganization, so that the effect, if any, of such position on the director’s independence maybe evaluated.
A-3
D. Selection of Board Members
Nomination of directors is the responsibility of the Governance Committee, all ofwhose members shall be independent directors. Recommendations may come fromdirectors, shareholders or other sources. Recommendations may come from management,with the understanding that the Board is not required to consider candidatesrecommended by management. It is expected that all members of the GovernanceCommittee will interview prospective candidates before their nominations are approved bythe Committee. An offer to join the Board will be extended by the Chair of the GovernanceCommittee or the Chairman of the Board if the Chairman is not also an officer oremployee of the Company.
E. Tenure
1. The Board has not established term limits, and, given the value added byexperienced directors who can provide a historical perspective, term limits are notconsidered appropriate. New ideas and diversity of views are maintained by carefulselection of directors when vacancies occur. In addition, the performance of individualdirectors and the Board as a whole are reviewed annually, prior to the nomination ofdirectors for vote by stockholders at each Annual Meeting.
2. When a director’s principal occupation or business or institutionalaffiliation changes materially from that at the time of his or her first election to the Board,the director will tender his or her resignation by directing a letter of resignation to theChair of the Governance Committee, except that if the director is the Chair of suchcommittee, he or she shall direct the resignation to the Chairman of the Board or to theChair of the Compensation and Executive Organization Committee if the Chair of theGovernance Committee also serves as the Chairman of the Board. The Board willdetermine whether to accept such resignation. Pending the Board’s final determination,such letter of resignation shall be deemed to be only preliminary consideration ofresignation by the director, and not a final decision to resign, unless the director expressesa contrary intent in writing.
3. Directors will not be nominated for reelection after their 72nd birthday.
III. OPERATION OF THE BOARD
A. Chairman
The Chairman of the Board presides at all meetings of stockholders of the Companyand of the Board and sees that all orders, resolutions and policies adopted or establishedby the Board are carried into effect. The Chairman of the Board is elected by and from themembers of the Board and may, but need not, be the Chief Executive Officer or anotherofficer of the Company.
B. Board Meetings
1. The Board will hold approximately six regular meetings per year, scheduledby resolution of the Board sufficiently far in advance to accommodate the schedules of thedirectors. Special meetings may be called at any time by the Chairman or a Vice Chairmanof the Board (if any), or by the CEO, or by one-sixth (calculated to the nearest wholenumber) of the total number of directors constituting the Board, to address specific issues.
A-4
2. Agendas are established by the Chairman and sent in advance to the Board.Any director may submit agenda items for any meeting. A rolling agenda has beenestablished, which includes a full annual review of the Company’s strategic plan, quarterlyreviews of the Company’s financial performance, and committee reports and updates ateach meeting on the business and other items of significance to the Company. Informationrelevant to agenda items shall be submitted to the Board in advance, and the agenda willbe structured to allow appropriate time for discussion of important items.
C. Executive Sessions
Executive sessions are sessions of non-management directors. Executive sessionsare held at the conclusion of each regular Board meeting, and at such other times as thenon-management directors may determine, without the CEO or any other member ofCompany management present, to review such matters as may be appropriate, includingthe report of the outside auditors, the criteria upon which the performance of the CEO andother senior managers is based, the performance of the CEO measured against suchcriteria and the compensation of the CEO. If at any time the Board includes anynon-management directors who are not independent, such directors shall be excluded fromone executive session each year. Executive sessions are chaired by the Chairman of theBoard or, in the Chairman’s absence, a Vice Chairman of the Board (if any). If at any timethe Chairman is also an officer of the Company, or if the Chairman is excluded from anexecutive session because he or she is a non-management director who is not independent,then the executive session shall be chaired by a Vice Chairman of the Board (if any) whomeets the independence standards under these Guidelines. In the absence of anindependent Vice Chairman, then executive sessions shall be chaired by an independentdirector assigned on a rotating basis. In addition, any director may call a special executivesession to discuss a matter of significance to the Company and/or the Board.
D. Committees
All major decisions are made by the Board; however, the Board has establishedcommittees to enable it to handle certain matters in more depth. The committees are(1) Audit, (2) Governance, (3) Compensation and Executive Organization, (4) Finance andRisk Management and (5) Executive (or any successor to any of the foregoing committeeshaving duties and responsibilities similar to such committee). Members are expected toserve on committees, as recommended by the Governance Committee and approved by theBoard. Committee members serve at the pleasure of the Board, for such period of time asthe Board may determine, consistent with these governance guidelines. All directorsserving on the Audit, Governance, Finance and Risk Management, and Compensation andExecutive Organization committees must be independent, as determined by the Board inaccordance with these governance guidelines and as required by applicable law andregulation. The Executive Committee is made up of the Chairman of the Board and thechair of each of the other committees along with one other director appointed by theBoard. Any transaction not in the ordinary course of business by and among the Companyand Hershey Trust Company, Hershey Entertainment & Resorts Company and/or MiltonHershey School, or any subsidiary, division or affiliate of any of the foregoing, shall bereviewed and approved in advance by a special committee composed of the directorselected by the holders of Common Stock voting separately as a class, which specialcommittee will make its recommendation to the Board regarding such potentialtransaction. If at any time there are no directors serving on the Board who were elected bythe holders of the Common Stock voting separately as a class, then the independentmembers of the Executive Committee will serve as the special committee, provided, that
A-5
no director who is an officer or director of or is otherwise affiliated with any of the above-listed entities shall participate in the review or approval of any such transaction on behalfof the Company. The charter of each committee is published on the Company’s website andwill be made available to any shareholder on request. Each committee chair shall reportthe highlights of the committee meeting to the full Board at the Board meeting followingthe committee meeting. The Chairman of the Board serves as chair of the ExecutiveCommittee. The chairs of the Audit Committee, the Governance Committee, the Financeand Risk Management Committee and the Compensation and Executive OrganizationCommittee (the “Independent Committees”) are recommended by the GovernanceCommittee and approved by the Board. Under normal circumstances, following fourconsecutive years as the Chair of an Independent Committee, a director shall not serveagain on such committee for at least one year after standing down as the Chair thereof. AChair of an Independent Committee may be permitted to continue to serve on suchcommittee with Board approval if the Board determines that the former Chair uniquelyfills a specific need of such Committee. The structure and functioning of the committeesshall be part of the annual Board evaluation.
E. Director Participation in Board and Committee Meetings
Each director is expected to participate actively in their respective committeemeetings and in Board meetings. Directors are expected to attend all meetings and areexpected to come prepared for a thorough discussion of agenda items. Directors areexpected to attend the Company’s Annual Meeting of Stockholders. Participation bydirectors will be reviewed as part of the annual assessment of the Board and itscommittees.
IV. ACCESS TO COMPANY PERSONNEL
Directors have full and free access to the Company’s officers and employees.Division and function heads regularly make presentations to the Board and committees onsubjects within their areas of responsibility. The CEO will invite other members ofmanagement to attend meetings or other Board functions as appropriate. Directors mayinitiate communication with any employee and/or invite any employee to any Board orcommittee meeting; however, they are expected to exercise judgment to protect theconfidentiality of sensitive matters and to avoid disruption to the business, and they areexpected to copy the CEO on written communications to company personnel under normalcircumstances.
V. ACCESS TO OUTSIDE ADVISORS
The Board and each committee have the power to hire independent legal, financialor other advisors as they may deem necessary, without consulting or obtaining approval ofCompany management in advance.
VI. TRAINING
A. Orientation
Each new Board member shall undergo an orientation designed to educate thedirector about the Company and his/her obligations as a director. At a minimum, theorientation shall include meetings with several members of the Hershey Executive Teamand the Governance and Compliance Officer, a tour of key facilities and review of reference
A-6
materials regarding the Company and corporate governance, the Company’s strategic planand the last annual report.
B. Ongoing Education
The Company will pay reasonable expenses for each director to attend at least onerelevant continuing education program each year. Directors are encouraged but notrequired to attend. In addition, the Company will keep directors informed of significantdevelopments as appropriate. Each Board meeting shall include a report to directors on(1) significant business developments affecting the Company, (2) significant legaldevelopments affecting the Company, and (3) if and as necessary, significant legaldevelopments affecting the Board members’ obligations as directors.
VII. OVERSIGHT OF MANAGEMENT
A. Review of CEO Performance and Compensation
The independent directors, together with the Compensation and ExecutiveOrganization Committee, monitor the performance of the CEO. Annually they shall reviewthe performance appraisal of the CEO performed by the Compensation and ExecutiveOrganization Committee and shall review and approve the CEO’s compensationrecommended by such committee.
B. Review of Strategic Plan
The Board shall review the Company’s strategic plan annually. All Board membersare expected to participate in an active review. The CEO will invite to the review membersof management with responsibility for key divisions and functions and any other personnelthe CEO deems helpful, for purposes of providing information sufficient to facilitate a fulland frank discussion.
C. Management Succession
1. The Board shall review management succession plans annually. This shallinclude review by the Board of organization strength and management development andsuccession plans for each member of the Company’s executive team. The Board shall alsomaintain and review annually, or more often if appropriate, a succession plan for the CEO.
2. If the President, CEO and/or Chairman of the Board is unable to performfor any reason, including death, incapacity, termination, or resignation before areplacement is elected, then: (1) if the Company is without a Chairman of the Board, theVice Chairman of the Board, if any, shall serve as Chairman until a replacement is electedor, in the case of temporary incapacity, until the Board determines that the incapacity hasended, and in the absence of a Vice Chairman of the Board, the Chair of the GovernanceCommittee or, in his or her absence, the Chair of the Compensation and ExecutiveOrganization Committee, shall serve in such capacity; (2) if the Company is without aPresident and CEO, the interim President and CEO shall be the officer of the Companyapproved by the Board, taking into consideration the annual recommendation of the CEO;(3) in the case of incapacity of the President, CEO and/or Chairman, the Board shalldetermine whether to search for a replacement; and (4) the Chair of the Compensation andExecutive Organization Committee shall lead any search for a replacement.
A-7
VIII. EVALUATION AND COMPENSATION OF THE BOARD
A. Annual Evaluations
The directors shall evaluate the performance of the Board and its committeesannually. Each director shall complete an evaluation for the Board as a whole and each ofthe committees on which he or she has served during the year. Evaluation results shall bereviewed by the Governance Committee, which shall present to the Board the resultsalong with any recommendations for change that the committee deems appropriate. Thesegovernance guidelines and the committee charters shall be reviewed annually inconjunction with the annual evaluation. The Governance Committee shall also review theperformance of Board members when they are considered for reelection and at any timeupon request of a Board member.
B. Director Compensation and Benefits
1. General. The Compensation and Executive Organization Committee shallreview and make recommendations to the Board annually with respect to the form andamount of compensation and benefits. These will be established after due consideration of theresponsibilities assumed and the compensation of directors at similarly situated companies.
2. Stock Ownership.
a. The Board will not nominate any person to be elected a director at anAnnual Meeting of Stockholders unless such person owns, as defined below, oragrees to purchase and own at least 200 shares of the Company’s Common Stock onor before the record date for such meeting.
b. The Board desires that each director own, as defined herein, sharesof the Company’s Common Stock in an amount at least equal to the StockholdingGuidelines as of January 1 of each year following the fifth anniversary of the datethe Board approves this policy in the case of current directors and as of January 1 ofeach year following the fifth anniversary of becoming a director in the case of adirector first becoming a director subsequent to the date of such Board approval. Forpurposes of the requirements herein and in paragraph a. above, ownership of theCompany’s Common Stock includes Common Stock equivalent shares such ascommon stock units deferred under the Company’s Directors’ Compensation Planand restricted stock units granted quarterly under that plan or the Company’sEquity and Incentive Compensation Plan.
c. Stockholding Guidelines as of January 1 of any year means thenumber of shares of the Company’s Common Stock, as described in paragraph b.above, with a value, valued at the average closing price on the NYSE of theCommon Stock on the first three trading days of the month of December of thepreceding year, equal to three times the annual retainer under the Company’sDirectors’ Compensation Plan for such year.
IX. CODE OF CONDUCT
Directors are held to the highest standards of integrity. The Company’s Code ofEthical Business Conduct applies to directors as well as officers and employees and coversareas including conflicts of interest, insider trading and compliance with laws andregulations. The Audit Committee has responsibility for oversight of the Company’scommunication of, and compliance with, the Code of Ethical Business Conduct.
A-8
UNITED STATESSECURITIES AND EXCHANGE COMMISSION
WASHINGTON, D.C. 20549
FORM 10-KÈ Annual Report Pursuant to Section 13 or 15(d) of the Securities Exchange Act of 1934
For the fiscal year ended December 31, 2009OR
‘ Transition Report Pursuant to Section 13 or 15(d) of the Securities Exchange Act of 1934For the transition period from to
Commission File Number 1-183Registrant, State of Incorporation, Address and Telephone Number
THE HERSHEY COMPANY(a Delaware corporation)100 Crystal A Drive
Hershey, Pennsylvania 17033(717) 534-4200
I.R.S. Employer Identification Number 23-0691590
Securities registered pursuant to Section 12(b) of the Act:Title of each class: Name of each exchange on which registered:
Common Stock, one dollar par value New York Stock ExchangeSecurities registered pursuant to Section 12(g) of the Act: Class B Common Stock, one dollar par value
(Title of class)
Indicate by check mark if the registrant is a well-known seasoned issuer, as defined in Rule 405 of the SecuritiesAct. Yes È No ‘
Indicate by check mark if the registrant is not required to file reports pursuant to Section 13 or Section 15(d) of theAct. Yes ‘ No È
Indicate by check mark whether the registrant (1) has filed all reports required to be filed by Section 13 or 15(d) of the SecuritiesExchange Act of 1934 during the preceding 12 months (or for such shorter period that the registrant was required to file such reports),and (2) has been subject to such filing requirements for the past 90 days. Yes È No ‘
Indicate by check mark whether the registrant has submitted electronically and posted on its corporate Web site, if any, everyInteractive Data File required to be submitted and posted pursuant to Rule 405 of Regulation S-T (§232.405 of this chapter) during thepreceding 12 months (or for such shorter period that the registrant was required to submit and post such files). Yes È No ‘
Indicate by check mark if disclosure of delinquent filers pursuant to Item 405 of Regulation S-K (§229.405 of this chapter) is notcontained herein, and will not be contained, to the best of registrant’s knowledge, in definitive proxy or information statementsincorporated by reference in Part III of this Form 10-K or any amendment to this Form 10-K. ‘
Indicate by check mark whether the registrant is a large accelerated filer, an accelerated filer, a non-accelerated filer, or a smallerreporting company. See the definitions of “large accelerated filer,” “accelerated filer” and “smaller reporting company” in Rule 12b-2of the Exchange Act. (Check one):
Large accelerated filer È Accelerated filer ‘
Non-accelerated filer ‘ (Do not check if a smaller reporting company) Smaller reporting company ‘Indicate by check mark whether the registrant is a shell company (as defined in Rule 12b-2 of the Exchange
Act). Yes ‘ No ÈState the aggregate market value of the voting and non-voting common equity held by non-affiliates computed by reference to the
price at which the common equity was last sold, or the average bid and asked price of such common equity, as of the last business dayof the registrant’s most recently completed second fiscal quarter.
Common Stock, one dollar par value—$5,584,196,830 as of July 5, 2009.Class B Common Stock, one dollar par value—$3,549,358 as of July 5, 2009. While the Class B Common Stock is not listed forpublic trading on any exchange or market system, shares of that class are convertible into shares of Common Stock at any timeon a share-for-share basis. The market value indicated is calculated based on the closing price of the Common Stock on the NewYork Stock Exchange on July 5, 2009.
Indicate the number of shares outstanding of each of the registrant’s classes of common stock as of the latest practicable date.Common Stock, one dollar par value—167,213,521 shares, as of February 10, 2010.Class B Common Stock, one dollar par value—60,708,908 shares, as of February 10, 2010.
DOCUMENTS INCORPORATED BY REFERENCEPortions of the Company’s Proxy Statement for the Company’s 2010 Annual Meeting of Stockholders are incorporated by
reference into Part III of this report.
PART I
Item 1. BUSINESS
Company Overview
The Hershey Company was incorporated under the laws of the State of Delaware on October 24, 1927 as asuccessor to a business founded in 1894 by Milton S. Hershey. In this report, the terms “Company,” “we,” “us,”or “our” mean The Hershey Company and its wholly-owned subsidiaries and entities in which it has a controllingfinancial interest, unless the context indicates otherwise.
We are the largest producer of quality chocolate in North America and a global leader in chocolate andsugar confectionery. Our principal product groups include chocolate and confectionery products; snack products;gum and mint refreshment products; and pantry items, such as baking ingredients, toppings and beverages.
Reportable Segment
We operate as a single reportable segment in manufacturing, marketing, selling and distributing variouspackage types of chocolate and confectionery products, pantry items and gum and mint refreshment productsunder more than 80 brand names. Our five operating segments comprise geographic regions including the UnitedStates, Canada, Mexico, Brazil and other international locations, such as India, Korea, Japan, the Middle East,China and the Philippines. We market confectionery products in approximately 50 countries worldwide.
For segment reporting purposes, we aggregate our operations in the Americas, which comprise the UnitedStates, Canada, Mexico and Brazil. We base this aggregation on similar economic characteristics; products andservices; production processes; types or classes of customers; distribution methods; and the similar nature of theregulatory environment in each location. We aggregate our other international operations with the Americas toform one reportable segment. When combined, our other international operations share most of the aggregationcriteria and represent less than 10% of consolidated revenues, operating profits and assets.
Selling and Marketing Organization
Our selling and marketing organization is comprised of Hershey North America, Hershey International andthe Global Marketing Group. This organization is designed to:
• Leverage our marketing and sales leadership in the United States and Canada;
• Focus on key strategic growth areas in global markets; and
• Build capabilities that capitalize on unique consumer and customer trends.
Hershey North America
Hershey North America has responsibility for continuing to build our chocolate and confectionery marketposition, while capitalizing on our scale in the U.S. and Canada. This organization leverages our ability tocapitalize on the unique consumer and customer trends within each country. This includes developing andgrowing our business in our chocolate, sugar confectionery, refreshment, pantry, and food service productlines. A component of Hershey North America, The Hershey Experience, manages our retail operationswithin the United States that include Hershey’s Chocolate World in Hershey, Pennsylvania; Hershey’sTimes Square in New York, New York; and Hershey’s Chicago in Chicago, Illinois.
Hershey International
Hershey International markets chocolate and confectionery products, beverages and pantry items worldwideand has responsibility for pursuing profitable growth opportunities in key markets, primarily in LatinAmerica and Asia. This organization is responsible for international subsidiaries that manufacture, import,market, sell or distribute chocolate, confectionery and beverage products in Mexico, Brazil and India.
1
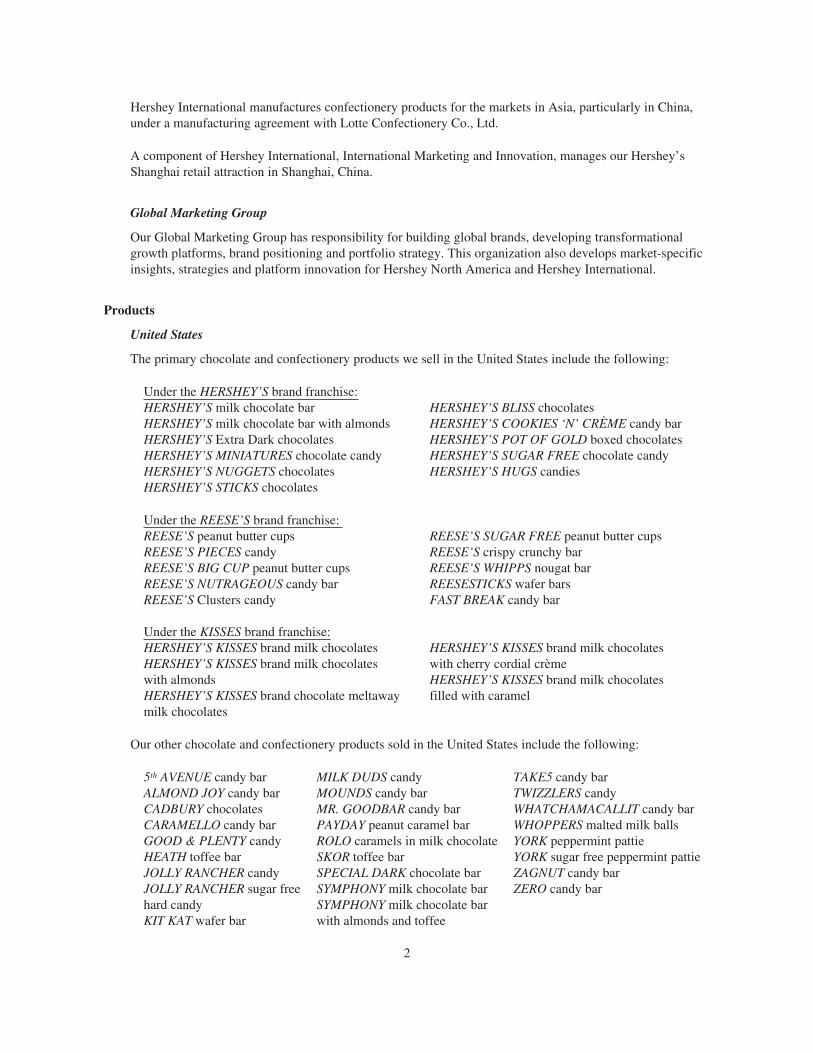
Hershey International manufactures confectionery products for the markets in Asia, particularly in China,under a manufacturing agreement with Lotte Confectionery Co., Ltd.
A component of Hershey International, International Marketing and Innovation, manages our Hershey’sShanghai retail attraction in Shanghai, China.
Global Marketing Group
Our Global Marketing Group has responsibility for building global brands, developing transformationalgrowth platforms, brand positioning and portfolio strategy. This organization also develops market-specificinsights, strategies and platform innovation for Hershey North America and Hershey International.
Products
United States
The primary chocolate and confectionery products we sell in the United States include the following:
Under the HERSHEY’S brand franchise:HERSHEY’S milk chocolate bar HERSHEY’S BLISS chocolatesHERSHEY’S milk chocolate bar with almonds HERSHEY’S COOKIES ‘N’ CRÈME candy barHERSHEY’S Extra Dark chocolates HERSHEY’S POT OF GOLD boxed chocolatesHERSHEY’S MINIATURES chocolate candy HERSHEY’S SUGAR FREE chocolate candyHERSHEY’S NUGGETS chocolates HERSHEY’S HUGS candiesHERSHEY’S STICKS chocolates
Under the REESE’S brand franchise:REESE’S peanut butter cups REESE’S SUGAR FREE peanut butter cupsREESE’S PIECES candy REESE’S crispy crunchy barREESE’S BIG CUP peanut butter cups REESE’S WHIPPS nougat barREESE’S NUTRAGEOUS candy bar REESESTICKS wafer barsREESE’S Clusters candy FAST BREAK candy bar
Under the KISSES brand franchise:HERSHEY’S KISSES brand milk chocolates HERSHEY’S KISSES brand milk chocolatesHERSHEY’S KISSES brand milk chocolates with cherry cordial crèmewith almonds HERSHEY’S KISSES brand milk chocolatesHERSHEY’S KISSES brand chocolate meltawaymilk chocolates
filled with caramel
Our other chocolate and confectionery products sold in the United States include the following:
5th AVENUE candy barALMOND JOY candy barCADBURY chocolatesCARAMELLO candy barGOOD & PLENTY candyHEATH toffee barJOLLY RANCHER candyJOLLY RANCHER sugar freehard candyKIT KAT wafer bar
MILK DUDS candyMOUNDS candy barMR. GOODBAR candy barPAYDAY peanut caramel barROLO caramels in milk chocolateSKOR toffee barSPECIAL DARK chocolate barSYMPHONY milk chocolate barSYMPHONY milk chocolate barwith almonds and toffee
TAKE5 candy barTWIZZLERS candyWHATCHAMACALLIT candy barWHOPPERS malted milk ballsYORK peppermint pattieYORK sugar free peppermint pattieZAGNUT candy barZERO candy bar
2

We also sell products in the United States under the following product lines:
Premium products
Artisan Confections Company, a wholly-owned subsidiary of The Hershey Company, marketsSCHARFFEN BERGER high-cacao dark chocolate products, and DAGOBA natural and organic chocolateproducts. Our SCHARFFEN BERGER products include chocolate bars, tasting squares, home bakingproducts and professional chocolate and cocoa items. DAGOBA products include chocolate bars, drinkingchocolate and baking products.
Snack products
Our snack products include HERSHEY’S SNACKSTERS snack mix; HERSHEY’S and REESE’S granolabars; REESE’S SNACK BARZ and MAUNA LOA macadamia snack nuts and cookies in several varieties.
Refreshment products
Our line of refreshment products includes ICE BREAKERS mints and chewing gum, BREATH SAVERSmints, BUBBLE YUM bubble gum and YORK mints.
Pantry items
Pantry items include HERSHEY’S, REESE’S, HEATH, and SCHARFFEN BERGER baking products. Ourtoppings and sundae syrups include REESE’S, HEATH and HERSHEY’S. We sell hot cocoa mix under theHERSHEY’S, HERSHEY’S GOODNIGHT HUGS and HERSHEY’S GOODNIGHT KISSES brand names.
Canada
Principal products we sell in Canada are HERSHEY’S milk chocolate bars and milk chocolate bars withalmonds; OH HENRY! candy bars; REESE PEANUT BUTTER CUPS candy; HERSHEY’S KISSES brandmilk chocolates; TWIZZLERS candy; GLOSETTE chocolate-covered raisins, peanuts and almonds; JOLLYRANCHER candy; WHOPPERS malted milk balls; SKOR toffee bars; EAT MORE candy bars; POT OFGOLD boxed chocolates; and CHIPITS chocolate chips.
Mexico
We manufacture, import, market, sell and distribute chocolate and confectionery products in Mexico,including HERSHEY’S, KISSES, JOLLY RANCHER, and PELÓN PELO RICO chocolate, confectionery andbeverage items.
Brazil
We manufacture, import and market chocolate and confectionery products in Brazil, including HERSHEY’Schocolate and confectionery items and IO-IO items.
India
We manufacture, market, sell and distribute confectionery, beverage and cooking oil products in India,including NUTRINE and GODREJ confectionery and beverage products.
Customers
Full-time sales representatives and food brokers sell our products to our customers. Our customers aremainly wholesale distributors, chain grocery stores, mass merchandisers, chain drug stores, vending companies,
3
wholesale clubs, convenience stores, dollar stores, concessionaires, department stores and natural food stores.Our customers then resell our products to end-consumers in over 2 million retail outlets in North America andother locations worldwide. In 2009, sales to McLane Company, Inc., one of the largest wholesale distributors inthe United States to convenience stores, drug stores, wholesale clubs and mass merchandisers, amounted toapproximately 27% of our total net sales. McLane Company, Inc. is the primary distributor of our products toWal-Mart Stores, Inc.
Marketing Strategy and Seasonality
The foundation of our marketing strategy is our strong brand equities, product innovation, the consistentlysuperior quality of our products, our manufacturing expertise and mass distribution capabilities. We also devoteconsiderable resources to the identification, development, testing, manufacturing and marketing of new products.We have a variety of promotional programs for our customers as well as advertising and promotional programsfor consumers of our products. We use our promotional programs to stimulate sales of certain products at varioustimes throughout the year. Our sales are typically higher during the third and fourth quarters of the year,representing seasonal and holiday-related sales patterns.
Product Distribution
In conjunction with our sales and marketing efforts, our efficient product distribution network helps usmaintain sales growth and provide superior customer service. We plan optimum stock levels and work with ourcustomers to set reasonable delivery times. Our distribution network provides for the efficient shipment of ourproducts from our manufacturing plants to distribution centers strategically located throughout the United States,Canada and Mexico. We primarily use common carriers to deliver our products from these distribution points toour customers.
Price Changes
We change prices and weights of our products when necessary to accommodate changes in costs, thecompetitive environment and profit objectives, while at the same time maintaining consumer value. Priceincreases and weight changes help to offset increases in our input costs, including raw and packaging materials,fuel, utilities, transportation, and employee benefits.
In August 2008, we announced an increase in wholesale prices across the United States, Puerto Rico andexport chocolate and sugar confectionery lines. This price increase was effective immediately, and represented aweighted-average 11% increase on our instant consumable, multi-pack and packaged candy lines. These changesapproximated a 10% increase over the entire domestic product line.
In January 2008, we announced an increase in the wholesale prices of our domestic confectionery line,effective immediately. This price increase applied to our standard bar, king-size bar, 6-pack and vending linesand represented a weighted-average increase of approximately 13% on these items. These price changesapproximated a 3% increase over our entire domestic product line.
In April 2007, we announced an increase of approximately 4% to 5% in the wholesale prices of ourdomestic confectionery line, effective immediately. The price increase applied to our standard bar, king-size bar,6-pack and vending lines. These products represent approximately one-third of our U.S. confectionery portfolio.
Usually there is a time lag between the effective date of list price increases and the impact of the priceincreases on net sales. The impact of price increases is often delayed because we honor previous commitments toplanned consumer and customer promotions and merchandising events subsequent to the effective date of theprice increases. In addition, promotional allowances may be increased subsequent to the effective date, delayingor partially offsetting the impact of price increases on net sales.
4
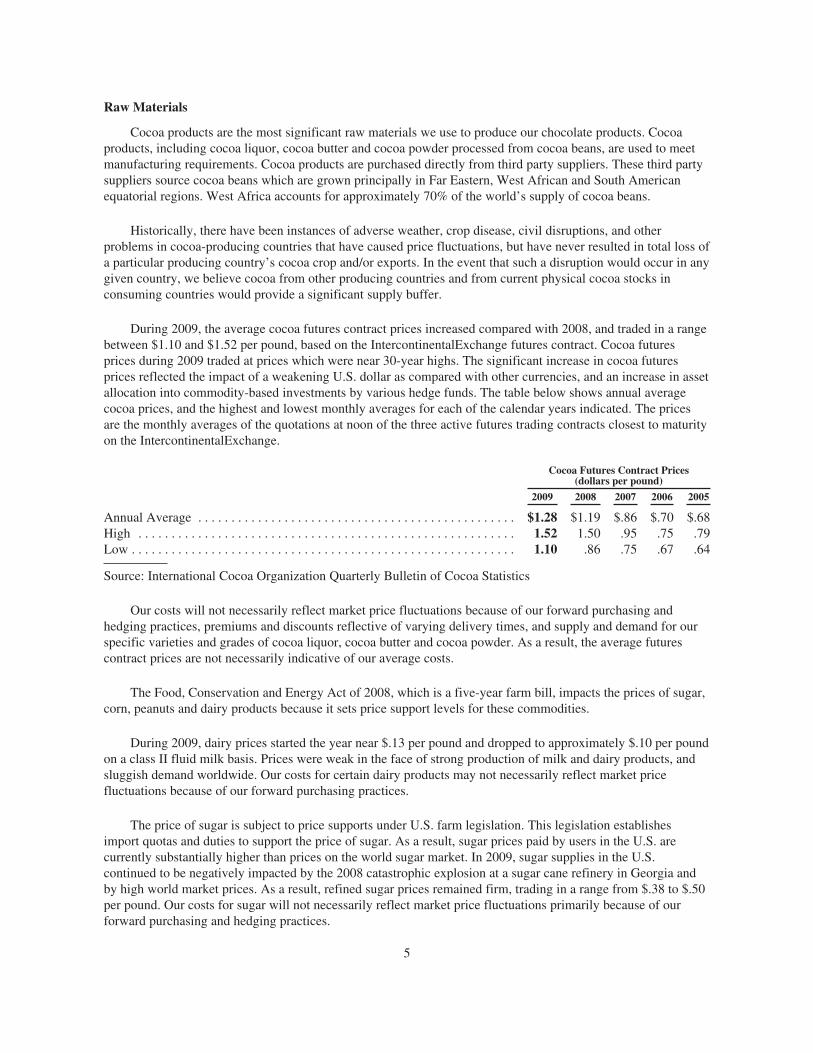
Raw Materials
Cocoa products are the most significant raw materials we use to produce our chocolate products. Cocoaproducts, including cocoa liquor, cocoa butter and cocoa powder processed from cocoa beans, are used to meetmanufacturing requirements. Cocoa products are purchased directly from third party suppliers. These third partysuppliers source cocoa beans which are grown principally in Far Eastern, West African and South Americanequatorial regions. West Africa accounts for approximately 70% of the world’s supply of cocoa beans.
Historically, there have been instances of adverse weather, crop disease, civil disruptions, and otherproblems in cocoa-producing countries that have caused price fluctuations, but have never resulted in total loss ofa particular producing country’s cocoa crop and/or exports. In the event that such a disruption would occur in anygiven country, we believe cocoa from other producing countries and from current physical cocoa stocks inconsuming countries would provide a significant supply buffer.
During 2009, the average cocoa futures contract prices increased compared with 2008, and traded in a rangebetween $1.10 and $1.52 per pound, based on the IntercontinentalExchange futures contract. Cocoa futuresprices during 2009 traded at prices which were near 30-year highs. The significant increase in cocoa futuresprices reflected the impact of a weakening U.S. dollar as compared with other currencies, and an increase in assetallocation into commodity-based investments by various hedge funds. The table below shows annual averagecocoa prices, and the highest and lowest monthly averages for each of the calendar years indicated. The pricesare the monthly averages of the quotations at noon of the three active futures trading contracts closest to maturityon the IntercontinentalExchange.
Cocoa Futures Contract Prices(dollars per pound)
2009 2008 2007 2006 2005
Annual Average . . . . . . . . . . . . . . . . . . . . . . . . . . . . . . . . . . . . . . . . . . . . . . . . $1.28 $1.19 $.86 $.70 $.68High . . . . . . . . . . . . . . . . . . . . . . . . . . . . . . . . . . . . . . . . . . . . . . . . . . . . . . . . . 1.52 1.50 .95 .75 .79Low . . . . . . . . . . . . . . . . . . . . . . . . . . . . . . . . . . . . . . . . . . . . . . . . . . . . . . . . . . 1.10 .86 .75 .67 .64
Source: International Cocoa Organization Quarterly Bulletin of Cocoa Statistics
Our costs will not necessarily reflect market price fluctuations because of our forward purchasing andhedging practices, premiums and discounts reflective of varying delivery times, and supply and demand for ourspecific varieties and grades of cocoa liquor, cocoa butter and cocoa powder. As a result, the average futurescontract prices are not necessarily indicative of our average costs.
The Food, Conservation and Energy Act of 2008, which is a five-year farm bill, impacts the prices of sugar,corn, peanuts and dairy products because it sets price support levels for these commodities.
During 2009, dairy prices started the year near $.13 per pound and dropped to approximately $.10 per poundon a class II fluid milk basis. Prices were weak in the face of strong production of milk and dairy products, andsluggish demand worldwide. Our costs for certain dairy products may not necessarily reflect market pricefluctuations because of our forward purchasing practices.
The price of sugar is subject to price supports under U.S. farm legislation. This legislation establishesimport quotas and duties to support the price of sugar. As a result, sugar prices paid by users in the U.S. arecurrently substantially higher than prices on the world sugar market. In 2009, sugar supplies in the U.S.continued to be negatively impacted by the 2008 catastrophic explosion at a sugar cane refinery in Georgia andby high world market prices. As a result, refined sugar prices remained firm, trading in a range from $.38 to $.50per pound. Our costs for sugar will not necessarily reflect market price fluctuations primarily because of ourforward purchasing and hedging practices.
5
Peanut prices in the U.S. began the year around $.49 per pound and gradually decreased during the year to$.46 per pound due to the effects of last year’s large crop. Almond prices began the year at $1.60 per pound andincreased to $1.95 per pound during the year driven by record demand which increased 19% over last year.
We attempt to minimize the effect of future price fluctuations related to the purchase of major raw materialsand certain energy requirements primarily through forward purchasing to cover our future requirements,generally for periods from 3 to 24 months. We enter into futures contracts to manage price risks for cocoaproducts, sugar, corn sweeteners, natural gas, fuel oil and certain dairy products. However, the dairy futuresmarkets are not as developed as many of the other commodities futures markets and, therefore, generally it is notpossible to hedge our costs for dairy products by entering into futures contracts to extend coverage for longerperiods of time. Currently, active futures contracts are not available for use in pricing our other major rawmaterial requirements. For more information on price risks associated with our major raw material requirements,see Commodities—Price Risk Management and Futures Contracts on page 39.
Product Sourcing
We are the primary manufacturer of the products we sell. In addition, we contract with third party suppliersto source certain ingredients and finished goods. We enter into manufacturing contracts with third parties toimprove our strategic competitive position and determine cost effective production and sourcing of our products.
Competition
Many of our brands enjoy wide consumer acceptance and are among the leading brands sold in themarketplace in North America. We sell our brands in a highly competitive market with many other multinational,national, regional and local firms. Some of our competitors are much larger firms that have greater resources andmore substantial international operations.
6
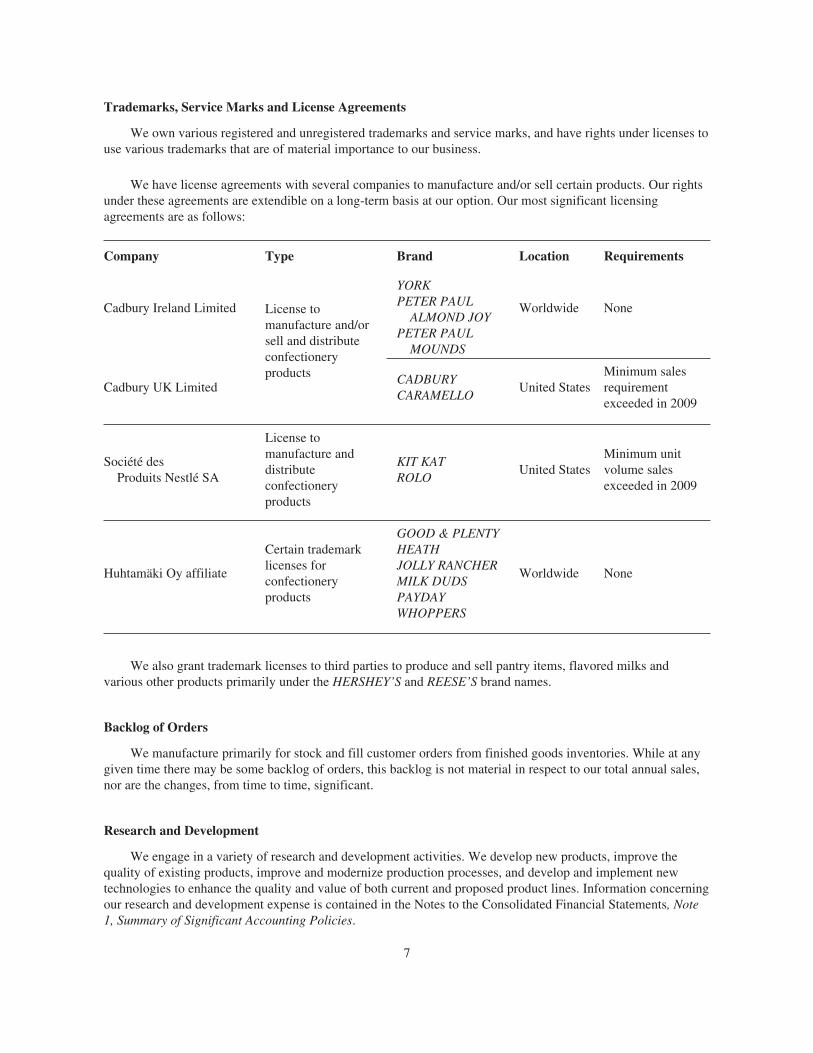
Trademarks, Service Marks and License Agreements
We own various registered and unregistered trademarks and service marks, and have rights under licenses touse various trademarks that are of material importance to our business.
We have license agreements with several companies to manufacture and/or sell certain products. Our rightsunder these agreements are extendible on a long-term basis at our option. Our most significant licensingagreements are as follows:
Company Type Brand Location Requirements
Cadbury Ireland Limited License tomanufacture and/orsell and distributeconfectioneryproducts
YORKPETER PAUL
ALMOND JOYPETER PAUL
MOUNDS
Worldwide None
Cadbury UK LimitedCADBURYCARAMELLO
United StatesMinimum salesrequirementexceeded in 2009
Société desProduits Nestlé SA
License tomanufacture anddistributeconfectioneryproducts
KIT KATROLO
United StatesMinimum unitvolume salesexceeded in 2009
Huhtamäki Oy affiliate
Certain trademarklicenses forconfectioneryproducts
GOOD & PLENTYHEATHJOLLY RANCHERMILK DUDSPAYDAYWHOPPERS
Worldwide None
We also grant trademark licenses to third parties to produce and sell pantry items, flavored milks andvarious other products primarily under the HERSHEY’S and REESE’S brand names.
Backlog of Orders
We manufacture primarily for stock and fill customer orders from finished goods inventories. While at anygiven time there may be some backlog of orders, this backlog is not material in respect to our total annual sales,nor are the changes, from time to time, significant.
Research and Development
We engage in a variety of research and development activities. We develop new products, improve thequality of existing products, improve and modernize production processes, and develop and implement newtechnologies to enhance the quality and value of both current and proposed product lines. Information concerningour research and development expense is contained in the Notes to the Consolidated Financial Statements, Note1, Summary of Significant Accounting Policies.
7
Food Quality and Safety Regulation
The manufacture and sale of consumer food products is highly regulated. In the United States, our activitiesare subject to regulation by various government agencies, including the Food and Drug Administration, theDepartment of Agriculture, the Federal Trade Commission, the Department of Commerce and the EnvironmentalProtection Agency, as well as various state and local agencies. Similar agencies also regulate our businessesoutside of the United States.
Our Product Excellence Program provides us with an effective product quality and safety program. Thisprogram assures that all products we purchase, manufacture and distribute are safe, are of high quality andcomply with all applicable laws and regulations.
Through our Product Excellence Program, we evaluate the supply chain including ingredients, packaging,processes, products, distribution and the environment to determine where product quality and safety controls arenecessary. We identify risks and establish controls to assure product quality and safety. Various governmentagencies, third party firms and our quality assurance staff conduct audits of all facilities that manufacture ourproducts to assure effectiveness and compliance with our program and all applicable laws and regulations.
Environmental Considerations
We made routine operating and capital expenditures during 2009 to comply with environmental laws andregulations. These expenditures were not material with respect to our results of operations, capital expenditures,earnings or competitive position.
Employees
As of December 31, 2009, we employed approximately 12,100 full-time and 1,600 part-time employeesworldwide. Collective bargaining agreements covered approximately 5,000 employees for which agreementscovering approximately 43% of these employees, primarily outside of the United States, will expire during 2010.We believe that our employee relations are good.
Financial Information by Geographic Area
Our principal operations and markets are located in the United States. The percentage of total consolidatednet sales for our businesses outside of the United States was 14.3% for 2009, 14.4% for 2008 and 13.8% for2007. The percentage of total consolidated assets outside of the United States as of December 31, 2009 was17.5% and as of December 31, 2008 was 16.0%. Operating profit margins vary among individual products andproduct groups.
Corporate Social Responsibility
Our founder, Milton S. Hershey, established an enduring model of responsible citizenship while creating asuccessful business. Making a difference in our communities, driving sustainable business practices andoperating with the highest integrity are vital parts of our heritage and shapes our future.
Milton Hershey School, established by Milton and Catherine Hershey, lies at the center of our uniqueheritage. Mr. Hershey donated and bequeathed almost his entire fortune to the Milton Hershey School, whichremains our primary beneficiary and provides a world-class education and nurturing home to nearly 2,000children in need annually.
During 2009, we participated in the commemoration of Milton Hershey School’s 100th Anniversary througha series of educational and outreach events. The anniversary celebration received wide local and national mediacoverage, highlighting our brands and our heritage and providing unique promotional opportunities for ourproducts. By building awareness, the outreach initiatives also help the school recruit students and staff.
8
We practice environmental stewardship by reducing waste and greenhouse gas emissions, by reducing ouruse of natural resources, by improving the environmental sustainability of our packaging and by supportingenvironmentally sound cocoa farming and environmental organizations.
During 2009, we participated for the first time in the Carbon Disclosure Project, which is an independentnot-for-profit organization holding the largest database of primary corporate climate change information in theworld. Through this submission, we assessed the impact of climate change on our business as well as our plans toaddress the impact of climate change on Hershey’s operations around the world. Hershey achieved a score of64 out of 100 placing us in the top tier of our peer group. We implemented an energy and water conservationaudit program in 2009. We are a member of the Climate Registry and were recognized as a Climate Leader bythis organization in 2009.
Our employees and retirees share their time and resources generously in their communities. Both directlyand through the United Way, we contribute to hundreds of agencies that deliver much needed services andresources. In 2009 we introduced the “Dollars for Doers” program that encourages community service by makingselect company contributions to non-profits in recognition of employee volunteer efforts. Our focus on “Kids andKids at Risk” is supported through the Children’s Miracle Network, Family Health International and a children’sburn center in Guadalajara, Mexico, to name a few of the organizations we support.
We are a leader in working to improve the lives of cocoa farming families through our active engagementand financial support for the World Cocoa Foundation, the International Cocoa Initiative, Farmer Field Schools,the Sustainable Tree Crops program and other key initiatives.
Available Information
We are subject to the reporting requirements of the Securities Exchange Act of 1934, as amended. We file orfurnish annual, quarterly and current reports, proxy statements and other information with the United States Securitiesand Exchange Commission (“SEC”). You may obtain a copy of any of these reports, free of charge, from the InvestorRelations section of our website, www.hersheys.com shortly after we file or furnish the information to the SEC.
You may obtain a copy of any of these reports directly from the SEC. Contact the SEC via fax at202-772-9295 or by submitting a written request to U.S. Securities and Exchange Commission, Office ofInvestor Education and Advocacy, 100 F Street N.E., Washington, D.C. 20549-0213. These documents are alsoavailable electronically from the SEC internet website at www.sec.gov. You can obtain additional information onhow to request public documents from the SEC on their website. The phone number for information about theoperation of the SEC Office of Investor Education and Advocacy is 202-551-8090.
We have a Code of Ethical Business Conduct that applies to our Board of Directors, all company officersand employees, including, without limitation, our Chief Executive Officer and “senior financial officers”(including the Chief Financial Officer, Chief Accounting Officer and persons performing similar functions). Youcan obtain a copy of our Code of Ethical Business Conduct from the Investor Relations section of our website,www.hersheys.com. If we change or waive any portion of the Code of Ethical Business Conduct that applies toany of our directors, executive officers or senior financial officers, we will post that information on our websitewithin four business days. In the case of a waiver, such information will include the name of the person to whomthe waiver applied, along with the date and type of waiver.
We also post our Corporate Governance Guidelines and charters for each of the Board’s standingcommittees in the Investor Relations section of our website, www.hersheys.com. The Board of Directors adoptedthese Guidelines and charters.
We will provide to any stockholder a copy of one or more of the Exhibits listed in Part IV of this report,upon request. We charge a small copying fee for these exhibits to cover our costs. To request a copy of any ofthese documents, you can contact us at—The Hershey Company, Attn: Investor Relations Department,100 Crystal A Drive, Hershey, Pennsylvania 17033-0810.
9
Item 1A. RISK FACTORS
We are subject to changing economic, competitive, regulatory and technological risks and uncertaintiesbecause of the nature of our operations. In connection with the “safe harbor” provisions of the Private SecuritiesLitigation Reform Act of 1995, we note the following factors that, among others, could cause future results todiffer materially from the forward-looking statements, expectations and assumptions expressed or implied in thisreport. Many of the forward-looking statements contained in this document may be identified by the use of wordssuch as “intend,” “believe,” “expect,” “anticipate,” “should,” “planned,” “projected,” “estimated” and“potential,” among others. Among the factors that could cause our actual results to differ materially from theresults projected in our forward-looking statements are the risk factors described below.
Issues or concerns related to the quality and safety of our products, ingredients or packaging could cause aproduct recall and/or result in harm to the Company’s reputation, negatively impacting our operating results.
In order to sell our iconic, branded products, we need to maintain a good reputation with our customers andconsumers. Issues related to quality and safety of our products, ingredients or packaging, could jeopardize ourCompany’s image and reputation. Negative publicity related to these types of concerns, or related to productcontamination or product tampering, whether valid or not, might negatively impact demand for our products, orcause production and delivery disruptions. We may need to recall products if any of our products become unfitfor consumption. In addition, we could potentially be subject to litigation or government actions, which couldresult in payments of fines or damages. Costs associated with these potential actions could negatively affect ouroperating results.
Increases in raw material and energy costs along with the availability of adequate supplies of raw materialscould affect future financial results.
We use many different commodities for our business, including cocoa products, sugar, dairy products,peanuts, almonds, corn sweeteners, natural gas and fuel oil.
Commodities are subject to price volatility and changes in supply caused by numerous factors, including:
• Commodity market fluctuations;
• Currency exchange rates;
• Imbalances between supply and demand;
• The effect of weather on crop yield;
• Speculative influences;
• Trade agreements among producing and consuming nations;
• Supplier compliance with commitments;
• Political unrest in producing countries; and
• Changes in governmental agricultural programs and energy policies.
Although we use forward contracts and commodity futures and options contracts, where possible, to hedgecommodity prices, commodity price increases ultimately result in corresponding increases in our raw materialand energy costs. If we are unable to offset cost increases for major raw materials and energy, there could be anegative impact on our results of operations and financial condition.
Market demand for new and existing products could decline.
We operate in highly competitive markets and rely on continued demand for our products. To generaterevenues and profits, we must sell products that appeal to our customers and to consumers. Continued success isdependent on effective retail execution, appropriate advertising campaigns and marketing programs, the ability to
10
secure adequate shelf space at retail locations and product innovation, including maintaining a strong pipeline ofnew products. In addition, success depends on our response to consumer trends, consumer health concerns,including obesity and the consumption of certain ingredients, and changes in product category consumption andconsumer demographics.
Our largest customer, McLane Company, Inc., accounted for approximately 27% of our total net sales in2009 reflecting the continuing consolidation of our customer base. In this environment, there continue to becompetitive product and pricing pressures, as well as challenges in maintaining profit margins. We must maintainmutually beneficial relationships with our key customers, including retailers and distributors, to competeeffectively. McLane Company, Inc. is one of the largest wholesale distributors in the United States toconvenience stores, drug stores, wholesale clubs and mass merchandisers, including Wal-Mart Stores, Inc.
Increased marketplace competition could hurt our business.
The global confectionery packaged goods industry is intensely competitive, as is the broader snack market.Some of our competitors are much larger firms that have greater resources and more substantial internationaloperations. In order to protect our existing market share or capture increased market share in this highlycompetitive retail environment, we may be required to increase expenditures for promotions and advertising, andcontinue to introduce and establish new products. Due to inherent risks in the marketplace associated withadvertising and new product introductions, including uncertainties about trade and consumer acceptance,increased expenditures may not prove successful in maintaining or enhancing our market share and could resultin lower sales and profits. In addition, we may incur increased credit and other business risks because we operatein a highly competitive retail environment.
Price increases may not be sufficient to offset cost increases and maintain profitability or may result in salesvolume declines associated with pricing elasticity.
We may be able to pass some or all raw material, energy and other input cost increases to customers byincreasing the selling prices of our products or decreasing the size of our products; however, higher productprices or decreased product sizes may also result in a reduction in sales volume. If we are not able to increase ourselling prices or reduce product sizes sufficiently to offset increased raw material, energy or other input costs,including packaging, direct labor, overhead and employee benefits, or if our sales volume decreases significantly,there could be a negative impact on our results of operations and financial condition.
Disruption to our supply chain could impair our ability to produce or deliver our finished products, resultingin a negative impact on our operating results.
Disruption to our manufacturing operations or our supply chain could result from, but are not limited to, thefollowing:
• Natural disaster;
• Pandemic outbreak of disease;
• Weather;
• Fire or explosion;
• Terrorism;
• Strikes;
• Unavailability of raw or packaging materials; and
• Operational and/or financial instability of key suppliers, and other vendors or service providers.
11
We take adequate precautions to mitigate the impact of possible disruptions, and have plans in place tomanage such events if they were to occur. If we are unable, or if it is not financially feasible, to effectivelymitigate the likelihood or potential impact of such disruptive events, our results of operations and financialcondition could be negatively impacted.
Our financial results may be adversely impacted by the failure to successfully execute acquisitions,divestitures and joint ventures.
From time to time, we may evaluate potential acquisitions, divestitures or joint ventures that align with ourstrategic objectives. The success of such activity depends, in part, upon our ability to identify suitable buyers,sellers or business partners; perform effective assessments prior to contract execution; negotiate contract termsand, if applicable, obtain government approval. These activities may present certain financial, managerial andoperational risks, including diversion of management’s attention from existing core businesses; difficultiesintegrating or separating businesses from existing operations; and challenges presented by acquisitions or jointventures which may not achieve sales levels and profitability that justify the investments made. If theacquisitions, divestitures or joint ventures are not successfully implemented or completed, there could be anegative impact on our results of operations, financial condition and cash flows.
Changes in governmental laws and regulations could increase our costs and liabilities or impact demand forour products.
Changes in laws and regulations and the manner in which they are interpreted or applied may alter ourbusiness environment. This could affect our results of operations or increase our liabilities. These negativeimpacts could result from changes in food and drug laws, laws related to advertising and marketing practices,accounting standards, taxation requirements, competition laws, employment laws and environmental laws,among others. It is possible that we could become subject to additional liabilities in the future resulting fromchanges in laws and regulations that could result in an adverse effect on our results of operations and financialcondition.
Political, economic, and/or financial market conditions could negatively impact our financial results.
Our operations are impacted by consumer spending levels and impulse purchases which are affected bygeneral macroeconomic conditions, consumer confidence, employment levels, availability of consumer creditand interest rates on that credit, consumer debt levels, energy costs and other factors. Volatility in food andenergy costs, sustained global recessions, rising unemployment and declines in personal spending couldadversely impact the Company’s revenues, profitability and financial condition.
Changes in financial market conditions may make it difficult to access credit markets on commerciallyacceptable terms which may reduce liquidity or increase borrowing costs for our Company, our customers andour suppliers. A significant reduction in liquidity could increase counterparty risk associated with certainsuppliers and service providers, resulting in disruption to our supply chain and/or higher costs, and could impactour customers, resulting in a reduction in our revenue, including a possible increase in bad debt expense.
International operations could fluctuate unexpectedly and adversely impact our business.
In 2009, we derived approximately 14.3% of our net sales from customers located outside of the UnitedStates. Some of our assets are also located outside of the United States. As part of our global growth strategy, weare increasing our investments outside of the United States, particularly in Mexico, India and China. As a result,we are subject to numerous risks and uncertainties relating to international sales and operations, including:
• Unforeseen global economic and environmental changes resulting in business interruption, supplyconstraints, inflation, deflation or decreased demand;
12
• Difficulties and costs associated with compliance and enforcement of remedies under a wide variety ofcomplex laws, treaties and regulations;
• Different regulatory structures and unexpected changes in regulatory environments;
• Political and economic instability, including the possibility of civil unrest;
• Nationalization of our properties by foreign governments;
• Tax rates that may exceed those in the United States and earnings that may be subject to withholdingrequirements and incremental taxes upon repatriation;
• Potentially negative consequences from changes in tax laws;
• The imposition of tariffs, quotas, trade barriers, other trade protection measures and import or exportlicensing requirements;
• Increased costs, disruptions in shipping or reduced availability of freight transportation;
• The impact of currency exchange rate fluctuations between the U.S. dollar and foreign currencies; and
• Failure to gain sufficient profitable scale in certain international markets resulting in losses fromimpairment or sale of assets.
Disruptions, failures or security breaches of our information technology infrastructure could have a negativeimpact on our operations.
Information technology is an important part of our business operations. We use information technology tomanage business processes, collect and interpret business data and communicate internally and externally withemployees, suppliers, customers and others. We have backup systems and business continuity plans in place;however, a disruption or failure could have a negative impact on our operations or business reputation. Failure ofour systems to function as intended could cause transaction errors, loss of customers and sales, and could havenegative consequences to our Company, our employees, and those with whom we do business.
Future developments related to the investigation by government regulators of alleged pricing practices bymembers of the confectionery industry could impact our reputation, the regulatory environment under whichwe operate, and our operating results.
Government regulators are investigating alleged pricing practices by members of the confectionery industryin certain jurisdictions. We are cooperating fully with all relevant authorities. These allegations could have anegative impact on our Company’s reputation. We also may be required to incur defense costs in litigation and/orbe subject to fines or damages. In addition, our costs could increase if we became subject to new or additionalgovernment-mandated regulatory controls. These possible actions could negatively impact our future operatingresults.
Pension costs or funding requirements could increase at a higher than anticipated rate.
We sponsor a number of defined benefit pension plans. Changes in interest rates or in the market value ofplan assets could affect the funded status of our pension plans. This could cause volatility in our benefits costsand increase future funding requirements for our pension plans. Additionally, we could incur pension settlementlosses if a significant number of employees who have retired or have left the Company decide to withdrawsubstantial lump sums from their pension accounts. A significant increase in pension expense, in pensionsettlement losses or in future funding requirements could have a negative impact on our results of operations,financial condition and cash flows. For more information, refer to page 43.
Item 1B. UNRESOLVED STAFF COMMENTS
None.
13
Item 2. PROPERTIES
Our principal properties include the following:
Country Location Type
Status(Own/Lease)
United States Hershey, Pennsylvania(3 principal plants)
Manufacturing—confectionery products and pantry items Own
Lancaster, Pennsylvania Manufacturing—confectionery products Own
Robinson, Illinois Manufacturing—confectionery and snack products, and pantryitems
Own
Stuarts Draft, Virginia Manufacturing—confectionery products and pantry items Own
Edwardsville, Illinois Distribution Own
Palmyra, Pennsylvania Distribution Own
Ogden, Utah Distribution Own
Canada Mississauga, Ontario Distribution Lease
Mexico Monterrey, Mexico Manufacturing—confectionery products Own
In addition to the locations indicated above, we also own or lease several other properties and buildingsworldwide which we use for manufacturing, sales, distribution and administrative functions. Our facilities arewell maintained. These facilities generally have adequate capacity and can accommodate seasonal demands,changing product mixes and certain additional growth. The largest facilities are located in Hershey andLancaster, Pennsylvania; Monterrey, Mexico; and Stuarts Draft, Virginia. Many additions and improvementshave been made to these facilities over the years and they include equipment of the latest type and technology.
14
Item 3. LEGAL PROCEEDINGS
In connection with its pricing practices, the Company is the subject of an antitrust investigation by theCanadian Competition Bureau. In addition, the U.S. Department of Justice notified the Company that it openedan inquiry but has not requested any information or documents. The European Commission had requestedinformation, but subsequently informed the Company that it had closed its file. We also are party toapproximately 91 related civil antitrust suits in the United States and 14 in Canada. Certain of these claimscontain class action allegations, instituted on behalf of direct purchasers of our products as well as indirectpurchasers that purchase our products for use or for resale. These suits allege conspiracies in restraint of trade inconnection with the pricing practices of the Company. Several other chocolate and confectionery companies arethe subject of investigations and/or inquiries by the government entities referenced above and have also beennamed as defendants in the same litigation. One Canadian wholesaler is also a subject of the Canadianinvestigation. While it is not feasible to predict the final outcome of these proceedings, in our opinion theyshould not have a material adverse effect on the financial position, liquidity or results of operations of theCompany. The Company is cooperating with the government investigations and inquiries and intends to defendthe lawsuits vigorously.
We have no other material pending legal proceedings, other than ordinary routine litigation incidental to ourbusiness.
Item 4. SUBMISSION OF MATTERS TO A VOTE OF SECURITY HOLDERS
Not applicable.
15
PART II
Item 5. MARKET FOR THE REGISTRANT’S COMMON EQUITY, RELATED STOCKHOLDERMATTERS AND ISSUER PURCHASES OF EQUITY SECURITIES
We paid $263.4 million in cash dividends on our Common Stock and Class B Common Stock (“Class BStock”) in 2009 and $262.9 million in 2008. The annual dividend rate on our Common Stock in 2009 was $1.19per share.
On February 1, 2010, our Board of Directors declared a quarterly dividend of $.32 per share of CommonStock payable on March 15, 2010, to stockholders of record as of February 25, 2010. It is the Company’s 321stconsecutive Common Stock dividend. A quarterly dividend of $.29 per share of Class B Stock also was declared.
Our Common Stock is listed and traded principally on the New York Stock Exchange (“NYSE”) under theticker symbol “HSY.” Approximately 379.3 million shares of our Common Stock were traded during 2009. TheClass B Stock is not publicly traded.
The closing price of our Common Stock on December 31, 2009 was $35.79. There were 39,967stockholders of record of our Common Stock and our Class B Stock as of December 31, 2009.
The following table shows the dividends paid per share of Common Stock and Class B Stock and the pricerange of the Common Stock for each quarter of the past 2 years:
Dividends Paid PerShare
Common StockPrice Range*
CommonStock
Class BStock High Low
20091st Quarter . . . . . . . . . . . . . . . . . . . . . . . . . . . . . . . . . . . . . . . . . . . . . . $ .2975 $ .2678 $38.23 $30.272nd Quarter . . . . . . . . . . . . . . . . . . . . . . . . . . . . . . . . . . . . . . . . . . . . . .2975 .2678 37.83 33.703rd Quarter . . . . . . . . . . . . . . . . . . . . . . . . . . . . . . . . . . . . . . . . . . . . . .2975 .2678 42.25 35.784th Quarter . . . . . . . . . . . . . . . . . . . . . . . . . . . . . . . . . . . . . . . . . . . . . . .2975 .2678 41.62 35.05
Total . . . . . . . . . . . . . . . . . . . . . . . . . . . . . . . . . . . . . . . . . . . . . . $1.1900 $1.0712
Dividends Paid PerShare
Common StockPrice Range*
CommonStock
Class BStock High Low
20081st Quarter . . . . . . . . . . . . . . . . . . . . . . . . . . . . . . . . . . . . . . . . . . . . . . $ .2975 $ .2678 $39.45 $33.542nd Quarter . . . . . . . . . . . . . . . . . . . . . . . . . . . . . . . . . . . . . . . . . . . . . .2975 .2678 40.75 32.473rd Quarter . . . . . . . . . . . . . . . . . . . . . . . . . . . . . . . . . . . . . . . . . . . . . .2975 .2678 44.32 32.314th Quarter . . . . . . . . . . . . . . . . . . . . . . . . . . . . . . . . . . . . . . . . . . . . . . .2975 .2678 40.55 32.10
Total . . . . . . . . . . . . . . . . . . . . . . . . . . . . . . . . . . . . . . . . . . . . . . $1.1900 $1.0712
* NYSE-Composite Quotations for Common Stock by calendar quarter.
Unregistered Sales of Equity Securities and Use of Proceeds
None.
16
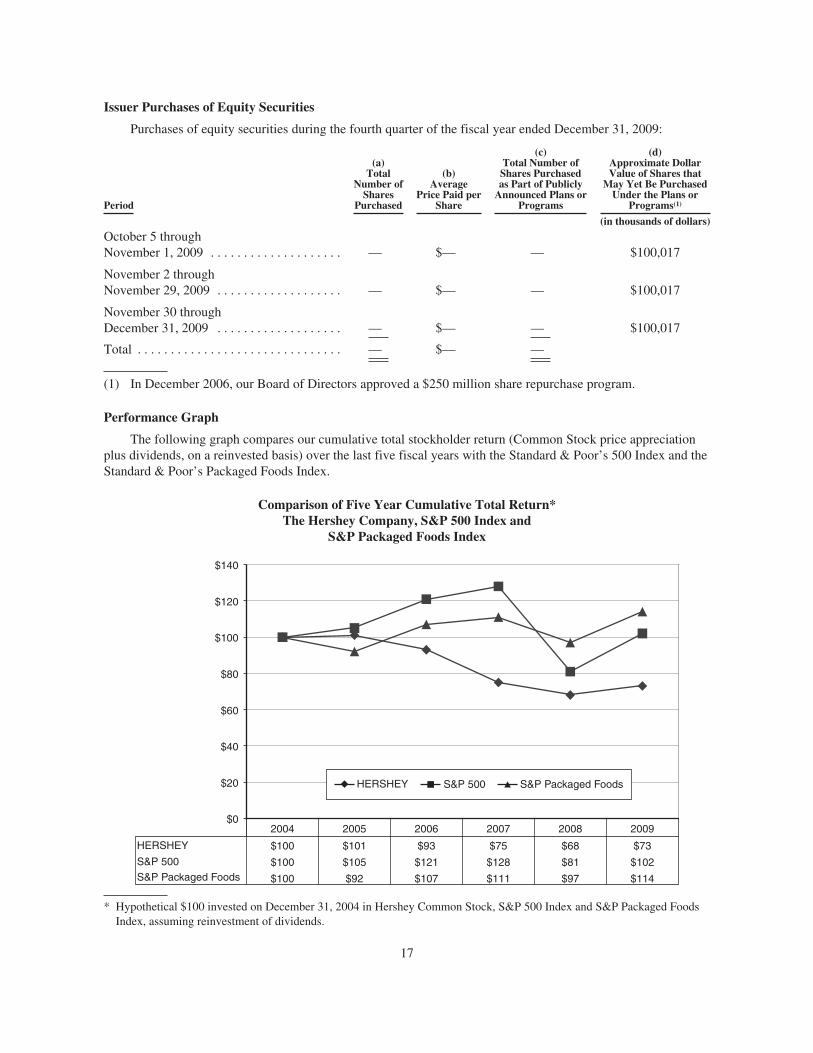
Issuer Purchases of Equity Securities
Purchases of equity securities during the fourth quarter of the fiscal year ended December 31, 2009:
Period
(a)Total
Number ofShares
Purchased
(b)Average
Price Paid perShare
(c)Total Number ofShares Purchasedas Part of Publicly
Announced Plans orPrograms
(d)Approximate DollarValue of Shares that
May Yet Be PurchasedUnder the Plans or
Programs(1)
(in thousands of dollars)
October 5 throughNovember 1, 2009 . . . . . . . . . . . . . . . . . . . . — $— — $100,017
November 2 throughNovember 29, 2009 . . . . . . . . . . . . . . . . . . . — $— — $100,017
November 30 throughDecember 31, 2009 . . . . . . . . . . . . . . . . . . . — $— — $100,017
Total . . . . . . . . . . . . . . . . . . . . . . . . . . . . . . . — $— —
(1) In December 2006, our Board of Directors approved a $250 million share repurchase program.
Performance Graph
The following graph compares our cumulative total stockholder return (Common Stock price appreciationplus dividends, on a reinvested basis) over the last five fiscal years with the Standard & Poor’s 500 Index and theStandard & Poor’s Packaged Foods Index.
Comparison of Five Year Cumulative Total Return*The Hershey Company, S&P 500 Index and
S&P Packaged Foods Index
HERSHEY
S&P 500
S&P Packaged Foods
2004
$100
$100
$100
2005
$101
$105
$92
2006
$93
$121
$107
2007
$75
$128
$111
2008
$68
$81
$97
2009
$73
$102
$114
$0
$20
$40
$60
$80
$100
$120
$140
HERSHEY S&P 500 S&P Packaged Foods
* Hypothetical $100 invested on December 31, 2004 in Hershey Common Stock, S&P 500 Index and S&P Packaged FoodsIndex, assuming reinvestment of dividends.
17
Item 6. SELECTED FINANCIAL DATA
SIX-YEAR CONSOLIDATED FINANCIAL SUMMARYAll dollar and share amounts in thousands except market price
and per share statistics
5-YearCompound
Growth Rate 2009 2008 2007 2006 2005 2004
Summary of OperationsNet Sales . . . . . . . . . . . . . . . . . . . . . 3.7% $ 5,298,668 5,132,768 4,946,716 4,944,230 4,819,827 4,416,389
Cost of Sales . . . . . . . . . . . . . . . . . . 4.0% $ 3,245,531 3,375,050 3,315,147 3,076,718 2,956,682 2,672,716Selling, Marketing and
Administrative . . . . . . . . . . . . . . . 6.9% $ 1,208,672 1,073,019 895,874 860,378 912,986 867,104Business Realignment and
Impairment Charges, Net . . . . . . $ 82,875 94,801 276,868 14,576 96,537 —Interest Expense, Net . . . . . . . . . . . 6.3% $ 90,459 97,876 118,585 116,056 87,985 66,533Provision for Income Taxes . . . . . . 0.0% $ 235,137 180,617 126,088 317,441 277,090 235,399
Net Income . . . . . . . . . . . . . . . . . . . (5.4)% $ 435,994 311,405 214,154 559,061 488,547 574,637
Net Income Per Share:—Basic—Class B Stock . . . . . (3.5)% $ 1.77 1.27 .87 2.19 1.85 2.11—Diluted—Class B Stock . . . (3.3)% $ 1.77 1.27 .87 2.17 1.84 2.09—Basic—Common Stock . . . . (3.1)% $ 1.97 1.41 .96 2.44 2.05 2.31—Diluted—Common Stock . . (3.2)% $ 1.90 1.36 .93 2.34 1.97 2.24
Weighted-Average SharesOutstanding:
—Basic—Common Stock . . . . 167,136 166,709 168,050 174,722 183,747 193,037—Basic—Class B Stock . . . . . 60,709 60,777 60,813 60,817 60,821 60,844—Diluted . . . . . . . . . . . . . . . . . 228,995 228,697 231,449 239,071 248,292 256,934
Dividends Paid on CommonStock . . . . . . . . . . . . . . . . . . . . . . 4.4% $ 198,371 197,839 190,199 178,873 170,147 159,658Per Share . . . . . . . . . . . . . . . . . . . 7.3% $ 1.19 1.19 1.135 1.03 .93 .835
Dividends Paid on Class B Stock . . 7.1% $ 65,032 65,110 62,064 56,256 51,088 46,089Per Share . . . . . . . . . . . . . . . . . . . 7.2% $ 1.0712 1.0712 1.0206 .925 .84 .7576
Net Income as a Percent of NetSales, GAAP Basis . . . . . . . . . . . 8.2% 6.1% 4.3% 11.3% 10.1% 13.0%
Non-GAAP Adjusted Income as aPercent of Net Sales(a) . . . . . . . . 9.4% 8.4% 9.7% 11.5% 11.7% 11.6%
Depreciation . . . . . . . . . . . . . . . . . . (1.6)% $ 157,996 227,183 292,658 181,038 200,132 171,229Advertising . . . . . . . . . . . . . . . . . . . 11.8% $ 241,184 161,133 127,896 108,327 125,023 137,931Payroll . . . . . . . . . . . . . . . . . . . . . . . 0.0% $ 613,568 645,456 645,083 645,480 647,825 614,037Year-end Position and StatisticsCapital Additions . . . . . . . . . . . . . . (7.0)% $ 126,324 262,643 189,698 183,496 181,069 181,728Capitalized Software Additions . . . 6.2% $ 19,146 20,336 14,194 15,016 13,236 14,158Total Assets . . . . . . . . . . . . . . . . . . . (0.6)% $ 3,675,031 3,634,719 4,247,113 4,157,565 4,262,699 3,794,750Short-term Debt and Current
Portion of Long-term Debt . . . . . (42.4)% $ 39,313 501,504 856,392 843,998 819,115 622,320Long-term Portion of Debt . . . . . . . 16.8% $ 1,502,730 1,505,954 1,279,965 1,248,128 942,755 690,602Stockholders’ Equity . . . . . . . . . . . . (7.7)% $ 760,339 349,944 623,520 683,423 1,016,380 1,137,103Full-time Employees . . . . . . . . . . . . 12,100 12,800 12,400 12,800 13,750 13,700Stockholders’ DataOutstanding Shares of Common
Stock and Class B Stock atYear-end . . . . . . . . . . . . . . . . . . . 227,998 227,035 227,050 230,264 240,524 246,588
Market Price of Common Stock atYear-end . . . . . . . . . . . . . . . . . . . (8.4)% $ 35.79 34.74 39.40 49.80 55.25 55.54
Range During Year . . . . . . . . . . . . . $42.25–30.27 44.32–32.10 56.75–38.21 57.65–48.20 67.37–52.49 56.75–37.28
(a) Non-GAAP Adjusted Income as a Percent of Net Sales is calculated by dividing adjusted non-GAAP Income by Net Sales. Areconciliation of Net Income presented in accordance with U.S. generally accepted accounting principles (“GAAP”) to adjustednon-GAAP Income is provided on pages 19 and 20, along with the reasons why we believe that the use of adjusted non-GAAPfinancial measures provides useful information to investors.
18
Item 7. MANAGEMENT’S DISCUSSION AND ANALYSIS OF FINANCIAL CONDITION ANDRESULTS OF OPERATIONS
EXECUTIVE OVERVIEW
Our results for the year ended December 31, 2009 demonstrated excellent progress in a difficult economicenvironment. We exceeded net sales targets, while implementing price increases and operational efficiencyimprovements necessary to offset significant increases in input and employee benefits costs. We have essentiallycompleted the global supply chain transformation program and have achieved our objectives. We increasedadvertising investment in our core brands in North America and in certain of our key international markets, whilealso achieving strong growth in adjusted earnings per share-diluted. We generated strong cash flow fromoperations and our financial position remains solid.
Net sales increased 3.2%, which was within our long-term growth target. The increase was driven by pricerealization, as sales volumes declined at less than expected rates due to pricing elasticity. Earnings per sharegrowth exceeded our long-term objective and our North American market share increased during the year.
Our financial results and marketplace performance for the year indicate that our consumer-driven approachto core brand investment along with necessary pricing actions enable us to continue to meet our long-termfinancial goals. Our efforts will remain focused toward implementing our major strategic initiatives to deliversustainable long-term growth in the evolving marketplace.
Adjusted Non-GAAP Financial Measures
Our “Management’s Discussion and Analysis of Financial Condition and Results of Operations” sectionincludes certain measures of financial performance that are not defined by U.S. generally accepted accountingprinciples (“GAAP”). For each of these non-GAAP financial measures, we are providing below (1) the mostdirectly comparable GAAP measure; (2) a reconciliation of the differences between the non-GAAP measure andthe most directly comparable GAAP measure; (3) an explanation of why our management believes thesenon-GAAP measures provide useful information to investors; and (4) additional purposes for which we use thesenon-GAAP measures.
We believe that the disclosure of these non-GAAP measures provides investors with a better comparison ofour year-to-year operating results. We exclude the effects of certain items from Income before Interest andIncome Taxes (“EBIT”), Net Income and Income per Share-Diluted-Common Stock (“EPS”) when we evaluatekey measures of our performance internally, and in assessing the impact of known trends and uncertainties on ourbusiness. We also believe that excluding the effects of these items provides a more balanced view of theunderlying dynamics of our business.
Adjusted non-GAAP financial measures exclude the impacts of charges or credits in 2009, 2008, 2007, 2006and 2005 associated with our business realignment initiatives and a reduction of the income tax provision in 2004resulting from adjustments to income tax contingency reserves.
19
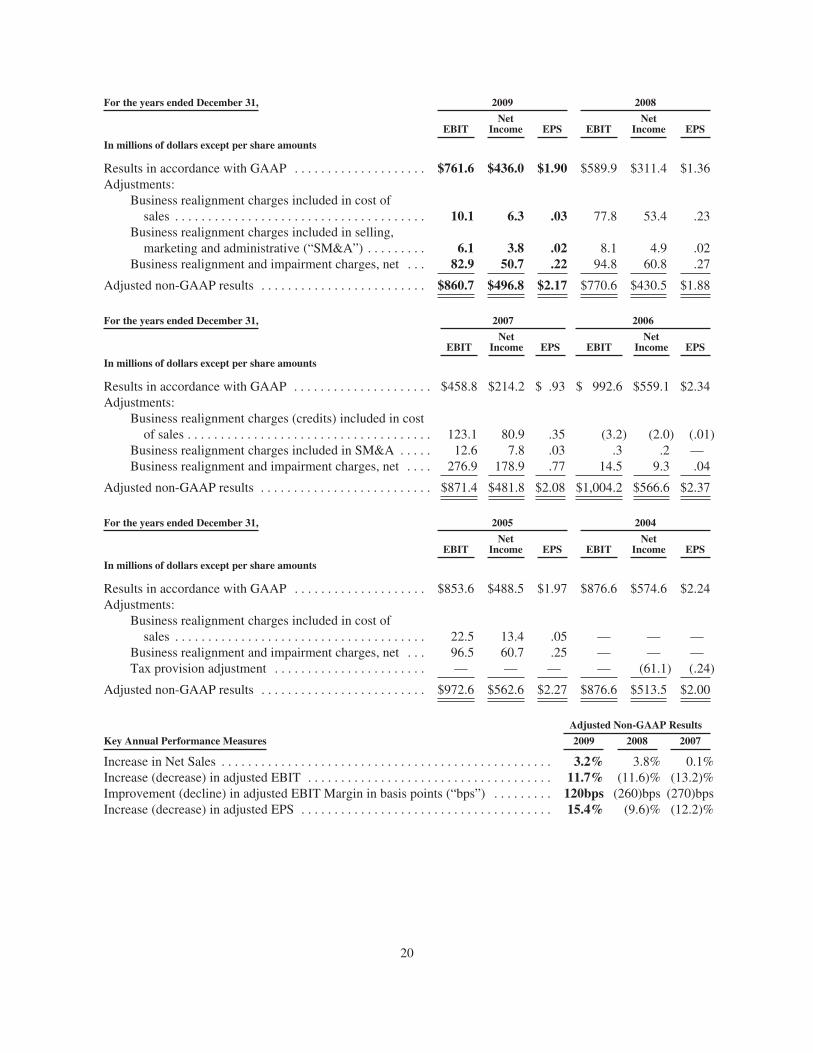
For the years ended December 31, 2009 2008
EBITNet
Income EPS EBITNet
Income EPS
In millions of dollars except per share amounts
Results in accordance with GAAP . . . . . . . . . . . . . . . . . . . . $761.6 $436.0 $1.90 $589.9 $311.4 $1.36Adjustments:
Business realignment charges included in cost ofsales . . . . . . . . . . . . . . . . . . . . . . . . . . . . . . . . . . . . . . 10.1 6.3 .03 77.8 53.4 .23
Business realignment charges included in selling,marketing and administrative (“SM&A”) . . . . . . . . . 6.1 3.8 .02 8.1 4.9 .02
Business realignment and impairment charges, net . . . 82.9 50.7 .22 94.8 60.8 .27
Adjusted non-GAAP results . . . . . . . . . . . . . . . . . . . . . . . . . $860.7 $496.8 $2.17 $770.6 $430.5 $1.88
For the years ended December 31, 2007 2006
EBITNet
Income EPS EBITNet
Income EPS
In millions of dollars except per share amounts
Results in accordance with GAAP . . . . . . . . . . . . . . . . . . . . . $458.8 $214.2 $ .93 $ 992.6 $559.1 $2.34Adjustments:
Business realignment charges (credits) included in costof sales . . . . . . . . . . . . . . . . . . . . . . . . . . . . . . . . . . . . . 123.1 80.9 .35 (3.2) (2.0) (.01)
Business realignment charges included in SM&A . . . . . 12.6 7.8 .03 .3 .2 —Business realignment and impairment charges, net . . . . 276.9 178.9 .77 14.5 9.3 .04
Adjusted non-GAAP results . . . . . . . . . . . . . . . . . . . . . . . . . . $871.4 $481.8 $2.08 $1,004.2 $566.6 $2.37
For the years ended December 31, 2005 2004
EBITNet
Income EPS EBITNet
Income EPS
In millions of dollars except per share amounts
Results in accordance with GAAP . . . . . . . . . . . . . . . . . . . . $853.6 $488.5 $1.97 $876.6 $574.6 $2.24Adjustments:
Business realignment charges included in cost ofsales . . . . . . . . . . . . . . . . . . . . . . . . . . . . . . . . . . . . . . 22.5 13.4 .05 — — —
Business realignment and impairment charges, net . . . 96.5 60.7 .25 — — —Tax provision adjustment . . . . . . . . . . . . . . . . . . . . . . . — — — — (61.1) (.24)
Adjusted non-GAAP results . . . . . . . . . . . . . . . . . . . . . . . . . $972.6 $562.6 $2.27 $876.6 $513.5 $2.00
Adjusted Non-GAAP Results
Key Annual Performance Measures 2009 2008 2007
Increase in Net Sales . . . . . . . . . . . . . . . . . . . . . . . . . . . . . . . . . . . . . . . . . . . . . . . . . . 3.2% 3.8% 0.1%Increase (decrease) in adjusted EBIT . . . . . . . . . . . . . . . . . . . . . . . . . . . . . . . . . . . . . 11.7% (11.6)% (13.2)%Improvement (decline) in adjusted EBIT Margin in basis points (“bps”) . . . . . . . . . 120bps (260)bps (270)bpsIncrease (decrease) in adjusted EPS . . . . . . . . . . . . . . . . . . . . . . . . . . . . . . . . . . . . . . 15.4% (9.6)% (12.2)%
20
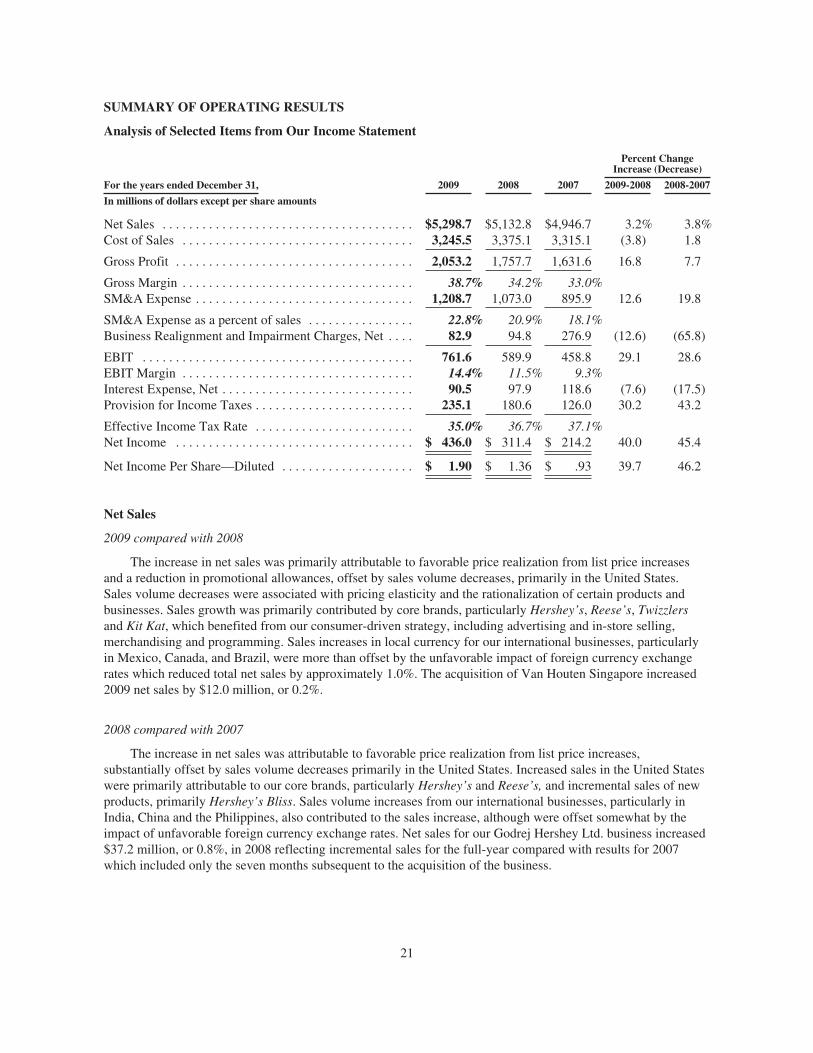
SUMMARY OF OPERATING RESULTS
Analysis of Selected Items from Our Income Statement
2009 2008 2007
Percent ChangeIncrease (Decrease)
For the years ended December 31, 2009-2008 2008-2007
In millions of dollars except per share amounts
Net Sales . . . . . . . . . . . . . . . . . . . . . . . . . . . . . . . . . . . . . . $5,298.7 $5,132.8 $4,946.7 3.2% 3.8%Cost of Sales . . . . . . . . . . . . . . . . . . . . . . . . . . . . . . . . . . . 3,245.5 3,375.1 3,315.1 (3.8) 1.8
Gross Profit . . . . . . . . . . . . . . . . . . . . . . . . . . . . . . . . . . . . 2,053.2 1,757.7 1,631.6 16.8 7.7
Gross Margin . . . . . . . . . . . . . . . . . . . . . . . . . . . . . . . . . . . 38.7% 34.2% 33.0%SM&A Expense . . . . . . . . . . . . . . . . . . . . . . . . . . . . . . . . . 1,208.7 1,073.0 895.9 12.6 19.8
SM&A Expense as a percent of sales . . . . . . . . . . . . . . . . 22.8% 20.9% 18.1%Business Realignment and Impairment Charges, Net . . . . 82.9 94.8 276.9 (12.6) (65.8)
EBIT . . . . . . . . . . . . . . . . . . . . . . . . . . . . . . . . . . . . . . . . . 761.6 589.9 458.8 29.1 28.6EBIT Margin . . . . . . . . . . . . . . . . . . . . . . . . . . . . . . . . . . . 14.4% 11.5% 9.3%Interest Expense, Net . . . . . . . . . . . . . . . . . . . . . . . . . . . . . 90.5 97.9 118.6 (7.6) (17.5)Provision for Income Taxes . . . . . . . . . . . . . . . . . . . . . . . . 235.1 180.6 126.0 30.2 43.2
Effective Income Tax Rate . . . . . . . . . . . . . . . . . . . . . . . . 35.0% 36.7% 37.1%Net Income . . . . . . . . . . . . . . . . . . . . . . . . . . . . . . . . . . . . $ 436.0 $ 311.4 $ 214.2 40.0 45.4
Net Income Per Share—Diluted . . . . . . . . . . . . . . . . . . . . $ 1.90 $ 1.36 $ .93 39.7 46.2
Net Sales
2009 compared with 2008
The increase in net sales was primarily attributable to favorable price realization from list price increasesand a reduction in promotional allowances, offset by sales volume decreases, primarily in the United States.Sales volume decreases were associated with pricing elasticity and the rationalization of certain products andbusinesses. Sales growth was primarily contributed by core brands, particularly Hershey’s, Reese’s, Twizzlersand Kit Kat, which benefited from our consumer-driven strategy, including advertising and in-store selling,merchandising and programming. Sales increases in local currency for our international businesses, particularlyin Mexico, Canada, and Brazil, were more than offset by the unfavorable impact of foreign currency exchangerates which reduced total net sales by approximately 1.0%. The acquisition of Van Houten Singapore increased2009 net sales by $12.0 million, or 0.2%.
2008 compared with 2007
The increase in net sales was attributable to favorable price realization from list price increases,substantially offset by sales volume decreases primarily in the United States. Increased sales in the United Stateswere primarily attributable to our core brands, particularly Hershey’s and Reese’s, and incremental sales of newproducts, primarily Hershey’s Bliss. Sales volume increases from our international businesses, particularly inIndia, China and the Philippines, also contributed to the sales increase, although were offset somewhat by theimpact of unfavorable foreign currency exchange rates. Net sales for our Godrej Hershey Ltd. business increased$37.2 million, or 0.8%, in 2008 reflecting incremental sales for the full-year compared with results for 2007which included only the seven months subsequent to the acquisition of the business.
21
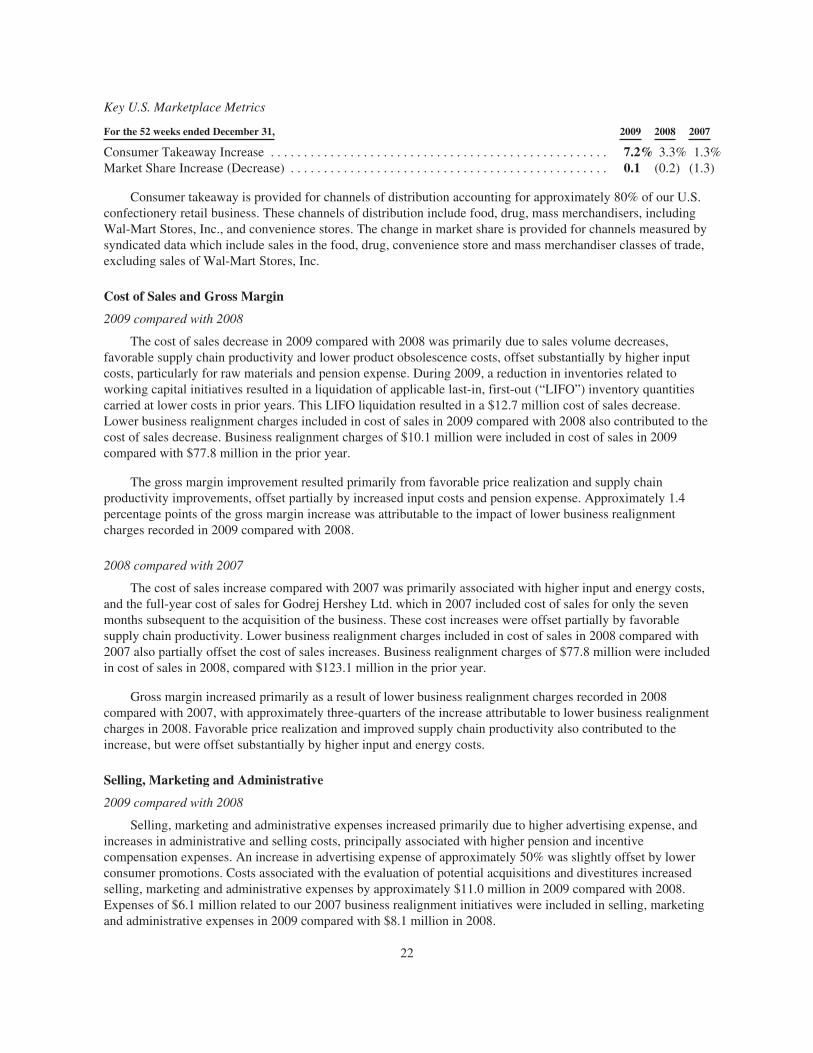
Key U.S. Marketplace Metrics
For the 52 weeks ended December 31, 2009 2008 2007
Consumer Takeaway Increase . . . . . . . . . . . . . . . . . . . . . . . . . . . . . . . . . . . . . . . . . . . . . . . . . . . 7.2% 3.3% 1.3%Market Share Increase (Decrease) . . . . . . . . . . . . . . . . . . . . . . . . . . . . . . . . . . . . . . . . . . . . . . . . 0.1 (0.2) (1.3)
Consumer takeaway is provided for channels of distribution accounting for approximately 80% of our U.S.confectionery retail business. These channels of distribution include food, drug, mass merchandisers, includingWal-Mart Stores, Inc., and convenience stores. The change in market share is provided for channels measured bysyndicated data which include sales in the food, drug, convenience store and mass merchandiser classes of trade,excluding sales of Wal-Mart Stores, Inc.
Cost of Sales and Gross Margin
2009 compared with 2008
The cost of sales decrease in 2009 compared with 2008 was primarily due to sales volume decreases,favorable supply chain productivity and lower product obsolescence costs, offset substantially by higher inputcosts, particularly for raw materials and pension expense. During 2009, a reduction in inventories related toworking capital initiatives resulted in a liquidation of applicable last-in, first-out (“LIFO”) inventory quantitiescarried at lower costs in prior years. This LIFO liquidation resulted in a $12.7 million cost of sales decrease.Lower business realignment charges included in cost of sales in 2009 compared with 2008 also contributed to thecost of sales decrease. Business realignment charges of $10.1 million were included in cost of sales in 2009compared with $77.8 million in the prior year.
The gross margin improvement resulted primarily from favorable price realization and supply chainproductivity improvements, offset partially by increased input costs and pension expense. Approximately 1.4percentage points of the gross margin increase was attributable to the impact of lower business realignmentcharges recorded in 2009 compared with 2008.
2008 compared with 2007
The cost of sales increase compared with 2007 was primarily associated with higher input and energy costs,and the full-year cost of sales for Godrej Hershey Ltd. which in 2007 included cost of sales for only the sevenmonths subsequent to the acquisition of the business. These cost increases were offset partially by favorablesupply chain productivity. Lower business realignment charges included in cost of sales in 2008 compared with2007 also partially offset the cost of sales increases. Business realignment charges of $77.8 million were includedin cost of sales in 2008, compared with $123.1 million in the prior year.
Gross margin increased primarily as a result of lower business realignment charges recorded in 2008compared with 2007, with approximately three-quarters of the increase attributable to lower business realignmentcharges in 2008. Favorable price realization and improved supply chain productivity also contributed to theincrease, but were offset substantially by higher input and energy costs.
Selling, Marketing and Administrative
2009 compared with 2008
Selling, marketing and administrative expenses increased primarily due to higher advertising expense, andincreases in administrative and selling costs, principally associated with higher pension and incentivecompensation expenses. An increase in advertising expense of approximately 50% was slightly offset by lowerconsumer promotions. Costs associated with the evaluation of potential acquisitions and divestitures increasedselling, marketing and administrative expenses by approximately $11.0 million in 2009 compared with 2008.Expenses of $6.1 million related to our 2007 business realignment initiatives were included in selling, marketingand administrative expenses in 2009 compared with $8.1 million in 2008.
22
2008 compared with 2007
Selling, marketing and administrative expenses increased primarily as a result of higher costs associatedwith employee-related expenses, including higher incentive compensation expense, increased levels of retailcoverage primarily in the United States and expansion of our international businesses. Higher advertising,marketing research and merchandising expenses also contributed to the increase. Business realignment charges of$8.1 million were included in selling, marketing and administrative expenses in 2008 compared with $12.6million in 2007.
Business Realignment Initiatives and Impairment Charges
In February 2007, we announced a comprehensive, three-year supply chain transformation program (the“global supply chain transformation program” or “GSCT”) and, in December 2007, we initiated a businessrealignment program associated with our business in Brazil (together, “the 2007 business realignmentinitiatives”). In December 2008, we approved a modest expansion in the scope of the global supply chaintransformation program to include the closure of two subscale manufacturing facilities of Artisan ConfectionsCompany, a wholly-owned subsidiary, and consolidation of the associated production into existing U.S. facilities,along with rationalization of other select portfolio items. The affected facilities were located in Berkeley and SanFrancisco, California. Additional business realignment charges related to the expansion in scope were recorded in2009 and included severance for approximately 150 employees.
The original estimated pre-tax cost of the program announced in February 2007 was from $525 million to$575 million over three years. The total included from $475 million to $525 million in business realignment costsand approximately $50 million in project implementation costs. The increase in scope approved in December2008 increased the total expected cost by about $25 million. In addition, employee lump sum withdrawals fromour defined benefit pension plans resulted in total non-cash pension settlement losses of $85.0 million whichconsisted of $60.4 million in 2009, $12.5 million in 2008 and $12.1 million in 2007.
Total pre-tax charges and non-recurring project implementation costs were $629.1 million for the GSCT.Excluding the higher than planned non-cash pension settlement losses, the GSCT total project costs were withinthe projected ranges. The GSCT was essentially complete as of December 31, 2009. Total costs of $99.1 millionwere recorded during 2009, costs of $130.0 million were recorded in 2008 and costs of $400.0 million wererecorded in 2007 for this program. The current trends of employee lump sum withdrawals from the definedbenefit pension plans could result in additional non-cash pension settlement losses of $12 million to $18 millionin 2010. In addition, the manufacturing facilities in Naugatuck, Connecticut; Reading, Pennsylvania and SmithsFalls, Ontario have been closed and are being held for sale. Actual proceeds from the sale of these facilities coulddiffer from expected proceeds which could cause additional charges or credits in 2010.
In an effort to improve the performance of our business in Brazil, in January 2008 Hershey do Brasil enteredinto a cooperative agreement with Pandurata Alimentos LTDA (“Bauducco”), a leading manufacturer of bakedgoods in Brazil whose primary brand is Bauducco. Business realignment and impairment charges of $4.9 millionwere recorded in 2008 and $12.6 million were recorded in 2007.
23
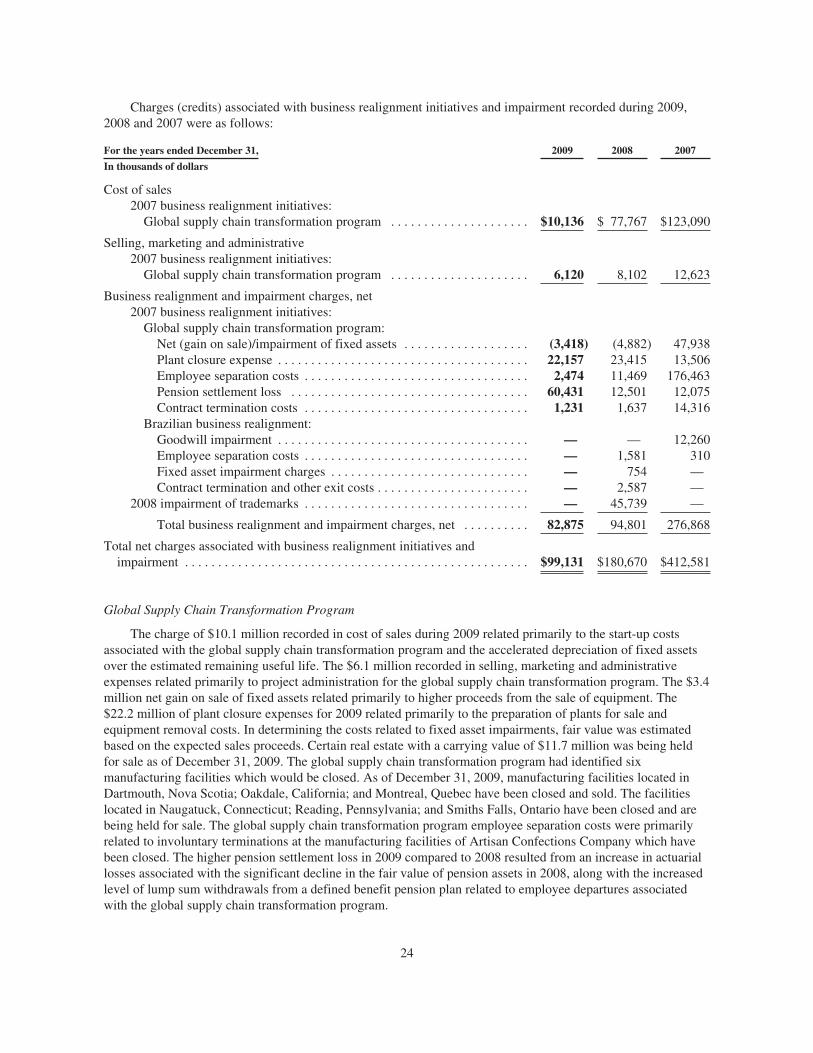
Charges (credits) associated with business realignment initiatives and impairment recorded during 2009,2008 and 2007 were as follows:
For the years ended December 31, 2009 2008 2007
In thousands of dollars
Cost of sales2007 business realignment initiatives:
Global supply chain transformation program . . . . . . . . . . . . . . . . . . . . . $10,136 $ 77,767 $123,090
Selling, marketing and administrative2007 business realignment initiatives:
Global supply chain transformation program . . . . . . . . . . . . . . . . . . . . . 6,120 8,102 12,623
Business realignment and impairment charges, net2007 business realignment initiatives:
Global supply chain transformation program:Net (gain on sale)/impairment of fixed assets . . . . . . . . . . . . . . . . . . . (3,418) (4,882) 47,938Plant closure expense . . . . . . . . . . . . . . . . . . . . . . . . . . . . . . . . . . . . . . 22,157 23,415 13,506Employee separation costs . . . . . . . . . . . . . . . . . . . . . . . . . . . . . . . . . . 2,474 11,469 176,463Pension settlement loss . . . . . . . . . . . . . . . . . . . . . . . . . . . . . . . . . . . . 60,431 12,501 12,075Contract termination costs . . . . . . . . . . . . . . . . . . . . . . . . . . . . . . . . . . 1,231 1,637 14,316
Brazilian business realignment:Goodwill impairment . . . . . . . . . . . . . . . . . . . . . . . . . . . . . . . . . . . . . . — — 12,260Employee separation costs . . . . . . . . . . . . . . . . . . . . . . . . . . . . . . . . . . — 1,581 310Fixed asset impairment charges . . . . . . . . . . . . . . . . . . . . . . . . . . . . . . — 754 —Contract termination and other exit costs . . . . . . . . . . . . . . . . . . . . . . . — 2,587 —
2008 impairment of trademarks . . . . . . . . . . . . . . . . . . . . . . . . . . . . . . . . . . — 45,739 —
Total business realignment and impairment charges, net . . . . . . . . . . 82,875 94,801 276,868
Total net charges associated with business realignment initiatives andimpairment . . . . . . . . . . . . . . . . . . . . . . . . . . . . . . . . . . . . . . . . . . . . . . . . . . . . $99,131 $180,670 $412,581
Global Supply Chain Transformation Program
The charge of $10.1 million recorded in cost of sales during 2009 related primarily to the start-up costsassociated with the global supply chain transformation program and the accelerated depreciation of fixed assetsover the estimated remaining useful life. The $6.1 million recorded in selling, marketing and administrativeexpenses related primarily to project administration for the global supply chain transformation program. The $3.4million net gain on sale of fixed assets related primarily to higher proceeds from the sale of equipment. The$22.2 million of plant closure expenses for 2009 related primarily to the preparation of plants for sale andequipment removal costs. In determining the costs related to fixed asset impairments, fair value was estimatedbased on the expected sales proceeds. Certain real estate with a carrying value of $11.7 million was being heldfor sale as of December 31, 2009. The global supply chain transformation program had identified sixmanufacturing facilities which would be closed. As of December 31, 2009, manufacturing facilities located inDartmouth, Nova Scotia; Oakdale, California; and Montreal, Quebec have been closed and sold. The facilitieslocated in Naugatuck, Connecticut; Reading, Pennsylvania; and Smiths Falls, Ontario have been closed and arebeing held for sale. The global supply chain transformation program employee separation costs were primarilyrelated to involuntary terminations at the manufacturing facilities of Artisan Confections Company which havebeen closed. The higher pension settlement loss in 2009 compared to 2008 resulted from an increase in actuariallosses associated with the significant decline in the fair value of pension assets in 2008, along with the increasedlevel of lump sum withdrawals from a defined benefit pension plan related to employee departures associatedwith the global supply chain transformation program.
24
The 2008 charge of $77.8 million recorded in cost of sales for the global supply chain transformationprogram related primarily to the accelerated depreciation of fixed assets over a reduced estimated remaininguseful life and start-up costs associated with the global supply chain transformation program. The $8.1 millionrecorded in selling, marketing and administrative expenses related primarily to project administration for theglobal supply chain transformation program. In determining the costs related to fixed asset impairments, fairvalue was estimated based on the expected sales proceeds. The $4.9 million of gains on sale of fixed assetsresulted from the receipt of proceeds in excess of the carrying value primarily from the sale of a warehousing anddistribution facility. The $23.4 million of plant closure expenses for 2008 related primarily to the preparation ofplants for sale and production line removal costs. Certain real estate with a carrying value of $15.8 million wasbeing held for sale as of December 31, 2008. The global supply chain transformation program employeeseparation costs were related to involuntary terminations at the North American manufacturing facilities whichwere being closed.
The 2007 charge of $123.1 million recorded in cost of sales for the global supply chain transformationprogram related primarily to the accelerated depreciation of fixed assets over a reduced estimated remaininguseful life and costs related to inventory reductions. The $12.6 million recorded in selling, marketing andadministrative expenses related primarily to project management and administration. In determining the costsrelated to fixed asset impairments, fair value was estimated based on the expected sales proceeds. Certain realestate with a carrying value of $40.2 million was being held for sale as of December 31, 2007. Employeeseparation costs included $79.0 million primarily for involuntary terminations at the 6 North Americanmanufacturing facilities which were being closed. The employee separation costs also included $97.5 million forcharges relating to pension and other post-retirement benefits curtailments and special termination benefits.
Brazilian Business Realignment
The 2008 Brazilian business realignment charges and the 2007 employee separation costs were related toinvoluntary terminations and costs associated with office consolidation related to the cooperative agreement withBauducco. During the fourth quarter of 2007, we completed our annual impairment evaluation of goodwill andother intangible assets. As a result of reduced expectations for future cash flows resulting primarily from lowerexpected profitability, we determined that the carrying amount of our wholly-owned subsidiary, Hershey doBrasil, exceeded its fair value and recorded a non-cash impairment charge of $12.3 million in December 2007.There was no tax benefit associated with this charge.
2008 Impairment of Trademarks
As a result of our annual impairment tests of intangible assets with useful lives determined to be indefinite,we recorded total impairment charges of $45.7 million in December 2008. We determined that the carryingamounts of certain trademarks, primarily the Mauna Loa brand, exceeded their estimated fair value due toreduced expectations for future sales and cash flows compared with the valuations at the acquisition dates. Formore information, refer to pages 46 and 47.
Liabilities Associated with Business Realignment Initiatives
The liability balance as of December 31, 2009 relating to the 2007 business realignment initiatives was $9.2million, primarily for employee separation and plant closure costs to be paid in 2010. The liability balance as ofDecember 31, 2009 was increased by $0.1 million as a result of foreign currency translation adjustments. Theliability balance as of December 31, 2008 was $31.0 million, primarily related to employee separation costs.Charges for plant closure and employee separation costs of $6.6 million were recorded in 2009. We madepayments of $28.5 million in 2009 and $46.9 million in 2008 against the liabilities recorded for the 2007 businessrealignment initiatives, principally related to employee separation and project administration.
25

Income Before Interest and Income Taxes and EBIT Margin
2009 compared with 2008
EBIT increased in 2009 compared with 2008 principally as a result of higher gross profit and reducedbusiness realignment charges, partially offset by increased selling, marketing and administrative expenses. Netpre-tax business realignment charges of $99.1 million were recorded in 2009 compared with $180.7 millionrecorded in 2008, a decrease of $81.6 million.
EBIT margin increased from 11.5% for 2008 to 14.4% for 2009. The increase in EBIT margin was the resultof the higher gross margin, partially offset by higher selling, marketing and administrative expense as apercentage of sales. Net business realignment and impairment charges reduced EBIT margin by 1.8 percentagepoints in 2009 and by 3.5 percentage points in 2008, resulting in an improvement in EBIT margin of 1.7percentage points from 2008 to 2009.
2008 compared with 2007
EBIT increased in 2008 compared with 2007 as a result of lower net business realignment charges. Netpre-tax business realignment charges of $180.7 million were recorded in 2008 compared with $412.6 million in2007. The increase in EBIT resulting from lower business realignment charges and an increase in gross profitwas substantially offset by higher selling, marketing and administrative expenses.
EBIT margin increased from 9.3% in 2007 to 11.5% in 2008. Net business realignment and impairmentcharges reduced EBIT margin by 3.5 percentage points in 2008 and 8.3 percentage points in 2007, resulting in animprovement in EBIT margin of 4.8 percentage points from 2007 to 2008. This impact was substantially offsetby higher selling, marketing and administrative expense as a percentage of sales.
Interest Expense, Net
2009 compared with 2008
Net interest expense was lower in 2009 than the comparable period of 2008 primarily due to lower interestrates and lower average debt balances.
2008 compared with 2007
Net interest expense was lower in 2008 than in 2007 primarily due to lower interest rates and reducedborrowings as compared with the prior year.
Income Taxes and Effective Tax Rate
2009 compared with 2008
Our effective income tax rate was 35.0% for 2009 and was decreased by 0.5 percentage points as a result ofthe effective tax rate associated with business realignment charges recorded during the year. Our effectiveincome tax rate was also lower in 2009 due to changes in the mix of income among various tax jurisdictions ascompared with 2008.
2008 compared with 2007
Our effective income tax rate was 36.7% in 2008, and was increased by 0.7 percentage points as a result ofthe effective tax rate associated with business realignment charges recorded during the year.
26
Net Income and Net Income Per Share
2009 compared with 2008
Net income in 2009 was reduced by $60.8 million, or $0.27 per share-diluted, and was reduced by$119.1 million, or $0.52 per share-diluted, in 2008 as a result of net charges associated with our businessrealignment initiatives. After considering the impact of business realignment and impairment charges in eachperiod, earnings per share-diluted in 2009 increased $0.29, or 15.4%, as compared with 2008.
2008 compared with 2007
As a result of net charges associated with our business realignment initiatives, net income in 2008 wasreduced by $119.1 million or $0.52 per share-diluted. After considering the impact of business realignment andimpairment charges in each period, earnings per share-diluted in 2008 decreased $0.20 as compared with 2007.
27
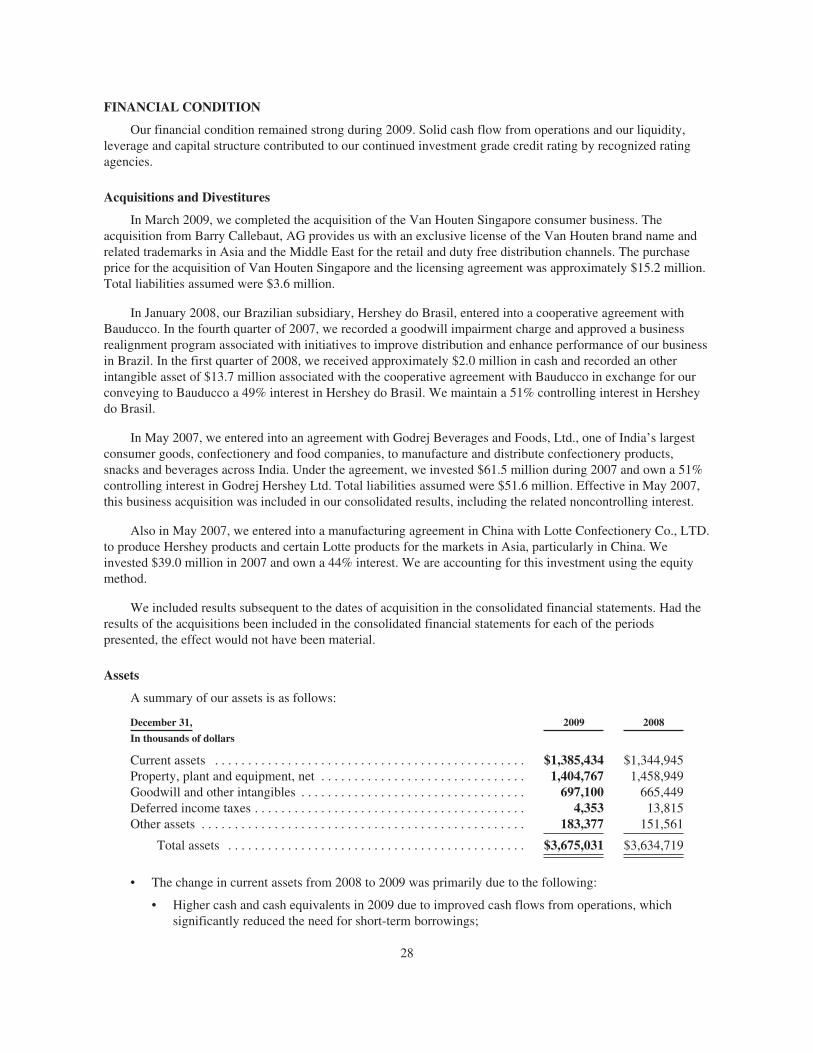
FINANCIAL CONDITION
Our financial condition remained strong during 2009. Solid cash flow from operations and our liquidity,leverage and capital structure contributed to our continued investment grade credit rating by recognized ratingagencies.
Acquisitions and Divestitures
In March 2009, we completed the acquisition of the Van Houten Singapore consumer business. Theacquisition from Barry Callebaut, AG provides us with an exclusive license of the Van Houten brand name andrelated trademarks in Asia and the Middle East for the retail and duty free distribution channels. The purchaseprice for the acquisition of Van Houten Singapore and the licensing agreement was approximately $15.2 million.Total liabilities assumed were $3.6 million.
In January 2008, our Brazilian subsidiary, Hershey do Brasil, entered into a cooperative agreement withBauducco. In the fourth quarter of 2007, we recorded a goodwill impairment charge and approved a businessrealignment program associated with initiatives to improve distribution and enhance performance of our businessin Brazil. In the first quarter of 2008, we received approximately $2.0 million in cash and recorded an otherintangible asset of $13.7 million associated with the cooperative agreement with Bauducco in exchange for ourconveying to Bauducco a 49% interest in Hershey do Brasil. We maintain a 51% controlling interest in Hersheydo Brasil.
In May 2007, we entered into an agreement with Godrej Beverages and Foods, Ltd., one of India’s largestconsumer goods, confectionery and food companies, to manufacture and distribute confectionery products,snacks and beverages across India. Under the agreement, we invested $61.5 million during 2007 and own a 51%controlling interest in Godrej Hershey Ltd. Total liabilities assumed were $51.6 million. Effective in May 2007,this business acquisition was included in our consolidated results, including the related noncontrolling interest.
Also in May 2007, we entered into a manufacturing agreement in China with Lotte Confectionery Co., LTD.to produce Hershey products and certain Lotte products for the markets in Asia, particularly in China. Weinvested $39.0 million in 2007 and own a 44% interest. We are accounting for this investment using the equitymethod.
We included results subsequent to the dates of acquisition in the consolidated financial statements. Had theresults of the acquisitions been included in the consolidated financial statements for each of the periodspresented, the effect would not have been material.
Assets
A summary of our assets is as follows:
December 31, 2009 2008
In thousands of dollars
Current assets . . . . . . . . . . . . . . . . . . . . . . . . . . . . . . . . . . . . . . . . . . . . . . . $1,385,434 $1,344,945Property, plant and equipment, net . . . . . . . . . . . . . . . . . . . . . . . . . . . . . . . 1,404,767 1,458,949Goodwill and other intangibles . . . . . . . . . . . . . . . . . . . . . . . . . . . . . . . . . . 697,100 665,449Deferred income taxes . . . . . . . . . . . . . . . . . . . . . . . . . . . . . . . . . . . . . . . . . 4,353 13,815Other assets . . . . . . . . . . . . . . . . . . . . . . . . . . . . . . . . . . . . . . . . . . . . . . . . . 183,377 151,561
Total assets . . . . . . . . . . . . . . . . . . . . . . . . . . . . . . . . . . . . . . . . . . . . . $3,675,031 $3,634,719
• The change in current assets from 2008 to 2009 was primarily due to the following:
• Higher cash and cash equivalents in 2009 due to improved cash flows from operations, whichsignificantly reduced the need for short-term borrowings;
28
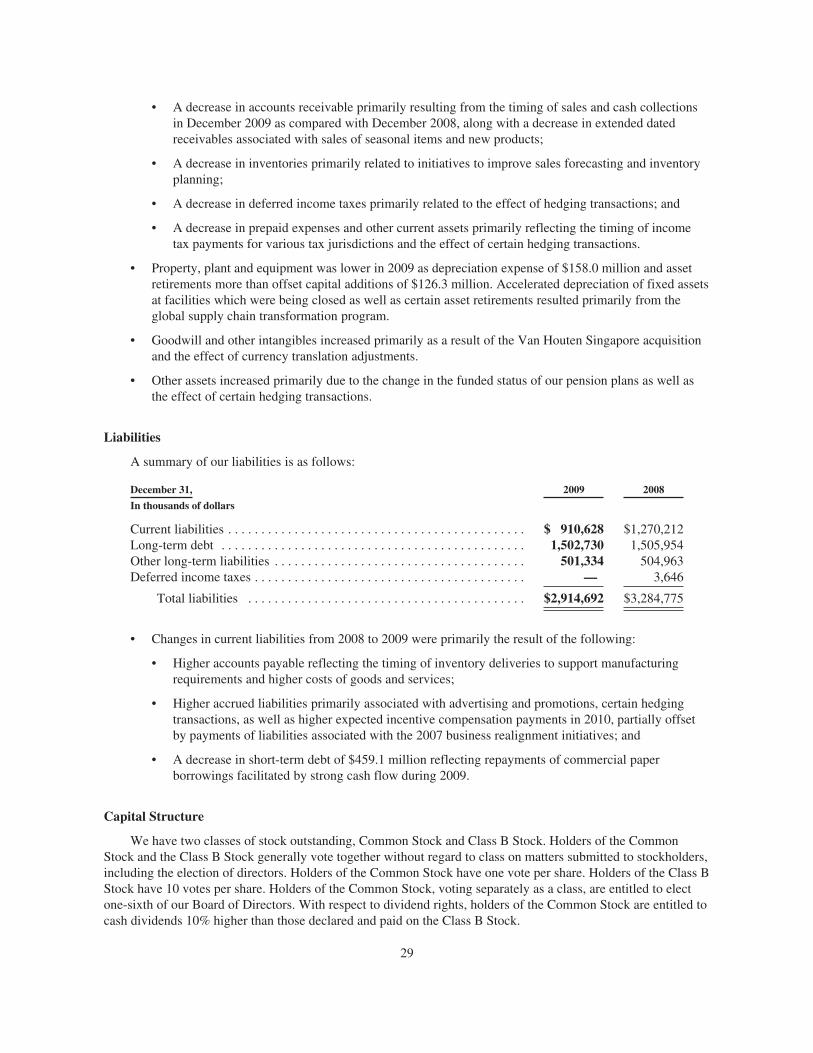
• A decrease in accounts receivable primarily resulting from the timing of sales and cash collectionsin December 2009 as compared with December 2008, along with a decrease in extended datedreceivables associated with sales of seasonal items and new products;
• A decrease in inventories primarily related to initiatives to improve sales forecasting and inventoryplanning;
• A decrease in deferred income taxes primarily related to the effect of hedging transactions; and
• A decrease in prepaid expenses and other current assets primarily reflecting the timing of incometax payments for various tax jurisdictions and the effect of certain hedging transactions.
• Property, plant and equipment was lower in 2009 as depreciation expense of $158.0 million and assetretirements more than offset capital additions of $126.3 million. Accelerated depreciation of fixed assetsat facilities which were being closed as well as certain asset retirements resulted primarily from theglobal supply chain transformation program.
• Goodwill and other intangibles increased primarily as a result of the Van Houten Singapore acquisitionand the effect of currency translation adjustments.
• Other assets increased primarily due to the change in the funded status of our pension plans as well asthe effect of certain hedging transactions.
Liabilities
A summary of our liabilities is as follows:
December 31, 2009 2008
In thousands of dollars
Current liabilities . . . . . . . . . . . . . . . . . . . . . . . . . . . . . . . . . . . . . . . . . . . . . $ 910,628 $1,270,212Long-term debt . . . . . . . . . . . . . . . . . . . . . . . . . . . . . . . . . . . . . . . . . . . . . . 1,502,730 1,505,954Other long-term liabilities . . . . . . . . . . . . . . . . . . . . . . . . . . . . . . . . . . . . . . 501,334 504,963Deferred income taxes . . . . . . . . . . . . . . . . . . . . . . . . . . . . . . . . . . . . . . . . . — 3,646
Total liabilities . . . . . . . . . . . . . . . . . . . . . . . . . . . . . . . . . . . . . . . . . . $2,914,692 $3,284,775
• Changes in current liabilities from 2008 to 2009 were primarily the result of the following:
• Higher accounts payable reflecting the timing of inventory deliveries to support manufacturingrequirements and higher costs of goods and services;
• Higher accrued liabilities primarily associated with advertising and promotions, certain hedgingtransactions, as well as higher expected incentive compensation payments in 2010, partially offsetby payments of liabilities associated with the 2007 business realignment initiatives; and
• A decrease in short-term debt of $459.1 million reflecting repayments of commercial paperborrowings facilitated by strong cash flow during 2009.
Capital Structure
We have two classes of stock outstanding, Common Stock and Class B Stock. Holders of the CommonStock and the Class B Stock generally vote together without regard to class on matters submitted to stockholders,including the election of directors. Holders of the Common Stock have one vote per share. Holders of the Class BStock have 10 votes per share. Holders of the Common Stock, voting separately as a class, are entitled to electone-sixth of our Board of Directors. With respect to dividend rights, holders of the Common Stock are entitled tocash dividends 10% higher than those declared and paid on the Class B Stock.
29
Hershey Trust Company, as trustee for the benefit of Milton Hershey School (the “Milton Hershey SchoolTrust” or the “Trust”) maintains voting control over The Hershey Company. Historically, the Milton HersheySchool Trust had not taken an active role in setting our policy, nor had it exercised influence with regard to theongoing business decisions of our Board of Directors or management. However, in October 2007, the Chairmanof the Board of the Milton Hershey School Trust issued a statement indicating that the Trust continues to beguided by two key principles: first, that, in its role as controlling stockholder of the Company, it intends to retainits controlling interest in The Hershey Company and, second, that the long-term prosperity of the Companyrequires the Board of Directors of the Company and its management to build on its strong U.S. position byaggressively pursuing strategies for domestic and international growth. He further stated that the Milton HersheySchool Trust had communicated to the Company’s Board that the Trust was not satisfied with the Company’sresults and that, as a result, the Trust was “actively engaged in an ongoing process, the goal of which has been toensure vigorous Company Board focus on resolving the Company’s current business challenges and onimplementing new growth strategies.” In that release, the Trust board chairman reiterated the Trust’slongstanding position that the Company Board, and not the Trust board, “is solely responsible and accountablefor the Company’s management and performance.”
Arnold G. Langbo and Charles B. Strauss resigned from the Board of Directors of the Company effectiveAugust 10, 2009, following a decision by the Board of Directors to establish a Finance and Risk ManagementCommittee that also delegated to such committee responsibilities with respect to reviewing and monitoring theCompany’s annual plan and certain strategic matters including but not limited to acquisitions and dispositions.Messrs. Langbo and Strauss decided to resign from the Board of Directors based on their views, expressed beforethe committee was established, that retaining responsibility for these matters with the Board of Directors as awhole was a better corporate governance structure for the Company.
On November 11, 2007 we announced that all of the members of our Board of Directors had resigned exceptfor Richard H. Lenny, who was at that time our Chairman of the Board and Chief Executive Officer, David J.West, who was at that time President of the Company and currently serves as our President and Chief ExecutiveOfficer, and Robert F. Cavanaugh, who is also a member of the board of directors of Hershey Trust Companyand board of managers (governing body) of Milton Hershey School. In addition, we announced that the MiltonHershey School Trust through stockholder action effected by written consent had amended the By-laws of theCompany to allow the Company’s stockholders to fix the number of directors to serve on our Board of Directorsand from time to time to increase or decrease such number of directors, expanded the size of our Board ofDirectors from 11 directors to 13 directors, and appointed 8 new directors, including two who are also membersof the board of directors of Hershey Trust Company and board of managers of Milton Hershey School.
The Milton Hershey School Trust decided to explore a sale of The Hershey Company in June 2002, butsubsequently decided to terminate the sale process in September 2002. After terminating the sale process, theTrustee of the Milton Hershey School Trust advised the Pennsylvania Office of Attorney General in September2002 that it would not agree to any sale of its controlling interest in The Hershey Company without approval ofthe court having jurisdiction over the Milton Hershey School Trust following advance notice to the Office ofAttorney General. Subsequently, Pennsylvania enacted legislation that requires that the Office of AttorneyGeneral be provided advance notice of any transaction that would result in the Milton Hershey School Trust nolonger having voting control of the Company. The law provides specific statutory authority for the AttorneyGeneral to intercede and petition the Court having jurisdiction over the Milton Hershey School Trust to stop sucha transaction if the Attorney General can prove that the transaction is unnecessary for the future economicviability of the Company and is inconsistent with investment and management considerations under fiduciaryobligations. This legislation could have the effect of making it more difficult for a third party to acquire amajority of our outstanding voting stock and thereby delay or prevent a change in control of the Company.
In December 2000, our Board of Directors unanimously adopted a Stockholder Protection RightsAgreement (“Rights Agreement”). The Milton Hershey School Trust supported the Rights Agreement. Thisaction was not in response to any specific effort to acquire control of The Hershey Company. Under the Rights
30
Agreement, our Board of Directors declared a dividend of one right (“Right”) for each outstanding share ofCommon Stock and Class B Stock payable to stockholders of record at the close of business on December 26,2000. The Rights will at no time have voting power or receive dividends. The issuance of the Rights has nodilutive effect, will not affect reported earnings per share, is not taxable and will not change the manner in whichour Common Stock is traded. We discuss the Rights Agreement in more detail in Note 16, Capital Stock and NetIncome Per Share.
Noncontrolling Interests in Subsidiaries
As of January 1, 2009, the Company adopted a Financial Accounting Standards Board (“FASB”) accountingstandard that establishes new accounting and reporting requirements for the noncontrolling interest in asubsidiary (formerly known as minority interest) and for the deconsolidation of a subsidiary and requires thenoncontrolling interest to be reported as a component of equity. In addition, changes in a parent’s ownershipinterest while the parent retains its controlling interest will be accounted for as equity transactions, and anyretained noncontrolling equity investment upon the deconsolidation of a subsidiary will be measured initially atfair value.
In May 2007, we entered into an agreement with Godrej Beverages and Foods, Ltd. to manufacture anddistribute confectionery products, snacks and beverages across India. Under the agreement, we own a 51%controlling interest in Godrej Hershey Ltd. In January 2009, the Company contributed cash of approximately$8.7 million to Godrej Hershey Ltd. and owners of the noncontrolling interests in Godrej Hershey Ltd.contributed approximately $7.3 million. The ownership interest percentages in Godrej Hershey Ltd. did notchange significantly as a result of these contributions. The noncontrolling interests in Godrej Hershey Ltd. areincluded in the equity section of the Consolidated Balance Sheets.
We also own a 51% controlling interest in Hershey do Brasil under the cooperative agreement withBauducco. The noncontrolling interest in Hershey do Brasil is included in the equity section of the ConsolidatedBalance Sheets.
The increase in noncontrolling interests in subsidiaries from $31.7 million as of December 31, 2008 to $39.9million as of December 31, 2009 reflected the $7.3 million contribution from the noncontrolling interests inGodrej Hershey Ltd. and the impact of currency translation adjustments, partially offset by a reduction resultingfrom the recording of the share of losses pertaining to the noncontrolling interests. The share of losses pertainingto the noncontrolling interests in subsidiaries was $4.1 million for the year ended December 31, 2009, $6.1 millionfor the year ended December 31, 2008 and $1.3 million for the year ended December 31, 2007. This wasreflected in selling, marketing and administrative expenses.
31
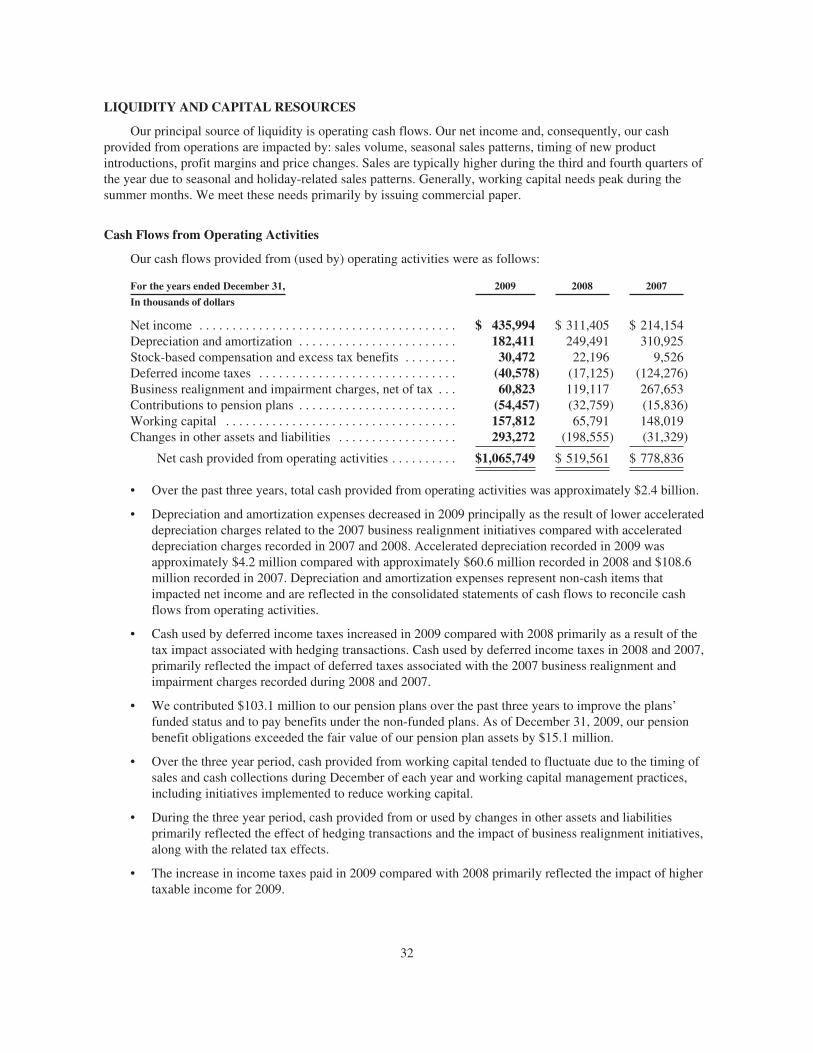
LIQUIDITY AND CAPITAL RESOURCES
Our principal source of liquidity is operating cash flows. Our net income and, consequently, our cashprovided from operations are impacted by: sales volume, seasonal sales patterns, timing of new productintroductions, profit margins and price changes. Sales are typically higher during the third and fourth quarters ofthe year due to seasonal and holiday-related sales patterns. Generally, working capital needs peak during thesummer months. We meet these needs primarily by issuing commercial paper.
Cash Flows from Operating Activities
Our cash flows provided from (used by) operating activities were as follows:
For the years ended December 31, 2009 2008 2007
In thousands of dollars
Net income . . . . . . . . . . . . . . . . . . . . . . . . . . . . . . . . . . . . . . . $ 435,994 $ 311,405 $ 214,154Depreciation and amortization . . . . . . . . . . . . . . . . . . . . . . . . 182,411 249,491 310,925Stock-based compensation and excess tax benefits . . . . . . . . 30,472 22,196 9,526Deferred income taxes . . . . . . . . . . . . . . . . . . . . . . . . . . . . . . (40,578) (17,125) (124,276)Business realignment and impairment charges, net of tax . . . 60,823 119,117 267,653Contributions to pension plans . . . . . . . . . . . . . . . . . . . . . . . . (54,457) (32,759) (15,836)Working capital . . . . . . . . . . . . . . . . . . . . . . . . . . . . . . . . . . . 157,812 65,791 148,019Changes in other assets and liabilities . . . . . . . . . . . . . . . . . . 293,272 (198,555) (31,329)
Net cash provided from operating activities . . . . . . . . . . $1,065,749 $ 519,561 $ 778,836
• Over the past three years, total cash provided from operating activities was approximately $2.4 billion.
• Depreciation and amortization expenses decreased in 2009 principally as the result of lower accelerateddepreciation charges related to the 2007 business realignment initiatives compared with accelerateddepreciation charges recorded in 2007 and 2008. Accelerated depreciation recorded in 2009 wasapproximately $4.2 million compared with approximately $60.6 million recorded in 2008 and $108.6million recorded in 2007. Depreciation and amortization expenses represent non-cash items thatimpacted net income and are reflected in the consolidated statements of cash flows to reconcile cashflows from operating activities.
• Cash used by deferred income taxes increased in 2009 compared with 2008 primarily as a result of thetax impact associated with hedging transactions. Cash used by deferred income taxes in 2008 and 2007,primarily reflected the impact of deferred taxes associated with the 2007 business realignment andimpairment charges recorded during 2008 and 2007.
• We contributed $103.1 million to our pension plans over the past three years to improve the plans’funded status and to pay benefits under the non-funded plans. As of December 31, 2009, our pensionbenefit obligations exceeded the fair value of our pension plan assets by $15.1 million.
• Over the three year period, cash provided from working capital tended to fluctuate due to the timing ofsales and cash collections during December of each year and working capital management practices,including initiatives implemented to reduce working capital.
• During the three year period, cash provided from or used by changes in other assets and liabilitiesprimarily reflected the effect of hedging transactions and the impact of business realignment initiatives,along with the related tax effects.
• The increase in income taxes paid in 2009 compared with 2008 primarily reflected the impact of highertaxable income for 2009.
32
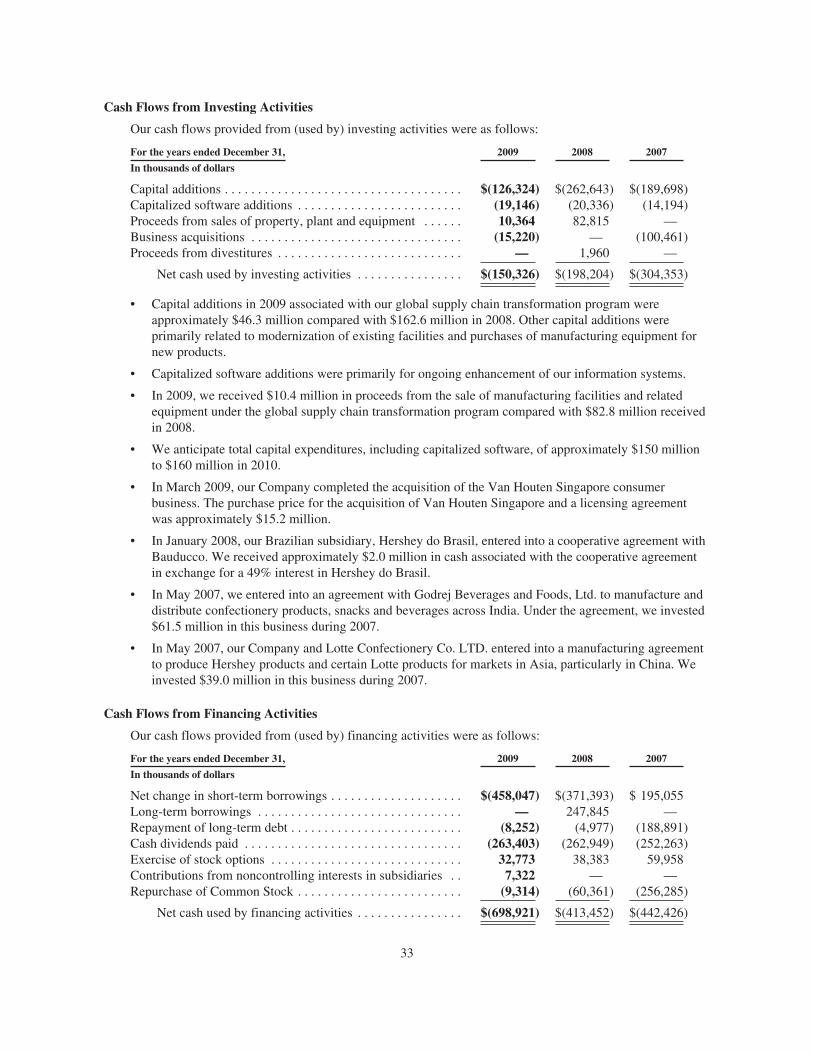
Cash Flows from Investing Activities
Our cash flows provided from (used by) investing activities were as follows:
For the years ended December 31, 2009 2008 2007
In thousands of dollars
Capital additions . . . . . . . . . . . . . . . . . . . . . . . . . . . . . . . . . . . . $(126,324) $(262,643) $(189,698)Capitalized software additions . . . . . . . . . . . . . . . . . . . . . . . . . (19,146) (20,336) (14,194)Proceeds from sales of property, plant and equipment . . . . . . 10,364 82,815 —Business acquisitions . . . . . . . . . . . . . . . . . . . . . . . . . . . . . . . . (15,220) — (100,461)Proceeds from divestitures . . . . . . . . . . . . . . . . . . . . . . . . . . . . — 1,960 —
Net cash used by investing activities . . . . . . . . . . . . . . . . $(150,326) $(198,204) $(304,353)
• Capital additions in 2009 associated with our global supply chain transformation program wereapproximately $46.3 million compared with $162.6 million in 2008. Other capital additions wereprimarily related to modernization of existing facilities and purchases of manufacturing equipment fornew products.
• Capitalized software additions were primarily for ongoing enhancement of our information systems.
• In 2009, we received $10.4 million in proceeds from the sale of manufacturing facilities and relatedequipment under the global supply chain transformation program compared with $82.8 million receivedin 2008.
• We anticipate total capital expenditures, including capitalized software, of approximately $150 millionto $160 million in 2010.
• In March 2009, our Company completed the acquisition of the Van Houten Singapore consumerbusiness. The purchase price for the acquisition of Van Houten Singapore and a licensing agreementwas approximately $15.2 million.
• In January 2008, our Brazilian subsidiary, Hershey do Brasil, entered into a cooperative agreement withBauducco. We received approximately $2.0 million in cash associated with the cooperative agreementin exchange for a 49% interest in Hershey do Brasil.
• In May 2007, we entered into an agreement with Godrej Beverages and Foods, Ltd. to manufacture anddistribute confectionery products, snacks and beverages across India. Under the agreement, we invested$61.5 million in this business during 2007.
• In May 2007, our Company and Lotte Confectionery Co. LTD. entered into a manufacturing agreementto produce Hershey products and certain Lotte products for markets in Asia, particularly in China. Weinvested $39.0 million in this business during 2007.
Cash Flows from Financing Activities
Our cash flows provided from (used by) financing activities were as follows:
For the years ended December 31, 2009 2008 2007
In thousands of dollars
Net change in short-term borrowings . . . . . . . . . . . . . . . . . . . . $(458,047) $(371,393) $ 195,055Long-term borrowings . . . . . . . . . . . . . . . . . . . . . . . . . . . . . . . — 247,845 —Repayment of long-term debt . . . . . . . . . . . . . . . . . . . . . . . . . . (8,252) (4,977) (188,891)Cash dividends paid . . . . . . . . . . . . . . . . . . . . . . . . . . . . . . . . . (263,403) (262,949) (252,263)Exercise of stock options . . . . . . . . . . . . . . . . . . . . . . . . . . . . . 32,773 38,383 59,958Contributions from noncontrolling interests in subsidiaries . . 7,322 — —Repurchase of Common Stock . . . . . . . . . . . . . . . . . . . . . . . . . (9,314) (60,361) (256,285)
Net cash used by financing activities . . . . . . . . . . . . . . . . $(698,921) $(413,452) $(442,426)
33
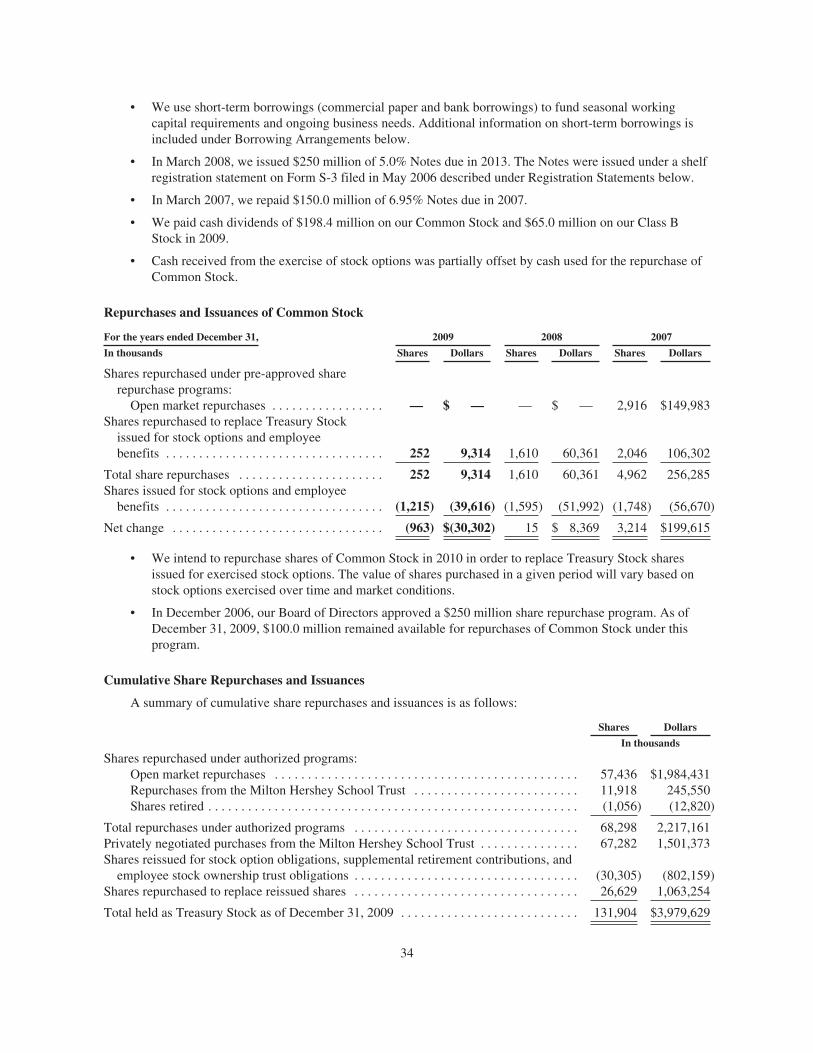
• We use short-term borrowings (commercial paper and bank borrowings) to fund seasonal workingcapital requirements and ongoing business needs. Additional information on short-term borrowings isincluded under Borrowing Arrangements below.
• In March 2008, we issued $250 million of 5.0% Notes due in 2013. The Notes were issued under a shelfregistration statement on Form S-3 filed in May 2006 described under Registration Statements below.
• In March 2007, we repaid $150.0 million of 6.95% Notes due in 2007.
• We paid cash dividends of $198.4 million on our Common Stock and $65.0 million on our Class BStock in 2009.
• Cash received from the exercise of stock options was partially offset by cash used for the repurchase ofCommon Stock.
Repurchases and Issuances of Common Stock
For the years ended December 31, 2009 2008 2007
In thousands Shares Dollars Shares Dollars Shares Dollars
Shares repurchased under pre-approved sharerepurchase programs:
Open market repurchases . . . . . . . . . . . . . . . . . — $ — — $ — 2,916 $149,983Shares repurchased to replace Treasury Stock
issued for stock options and employeebenefits . . . . . . . . . . . . . . . . . . . . . . . . . . . . . . . . . 252 9,314 1,610 60,361 2,046 106,302
Total share repurchases . . . . . . . . . . . . . . . . . . . . . . 252 9,314 1,610 60,361 4,962 256,285Shares issued for stock options and employee
benefits . . . . . . . . . . . . . . . . . . . . . . . . . . . . . . . . . (1,215) (39,616) (1,595) (51,992) (1,748) (56,670)
Net change . . . . . . . . . . . . . . . . . . . . . . . . . . . . . . . . (963) $(30,302) 15 $ 8,369 3,214 $199,615
• We intend to repurchase shares of Common Stock in 2010 in order to replace Treasury Stock sharesissued for exercised stock options. The value of shares purchased in a given period will vary based onstock options exercised over time and market conditions.
• In December 2006, our Board of Directors approved a $250 million share repurchase program. As ofDecember 31, 2009, $100.0 million remained available for repurchases of Common Stock under thisprogram.
Cumulative Share Repurchases and Issuances
A summary of cumulative share repurchases and issuances is as follows:
Shares Dollars
In thousands
Shares repurchased under authorized programs:Open market repurchases . . . . . . . . . . . . . . . . . . . . . . . . . . . . . . . . . . . . . . . . . . . . . . 57,436 $1,984,431Repurchases from the Milton Hershey School Trust . . . . . . . . . . . . . . . . . . . . . . . . . 11,918 245,550Shares retired . . . . . . . . . . . . . . . . . . . . . . . . . . . . . . . . . . . . . . . . . . . . . . . . . . . . . . . . (1,056) (12,820)
Total repurchases under authorized programs . . . . . . . . . . . . . . . . . . . . . . . . . . . . . . . . . . 68,298 2,217,161Privately negotiated purchases from the Milton Hershey School Trust . . . . . . . . . . . . . . . 67,282 1,501,373Shares reissued for stock option obligations, supplemental retirement contributions, and
employee stock ownership trust obligations . . . . . . . . . . . . . . . . . . . . . . . . . . . . . . . . . . (30,305) (802,159)Shares repurchased to replace reissued shares . . . . . . . . . . . . . . . . . . . . . . . . . . . . . . . . . . 26,629 1,063,254
Total held as Treasury Stock as of December 31, 2009 . . . . . . . . . . . . . . . . . . . . . . . . . . . 131,904 $3,979,629
34
Borrowing Arrangements
We maintain debt levels we consider prudent based on our cash flow, interest coverage ratio and percentageof debt to capital. We use debt financing to lower our overall cost of capital which increases our return onstockholders’ equity.
• In December 2006, we entered into a five-year agreement establishing an unsecured committedrevolving credit facility to borrow up to $1.1 billion, with an option to increase borrowings to $1.5billion with the consent of the lenders. During the fourth quarter of 2007, the lenders approved anextension of this agreement by one year in accordance with our option under the agreement. The five-year agreement will now expire in December 2012. As of December 31, 2009, $1.1 billion was availableto borrow under the agreement. The unsecured revolving credit agreement contains certain financial andother covenants, customary representations, warranties, and events of default. As of December 31, 2009,we complied with all of these covenants. We may use these funds for general corporate purposes,including commercial paper backstop and business acquisitions.
• In August 2007, we entered into an unsecured revolving short-term credit agreement to borrow up to anadditional $300 million because we believed at the time that seasonal working capital needs, sharerepurchases and other business activities would cause our borrowings to exceed the $1.1 billionborrowing limit available under our five-year credit agreement. We used the funds borrowed under thisnew agreement for general corporate purposes, including commercial paper backstop. Although the newagreement was scheduled to expire in August 2008, we elected to terminate it in June 2008 because wedetermined that we no longer needed the additional borrowing capacity provided by the agreement.
• In addition to the revolving credit facility, we maintain lines of credit with domestic and internationalcommercial banks. As of December 31, 2009, we could borrow up to approximately $68.9 million invarious currencies under the lines of credit and as of December 31, 2008, we could borrow up to $67.1million.
Registration Statements
• In May 2009, we filed a shelf registration statement on Form S-3 that registered an indeterminateamount of debt securities. This registration statement was effective immediately upon filing underSecurities and Exchange Commission regulations governing “well-known seasoned issuers” (the “WKSIRegistration Statement”). This WKSI Registration Statement was filed to replace a May 2006 WKSIRegistration Statement which expired in May 2009.
• In March 2008, we issued $250 million of 5.0% Notes due April 1, 2013. The Notes were issued underthe 2006 WKSI Registration Statement.
• Proceeds from the debt issuances and any other offerings under the WKSI Registration Statement maybe used for general corporate requirements. These may include reducing existing borrowings, financingcapital additions, funding contributions to our pension plans, future business acquisitions and workingcapital requirements.
35
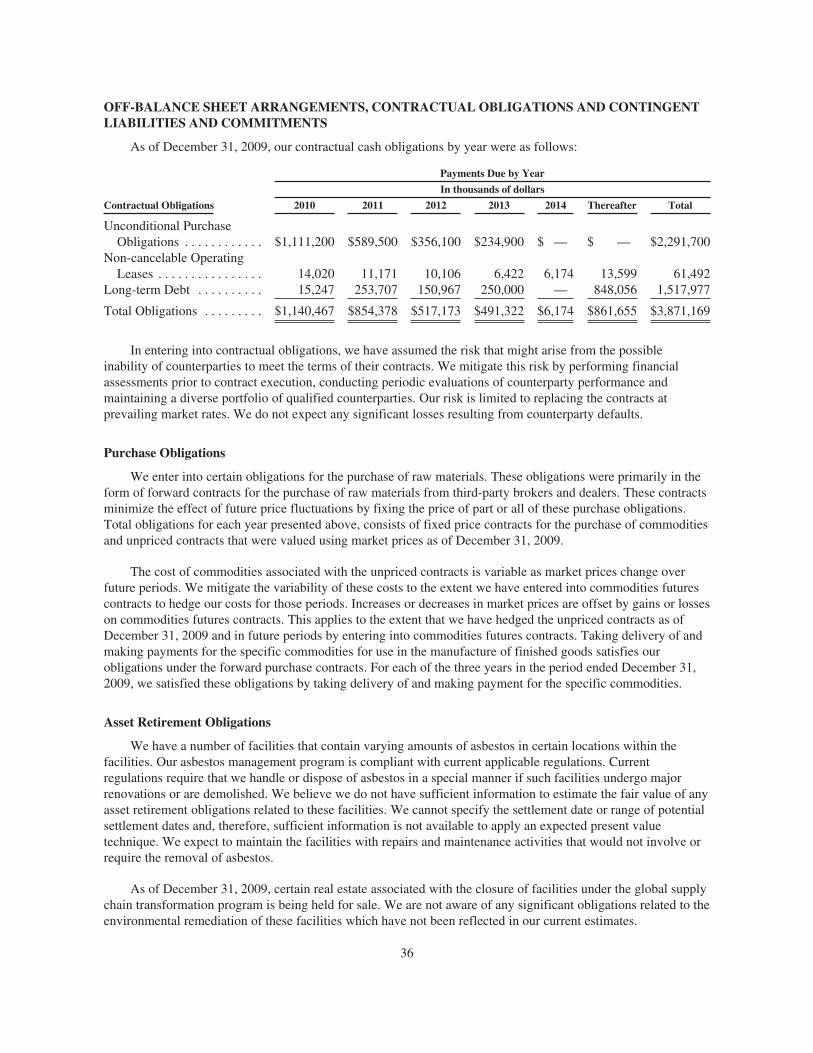
OFF-BALANCE SHEET ARRANGEMENTS, CONTRACTUAL OBLIGATIONS AND CONTINGENTLIABILITIES AND COMMITMENTS
As of December 31, 2009, our contractual cash obligations by year were as follows:
Payments Due by Year
In thousands of dollars
Contractual Obligations 2010 2011 2012 2013 2014 Thereafter Total
Unconditional PurchaseObligations . . . . . . . . . . . . $1,111,200 $589,500 $356,100 $234,900 $ — $ — $2,291,700
Non-cancelable OperatingLeases . . . . . . . . . . . . . . . . 14,020 11,171 10,106 6,422 6,174 13,599 61,492
Long-term Debt . . . . . . . . . . 15,247 253,707 150,967 250,000 — 848,056 1,517,977
Total Obligations . . . . . . . . . $1,140,467 $854,378 $517,173 $491,322 $6,174 $861,655 $3,871,169
In entering into contractual obligations, we have assumed the risk that might arise from the possibleinability of counterparties to meet the terms of their contracts. We mitigate this risk by performing financialassessments prior to contract execution, conducting periodic evaluations of counterparty performance andmaintaining a diverse portfolio of qualified counterparties. Our risk is limited to replacing the contracts atprevailing market rates. We do not expect any significant losses resulting from counterparty defaults.
Purchase Obligations
We enter into certain obligations for the purchase of raw materials. These obligations were primarily in theform of forward contracts for the purchase of raw materials from third-party brokers and dealers. These contractsminimize the effect of future price fluctuations by fixing the price of part or all of these purchase obligations.Total obligations for each year presented above, consists of fixed price contracts for the purchase of commoditiesand unpriced contracts that were valued using market prices as of December 31, 2009.
The cost of commodities associated with the unpriced contracts is variable as market prices change overfuture periods. We mitigate the variability of these costs to the extent we have entered into commodities futurescontracts to hedge our costs for those periods. Increases or decreases in market prices are offset by gains or losseson commodities futures contracts. This applies to the extent that we have hedged the unpriced contracts as ofDecember 31, 2009 and in future periods by entering into commodities futures contracts. Taking delivery of andmaking payments for the specific commodities for use in the manufacture of finished goods satisfies ourobligations under the forward purchase contracts. For each of the three years in the period ended December 31,2009, we satisfied these obligations by taking delivery of and making payment for the specific commodities.
Asset Retirement Obligations
We have a number of facilities that contain varying amounts of asbestos in certain locations within thefacilities. Our asbestos management program is compliant with current applicable regulations. Currentregulations require that we handle or dispose of asbestos in a special manner if such facilities undergo majorrenovations or are demolished. We believe we do not have sufficient information to estimate the fair value of anyasset retirement obligations related to these facilities. We cannot specify the settlement date or range of potentialsettlement dates and, therefore, sufficient information is not available to apply an expected present valuetechnique. We expect to maintain the facilities with repairs and maintenance activities that would not involve orrequire the removal of asbestos.
As of December 31, 2009, certain real estate associated with the closure of facilities under the global supplychain transformation program is being held for sale. We are not aware of any significant obligations related to theenvironmental remediation of these facilities which have not been reflected in our current estimates.
36
Income Tax Obligations
We base our deferred income taxes, accrued income taxes and provision for income taxes upon income,statutory tax rates, the legal structure of our Company and interpretation of tax laws. We are regularly audited byfederal, state and foreign tax authorities. From time to time, these audits result in assessments of additional tax.We maintain reserves for such assessments. We adjust the reserves based upon changing facts and circumstances,such as receiving audit assessments or clearing of an item for which a reserve has been established. Assessmentsof additional tax require cash payments. We are not aware of any significant income tax assessments. Theamount of tax obligations is not included in the table of contractual cash obligations by year on page 36 becausewe are unable to reasonably predict the ultimate amount or timing of settlement of our reserves for income taxes.
ACCOUNTING POLICIES AND MARKET RISKS ASSOCIATED WITH DERIVATIVEINSTRUMENTS
We use certain derivative instruments, from time to time, including interest rate swaps, foreign currencyforward exchange contracts and options, and commodities futures and options contracts, to manage interest rate,foreign currency exchange rate and commodity market price risk exposures, respectively. We enter into interestrate swap agreements and foreign exchange forward contracts and options for periods consistent with relatedunderlying exposures. These derivative instruments do not constitute positions independent of those exposures.We enter into commodities futures and options contracts for varying periods. These futures and options contractsare intended to be, and are effective as hedges of market price risks associated with anticipated raw materialpurchases, energy requirements and transportation costs. We do not hold or issue derivative instruments fortrading purposes and are not a party to any instruments with leverage or prepayment features. In entering intothese contracts, we have assumed the risk that might arise from the possible inability of counterparties to meetthe terms of their contracts. We mitigate this risk by performing financial assessments prior to contractexecution, conducting periodic evaluations of counterparty performance and maintaining a diverse portfolio ofqualified counterparties. We do not expect any significant losses from counterparty defaults.
Accounting Policies Associated with Derivative Instruments
We report the effective portion of the gain or loss on a derivative instrument designated and qualifying as acash flow hedging instrument as a component of other comprehensive income. We reclassify the effectiveportion of the gain or loss on these derivative instruments into income in the same period or periods during whichthe hedged transaction affects earnings. The remaining gain or loss on the derivative instrument resulting fromhedge ineffectiveness, if any, must be recognized currently in earnings.
Fair value hedges pertain to derivative instruments that qualify as a hedge of exposures to changes in the fairvalue of a firm commitment or assets and liabilities recognized on the balance sheet. For fair value hedges, ourpolicy is to record the gain or loss on the derivative instrument in earnings in the period of change together withthe offsetting loss or gain on the hedged item. The effect of that accounting is to reflect in earnings the extent towhich the hedge is not effective in achieving offsetting changes in fair value.
As of December 31, 2009, we designated and accounted for all derivative instruments, including foreignexchange forward contracts and options and commodities futures and options contracts, as cash flow hedges.Additional information regarding accounting policies associated with derivative instruments is contained in Note6, Derivative Instruments and Hedging Activities.
The information below summarizes our market risks associated with long-term debt and derivativeinstruments outstanding as of December 31, 2009. Note 1, Note 6 and Note 7 to the Consolidated FinancialStatements provide additional information.
37
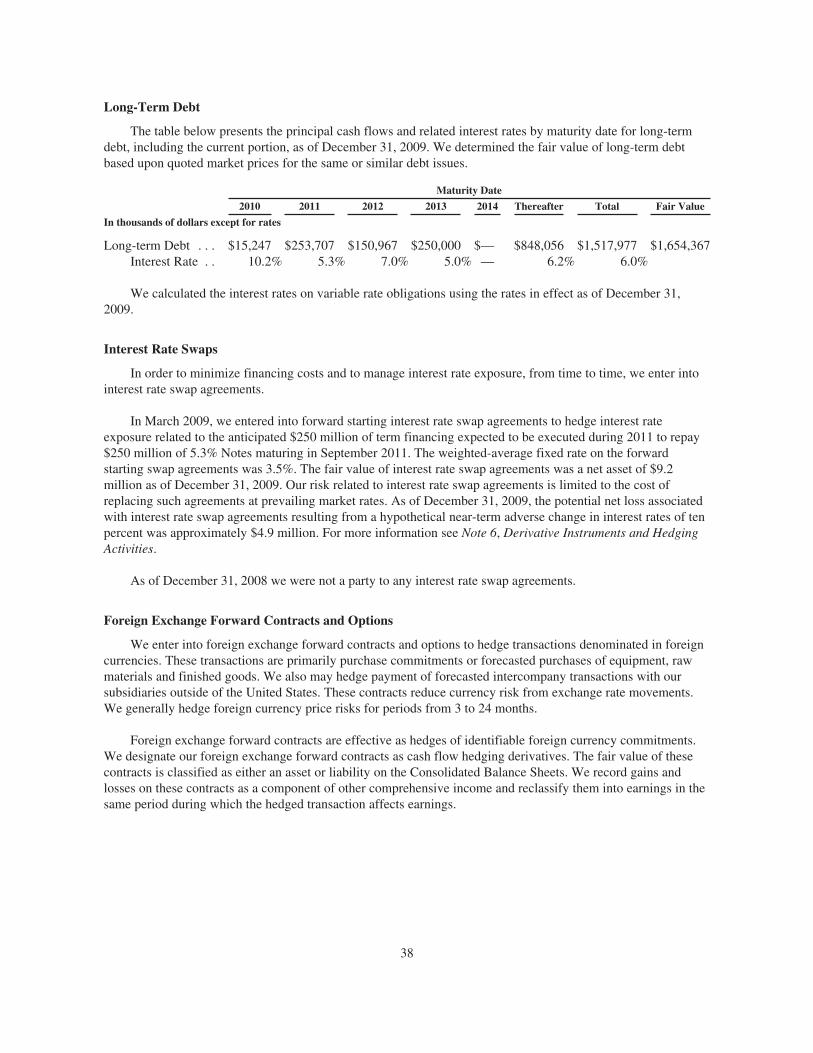
Long-Term Debt
The table below presents the principal cash flows and related interest rates by maturity date for long-termdebt, including the current portion, as of December 31, 2009. We determined the fair value of long-term debtbased upon quoted market prices for the same or similar debt issues.
Maturity Date
2010 2011 2012 2013 2014 Thereafter Total Fair Value
In thousands of dollars except for rates
Long-term Debt . . . $15,247 $253,707 $150,967 $250,000 $— $848,056 $1,517,977 $1,654,367Interest Rate . . 10.2% 5.3% 7.0% 5.0% — 6.2% 6.0%
We calculated the interest rates on variable rate obligations using the rates in effect as of December 31,2009.
Interest Rate Swaps
In order to minimize financing costs and to manage interest rate exposure, from time to time, we enter intointerest rate swap agreements.
In March 2009, we entered into forward starting interest rate swap agreements to hedge interest rateexposure related to the anticipated $250 million of term financing expected to be executed during 2011 to repay$250 million of 5.3% Notes maturing in September 2011. The weighted-average fixed rate on the forwardstarting swap agreements was 3.5%. The fair value of interest rate swap agreements was a net asset of $9.2million as of December 31, 2009. Our risk related to interest rate swap agreements is limited to the cost ofreplacing such agreements at prevailing market rates. As of December 31, 2009, the potential net loss associatedwith interest rate swap agreements resulting from a hypothetical near-term adverse change in interest rates of tenpercent was approximately $4.9 million. For more information see Note 6, Derivative Instruments and HedgingActivities.
As of December 31, 2008 we were not a party to any interest rate swap agreements.
Foreign Exchange Forward Contracts and Options
We enter into foreign exchange forward contracts and options to hedge transactions denominated in foreigncurrencies. These transactions are primarily purchase commitments or forecasted purchases of equipment, rawmaterials and finished goods. We also may hedge payment of forecasted intercompany transactions with oursubsidiaries outside of the United States. These contracts reduce currency risk from exchange rate movements.We generally hedge foreign currency price risks for periods from 3 to 24 months.
Foreign exchange forward contracts are effective as hedges of identifiable foreign currency commitments.We designate our foreign exchange forward contracts as cash flow hedging derivatives. The fair value of thesecontracts is classified as either an asset or liability on the Consolidated Balance Sheets. We record gains andlosses on these contracts as a component of other comprehensive income and reclassify them into earnings in thesame period during which the hedged transaction affects earnings.
38
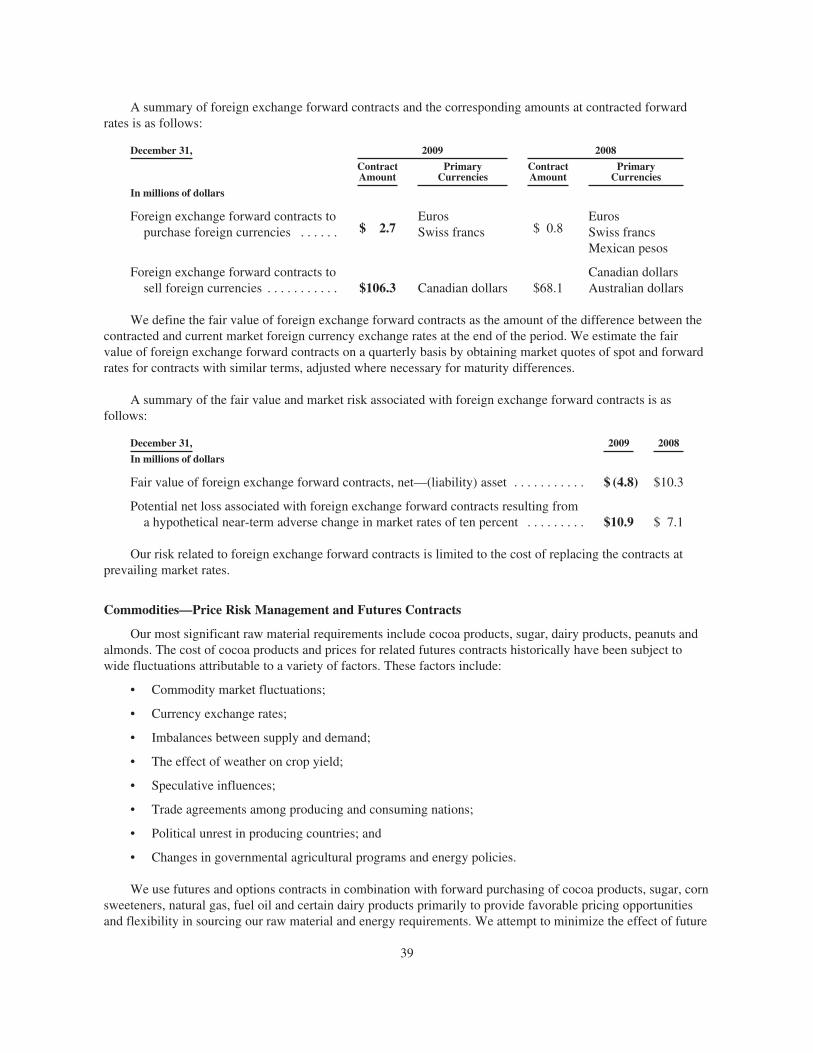
A summary of foreign exchange forward contracts and the corresponding amounts at contracted forwardrates is as follows:
December 31, 2009 2008
ContractAmount
PrimaryCurrencies
ContractAmount
PrimaryCurrencies
In millions of dollars
Foreign exchange forward contracts topurchase foreign currencies . . . . . . $ 2.7
EurosSwiss francs $ 0.8
EurosSwiss francsMexican pesos
Foreign exchange forward contracts tosell foreign currencies . . . . . . . . . . . $106.3 Canadian dollars $68.1
Canadian dollarsAustralian dollars
We define the fair value of foreign exchange forward contracts as the amount of the difference between thecontracted and current market foreign currency exchange rates at the end of the period. We estimate the fairvalue of foreign exchange forward contracts on a quarterly basis by obtaining market quotes of spot and forwardrates for contracts with similar terms, adjusted where necessary for maturity differences.
A summary of the fair value and market risk associated with foreign exchange forward contracts is asfollows:
December 31, 2009 2008
In millions of dollars
Fair value of foreign exchange forward contracts, net—(liability) asset . . . . . . . . . . . $ (4.8) $10.3
Potential net loss associated with foreign exchange forward contracts resulting froma hypothetical near-term adverse change in market rates of ten percent . . . . . . . . . $10.9 $ 7.1
Our risk related to foreign exchange forward contracts is limited to the cost of replacing the contracts atprevailing market rates.
Commodities—Price Risk Management and Futures Contracts
Our most significant raw material requirements include cocoa products, sugar, dairy products, peanuts andalmonds. The cost of cocoa products and prices for related futures contracts historically have been subject towide fluctuations attributable to a variety of factors. These factors include:
• Commodity market fluctuations;
• Currency exchange rates;
• Imbalances between supply and demand;
• The effect of weather on crop yield;
• Speculative influences;
• Trade agreements among producing and consuming nations;
• Political unrest in producing countries; and
• Changes in governmental agricultural programs and energy policies.
We use futures and options contracts in combination with forward purchasing of cocoa products, sugar, cornsweeteners, natural gas, fuel oil and certain dairy products primarily to provide favorable pricing opportunitiesand flexibility in sourcing our raw material and energy requirements. We attempt to minimize the effect of future
39
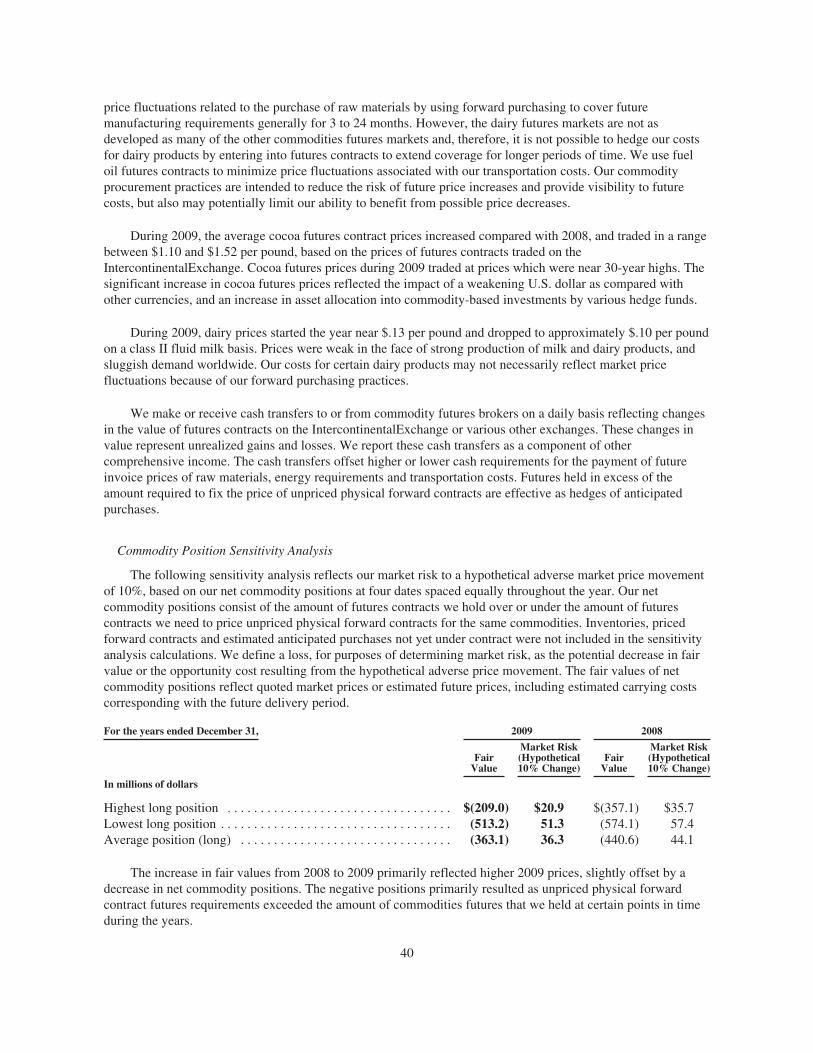
price fluctuations related to the purchase of raw materials by using forward purchasing to cover futuremanufacturing requirements generally for 3 to 24 months. However, the dairy futures markets are not asdeveloped as many of the other commodities futures markets and, therefore, it is not possible to hedge our costsfor dairy products by entering into futures contracts to extend coverage for longer periods of time. We use fueloil futures contracts to minimize price fluctuations associated with our transportation costs. Our commodityprocurement practices are intended to reduce the risk of future price increases and provide visibility to futurecosts, but also may potentially limit our ability to benefit from possible price decreases.
During 2009, the average cocoa futures contract prices increased compared with 2008, and traded in a rangebetween $1.10 and $1.52 per pound, based on the prices of futures contracts traded on theIntercontinentalExchange. Cocoa futures prices during 2009 traded at prices which were near 30-year highs. Thesignificant increase in cocoa futures prices reflected the impact of a weakening U.S. dollar as compared withother currencies, and an increase in asset allocation into commodity-based investments by various hedge funds.
During 2009, dairy prices started the year near $.13 per pound and dropped to approximately $.10 per poundon a class II fluid milk basis. Prices were weak in the face of strong production of milk and dairy products, andsluggish demand worldwide. Our costs for certain dairy products may not necessarily reflect market pricefluctuations because of our forward purchasing practices.
We make or receive cash transfers to or from commodity futures brokers on a daily basis reflecting changesin the value of futures contracts on the IntercontinentalExchange or various other exchanges. These changes invalue represent unrealized gains and losses. We report these cash transfers as a component of othercomprehensive income. The cash transfers offset higher or lower cash requirements for the payment of futureinvoice prices of raw materials, energy requirements and transportation costs. Futures held in excess of theamount required to fix the price of unpriced physical forward contracts are effective as hedges of anticipatedpurchases.
Commodity Position Sensitivity Analysis
The following sensitivity analysis reflects our market risk to a hypothetical adverse market price movementof 10%, based on our net commodity positions at four dates spaced equally throughout the year. Our netcommodity positions consist of the amount of futures contracts we hold over or under the amount of futurescontracts we need to price unpriced physical forward contracts for the same commodities. Inventories, pricedforward contracts and estimated anticipated purchases not yet under contract were not included in the sensitivityanalysis calculations. We define a loss, for purposes of determining market risk, as the potential decrease in fairvalue or the opportunity cost resulting from the hypothetical adverse price movement. The fair values of netcommodity positions reflect quoted market prices or estimated future prices, including estimated carrying costscorresponding with the future delivery period.
For the years ended December 31, 2009 2008
FairValue
Market Risk(Hypothetical10% Change)
FairValue
Market Risk(Hypothetical10% Change)
In millions of dollars
Highest long position . . . . . . . . . . . . . . . . . . . . . . . . . . . . . . . . . . $(209.0) $20.9 $(357.1) $35.7Lowest long position . . . . . . . . . . . . . . . . . . . . . . . . . . . . . . . . . . . (513.2) 51.3 (574.1) 57.4Average position (long) . . . . . . . . . . . . . . . . . . . . . . . . . . . . . . . . (363.1) 36.3 (440.6) 44.1
The increase in fair values from 2008 to 2009 primarily reflected higher 2009 prices, slightly offset by adecrease in net commodity positions. The negative positions primarily resulted as unpriced physical forwardcontract futures requirements exceeded the amount of commodities futures that we held at certain points in timeduring the years.
40
USE OF ESTIMATES AND OTHER CRITICAL ACCOUNTING POLICIES
Our consolidated financial statements are prepared in accordance with GAAP. In various instances, GAAPrequires management to make estimates, judgments and assumptions that affect the amounts reported in theconsolidated financial statements and accompanying notes. We believe that our most critical accounting policiesand estimates relate to the following:
• Accounts Receivable—Trade
• Accrued Liabilities
• Pension and Other Post-Retirement Benefits Plans
• Goodwill and Other Intangible Assets
• Commodities Futures Contracts
Management has discussed the development, selection and disclosure of critical accounting policies andestimates with the Audit Committee of our Board of Directors. While we base estimates and assumptions on ourknowledge of current events and actions we may undertake in the future, actual results may ultimately differfrom these estimates and assumptions. We discuss our significant accounting policies in Note 1, Summary ofSignificant Accounting Policies.
Accounts Receivable—Trade
In the normal course of business, we extend credit to customers that satisfy pre-defined credit criteria basedupon the results of our recurring financial account reviews and our evaluation of the current and projectedeconomic conditions. Our primary concentration of credit risk is associated with McLane Company, Inc., one ofthe largest wholesale distributors in the United States to convenience stores, drug stores, wholesale clubs andmass merchandisers. McLane Company, Inc. accounted for approximately 22.5% of our total accounts receivableas of December 31, 2009. As of December 31, 2009, no other customer accounted for more than 10% of our totalaccounts receivable. We believe that we have little concentration of credit risk associated with the remainder ofour customer base.
Accounts Receivable—Trade, as shown on the Consolidated Balance Sheets, were net of allowances andanticipated discounts. An allowance for doubtful accounts is determined through analysis of the following:
• Aging of accounts receivable at the date of the financial statements;
• Assessments of collectability based on historical trends; and
• Evaluation of the impact of current and projected economic conditions.
We monitor the collectability of our accounts receivable on an ongoing basis by analyzing aged accountsreceivable, assessing the credit worthiness of our customers and evaluating the impact of reasonably likelychanges in economic conditions that may impact credit risks. Estimates with regard to the collectability ofaccounts receivable are reasonably likely to change in the future.
Information on our Accounts Receivable—Trade, related expenses and assumptions is as follows:
For the three-year period 2007-2009
In millions of dollars, except percents
Average expense for potential uncollectible accounts . . . . . . . . . . . . . . . . . . . . . . . . . . . . . . . . . . . . . . . $1.7Average write-offs of uncollectible accounts . . . . . . . . . . . . . . . . . . . . . . . . . . . . . . . . . . . . . . . . . . . . . . $1.6Allowance for doubtful accounts as a percentage of gross accounts receivable . . . . . . . . . . . . . . . . . . . . 1%-2%
• We recognize the provision for uncollectible accounts as selling, marketing and administrative expensein the Consolidated Statements of Income.
41
• If we made reasonably possible near-term changes in the most material assumptions regardingcollectability of accounts receivable, our annual provision could change within the following range:
• A reduction in expense of approximately $4.9 million; and
• An increase in expense of approximately $3.7 million.
• Changes in estimates for future uncollectible accounts receivable would not have a material impact onour liquidity or capital resources.
Accrued Liabilities
Accrued liabilities requiring the most difficult or subjective judgments include liabilities associated withmarketing promotion programs and potentially unsaleable products.
Liabilities associated with marketing promotion programs
We recognize the costs of marketing promotion programs as a reduction to net sales along with acorresponding accrued liability based on estimates at the time of revenue recognition.
Information on our promotional costs and assumptions is as follows:
For the years ended December 31, 2009 2008 2007
In millions of dollars
Promotional costs . . . . . . . . . . . . . . . . . . . . . . . . . . . . . . . . . . . . . . . . . . . . . . . . . . . . . . $721.5 $766.6 $702.1
• We determine the amount of the accrued liability by:
• Analysis of programs offered;
• Historical trends;
• Expectations regarding customer and consumer participation;
• Sales and payment trends; and
• Experience with payment patterns associated with similar, previously offered programs.
• The estimated costs of these programs are reasonably likely to change in the future due to changes intrends with regard to customer and consumer participation, particularly for new programs and forprograms related to the introduction of new products.
• Reasonably possible near-term changes in the most material assumptions regarding the cost ofpromotional programs could result in changes within the following range:
• A reduction in costs of approximately $13.1 million; and
• An increase in costs of approximately $5.6 million.
• Changes in these assumptions would affect net sales and income before income taxes.
• Over the three-year period ended December 31, 2009, actual promotion costs have not deviated from theestimated amounts by more than 2%.
• Changes in estimates related to the cost of promotional programs would not have a material impact onour liquidity or capital resources.
Liabilities associated with potentially unsaleable products
• At the time of sale, we estimate a cost for the possibility that products will become aged or unsaleable inthe future. The estimated cost is included as a reduction to net sales.
• A related accrued liability is determined using statistical analysis that incorporates historical salestrends, seasonal timing and sales patterns, and product movement at retail.
42
• Estimates for costs associated with unsaleable products may change as a result of inventory levels in thedistribution channel, current economic trends, changes in consumer demand, the introduction of newproducts and changes in trends of seasonal sales in response to promotional programs.
• Over the three-year period ended December 31, 2009, costs associated with aged or unsaleable productshave amounted to approximately 2% of gross sales.
• Reasonably possible near-term changes in the most material assumptions regarding the estimates of suchcosts would have increased or decreased net sales and income before income taxes in a range from $1.0million to $2.0 million.
• Over the three-year period ended December 31, 2009, actual costs have not deviated from our estimatesby more than approximately 1%.
• Reasonably possible near-term changes in the estimates of costs associated with unsaleable productswould not have a material impact on our liquidity or capital resources.
Pension and Other Post-Retirement Benefits Plans
Overview
We sponsor a number of defined benefit pension plans. The primary plans are The Hershey CompanyRetirement Plan and The Hershey Company Retirement Plan for Hourly Employees. These are cash balanceplans that provide pension benefits for most domestic employees hired prior to January 1, 2007. We monitorlegislative and regulatory developments regarding cash balance plans, as well as recent court cases, for anyimpact on our plans. We also sponsor 2 primary post-retirement benefit plans. The health care plan iscontributory, with participants’ contributions adjusted annually, and the life insurance plan is non-contributory.
We fund domestic pension liabilities in accordance with the limits imposed by the Employee RetirementIncome Security Act of 1974 and federal income tax laws. Beginning January 1, 2008, we complied with thefunding requirements of the Pension Protection Act of 2006. We fund non-domestic pension liabilities inaccordance with laws and regulations applicable to those plans. We broadly diversify our pension plan assets,consisting primarily of domestic and international common stocks and fixed income securities. Short-term andlong-term liabilities associated with benefit plans are primarily determined based on actuarial calculations. Thesecalculations consider payroll and employee data, including age and years of service, along with actuarialassumptions at the date of the financial statements. We take into consideration long-term projections with regardto economic conditions, including interest rates, return on assets and the rate of increase in compensation levels.With regard to liabilities associated with post-retirement benefit plans that provide health care and life insurance,we take into consideration the long-term annual rate of increase in the per capita cost of the covered benefits. Wereview the discount rate assumptions and may revise them annually. The expected long-term rate of return onassets assumption (“asset return assumption”) for funded plans is of a longer duration and revised only whenlong-term asset return projections demonstrate that need.
An employer that is a business entity and sponsors one or more single-employer defined benefit plans isrequired to:
• Recognize the funded status of a benefit plan—measured as the difference between plan assets at fairvalue and the benefit obligation—in its statement of financial position. For a pension plan, the benefitobligation is the projected benefit obligation; for any other post-retirement benefit plan, such as a retireehealth care plan, the benefit obligation is the accumulated post-retirement benefit obligation.
• Recognize as a component of other comprehensive income, net of tax, the gains or losses and priorservice costs or credits that arise during the period but are not recognized as components of net periodicbenefit cost.
43
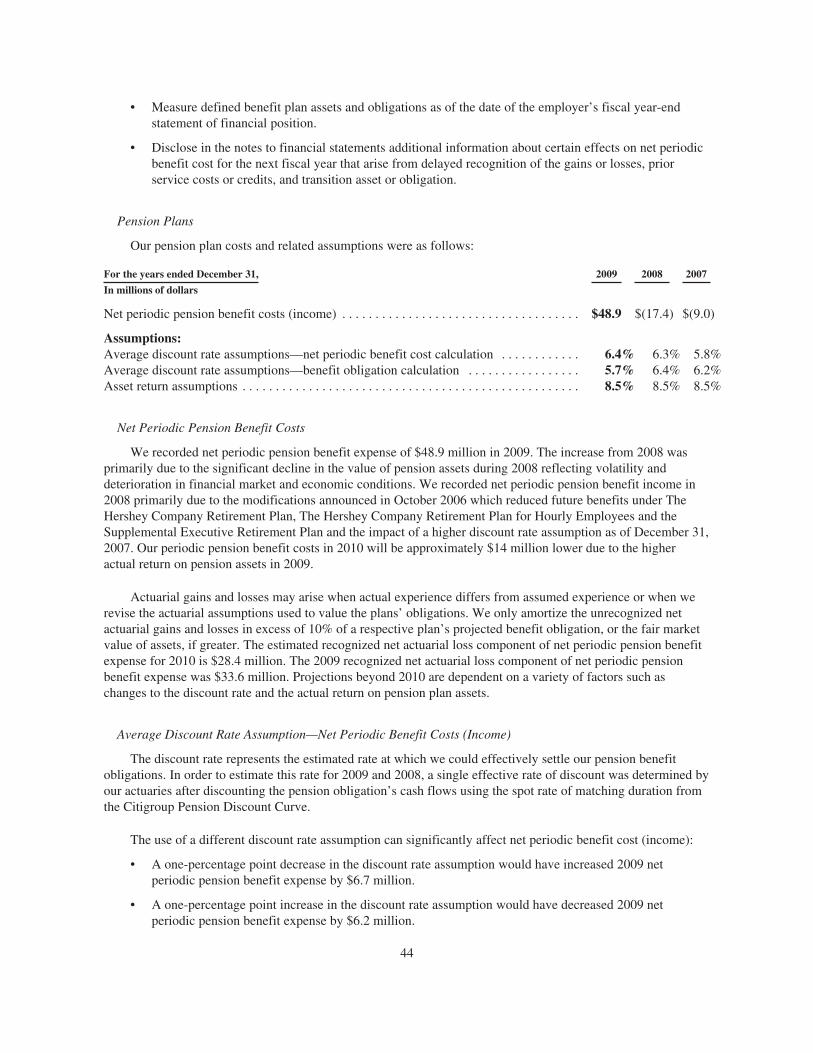
• Measure defined benefit plan assets and obligations as of the date of the employer’s fiscal year-endstatement of financial position.
• Disclose in the notes to financial statements additional information about certain effects on net periodicbenefit cost for the next fiscal year that arise from delayed recognition of the gains or losses, priorservice costs or credits, and transition asset or obligation.
Pension Plans
Our pension plan costs and related assumptions were as follows:
For the years ended December 31, 2009 2008 2007
In millions of dollars
Net periodic pension benefit costs (income) . . . . . . . . . . . . . . . . . . . . . . . . . . . . . . . . . . . . $48.9 $(17.4) $(9.0)
Assumptions:Average discount rate assumptions—net periodic benefit cost calculation . . . . . . . . . . . . 6.4% 6.3% 5.8%Average discount rate assumptions—benefit obligation calculation . . . . . . . . . . . . . . . . . 5.7% 6.4% 6.2%Asset return assumptions . . . . . . . . . . . . . . . . . . . . . . . . . . . . . . . . . . . . . . . . . . . . . . . . . . . 8.5% 8.5% 8.5%
Net Periodic Pension Benefit Costs
We recorded net periodic pension benefit expense of $48.9 million in 2009. The increase from 2008 wasprimarily due to the significant decline in the value of pension assets during 2008 reflecting volatility anddeterioration in financial market and economic conditions. We recorded net periodic pension benefit income in2008 primarily due to the modifications announced in October 2006 which reduced future benefits under TheHershey Company Retirement Plan, The Hershey Company Retirement Plan for Hourly Employees and theSupplemental Executive Retirement Plan and the impact of a higher discount rate assumption as of December 31,2007. Our periodic pension benefit costs in 2010 will be approximately $14 million lower due to the higheractual return on pension assets in 2009.
Actuarial gains and losses may arise when actual experience differs from assumed experience or when werevise the actuarial assumptions used to value the plans’ obligations. We only amortize the unrecognized netactuarial gains and losses in excess of 10% of a respective plan’s projected benefit obligation, or the fair marketvalue of assets, if greater. The estimated recognized net actuarial loss component of net periodic pension benefitexpense for 2010 is $28.4 million. The 2009 recognized net actuarial loss component of net periodic pensionbenefit expense was $33.6 million. Projections beyond 2010 are dependent on a variety of factors such aschanges to the discount rate and the actual return on pension plan assets.
Average Discount Rate Assumption—Net Periodic Benefit Costs (Income)
The discount rate represents the estimated rate at which we could effectively settle our pension benefitobligations. In order to estimate this rate for 2009 and 2008, a single effective rate of discount was determined byour actuaries after discounting the pension obligation’s cash flows using the spot rate of matching duration fromthe Citigroup Pension Discount Curve.
The use of a different discount rate assumption can significantly affect net periodic benefit cost (income):
• A one-percentage point decrease in the discount rate assumption would have increased 2009 netperiodic pension benefit expense by $6.7 million.
• A one-percentage point increase in the discount rate assumption would have decreased 2009 netperiodic pension benefit expense by $6.2 million.
44
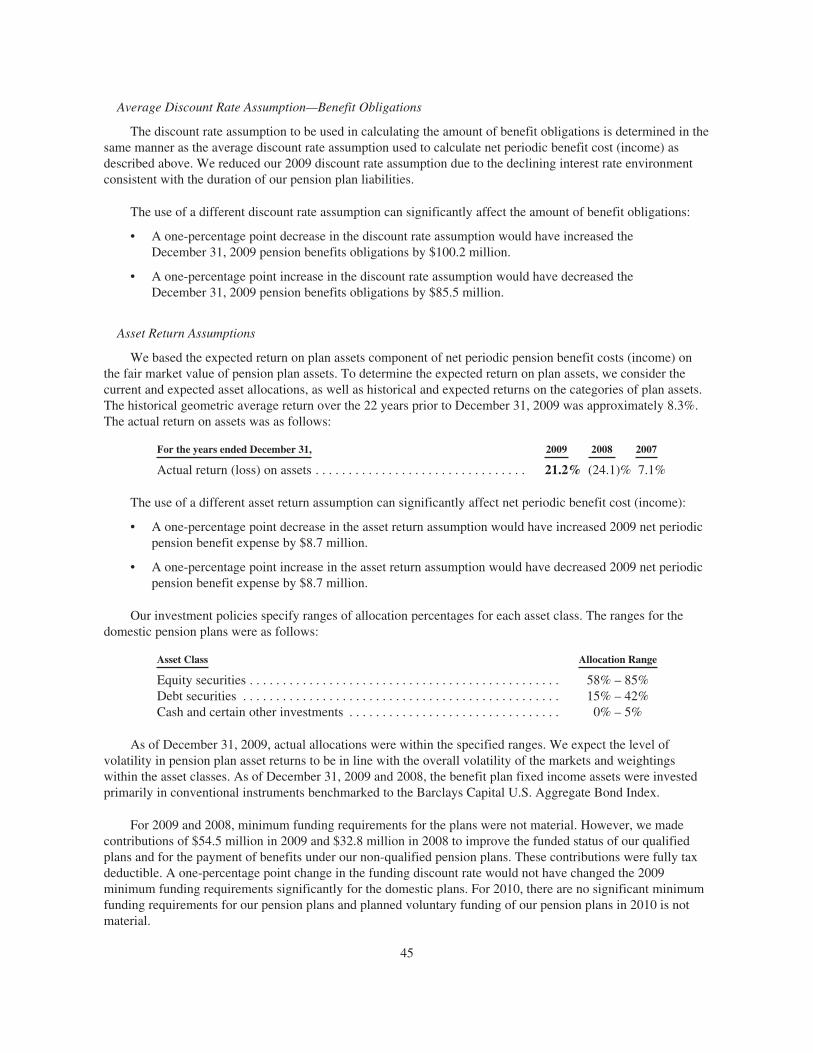
Average Discount Rate Assumption—Benefit Obligations
The discount rate assumption to be used in calculating the amount of benefit obligations is determined in thesame manner as the average discount rate assumption used to calculate net periodic benefit cost (income) asdescribed above. We reduced our 2009 discount rate assumption due to the declining interest rate environmentconsistent with the duration of our pension plan liabilities.
The use of a different discount rate assumption can significantly affect the amount of benefit obligations:
• A one-percentage point decrease in the discount rate assumption would have increased theDecember 31, 2009 pension benefits obligations by $100.2 million.
• A one-percentage point increase in the discount rate assumption would have decreased theDecember 31, 2009 pension benefits obligations by $85.5 million.
Asset Return Assumptions
We based the expected return on plan assets component of net periodic pension benefit costs (income) onthe fair market value of pension plan assets. To determine the expected return on plan assets, we consider thecurrent and expected asset allocations, as well as historical and expected returns on the categories of plan assets.The historical geometric average return over the 22 years prior to December 31, 2009 was approximately 8.3%.The actual return on assets was as follows:
For the years ended December 31, 2009 2008 2007
Actual return (loss) on assets . . . . . . . . . . . . . . . . . . . . . . . . . . . . . . . . 21.2% (24.1)% 7.1%
The use of a different asset return assumption can significantly affect net periodic benefit cost (income):
• A one-percentage point decrease in the asset return assumption would have increased 2009 net periodicpension benefit expense by $8.7 million.
• A one-percentage point increase in the asset return assumption would have decreased 2009 net periodicpension benefit expense by $8.7 million.
Our investment policies specify ranges of allocation percentages for each asset class. The ranges for thedomestic pension plans were as follows:
Asset Class Allocation Range
Equity securities . . . . . . . . . . . . . . . . . . . . . . . . . . . . . . . . . . . . . . . . . . . . . . . 58% – 85%Debt securities . . . . . . . . . . . . . . . . . . . . . . . . . . . . . . . . . . . . . . . . . . . . . . . . 15% – 42%Cash and certain other investments . . . . . . . . . . . . . . . . . . . . . . . . . . . . . . . . 0% – 5%
As of December 31, 2009, actual allocations were within the specified ranges. We expect the level ofvolatility in pension plan asset returns to be in line with the overall volatility of the markets and weightingswithin the asset classes. As of December 31, 2009 and 2008, the benefit plan fixed income assets were investedprimarily in conventional instruments benchmarked to the Barclays Capital U.S. Aggregate Bond Index.
For 2009 and 2008, minimum funding requirements for the plans were not material. However, we madecontributions of $54.5 million in 2009 and $32.8 million in 2008 to improve the funded status of our qualifiedplans and for the payment of benefits under our non-qualified pension plans. These contributions were fully taxdeductible. A one-percentage point change in the funding discount rate would not have changed the 2009minimum funding requirements significantly for the domestic plans. For 2010, there are no significant minimumfunding requirements for our pension plans and planned voluntary funding of our pension plans in 2010 is notmaterial.
45
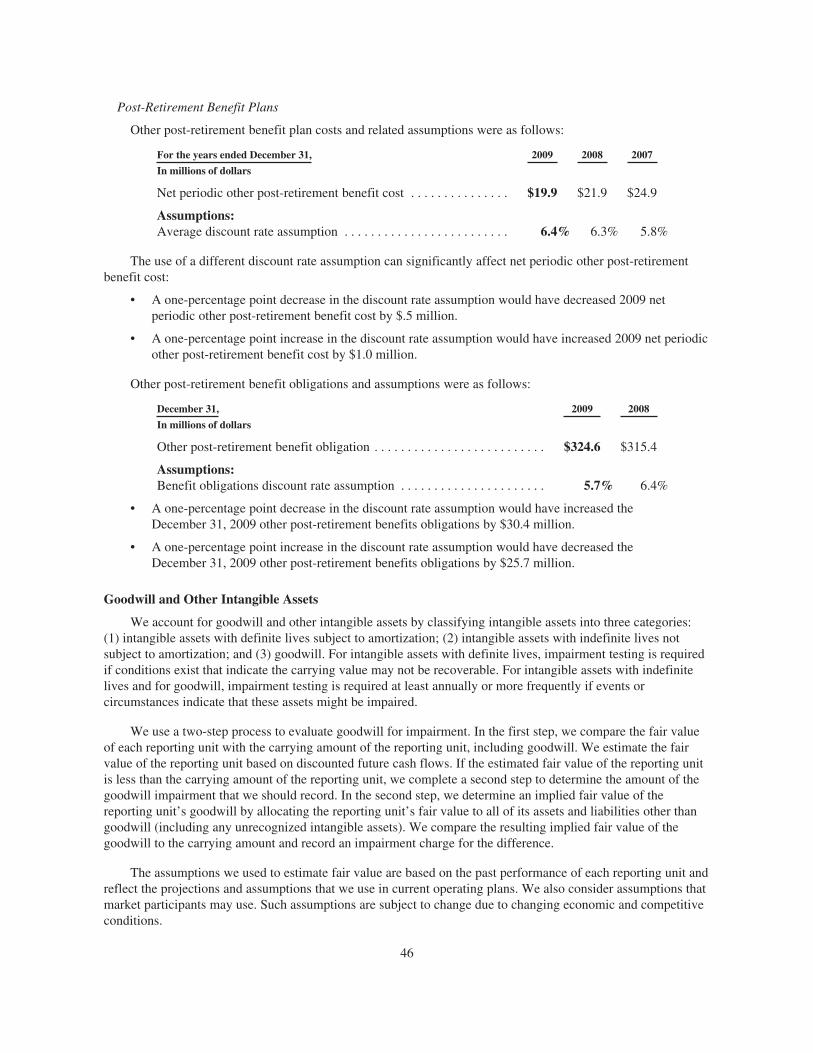
Post-Retirement Benefit Plans
Other post-retirement benefit plan costs and related assumptions were as follows:
For the years ended December 31, 2009 2008 2007
In millions of dollars
Net periodic other post-retirement benefit cost . . . . . . . . . . . . . . . $19.9 $21.9 $24.9
Assumptions:Average discount rate assumption . . . . . . . . . . . . . . . . . . . . . . . . . 6.4% 6.3% 5.8%
The use of a different discount rate assumption can significantly affect net periodic other post-retirementbenefit cost:
• A one-percentage point decrease in the discount rate assumption would have decreased 2009 netperiodic other post-retirement benefit cost by $.5 million.
• A one-percentage point increase in the discount rate assumption would have increased 2009 net periodicother post-retirement benefit cost by $1.0 million.
Other post-retirement benefit obligations and assumptions were as follows:
December 31, 2009 2008
In millions of dollars
Other post-retirement benefit obligation . . . . . . . . . . . . . . . . . . . . . . . . . . $324.6 $315.4
Assumptions:Benefit obligations discount rate assumption . . . . . . . . . . . . . . . . . . . . . . 5.7% 6.4%
• A one-percentage point decrease in the discount rate assumption would have increased theDecember 31, 2009 other post-retirement benefits obligations by $30.4 million.
• A one-percentage point increase in the discount rate assumption would have decreased theDecember 31, 2009 other post-retirement benefits obligations by $25.7 million.
Goodwill and Other Intangible Assets
We account for goodwill and other intangible assets by classifying intangible assets into three categories:(1) intangible assets with definite lives subject to amortization; (2) intangible assets with indefinite lives notsubject to amortization; and (3) goodwill. For intangible assets with definite lives, impairment testing is requiredif conditions exist that indicate the carrying value may not be recoverable. For intangible assets with indefinitelives and for goodwill, impairment testing is required at least annually or more frequently if events orcircumstances indicate that these assets might be impaired.
We use a two-step process to evaluate goodwill for impairment. In the first step, we compare the fair valueof each reporting unit with the carrying amount of the reporting unit, including goodwill. We estimate the fairvalue of the reporting unit based on discounted future cash flows. If the estimated fair value of the reporting unitis less than the carrying amount of the reporting unit, we complete a second step to determine the amount of thegoodwill impairment that we should record. In the second step, we determine an implied fair value of thereporting unit’s goodwill by allocating the reporting unit’s fair value to all of its assets and liabilities other thangoodwill (including any unrecognized intangible assets). We compare the resulting implied fair value of thegoodwill to the carrying amount and record an impairment charge for the difference.
The assumptions we used to estimate fair value are based on the past performance of each reporting unit andreflect the projections and assumptions that we use in current operating plans. We also consider assumptions thatmarket participants may use. Such assumptions are subject to change due to changing economic and competitiveconditions.
46

We perform annual impairment tests of goodwill at the beginning of the fourth quarter of each year or whencircumstances arise that indicate a possible impairment might exist. We determined than none of our goodwillwas impaired as of December 31, 2009. The fair value of our Godrej Hershey Ltd. reporting unit exceeded itscarrying value by approximately 6%. As of December 31, 2009, the goodwill allocated to the reporting unit wasapproximately $79.6 million. The assumptions used to estimate fair value were based on the past performance ofthe reporting unit as well as the projections incorporated in our current operating plans. Significant assumptionsand estimates included in our current operating plans were associated with sales growth, profitability, and relatedcash flows, along with cash flows associated with taxes and capital spending. The discount rate used to estimatefair value was risk adjusted in consideration of the economic conditions of the reporting unit. We also consideredassumptions that market participants may use. By their nature, these projections and assumptions are uncertain.Potential events and circumstances that could have an adverse effect on our assumptions include theunavailability of raw or packaging materials or significant cost increases, pricing constraints and possibledisruptions to our supply chain. The fair values of our other reporting units were substantially in excess of theircarrying values.
Our other intangible assets consist primarily of customer-related intangible assets, patents and trademarksobtained through business acquisitions. We amortize customer-related intangible assets and patents over theirestimated useful lives. The useful lives of existing trademarks were determined to be indefinite and, therefore, wedo not amortize them. We evaluate our trademarks for impairment by comparing the carrying amount of theassets to their estimated fair value. The fair value of trademarks is calculated using a “relief from royaltypayments” methodology. This approach involves two steps. In the first step, we estimate reasonable royalty ratesfor each trademark. In the second step, we apply these royalty rates to a net sales stream and discount theresulting cash flows to determine fair value. This fair value is then compared with the carrying value of eachtrademark. If the estimated fair value is less than the carrying amount, we record an impairment charge to reducethe asset to its estimated fair value. The estimates of future cash flows are generally based on past performance ofthe brands and reflect net sales projections and assumptions for the brands that we use in current operating plans.We also consider assumptions that market participants may use. Such assumptions are subject to change due tochanging economic and competitive conditions.
We perform annual impairment tests of other intangible assets with indefinite lives at the beginning of thefourth quarter of each year or when circumstances arise that indicate a possible impairment might exist. Wedetermined that none of our other intangible assets was impaired as of December 31, 2009. In December 2008,we recorded total non-cash impairment charges of $45.7 million. We determined that the carrying amounts ofcertain trademarks, primarily the Mauna Loa brand, exceeded their estimated fair value due to reducedexpectations for future sales and cash flows compared with the valuations at the acquisition dates.
Commodities Futures and Options Contracts
We use futures and options contracts in combination with forward purchasing of cocoa products and othercommodities primarily to reduce the risk of future price increases, provide visibility to future costs and takeadvantage of market fluctuations. Additional information with regard to accounting policies associated withcommodities futures and options contracts and other derivative instruments is contained in Note 6, DerivativeInstruments and Hedging Activities.
Our gains (losses) on cash flow hedging derivatives were as follows:
For the years ended December 31, 2009 2008 2007
In millions of dollars
Net after-tax gains on cash flow hedging derivatives . . . . . . . . . . . . . . . . . . . $78.3 $ 11.5 $6.8Reclassification adjustments from accumulated other comprehensive loss to
income . . . . . . . . . . . . . . . . . . . . . . . . . . . . . . . . . . . . . . . . . . . . . . . . . . . . . 1.9 (34.1) .2Hedge ineffectiveness gains (losses) recognized in cost of sales, before
tax . . . . . . . . . . . . . . . . . . . . . . . . . . . . . . . . . . . . . . . . . . . . . . . . . . . . . . . . .2 (.1) (.5)
47
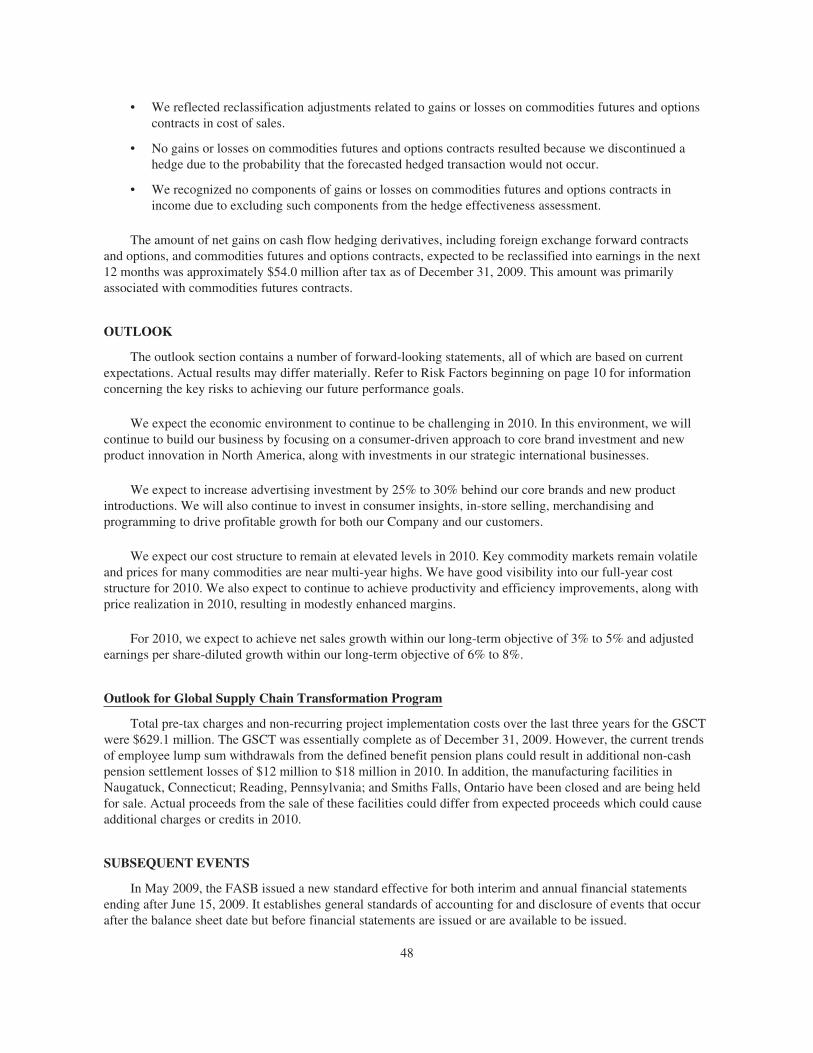
• We reflected reclassification adjustments related to gains or losses on commodities futures and optionscontracts in cost of sales.
• No gains or losses on commodities futures and options contracts resulted because we discontinued ahedge due to the probability that the forecasted hedged transaction would not occur.
• We recognized no components of gains or losses on commodities futures and options contracts inincome due to excluding such components from the hedge effectiveness assessment.
The amount of net gains on cash flow hedging derivatives, including foreign exchange forward contractsand options, and commodities futures and options contracts, expected to be reclassified into earnings in the next12 months was approximately $54.0 million after tax as of December 31, 2009. This amount was primarilyassociated with commodities futures contracts.
OUTLOOK
The outlook section contains a number of forward-looking statements, all of which are based on currentexpectations. Actual results may differ materially. Refer to Risk Factors beginning on page 10 for informationconcerning the key risks to achieving our future performance goals.
We expect the economic environment to continue to be challenging in 2010. In this environment, we willcontinue to build our business by focusing on a consumer-driven approach to core brand investment and newproduct innovation in North America, along with investments in our strategic international businesses.
We expect to increase advertising investment by 25% to 30% behind our core brands and new productintroductions. We will also continue to invest in consumer insights, in-store selling, merchandising andprogramming to drive profitable growth for both our Company and our customers.
We expect our cost structure to remain at elevated levels in 2010. Key commodity markets remain volatileand prices for many commodities are near multi-year highs. We have good visibility into our full-year coststructure for 2010. We also expect to continue to achieve productivity and efficiency improvements, along withprice realization in 2010, resulting in modestly enhanced margins.
For 2010, we expect to achieve net sales growth within our long-term objective of 3% to 5% and adjustedearnings per share-diluted growth within our long-term objective of 6% to 8%.
Outlook for Global Supply Chain Transformation Program
Total pre-tax charges and non-recurring project implementation costs over the last three years for the GSCTwere $629.1 million. The GSCT was essentially complete as of December 31, 2009. However, the current trendsof employee lump sum withdrawals from the defined benefit pension plans could result in additional non-cashpension settlement losses of $12 million to $18 million in 2010. In addition, the manufacturing facilities inNaugatuck, Connecticut; Reading, Pennsylvania; and Smiths Falls, Ontario have been closed and are being heldfor sale. Actual proceeds from the sale of these facilities could differ from expected proceeds which could causeadditional charges or credits in 2010.
SUBSEQUENT EVENTS
In May 2009, the FASB issued a new standard effective for both interim and annual financial statementsending after June 15, 2009. It establishes general standards of accounting for and disclosure of events that occurafter the balance sheet date but before financial statements are issued or are available to be issued.
48
We adopted this new standard as of July 5, 2009 and have evaluated all subsequent events through the dateand time our financial statements were issued. The adoption of this standard did not have a material impact onour financial accounting or reporting. No subsequent events occurred during this reporting period that requirerecognition or disclosure in this filing.
NEW ACCOUNTING PRONOUNCEMENTS
In June 2009, the FASB issued two Statements of Financial Accounting Standards: No. 166, Accounting forTransfers of Financial Assets—an amendment of FASB Statement No. 140 (“SFAS No. 166”) and No. 167,Amendments to FASB Interpretation No. 46(R) (“SFAS No. 167”).
SFAS No. 166 addresses how information should be provided about transfers of financial assets; the effectsof a transfer on a company’s financial position, performance and cash flows; and a transferor’s continuinginvolvement in transferred financial assets. SFAS No. 166 removes the concept of a qualifying special-purposeentity and modifies or eliminates certain other provisions related to transfers of financial assets. It alsoestablishes additional requirements, including a requirement for enhanced disclosures to provide financialstatement users with greater transparency.
SFAS No. 167 amends certain requirements of FASB Interpretation No. 46 (revised December 2003),Consolidation of Variable Interest Entities, to improve financial reporting by enterprises involved with variableinterest entities, and to provide more relevant and reliable information to users of financial statements.
Each of these statements has now been included in the FASB Codification. SFAS No. 166 is now Topic 860and SFAS No. 167 is now Topic 810. These standards are effective for us as of January 1, 2010; we believe therewill be no significant impact on our consolidated financial statements upon adoption of these new accountingstandards.
Item 7A. QUANTITATIVE AND QUALITATIVE DISCLOSURES ABOUT MARKET RISK
Required information about market risk is included in the section entitled “Accounting Policies and MarketRisks Associated with Derivative Instruments,” found on pages 37 through 40.
49
Item 8. FINANCIAL STATEMENTS AND SUPPLEMENTARY DATA
PAGE
INDEX TO CONSOLIDATED FINANCIAL STATEMENTS
Responsibility for Financial Statements . . . . . . . . . . . . . . . . . . . . . . . . . . . . . . . . . . . . . . . . . . . . . . . . . . . . 51
Report of Independent Registered Public Accounting Firm on Consolidated Financial Statements . . . . . . 52
Consolidated Statements of Income for the years ended December 31, 2009, 2008 and 2007 . . . . . . . . . . . 53
Consolidated Balance Sheets as of December 31, 2009 and 2008 . . . . . . . . . . . . . . . . . . . . . . . . . . . . . . . . . 54
Consolidated Statements of Cash Flows for the years ended December 31, 2009, 2008 and 2007 . . . . . . . 55
Consolidated Statements of Stockholders’ Equity for the years ended December 31, 2009, 2008 and2007 . . . . . . . . . . . . . . . . . . . . . . . . . . . . . . . . . . . . . . . . . . . . . . . . . . . . . . . . . . . . . . . . . . . . . . . . . . . . . . 56
Notes to Consolidated Financial Statements . . . . . . . . . . . . . . . . . . . . . . . . . . . . . . . . . . . . . . . . . . . . . . . . . 57
50

RESPONSIBILITY FOR FINANCIAL STATEMENTS
The Hershey Company is responsible for the financial statements and other financial information containedin this report. We believe that the financial statements have been prepared in conformity with U.S. generallyaccepted accounting principles appropriate under the circumstances to reflect in all material respects thesubstance of applicable events and transactions. In preparing the financial statements, it is necessary thatmanagement make informed estimates and judgments. The other financial information in this annual report isconsistent with the financial statements.
We maintain a system of internal accounting controls designed to provide reasonable assurance thatfinancial records are reliable for purposes of preparing financial statements and that assets are properly accountedfor and safeguarded. The concept of reasonable assurance is based on the recognition that the cost of the systemmust be related to the benefits to be derived. We believe our system provides an appropriate balance in thisregard. We maintain an Internal Audit Department which reviews the adequacy and tests the application ofinternal accounting controls.
The 2009, 2008 and 2007 financial statements have been audited by KPMG LLP, an independent registeredpublic accounting firm. KPMG LLP’s report on our financial statements is included on page 52.
The Audit Committee of the Board of Directors of the Company, consisting solely of independent,non-management directors, meets regularly with the independent auditors, internal auditors and management todiscuss, among other things, the audit scopes and results. KPMG LLP and the internal auditors both have full andfree access to the Audit Committee, with and without the presence of management.
David J. WestChief Executive Officer
Humberto P. AlfonsoChief Financial Officer
51
REPORT OF INDEPENDENT REGISTERED PUBLIC ACCOUNTING FIRM
The Board of Directors and StockholdersThe Hershey Company:
We have audited the accompanying consolidated balance sheets of The Hershey Company and subsidiaries(the “Company”) as of December 31, 2009 and 2008, and the related consolidated statements of income, cashflows and stockholders’ equity for each of the years in the three-year period ended December 31, 2009. Theseconsolidated financial statements are the responsibility of the Company’s management. Our responsibility is toexpress an opinion on these consolidated financial statements based on our audits.
We conducted our audits in accordance with the standards of the Public Company Accounting OversightBoard (United States). Those standards require that we plan and perform the audit to obtain reasonable assuranceabout whether the financial statements are free of material misstatement. An audit includes examining, on a testbasis, evidence supporting the amounts and disclosures in the financial statements. An audit also includesassessing the accounting principles used and significant estimates made by management, as well as evaluatingthe overall financial statement presentation. We believe that our audits provide a reasonable basis for ouropinion.
In our opinion, the consolidated financial statements referred to above present fairly, in all material respects,the financial position of The Hershey Company and subsidiaries as of December 31, 2009 and 2008, and theresults of their operations and their cash flows for each of the years in the three-year period ended December 31,2009, in conformity with U.S. generally accepted accounting principles.
We also have audited, in accordance with the standards of the Public Company Accounting Oversight Board(United States), the effectiveness of the Company’s internal control over financial reporting as of December 31,2009, based on criteria established in Internal Control-Integrated Framework issued by the Committee ofSponsoring Organizations of the Treadway Commission (COSO), and our report dated February 19, 2010expressed an unqualified opinion on the effectiveness of the Company’s internal control over financial reporting.
New York, New YorkFebruary 19, 2010
52
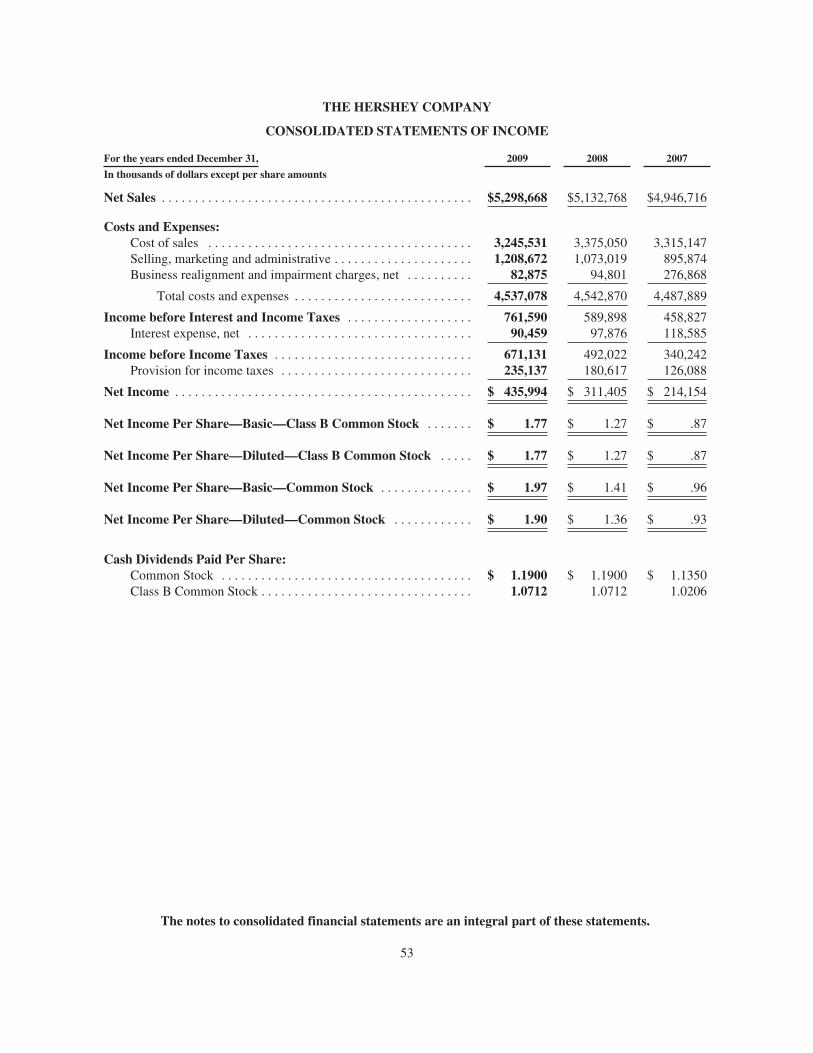
THE HERSHEY COMPANY
CONSOLIDATED STATEMENTS OF INCOME
For the years ended December 31, 2009 2008 2007
In thousands of dollars except per share amounts
Net Sales . . . . . . . . . . . . . . . . . . . . . . . . . . . . . . . . . . . . . . . . . . . . . . . $5,298,668 $5,132,768 $4,946,716
Costs and Expenses:Cost of sales . . . . . . . . . . . . . . . . . . . . . . . . . . . . . . . . . . . . . . . . 3,245,531 3,375,050 3,315,147Selling, marketing and administrative . . . . . . . . . . . . . . . . . . . . . 1,208,672 1,073,019 895,874Business realignment and impairment charges, net . . . . . . . . . . 82,875 94,801 276,868
Total costs and expenses . . . . . . . . . . . . . . . . . . . . . . . . . . . 4,537,078 4,542,870 4,487,889
Income before Interest and Income Taxes . . . . . . . . . . . . . . . . . . . 761,590 589,898 458,827Interest expense, net . . . . . . . . . . . . . . . . . . . . . . . . . . . . . . . . . . 90,459 97,876 118,585
Income before Income Taxes . . . . . . . . . . . . . . . . . . . . . . . . . . . . . . 671,131 492,022 340,242Provision for income taxes . . . . . . . . . . . . . . . . . . . . . . . . . . . . . 235,137 180,617 126,088
Net Income . . . . . . . . . . . . . . . . . . . . . . . . . . . . . . . . . . . . . . . . . . . . . $ 435,994 $ 311,405 $ 214,154
Net Income Per Share—Basic—Class B Common Stock . . . . . . . $ 1.77 $ 1.27 $ .87
Net Income Per Share—Diluted—Class B Common Stock . . . . . $ 1.77 $ 1.27 $ .87
Net Income Per Share—Basic—Common Stock . . . . . . . . . . . . . . $ 1.97 $ 1.41 $ .96
Net Income Per Share—Diluted—Common Stock . . . . . . . . . . . . $ 1.90 $ 1.36 $ .93
Cash Dividends Paid Per Share:Common Stock . . . . . . . . . . . . . . . . . . . . . . . . . . . . . . . . . . . . . . $ 1.1900 $ 1.1900 $ 1.1350Class B Common Stock . . . . . . . . . . . . . . . . . . . . . . . . . . . . . . . . 1.0712 1.0712 1.0206
The notes to consolidated financial statements are an integral part of these statements.
53
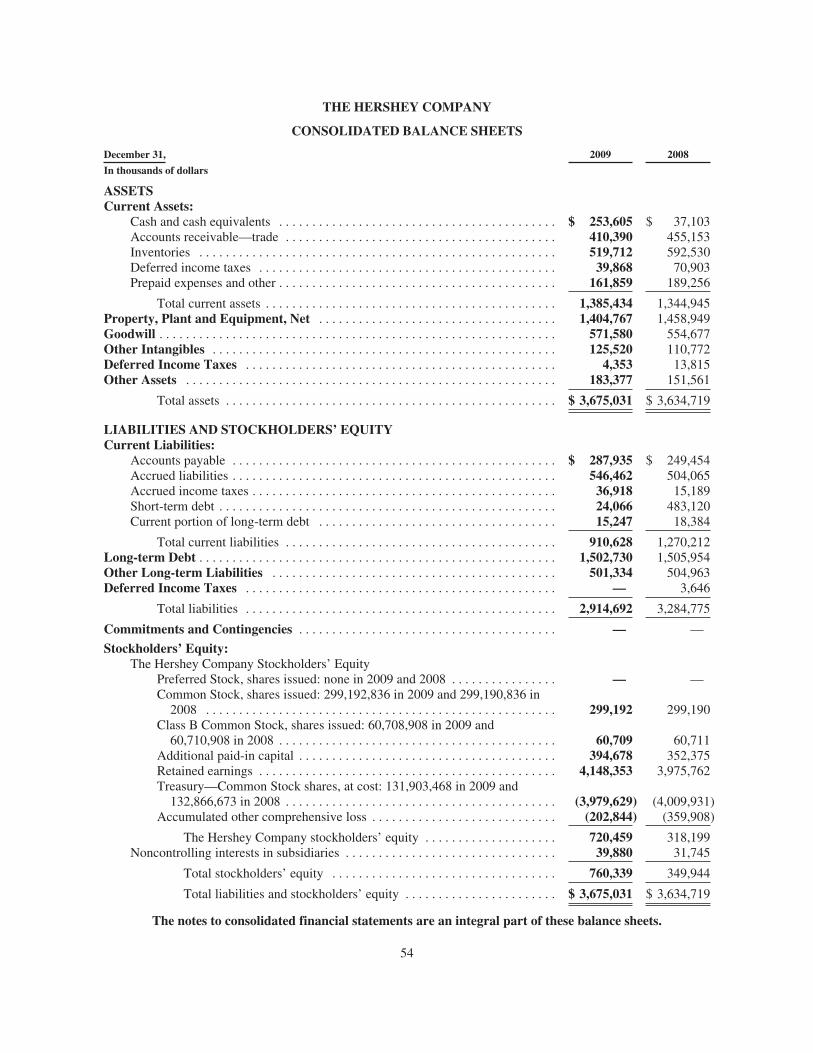
THE HERSHEY COMPANY
CONSOLIDATED BALANCE SHEETS
December 31, 2009 2008
In thousands of dollars
ASSETSCurrent Assets:
Cash and cash equivalents . . . . . . . . . . . . . . . . . . . . . . . . . . . . . . . . . . . . . . . . . . $ 253,605 $ 37,103Accounts receivable—trade . . . . . . . . . . . . . . . . . . . . . . . . . . . . . . . . . . . . . . . . . 410,390 455,153Inventories . . . . . . . . . . . . . . . . . . . . . . . . . . . . . . . . . . . . . . . . . . . . . . . . . . . . . . 519,712 592,530Deferred income taxes . . . . . . . . . . . . . . . . . . . . . . . . . . . . . . . . . . . . . . . . . . . . . 39,868 70,903Prepaid expenses and other . . . . . . . . . . . . . . . . . . . . . . . . . . . . . . . . . . . . . . . . . . 161,859 189,256
Total current assets . . . . . . . . . . . . . . . . . . . . . . . . . . . . . . . . . . . . . . . . . . . . 1,385,434 1,344,945Property, Plant and Equipment, Net . . . . . . . . . . . . . . . . . . . . . . . . . . . . . . . . . . . . 1,404,767 1,458,949Goodwill . . . . . . . . . . . . . . . . . . . . . . . . . . . . . . . . . . . . . . . . . . . . . . . . . . . . . . . . . . . . 571,580 554,677Other Intangibles . . . . . . . . . . . . . . . . . . . . . . . . . . . . . . . . . . . . . . . . . . . . . . . . . . . . 125,520 110,772Deferred Income Taxes . . . . . . . . . . . . . . . . . . . . . . . . . . . . . . . . . . . . . . . . . . . . . . . 4,353 13,815Other Assets . . . . . . . . . . . . . . . . . . . . . . . . . . . . . . . . . . . . . . . . . . . . . . . . . . . . . . . . 183,377 151,561
Total assets . . . . . . . . . . . . . . . . . . . . . . . . . . . . . . . . . . . . . . . . . . . . . . . . . . $ 3,675,031 $ 3,634,719
LIABILITIES AND STOCKHOLDERS’ EQUITYCurrent Liabilities:
Accounts payable . . . . . . . . . . . . . . . . . . . . . . . . . . . . . . . . . . . . . . . . . . . . . . . . . $ 287,935 $ 249,454Accrued liabilities . . . . . . . . . . . . . . . . . . . . . . . . . . . . . . . . . . . . . . . . . . . . . . . . . 546,462 504,065Accrued income taxes . . . . . . . . . . . . . . . . . . . . . . . . . . . . . . . . . . . . . . . . . . . . . . 36,918 15,189Short-term debt . . . . . . . . . . . . . . . . . . . . . . . . . . . . . . . . . . . . . . . . . . . . . . . . . . . 24,066 483,120Current portion of long-term debt . . . . . . . . . . . . . . . . . . . . . . . . . . . . . . . . . . . . 15,247 18,384
Total current liabilities . . . . . . . . . . . . . . . . . . . . . . . . . . . . . . . . . . . . . . . . . 910,628 1,270,212Long-term Debt . . . . . . . . . . . . . . . . . . . . . . . . . . . . . . . . . . . . . . . . . . . . . . . . . . . . . . 1,502,730 1,505,954Other Long-term Liabilities . . . . . . . . . . . . . . . . . . . . . . . . . . . . . . . . . . . . . . . . . . . 501,334 504,963Deferred Income Taxes . . . . . . . . . . . . . . . . . . . . . . . . . . . . . . . . . . . . . . . . . . . . . . . — 3,646
Total liabilities . . . . . . . . . . . . . . . . . . . . . . . . . . . . . . . . . . . . . . . . . . . . . . . 2,914,692 3,284,775
Commitments and Contingencies . . . . . . . . . . . . . . . . . . . . . . . . . . . . . . . . . . . . . . . — —
Stockholders’ Equity:The Hershey Company Stockholders’ Equity
Preferred Stock, shares issued: none in 2009 and 2008 . . . . . . . . . . . . . . . . — —Common Stock, shares issued: 299,192,836 in 2009 and 299,190,836 in
2008 . . . . . . . . . . . . . . . . . . . . . . . . . . . . . . . . . . . . . . . . . . . . . . . . . . . . . 299,192 299,190Class B Common Stock, shares issued: 60,708,908 in 2009 and
60,710,908 in 2008 . . . . . . . . . . . . . . . . . . . . . . . . . . . . . . . . . . . . . . . . . . 60,709 60,711Additional paid-in capital . . . . . . . . . . . . . . . . . . . . . . . . . . . . . . . . . . . . . . . 394,678 352,375Retained earnings . . . . . . . . . . . . . . . . . . . . . . . . . . . . . . . . . . . . . . . . . . . . . 4,148,353 3,975,762Treasury—Common Stock shares, at cost: 131,903,468 in 2009 and
132,866,673 in 2008 . . . . . . . . . . . . . . . . . . . . . . . . . . . . . . . . . . . . . . . . . (3,979,629) (4,009,931)Accumulated other comprehensive loss . . . . . . . . . . . . . . . . . . . . . . . . . . . . (202,844) (359,908)
The Hershey Company stockholders’ equity . . . . . . . . . . . . . . . . . . . . 720,459 318,199Noncontrolling interests in subsidiaries . . . . . . . . . . . . . . . . . . . . . . . . . . . . . . . . 39,880 31,745
Total stockholders’ equity . . . . . . . . . . . . . . . . . . . . . . . . . . . . . . . . . . 760,339 349,944
Total liabilities and stockholders’ equity . . . . . . . . . . . . . . . . . . . . . . . $ 3,675,031 $ 3,634,719
The notes to consolidated financial statements are an integral part of these balance sheets.
54
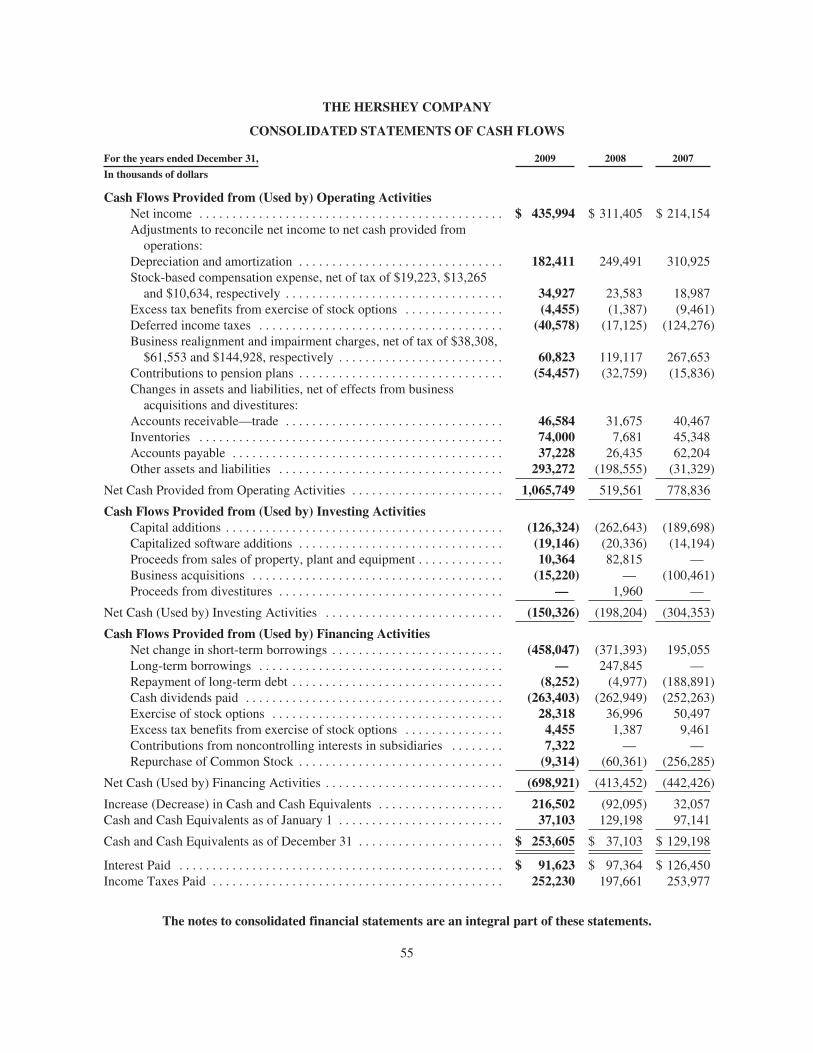
THE HERSHEY COMPANY
CONSOLIDATED STATEMENTS OF CASH FLOWS
For the years ended December 31, 2009 2008 2007
In thousands of dollars
Cash Flows Provided from (Used by) Operating ActivitiesNet income . . . . . . . . . . . . . . . . . . . . . . . . . . . . . . . . . . . . . . . . . . . . . . $ 435,994 $ 311,405 $ 214,154Adjustments to reconcile net income to net cash provided from
operations:Depreciation and amortization . . . . . . . . . . . . . . . . . . . . . . . . . . . . . . . 182,411 249,491 310,925Stock-based compensation expense, net of tax of $19,223, $13,265
and $10,634, respectively . . . . . . . . . . . . . . . . . . . . . . . . . . . . . . . . . 34,927 23,583 18,987Excess tax benefits from exercise of stock options . . . . . . . . . . . . . . . (4,455) (1,387) (9,461)Deferred income taxes . . . . . . . . . . . . . . . . . . . . . . . . . . . . . . . . . . . . . (40,578) (17,125) (124,276)Business realignment and impairment charges, net of tax of $38,308,
$61,553 and $144,928, respectively . . . . . . . . . . . . . . . . . . . . . . . . . 60,823 119,117 267,653Contributions to pension plans . . . . . . . . . . . . . . . . . . . . . . . . . . . . . . . (54,457) (32,759) (15,836)Changes in assets and liabilities, net of effects from business
acquisitions and divestitures:Accounts receivable—trade . . . . . . . . . . . . . . . . . . . . . . . . . . . . . . . . . 46,584 31,675 40,467Inventories . . . . . . . . . . . . . . . . . . . . . . . . . . . . . . . . . . . . . . . . . . . . . . 74,000 7,681 45,348Accounts payable . . . . . . . . . . . . . . . . . . . . . . . . . . . . . . . . . . . . . . . . . 37,228 26,435 62,204Other assets and liabilities . . . . . . . . . . . . . . . . . . . . . . . . . . . . . . . . . . 293,272 (198,555) (31,329)
Net Cash Provided from Operating Activities . . . . . . . . . . . . . . . . . . . . . . . 1,065,749 519,561 778,836
Cash Flows Provided from (Used by) Investing ActivitiesCapital additions . . . . . . . . . . . . . . . . . . . . . . . . . . . . . . . . . . . . . . . . . . (126,324) (262,643) (189,698)Capitalized software additions . . . . . . . . . . . . . . . . . . . . . . . . . . . . . . . (19,146) (20,336) (14,194)Proceeds from sales of property, plant and equipment . . . . . . . . . . . . . 10,364 82,815 —Business acquisitions . . . . . . . . . . . . . . . . . . . . . . . . . . . . . . . . . . . . . . (15,220) — (100,461)Proceeds from divestitures . . . . . . . . . . . . . . . . . . . . . . . . . . . . . . . . . . — 1,960 —
Net Cash (Used by) Investing Activities . . . . . . . . . . . . . . . . . . . . . . . . . . . (150,326) (198,204) (304,353)
Cash Flows Provided from (Used by) Financing ActivitiesNet change in short-term borrowings . . . . . . . . . . . . . . . . . . . . . . . . . . (458,047) (371,393) 195,055Long-term borrowings . . . . . . . . . . . . . . . . . . . . . . . . . . . . . . . . . . . . . — 247,845 —Repayment of long-term debt . . . . . . . . . . . . . . . . . . . . . . . . . . . . . . . . (8,252) (4,977) (188,891)Cash dividends paid . . . . . . . . . . . . . . . . . . . . . . . . . . . . . . . . . . . . . . . (263,403) (262,949) (252,263)Exercise of stock options . . . . . . . . . . . . . . . . . . . . . . . . . . . . . . . . . . . 28,318 36,996 50,497Excess tax benefits from exercise of stock options . . . . . . . . . . . . . . . 4,455 1,387 9,461Contributions from noncontrolling interests in subsidiaries . . . . . . . . 7,322 — —Repurchase of Common Stock . . . . . . . . . . . . . . . . . . . . . . . . . . . . . . . (9,314) (60,361) (256,285)
Net Cash (Used by) Financing Activities . . . . . . . . . . . . . . . . . . . . . . . . . . . (698,921) (413,452) (442,426)
Increase (Decrease) in Cash and Cash Equivalents . . . . . . . . . . . . . . . . . . . 216,502 (92,095) 32,057Cash and Cash Equivalents as of January 1 . . . . . . . . . . . . . . . . . . . . . . . . . 37,103 129,198 97,141
Cash and Cash Equivalents as of December 31 . . . . . . . . . . . . . . . . . . . . . . $ 253,605 $ 37,103 $ 129,198
Interest Paid . . . . . . . . . . . . . . . . . . . . . . . . . . . . . . . . . . . . . . . . . . . . . . . . . $ 91,623 $ 97,364 $ 126,450Income Taxes Paid . . . . . . . . . . . . . . . . . . . . . . . . . . . . . . . . . . . . . . . . . . . . 252,230 197,661 253,977
The notes to consolidated financial statements are an integral part of these statements.
55
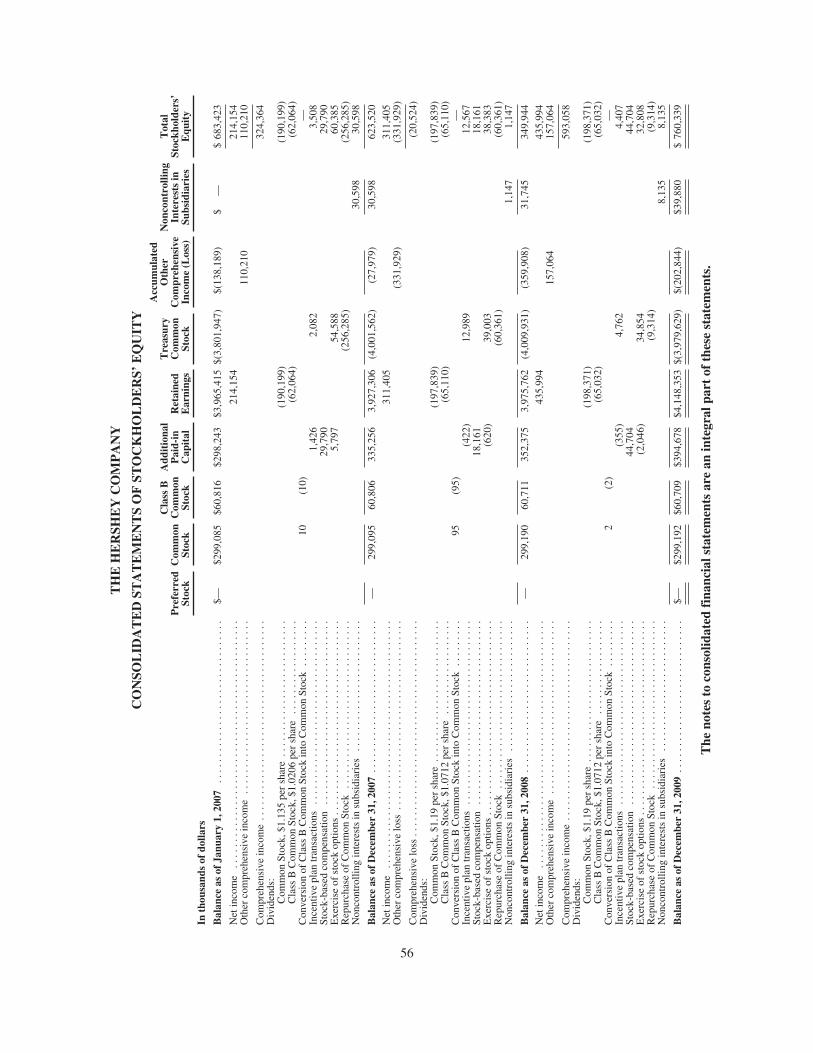
TH
EH
ER
SHE
YC
OM
PA
NY
CO
NSO
LID
AT
ED
STA
TE
ME
NT
SO
FST
OC
KH
OL
DE
RS’
EQ
UIT
Y
Pre
ferr
edSt
ock
Com
mon
Stoc
k
Cla
ssB
Com
mon
Stoc
k
Add
itio
nal
Pai
d-in
Cap
ital
Ret
aine
dE
arni
ngs
Tre
asur
yC
omm
onSt
ock
Acc
umul
ated
Oth
erC
ompr
ehen
sive
Inco
me
(Los
s)
Non
cont
rolli
ngIn
tere
sts
inSu
bsid
iari
es
Tot
alSt
ockh
olde
rs’
Equ
ity
Inth
ousa
nds
ofdo
llars
Bal
ance
asof
Janu
ary
1,20
07..
....
....
....
....
....
....
....
.$—
$299
,085
$60,
816
$298
,243
$3,9
65,4
15$(
3,80
1,94
7)$(
138,
189)
$—
$68
3,42
3
Net
inco
me
....
....
....
....
....
....
....
....
....
....
....
...
214,
154
214,
154
Oth
erco
mpr
ehen
sive
inco
me
....
....
....
....
....
....
....
....
.11
0,21
011
0,21
0
Com
preh
ensi
vein
com
e..
....
....
....
....
....
....
....
....
....
324,
364
Div
iden
ds:
Com
mon
Stoc
k,$1
.135
per
shar
e..
....
....
....
....
....
....
(190
,199
)(1
90,1
99)
Cla
ssB
Com
mon
Stoc
k,$1
.020
6pe
rsh
are
....
....
....
....
..(6
2,06
4)(6
2,06
4)C
onve
rsio
nof
Cla
ssB
Com
mon
Stoc
kin
toC
omm
onSt
ock
....
....
.10
(10)
—In
cent
ive
plan
tran
sact
ions
....
....
....
....
....
....
....
....
...
1,42
62,
082
3,50
8St
ock-
base
dco
mpe
nsat
ion
....
....
....
....
....
....
....
....
...
29,7
9029
,790
Exe
rcis
eof
stoc
kop
tions
....
....
....
....
....
....
....
....
....
.5,
797
54,5
8860
,385
Rep
urch
ase
ofC
omm
onSt
ock
....
....
....
....
....
....
....
....
(256
,285
)(2
56,2
85)
Non
cont
rolli
ngin
tere
sts
insu
bsid
iari
es..
....
....
....
....
....
...
30,5
9830
,598
Bal
ance
asof
Dec
embe
r31
,200
7..
....
....
....
....
....
....
...
—29
9,09
560
,806
335,
256
3,92
7,30
6(4
,001
,562
)(2
7,97
9)30
,598
623,
520
Net
inco
me
....
....
....
....
....
....
....
....
....
....
....
...
311,
405
311,
405
Oth
erco
mpr
ehen
sive
loss
....
....
....
....
....
....
....
....
....
(331
,929
)(3
31,9
29)
Com
preh
ensi
velo
ss..
....
....
....
....
....
....
....
....
....
...
(20,
524)
Div
iden
ds:
Com
mon
Stoc
k,$1
.19
per
shar
e..
....
....
....
....
....
....
.(1
97,8
39)
(197
,839
)C
lass
BC
omm
onSt
ock,
$1.0
712
per
shar
e..
....
....
....
....
(65,
110)
(65,
110)
Con
vers
ion
ofC
lass
BC
omm
onSt
ock
into
Com
mon
Stoc
k..
....
...
95(9
5)—
Ince
ntiv
epl
antr
ansa
ctio
ns..
....
....
....
....
....
....
....
....
.(4
22)
12,9
8912
,567
Stoc
k-ba
sed
com
pens
atio
n..
....
....
....
....
....
....
....
....
.18
,161
18,1
61E
xerc
ise
ofst
ock
optio
ns..
....
....
....
....
....
....
....
....
...
(620
)39
,003
38,3
83R
epur
chas
eof
Com
mon
Stoc
k..
....
....
....
....
....
....
....
..(6
0,36
1)(6
0,36
1)N
onco
ntro
lling
inte
rest
sin
subs
idia
ries
....
....
....
....
....
....
.1,
147
1,14
7
Bal
ance
asof
Dec
embe
r31
,200
8..
....
....
....
....
....
....
...
—29
9,19
060
,711
352,
375
3,97
5,76
2(4
,009
,931
)(3
59,9
08)
31,7
4534
9,94
4N
etin
com
e..
....
....
....
....
....
....
....
....
....
....
....
.43
5,99
443
5,99
4O
ther
com
preh
ensi
vein
com
e..
....
....
....
....
....
....
....
...
157,
064
157,
064
Com
preh
ensi
vein
com
e..
....
....
....
....
....
....
....
....
....
593,
058
Div
iden
ds:
Com
mon
Stoc
k,$1
.19
per
shar
e..
....
....
....
....
....
....
.(1
98,3
71)
(198
,371
)C
lass
BC
omm
onSt
ock,
$1.0
712
per
shar
e..
....
....
....
....
(65,
032)
(65,
032)
Con
vers
ion
ofC
lass
BC
omm
onSt
ock
into
Com
mon
Stoc
k..
....
...
2(2
)—
Ince
ntiv
epl
antr
ansa
ctio
ns..
....
....
....
....
....
....
....
....
.(3
55)
4,76
24,
407
Stoc
k-ba
sed
com
pens
atio
n..
....
....
....
....
....
....
....
....
.44
,704
44,7
04E
xerc
ise
ofst
ock
optio
ns..
....
....
....
....
....
....
....
....
...
(2,0
46)
34,8
5432
,808
Rep
urch
ase
ofC
omm
onSt
ock
....
....
....
....
....
....
....
....
(9,3
14)
(9,3
14)
Non
cont
rolli
ngin
tere
sts
insu
bsid
iari
es..
....
....
....
....
....
...
8,13
58,
135
Bal
ance
asof
Dec
embe
r31
,200
9..
....
....
....
....
....
....
...
$—$2
99,1
92$6
0,70
9$3
94,6
78$4
,148
,353
$(3,
979,
629)
$(20
2,84
4)$3
9,88
0$
760,
339
The
note
sto
cons
olid
ated
fina
ncia
lsta
tem
ents
are
anin
tegr
alpa
rtof
thes
est
atem
ents
.
56
THE HERSHEY COMPANY
NOTES TO CONSOLIDATED FINANCIAL STATEMENTS
1. SUMMARY OF SIGNIFICANT ACCOUNTING POLICIES
Our significant accounting policies are discussed below and in other notes to the consolidated financialstatements. We have made certain reclassifications to prior year amounts to conform to the 2009 presentation.
Principles of Consolidation
Our consolidated financial statements include the accounts of the Company and our majority-ownedsubsidiaries and entities in which we have a controlling financial interest after the elimination of intercompanyaccounts and transactions. We have a controlling financial interest if we own a majority of the outstanding votingcommon stock and minority shareholders do not have substantive participating rights or we have significantcontrol over an entity through contractual or economic interests in which we are the primary beneficiary.
In May 2007, we entered into an agreement with Godrej Beverages and Foods, Ltd., to manufacture anddistribute confectionery products, snacks and beverages across India. Under the agreement, we own a 51%controlling interest in Godrej Hershey Ltd. This business acquisition is included in our consolidated financialresults, including the related noncontrolling interest.
In January 2008, our Brazilian subsidiary, Hershey do Brasil, entered into a cooperative agreement withPandurata Alimentos LTDA (“Bauducco”), a leading manufacturer of baked goods in Brazil whose primarybrand is Bauducco. Under this agreement we manufacture and market, and they sell and distribute our products.The agreement conveyed a 49% interest in Hershey do Brasil to Bauducco. We maintain a 51% controllinginterest in Hershey do Brasil.
Equity Investments
We use the equity method of accounting when we have a 20% to 50% interest in other companies andexercise significant influence. Under the equity method, original investments are recorded at cost and adjusted byour share of undistributed earnings or losses of these companies. Equity investments are reviewed for impairmentwhenever events or changes in circumstances indicate that the carrying amount of the investments may not berecoverable. In May 2007, we entered into a manufacturing agreement in China with Lotte ConfectioneryCompany, LTD. to produce Hershey products and certain Lotte products for the markets in Asia, particularlyChina. We own a 44% interest in this entity and are accounting for this investment using the equity method.
Use of Estimates
The preparation of financial statements in conformity with U.S. generally accepted accounting principles(“GAAP”) requires management to make estimates and assumptions that affect the reported amounts of assetsand liabilities at the date of the financial statements, and revenues and expenses during the reporting period.Critical accounting estimates involved in applying our accounting policies are those that require management tomake assumptions about matters that are highly uncertain at the time the accounting estimate was made and thosefor which different estimates reasonably could have been used for the current period. Critical accountingestimates are also those which are reasonably likely to change from period to period and would have a materialimpact on the presentation of our financial condition, changes in financial condition or results of operations. Ourmost critical accounting estimates pertain to accounting policies for accounts receivable—trade; accruedliabilities; pension and other post-retirement benefit plans; and goodwill and other intangible assets.
These estimates and assumptions are based on management’s best estimates and judgment. Managementevaluates its estimates and assumptions on an ongoing basis using historical experience and other factors,
57
THE HERSHEY COMPANY
NOTES TO CONSOLIDATED FINANCIAL STATEMENTS—(Continued)
including the current economic environment, which management believes to be reasonable under thecircumstances. We adjust such estimates and assumptions when facts and circumstances dictate. Volatile credit,equity, foreign currency, commodity and energy markets, and declines in consumer spending have combined toincrease the uncertainty inherent in such estimates and assumptions. As future events and their effects cannot bedetermined with precision, actual results could differ significantly from these estimates. Changes in thoseestimates resulting from continuing changes in the economic environment will be reflected in the financialstatements in future periods.
Revenue Recognition
We record sales when all of the following criteria have been met:
• A valid customer order with a fixed price has been received;
• The product has been delivered to the customer;
• There is no further significant obligation to assist in the resale of the product; and
• Collectability is reasonably assured.
Net sales include revenue from the sale of finished goods and royalty income, net of allowances for tradepromotions, consumer coupon programs and other sales incentives, and allowances and discounts associated withaged or potentially unsaleable products. Trade promotions and sales incentives primarily include reduced pricefeatures, merchandising displays, sales growth incentives, new item allowances and cooperative advertising.
Cost of Sales
Cost of sales represents costs directly related to the manufacture and distribution of our products. Primarycosts include raw materials, packaging, direct labor, overhead, shipping and handling, warehousing and thedepreciation of manufacturing, warehousing and distribution facilities. Manufacturing overhead and relatedexpenses include salaries, wages, employee benefits, utilities, maintenance and property taxes.
Selling, Marketing and Administrative
Selling, marketing and administrative expenses represent costs incurred in generating revenues and inmanaging our business. Such costs include advertising and other marketing expenses, salaries, employeebenefits, incentive compensation, research and development, travel, office expenses, amortization of capitalizedsoftware and depreciation of administrative facilities.
Cash Equivalents
Cash equivalents consist of highly liquid debt instruments, time deposits and money market funds withoriginal maturities of 3 months or less. The fair value of cash and cash equivalents approximates the carryingamount.
Commodities Futures and Options Contracts
We enter into commodities futures and options contracts to reduce the effect of price fluctuations associatedwith the purchase of raw materials, energy requirements and transportation services. We report the effectiveportion of the gain or loss on a derivative instrument designated and qualifying as a cash flow hedging instrument
58
THE HERSHEY COMPANY
NOTES TO CONSOLIDATED FINANCIAL STATEMENTS—(Continued)
as a component of other comprehensive income and reclassify such gains or losses into earnings in the sameperiod or periods during which the hedged transactions affect earnings. The remaining gain or loss on thederivative instrument, if any, must be recognized currently in earnings.
For a derivative designated as hedging the exposure to changes in the fair value of a recognized asset orliability or a firm commitment (referred to as a fair value hedge), the gain or loss must be recognized in earningsin the period of change together with the offsetting loss or gain on the hedged item attributable to the risk beinghedged. The effect of that accounting is to reflect in earnings the extent to which the hedge is not effective inachieving offsetting changes in fair value.
All derivative instruments which we are currently utilizing, including commodities futures and optionscontracts, are designated and accounted for as cash flow hedges. Additional information with regard toaccounting policies associated with derivative instruments is contained in Note 6, Derivative Instruments andHedging Activities.
Property, Plant and Equipment
Property, plant and equipment are stated at cost and depreciated on a straight-line basis over the estimateduseful lives of the assets, as follows: 3 to 15 years for machinery and equipment; and 25 to 40 years for buildingsand related improvements. Maintenance and repairs are expensed as incurred. We capitalize applicable interestcharges incurred during the construction of new facilities and production lines and amortize these costs over theassets’ estimated useful lives.
We review long-lived assets for impairment whenever events or changes in circumstances indicate that thecarrying amount of such assets may not be recoverable. We measure the recoverability of assets to be held andused by a comparison of the carrying amount of long-lived assets to future undiscounted net cash flows expectedto be generated. If these assets are considered to be impaired, we measure impairment as the amount by whichthe carrying amount of the assets exceeds the fair value of the assets. We report assets held for sale or disposal atthe lower of the carrying amount or fair value less cost to sell.
Asset Retirement Obligations
Asset retirement obligations generally apply to legal obligations associated with the retirement of a tangiblelong-lived asset that result from the acquisition, construction or development and normal operation of a long-lived asset. We assess asset retirement obligations on a periodic basis. We recognize the fair value of a liabilityfor an asset retirement obligation in the period in which it is incurred if a reasonable estimate of fair value can bemade. We capitalize associated asset retirement costs as part of the carrying amount of the long-lived asset.
Goodwill and Other Intangible Assets
We classify intangible assets into 3 categories: (1) intangible assets with definite lives subject toamortization; (2) intangible assets with indefinite lives not subject to amortization; and (3) goodwill.
Our intangible assets with definite lives consist primarily of customer-related intangible assets and patents.We are amortizing customer-related intangible assets over their estimated useful lives of approximately 13 years.We are amortizing patents over their remaining legal lives of approximately 9 years. We conduct impairmenttests when events or changes in circumstances indicate that the carrying value of these assets may not berecoverable.
59
THE HERSHEY COMPANY
NOTES TO CONSOLIDATED FINANCIAL STATEMENTS—(Continued)
Our intangible assets with indefinite lives consist of trademarks obtained through business acquisitions. Wedo not amortize existing trademarks because we determined their useful lives to be indefinite. We conductimpairment tests for other intangible assets with indefinite lives and goodwill at the beginning of the fourthquarter of each year, or when circumstances arise that indicate a possible impairment might exist.
We evaluate our trademarks for impairment by comparing their carrying amount to their estimated fairvalue. The fair value of trademarks is calculated using a “relief from royalty payments” methodology. Thisapproach involves a two-step process. In the first step, we estimate reasonable royalty rates for each trademark.In the second step, we apply these royalty rates to a net sales stream and discount the resulting cash flows todetermine fair value. This fair value is then compared with the carrying value of each trademark. If the estimatedfair value is less than the carrying amount, we record an impairment charge to reduce the asset to its estimatedfair value. The estimates of future cash flows are generally based on past performance of the brands and reflectnet sales projections and assumptions for the brands that we use in current operating plans. We also considerassumptions that market participants may use. Such assumptions are subject to change due to changing economicand competitive conditions.
We use a two-step process to evaluate goodwill for impairment. In the first step, we compare the fair valueof each reporting unit with the carrying amount of the reporting unit, including goodwill. We estimate the fairvalue of the reporting unit based on discounted future cash flows. If the estimated fair value of the reporting unitis less than the carrying amount of the reporting unit, we complete a second step to determine the amount of thegoodwill impairment that we should record. In the second step, we determine an implied fair value of thereporting unit’s goodwill by allocating the reporting unit’s fair value to all of its assets and liabilities other thangoodwill (including any unrecognized intangible assets). We compare the resulting implied fair value of thegoodwill to the carrying amount and record an impairment charge for the difference.
The assumptions we use to estimate fair value are based on the past performance of each reporting unit andreflect the projections and assumptions that we use in current operating plans. We also consider assumptions thatmarket participants may use. Such assumptions are subject to change due to changing economic and competitiveconditions.
In December 2008, we recorded total non-cash impairment charges of $45.7 million. We determined that thecarrying amounts of certain trademarks, primarily the Mauna Loa brand, exceeded their estimated fair value dueto reduced expectations for future sales and cash flows compared with the valuations at the acquisition dates.
As a result of reduced expectations for future cash flows resulting from lower expected profitability, wedetermined that the carrying amount of our wholly-owned subsidiary, Hershey do Brasil, exceeded its fair valueand recorded a non-cash impairment charge of $12.3 million in December 2007. There was no tax benefitassociated with this charge.
We provide more information on intangible assets and the impairment testing results in Note 18,Supplemental Balance Sheet Information.
Comprehensive Income
We report comprehensive income (loss) on the Consolidated Statements of Stockholders’ Equity andaccumulated other comprehensive income (loss) on the Consolidated Balance Sheets. Additional informationregarding comprehensive income is contained in Note 9, Comprehensive Income.
60
THE HERSHEY COMPANY
NOTES TO CONSOLIDATED FINANCIAL STATEMENTS—(Continued)
We translate results of operations for foreign entities using the average exchange rates during the period.For foreign entities, assets and liabilities are translated to U.S. dollars using the exchange rates in effect at thebalance sheet date. Resulting translation adjustments are recorded as a component of other comprehensiveincome (loss), “Foreign Currency Translation Adjustments.”
Changes to the balances of the unrecognized prior service cost and the unrecognized net actuarial loss, netof income taxes, associated with our pension and post-retirement benefit plans are recorded as a component ofother comprehensive income (loss), “Pension and Post-retirement Benefit Plans.” Additional informationregarding accounting policies associated with benefit plans is contained in Note 14, Pension and Other Post-Retirement Benefit Plans.
Gains and losses on cash flow hedging derivatives, to the extent effective, are included in othercomprehensive income (loss), net of related tax effects. Reclassification adjustments reflecting such gains andlosses are ratably recorded in income in the same period during which the hedged transactions affect earnings.Additional information with regard to accounting policies associated with derivative instruments is contained inNote 6, Derivative Instruments and Hedging Activities.
Foreign Exchange Forward Contracts and Options
We enter into foreign exchange forward contracts and options to hedge transactions denominated in foreigncurrencies. These transactions are primarily related to firm commitments or forecasted purchases of equipment,certain raw materials and finished goods. We also hedge payment of forecasted intercompany transactions withour subsidiaries outside the United States. These contracts reduce currency risk from exchange rate movements.
Foreign exchange forward contracts and options are intended to be and are effective as hedges ofidentifiable foreign currency commitments and forecasted transactions. Foreign exchange forward contracts andoptions are designated as cash flow hedging derivatives and the fair value of such contracts is recorded on theConsolidated Balance Sheets as either an asset or liability. Gains and losses on these contracts are recorded as acomponent of other comprehensive income and are reclassified into earnings in the same period during which thehedged transactions affect earnings. Additional information with regard to accounting policies for derivativeinstruments, including foreign exchange forward contracts and options is contained in Note 6, DerivativeInstruments and Hedging Activities.
License Agreements
We enter into license agreements under which we have access to certain trademarks and proprietarytechnology, and manufacture and/or market and distribute certain products. The rights under these agreementsare extendible on a long-term basis at our option subject to certain conditions, including minimum sales and unitvolume levels, which we have met. License fees and royalties, payable under the terms of the agreements, areexpensed as incurred and included in selling, marketing and administrative expenses.
Research and Development
We expense research and development costs as incurred. Research and development expense was $28.1million in 2009, $28.1 million in 2008 and $28.0 million in 2007. Research and development expense is includedin selling, marketing and administrative expenses.
61
THE HERSHEY COMPANY
NOTES TO CONSOLIDATED FINANCIAL STATEMENTS—(Continued)
Advertising
We expense advertising costs as incurred. Advertising expense, which is included in selling, marketing andadministrative expenses, was $241.2 million in 2009, $161.1 million in 2008 and $127.9 million in 2007. We hadno prepaid advertising expense as of December 31, 2009 and as of December 31, 2008.
Computer Software
We capitalize costs associated with software developed or obtained for internal use when both thepreliminary project stage is completed and it is probable that computer software being developed will becompleted and placed in service. Capitalized costs include only (i) external direct costs of materials and servicesconsumed in developing or obtaining internal-use software, (ii) payroll and other related costs for employees whoare directly associated with and who devote time to the internal-use software project and (iii) interest costsincurred, when material, while developing internal-use software. We cease capitalization of such costs no laterthan the point at which the project is substantially complete and ready for its intended purpose.
The unamortized amount of capitalized software was $44.7 million as of December 31, 2009 and was$42.3 million as of December 31, 2008. We amortize software costs using the straight-line method over theexpected life of the software, generally 3 to 5 years. Accumulated amortization of capitalized software was$194.3 million as of December 31, 2009 and $176.7 million as of December 31, 2008.
We review the carrying value of software and development costs for impairment in accordance with ourpolicy pertaining to the impairment of long-lived assets. Generally, we measure impairment under the followingcircumstances:
• When internal-use computer software is not expected to provide substantive service potential;
• A significant change occurs in the extent or manner in which the software is used or is expected to beused;
• A significant change is made or will be made to the software program; and
• Costs of developing or modifying internal-use computer software significantly exceed the amountoriginally expected to develop or modify the software.
2. ACQUISITIONS AND DIVESTITURES
In March 2009, we completed the acquisition of the Van Houten Singapore consumer business. Theacquisition from Barry Callebaut, AG provides us with an exclusive license of the Van Houten brand name andrelated trademarks in Asia and the Middle East for the retail and duty free distribution channels. The purchaseprice for the acquisition of Van Houten Singapore and the licensing agreement was approximately $15.2 million.Total liabilities assumed were $3.6 million.
In January 2008, our Brazilian subsidiary, Hershey do Brasil, entered into a cooperative agreement withBauducco. In the fourth quarter of 2007, we recorded a goodwill impairment charge and approved a businessrealignment program associated with initiatives to improve distribution and enhance performance of our businessin Brazil. In the first quarter of 2008, we received approximately $2.0 million in cash and recorded an otherintangible asset of $13.7 million associated with the cooperative agreement with Bauducco in exchange for ourconveying to Bauducco a 49% interest in Hershey do Brasil. We maintain a 51% controlling interest in Hersheydo Brasil.
62
THE HERSHEY COMPANY
NOTES TO CONSOLIDATED FINANCIAL STATEMENTS—(Continued)
In May 2007, we entered into an agreement with Godrej Beverages and Foods, Ltd., one of India’s largestconsumer goods, confectionery and food companies, to manufacture and distribute confectionery products,snacks and beverages across India. Under the agreement, we invested $61.5 million during 2007 and own a 51%controlling interest in Godrej Hershey Ltd. Total liabilities assumed in 2007 were $51.6 million.
Also in May 2007, we entered into a manufacturing agreement in China with Lotte Confectionery Co.,LTD., to produce Hershey products and certain Lotte products for the markets in Asia, particularly in China. Weinvested $39.0 million in 2007 and own a 44% interest. We are accounting for this investment using the equitymethod.
We included results subsequent to the dates of acquisition in the consolidated financial statements. Had theresults of the acquisitions been included in the consolidated financial statements for each of the periodspresented, the effect would not have been material.
3. BUSINESS REALIGNMENT INITIATIVES
In February 2007, we announced a comprehensive, three-year supply chain transformation program (the“global supply chain transformation program” or “GSCT”) and, in December 2007, we initiated a businessrealignment program associated with our business in Brazil (together, “the 2007 business realignmentinitiatives”). In December 2008, we approved a modest expansion in the scope of the global supply chaintransformation program to include the closure of two subscale manufacturing facilities of Artisan ConfectionsCompany, a wholly-owned subsidiary, and consolidation of the associated production into existing U.S. facilities,along with rationalization of other select portfolio items. The affected facilities were located in Berkeley and SanFrancisco, California. Additional business realignment charges related to the expansion in scope were recorded in2009 and included severance for approximately 150 employees.
The original estimated pre-tax cost of the program announced in February 2007 was from $525 million to$575 million over three years. The total included from $475 million to $525 million in business realignment costsand approximately $50 million in project implementation costs. The increase in scope approved in December2008 increased the total expected cost by about $25 million. In addition, employee lump sum withdrawals fromour defined benefit pension plans resulted in total non-cash pension settlement losses of $85.0 million whichconsisted of $60.4 million in 2009, $12.5 million in 2008 and $12.1 million in 2007.
Total pre-tax charges and non-recurring project implementation costs were $629.1 million for the GSCT.Excluding the higher than planned non-cash pension settlement losses, the GSCT total project costs were withinthe projected ranges. The GSCT was essentially complete as of December 31, 2009. Total costs of $99.1 millionwere recorded during 2009, costs of $130.0 million were recorded in 2008 and costs of $400.0 million wererecorded in 2007 for this program. The current trends of employee lump sum withdrawals from the definedbenefit pension plans could result in additional non-cash pension settlement losses of $12 million to $18 millionin 2010. In addition, the manufacturing facilities in Naugatuck, Connecticut; Reading, Pennsylvania and SmithsFalls, Ontario have been closed and are being held for sale. Actual proceeds from the sale of these facilities coulddiffer from expected proceeds which could cause additional charges or credits in 2010.
In an effort to improve the performance of our business in Brazil, in January 2008 Hershey do Brasil enteredinto a cooperative agreement with Bauducco. Business realignment and impairment charges of $4.9 million wererecorded in 2008 and $12.6 million were recorded in 2007.
63
THE HERSHEY COMPANY
NOTES TO CONSOLIDATED FINANCIAL STATEMENTS—(Continued)
Charges (credits) associated with business realignment initiatives and impairment recorded during 2009,2008 and 2007 were as follows:
For the years ended December 31, 2009 2008 2007
In thousands of dollars
Cost of sales2007 business realignment initiatives:
Global supply chain transformation program . . . . . . . . . . . . . . . . . . . $10,136 $ 77,767 $123,090
Selling, marketing and administrative2007 business realignment initiatives:
Global supply chain transformation program . . . . . . . . . . . . . . . . . . . 6,120 8,102 12,623
Business realignment and impairment charges, net2007 business realignment initiatives:
Global supply chain transformation program:Net (gain on sale)/impairment of fixed assets . . . . . . . . . . . . . . . (3,418) (4,882) 47,938Plant closure expense . . . . . . . . . . . . . . . . . . . . . . . . . . . . . . . . . . 22,157 23,415 13,506Employee separation costs . . . . . . . . . . . . . . . . . . . . . . . . . . . . . . 2,474 11,469 176,463Pension settlement loss . . . . . . . . . . . . . . . . . . . . . . . . . . . . . . . . 60,431 12,501 12,075Contract termination costs . . . . . . . . . . . . . . . . . . . . . . . . . . . . . . 1,231 1,637 14,316
Brazilian business realignment:Goodwill impairment . . . . . . . . . . . . . . . . . . . . . . . . . . . . . . . . . . — — 12,260Employee separation costs . . . . . . . . . . . . . . . . . . . . . . . . . . . . . . — 1,581 310Fixed asset impairment charges . . . . . . . . . . . . . . . . . . . . . . . . . . — 754 —Contract termination and other exit costs . . . . . . . . . . . . . . . . . . . — 2,587 —
2008 impairment of trademarks . . . . . . . . . . . . . . . . . . . . . . . . . . . . . . . . . . — 45,739 —
Total business realignment and impairment charges, net . . . . . . 82,875 94,801 276,868
Total net charges associated with business realignment initiatives andimpairment . . . . . . . . . . . . . . . . . . . . . . . . . . . . . . . . . . . . . . . . . . . . . . . . . . . . $99,131 $180,670 $412,581
Global Supply Chain Transformation Program
The charge of $10.1 million recorded in cost of sales during 2009 related primarily to the start-up costsassociated with the global supply chain transformation program and the accelerated depreciation of fixed assetsover the estimated remaining useful life. The $6.1 million recorded in selling, marketing and administrativeexpenses related primarily to project administration for the global supply chain transformation program. The $3.4million net gain on sale of fixed assets related primarily to higher proceeds from the sale of equipment. The$22.2 million of plant closure expenses for 2009 related primarily to the preparation of plants for sale andequipment removal costs. In determining the costs related to fixed asset impairments, fair value was estimatedbased on the expected sales proceeds. Certain real estate with a carrying value of $11.7 million was being heldfor sale as of December 31, 2009. The global supply chain transformation program had identified sixmanufacturing facilities which would be closed. As of December 31, 2009, manufacturing facilities located inDartmouth, Nova Scotia; Oakdale, California; and Montreal, Quebec have been closed and sold. The facilitieslocated in Naugatuck, Connecticut; Reading, Pennsylvania; and Smiths Falls, Ontario have been closed and arebeing held for sale. The global supply chain transformation program employee separation costs were primarilyrelated to involuntary terminations at the manufacturing facilities of Artisan Confections Company which havebeen closed. The higher pension settlement loss in 2009 compared to 2008 resulted from an increase in actuarial
64
THE HERSHEY COMPANY
NOTES TO CONSOLIDATED FINANCIAL STATEMENTS—(Continued)
losses associated with the significant decline in the fair value of pension assets in 2008, along with the increasedlevel of lump sum withdrawals from a defined benefit pension plan related to employee departures associatedwith the global supply chain transformation program.
The 2008 charge of $77.8 million recorded in cost of sales for the global supply chain transformationprogram related primarily to the accelerated depreciation of fixed assets over a reduced estimated remaininguseful life and start-up costs associated with the global supply chain transformation program. The $8.1 millionrecorded in selling, marketing and administrative expenses related primarily to project administration for theglobal supply chain transformation program. In determining the costs related to fixed asset impairments, fairvalue was estimated based on the expected sales proceeds. The $4.9 million of gains on sale of fixed assetsresulted from the receipt of proceeds in excess of the carrying value primarily from the sale of a warehousing anddistribution facility. The $23.4 million of plant closure expenses for 2008 related primarily to the preparation ofplants for sale and production line removal costs. Certain real estate with a carrying value of $15.8 million wasbeing held for sale as of December 31, 2008. The global supply chain transformation program employeeseparation costs were related to involuntary terminations at the North American manufacturing facilities whichwere being closed.
The 2007 charge of $123.1 million recorded in cost of sales for the global supply chain transformationprogram related primarily to the accelerated depreciation of fixed assets over a reduced estimated remaininguseful life and costs related to inventory reductions. The $12.6 million recorded in selling, marketing andadministrative expenses related primarily to project management and administration. In determining the costsrelated to fixed asset impairments, fair value was estimated based on the expected sales proceeds. Certain realestate with a carrying value of $40.2 million was being held for sale as of December 31, 2007. Employeeseparation costs included $79.0 million primarily for involuntary terminations at the 6 North Americanmanufacturing facilities which were being closed. The employee separation costs also included $97.5 million forcharges relating to pension and other post-retirement benefits curtailments and special termination benefits.
Brazilian Business Realignment
The 2008 Brazilian business realignment charges and the 2007 employee separation costs were related toinvoluntary terminations and costs associated with office consolidation related to the cooperative agreement withBauducco. During the fourth quarter of 2007, we completed our annual impairment evaluation of goodwill andother intangible assets. As a result of reduced expectations for future cash flows resulting primarily from lowerexpected profitability, we determined that the carrying amount of our wholly-owned subsidiary, Hershey doBrasil, exceeded its fair value and recorded a non-cash impairment charge of $12.3 million in December 2007.There was no tax benefit associated with this charge.
2008 Impairment of Trademarks
As a result of our annual impairment tests of intangible assets with useful lives determined to be indefinite,we recorded total impairment charges of $45.7 million in December 2008. We determined that the carryingamounts of certain trademarks, primarily the Mauna Loa brand, exceeded their estimated fair value due toreduced expectations for future sales and cash flows compared with the valuations at the acquisition dates. Formore information, refer to pages 59 and 60.
Liabilities Associated with Business Realignment Initiatives
The liability balance as of December 31, 2009 relating to the 2007 business realignment initiatives was$9.2 million, primarily for employee separation and plant closure costs to be paid in 2010. The liability balance
65
THE HERSHEY COMPANY
NOTES TO CONSOLIDATED FINANCIAL STATEMENTS—(Continued)
as of December 31, 2009 was increased by $0.1 million as a result of foreign currency translation adjustments.The liability balance as of December 31, 2008 was $31.0 million, primarily related to employee separation costs.Charges for plant closure and employee separation costs of $6.6 million were recorded in 2009. We madepayments of $28.5 million in 2009 and $46.9 million in 2008 against the liabilities recorded for the 2007 businessrealignment initiatives, principally related to employee separation and project administration.
4. NONCONTROLLING INTERESTS IN SUBSIDIARIES
As of January 1, 2009, we adopted a FASB accounting standard that establishes new accounting andreporting requirements for the noncontrolling interest in a subsidiary (formerly known as minority interest) andfor the deconsolidation of a subsidiary and requires the noncontrolling interest to be reported as a component ofequity. In addition, changes in a parent’s ownership interest while the parent retains its controlling interest willbe accounted for as equity transactions, and any retained noncontrolling equity investment upon thedeconsolidation of a subsidiary will be measured initially at fair value. Reclassifications have been made to allperiods presented to conform to the 2009 presentation.
In May 2007, we entered into an agreement with Godrej Beverages and Foods, Ltd. to manufacture anddistribute confectionery products, snacks and beverages across India. Under the agreement, we own a 51%controlling interest in Godrej Hershey Ltd. In January 2009, the Company contributed cash of approximately$8.7 million to Godrej Hershey Ltd. and owners of the noncontrolling interests in Godrej Hershey Ltd.contributed approximately $7.3 million. The ownership interest percentages in Godrej Hershey Ltd. did notchange significantly as a result of these contributions. The noncontrolling interests in Godrej Hershey Ltd. areincluded in the equity section of the Consolidated Balance Sheets.
We also own a 51% controlling interest in Hershey do Brasil under the cooperative agreement withBauducco. The noncontrolling interest in Hershey do Brasil is included in the equity section of the ConsolidatedBalance Sheets.
The increase in noncontrolling interests in subsidiaries from $31.7 million as of December 31, 2008 to $39.9million as of December 31, 2009 reflected the $7.3 million contribution from the noncontrolling interests inGodrej Hershey Ltd. and the impact of currency translation adjustments, partially offset by a reduction resultingfrom the recording of the share of losses pertaining to the noncontrolling interests. The share of losses pertainingto the noncontrolling interests in subsidiaries was $4.1 million for the year ended December 31, 2009, $6.1million for the year ended December 31, 2008 and $1.3 million for the year ended December 31, 2007. This wasreflected in selling, marketing and administrative expenses.
5. COMMITMENTS AND CONTINGENCIES
We enter into certain obligations for the purchase of raw materials. These obligations are primarily in theform of forward contracts for the purchase of raw materials from third-party brokers and dealers. These contractsminimize the effect of future price fluctuations by fixing the price of part or all of these purchase obligations.Total obligations for each year consisted of fixed price contracts for the purchase of commodities and unpricedcontracts that were valued using market prices as of December 31, 2009.
The cost of commodities associated with the unpriced contracts is variable as market prices change overfuture periods. We mitigate the variability of these costs to the extent that we have entered into commoditiesfutures and options contracts to hedge our costs for those periods. Increases or decreases in market prices areoffset by gains or losses on commodities futures contracts. Taking delivery of and making payments for the
66
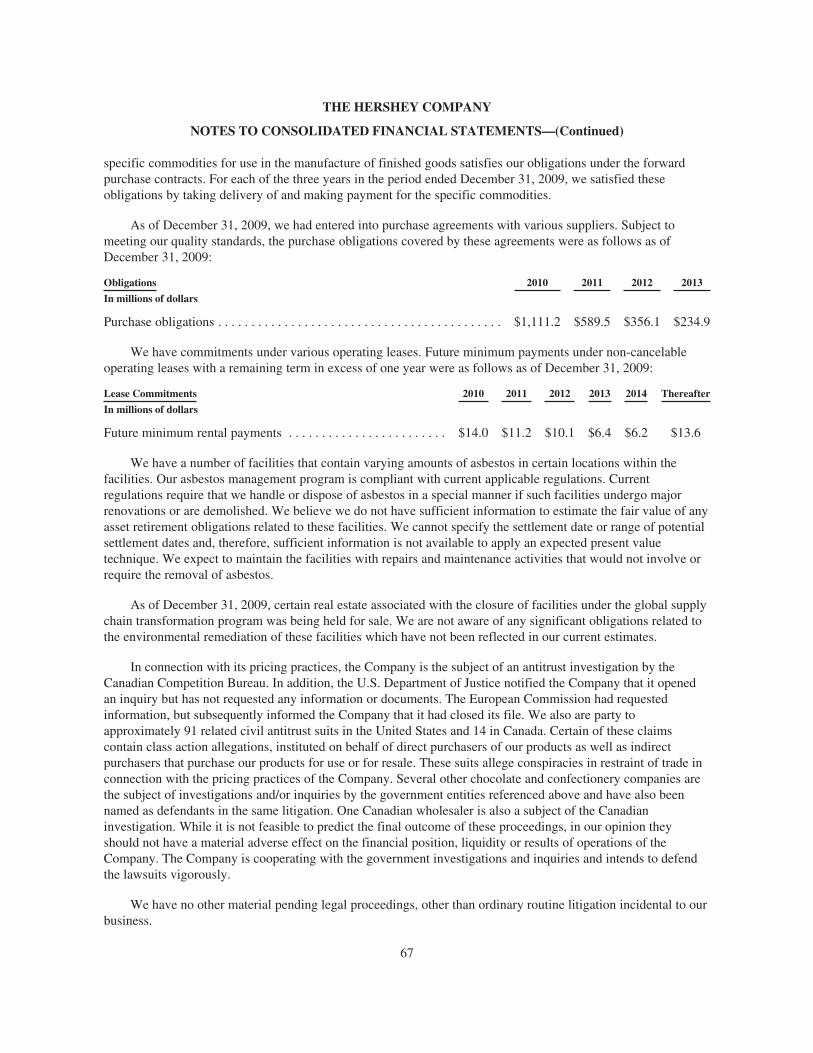
THE HERSHEY COMPANY
NOTES TO CONSOLIDATED FINANCIAL STATEMENTS—(Continued)
specific commodities for use in the manufacture of finished goods satisfies our obligations under the forwardpurchase contracts. For each of the three years in the period ended December 31, 2009, we satisfied theseobligations by taking delivery of and making payment for the specific commodities.
As of December 31, 2009, we had entered into purchase agreements with various suppliers. Subject tomeeting our quality standards, the purchase obligations covered by these agreements were as follows as ofDecember 31, 2009:
Obligations 2010 2011 2012 2013
In millions of dollars
Purchase obligations . . . . . . . . . . . . . . . . . . . . . . . . . . . . . . . . . . . . . . . . . . . $1,111.2 $589.5 $356.1 $234.9
We have commitments under various operating leases. Future minimum payments under non-cancelableoperating leases with a remaining term in excess of one year were as follows as of December 31, 2009:
Lease Commitments 2010 2011 2012 2013 2014 Thereafter
In millions of dollars
Future minimum rental payments . . . . . . . . . . . . . . . . . . . . . . . . $14.0 $11.2 $10.1 $6.4 $6.2 $13.6
We have a number of facilities that contain varying amounts of asbestos in certain locations within thefacilities. Our asbestos management program is compliant with current applicable regulations. Currentregulations require that we handle or dispose of asbestos in a special manner if such facilities undergo majorrenovations or are demolished. We believe we do not have sufficient information to estimate the fair value of anyasset retirement obligations related to these facilities. We cannot specify the settlement date or range of potentialsettlement dates and, therefore, sufficient information is not available to apply an expected present valuetechnique. We expect to maintain the facilities with repairs and maintenance activities that would not involve orrequire the removal of asbestos.
As of December 31, 2009, certain real estate associated with the closure of facilities under the global supplychain transformation program was being held for sale. We are not aware of any significant obligations related tothe environmental remediation of these facilities which have not been reflected in our current estimates.
In connection with its pricing practices, the Company is the subject of an antitrust investigation by theCanadian Competition Bureau. In addition, the U.S. Department of Justice notified the Company that it openedan inquiry but has not requested any information or documents. The European Commission had requestedinformation, but subsequently informed the Company that it had closed its file. We also are party toapproximately 91 related civil antitrust suits in the United States and 14 in Canada. Certain of these claimscontain class action allegations, instituted on behalf of direct purchasers of our products as well as indirectpurchasers that purchase our products for use or for resale. These suits allege conspiracies in restraint of trade inconnection with the pricing practices of the Company. Several other chocolate and confectionery companies arethe subject of investigations and/or inquiries by the government entities referenced above and have also beennamed as defendants in the same litigation. One Canadian wholesaler is also a subject of the Canadianinvestigation. While it is not feasible to predict the final outcome of these proceedings, in our opinion theyshould not have a material adverse effect on the financial position, liquidity or results of operations of theCompany. The Company is cooperating with the government investigations and inquiries and intends to defendthe lawsuits vigorously.
We have no other material pending legal proceedings, other than ordinary routine litigation incidental to ourbusiness.
67
THE HERSHEY COMPANY
NOTES TO CONSOLIDATED FINANCIAL STATEMENTS—(Continued)
6. DERIVATIVE INSTRUMENTS AND HEDGING ACTIVITIES
We classify derivatives as assets or liabilities on the balance sheet. Accounting for the change in fair valueof the derivative depends on:
• Whether the instrument qualifies for, and has been designated as, a hedging relationship; and
• The type of hedging relationship.
There are three types of hedging relationships:
• Cash flow hedge;
• Fair value hedge; and
• Hedge of foreign currency exposure of a net investment in a foreign operation.
As of December 31, 2009 and 2008, all of our derivative instruments were classified as cash flow hedges.
The amount of net gains on cash flow hedging derivatives, including foreign exchange forward contractsand options, interest rate swap agreements and commodities futures contracts and options, expected to bereclassified into earnings in the next 12 months was approximately $54.0 million after tax as of December 31,2009. This amount was primarily associated with commodities futures contracts.
Objectives, Strategies and Accounting Policies Associated with Derivative Instruments
We use certain derivative instruments, from time to time, to manage interest rate, foreign currency exchangerate and commodity market price risk exposures. We enter into interest rate swap agreements and foreignexchange forward contracts and options for periods consistent with their related underlying exposures. We enterinto commodities futures and options contracts for varying periods. Our commodities futures and optionscontracts are effective as hedges of market price risks associated with anticipated raw material purchases, energyrequirements and transportation costs.
We do not hold or issue derivative instruments for trading purposes and are not a party to any instrumentswith leverage or prepayment features. In entering into these contracts, we have assumed the risk that might arisefrom the possible inability of counterparties to meet the terms of their contracts. We mitigate this risk byperforming financial assessments prior to contract execution, conducting periodic evaluations of counterpartyperformance and maintaining a diverse portfolio of qualified counterparties. We do not expect any significantlosses from counterparty defaults.
Interest Rate Swaps
In order to minimize financing costs and to manage interest rate exposure, from time to time, we enter intointerest rate swap agreements. We included gains and losses on these interest rate swap agreements in othercomprehensive income. We recognize the gains and losses on these interest rate swap agreements as anadjustment to interest expense in the same period as the hedged interest payments affect earnings. We classifycash flows from interest rate swap agreements as net cash provided from operating activities on the ConsolidatedStatements of Cash Flows. Our risk related to the swap agreements is limited to the cost of replacing theagreements at prevailing market rates.
Foreign Exchange Forward Contracts and Options
We enter into foreign exchange forward contracts and options to hedge transactions primarily related tocommitments and forecasted purchases of equipment, raw materials and finished goods denominated in foreigncurrencies. We may also hedge payment of forecasted intercompany transactions with our subsidiaries outside
68
THE HERSHEY COMPANY
NOTES TO CONSOLIDATED FINANCIAL STATEMENTS—(Continued)
the United States. These contracts reduce currency risk from exchange rate movements. We generally hedgeforeign currency price risks for periods from 3 to 24 months. In entering into these contracts, we have assumedthe risk that might arise from the possible inability of counterparties to meet the terms of their contracts. We donot expect any significant losses from counterparty defaults.
Foreign exchange forward contracts and options are effective as hedges of identifiable foreign currencycommitments. Since there is a direct relationship between the foreign currency derivatives and the foreigncurrency denomination of the transactions, the derivatives are highly effective in hedging cash flows related totransactions denominated in the corresponding foreign currencies. We designate our foreign exchange forwardcontracts and options as cash flow hedging derivatives.
These contracts meet the criteria for cash flow hedge accounting treatment. We classify the fair value offoreign exchange forward contracts as prepaid expenses and other current assets, other non-current assets,accrued liabilities or other long-term liabilities on the Consolidated Balance Sheets. We report the offset to thefutures and options contracts in accumulated other comprehensive loss, net of income taxes. We record gains andlosses on these contracts as a component of other comprehensive income and reclassify them into earnings in thesame period during which the hedged transactions affect earnings. For hedges associated with the purchase ofequipment, we designate the related cash flows as net cash flows (used by) provided from investing activities onthe Consolidated Statements of Cash Flows. We classify cash flows from other foreign exchange forwardcontracts as net cash provided from operating activities.
As of December 31, 2009, the fair value of foreign exchange forward contracts with gains totaled $2.9 millionand the fair value of foreign exchange forward contracts with losses totaled $7.7 million. Over the last three yearsthe volume of activity for foreign exchange forward contracts to purchase foreign currencies ranged from a contractamount of $0.8 million to $31.9 million. Over the same period, the volume of activity for foreign exchange forwardcontracts to sell foreign currencies ranged from a contract amount of $14.7 million to $165.1 million.
Commodities Futures and Options Contracts
We enter into commodities futures and options contracts to reduce the effect of future price fluctuationsassociated with the purchase of raw materials, energy requirements and transportation services. We generallyhedge commodity price risks for 3 to 24 month periods. The commodities futures and options contracts arehighly effective in hedging price risks for our raw material requirements, energy requirements and transportationcosts. Because our commodities futures and options contracts meet hedge criteria, we account for them as cashflow hedges. Accordingly, we include gains and losses on hedging in other comprehensive income. We recognizegains and losses ratably in cost of sales in the same period that we record the hedged raw material requirementsin cost of sales.
We use exchange traded futures contracts to fix the price of unpriced physical forward purchase contracts.Physical forward purchase contracts meet the definition of “normal purchases and sales” and, therefore, are notaccounted for as derivative instruments. On a daily basis, we receive or make cash transfers reflecting changes inthe value of futures contracts (unrealized gains and losses). As mentioned above, such gains and losses areincluded as a component of other comprehensive income. The cash transfers offset higher or lower cashrequirements for payment of future invoice prices for raw materials, energy requirements and transportationcosts. Futures held in excess of the amount required to fix the price of unpriced physical forward contracts areeffective as hedges of anticipated purchases.
Over the last three years our total annual volume of futures and options traded in conjunction withcommodities hedging strategies ranged from approximately 55,000 to 75,000 contracts. We use futures andoptions contracts in combination with forward purchasing of cocoa products, sugar, corn sweeteners, natural gas,
69
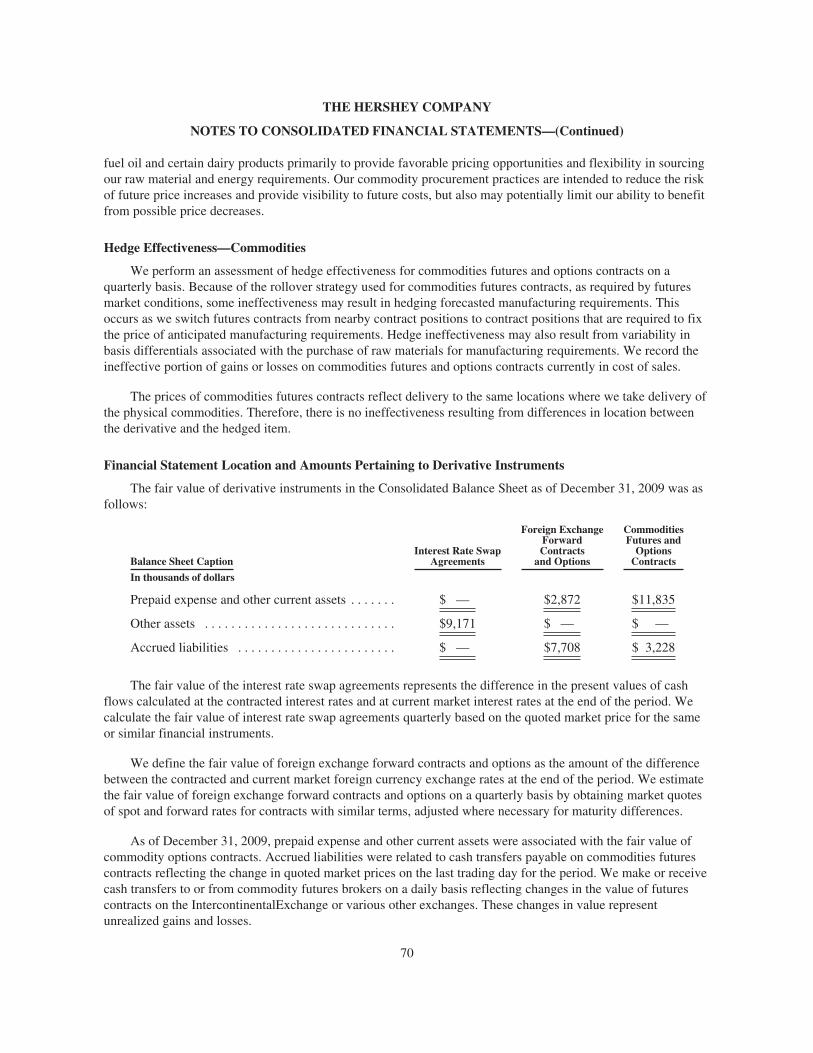
THE HERSHEY COMPANY
NOTES TO CONSOLIDATED FINANCIAL STATEMENTS—(Continued)
fuel oil and certain dairy products primarily to provide favorable pricing opportunities and flexibility in sourcingour raw material and energy requirements. Our commodity procurement practices are intended to reduce the riskof future price increases and provide visibility to future costs, but also may potentially limit our ability to benefitfrom possible price decreases.
Hedge Effectiveness—Commodities
We perform an assessment of hedge effectiveness for commodities futures and options contracts on aquarterly basis. Because of the rollover strategy used for commodities futures contracts, as required by futuresmarket conditions, some ineffectiveness may result in hedging forecasted manufacturing requirements. Thisoccurs as we switch futures contracts from nearby contract positions to contract positions that are required to fixthe price of anticipated manufacturing requirements. Hedge ineffectiveness may also result from variability inbasis differentials associated with the purchase of raw materials for manufacturing requirements. We record theineffective portion of gains or losses on commodities futures and options contracts currently in cost of sales.
The prices of commodities futures contracts reflect delivery to the same locations where we take delivery ofthe physical commodities. Therefore, there is no ineffectiveness resulting from differences in location betweenthe derivative and the hedged item.
Financial Statement Location and Amounts Pertaining to Derivative Instruments
The fair value of derivative instruments in the Consolidated Balance Sheet as of December 31, 2009 was asfollows:
Balance Sheet CaptionInterest Rate Swap
Agreements
Foreign ExchangeForwardContracts
and Options
CommoditiesFutures and
OptionsContracts
In thousands of dollars
Prepaid expense and other current assets . . . . . . . $ — $2,872 $11,835
Other assets . . . . . . . . . . . . . . . . . . . . . . . . . . . . . $9,171 $ — $ —
Accrued liabilities . . . . . . . . . . . . . . . . . . . . . . . . $ — $7,708 $ 3,228
The fair value of the interest rate swap agreements represents the difference in the present values of cashflows calculated at the contracted interest rates and at current market interest rates at the end of the period. Wecalculate the fair value of interest rate swap agreements quarterly based on the quoted market price for the sameor similar financial instruments.
We define the fair value of foreign exchange forward contracts and options as the amount of the differencebetween the contracted and current market foreign currency exchange rates at the end of the period. We estimatethe fair value of foreign exchange forward contracts and options on a quarterly basis by obtaining market quotesof spot and forward rates for contracts with similar terms, adjusted where necessary for maturity differences.
As of December 31, 2009, prepaid expense and other current assets were associated with the fair value ofcommodity options contracts. Accrued liabilities were related to cash transfers payable on commodities futurescontracts reflecting the change in quoted market prices on the last trading day for the period. We make or receivecash transfers to or from commodity futures brokers on a daily basis reflecting changes in the value of futurescontracts on the IntercontinentalExchange or various other exchanges. These changes in value representunrealized gains and losses.
70
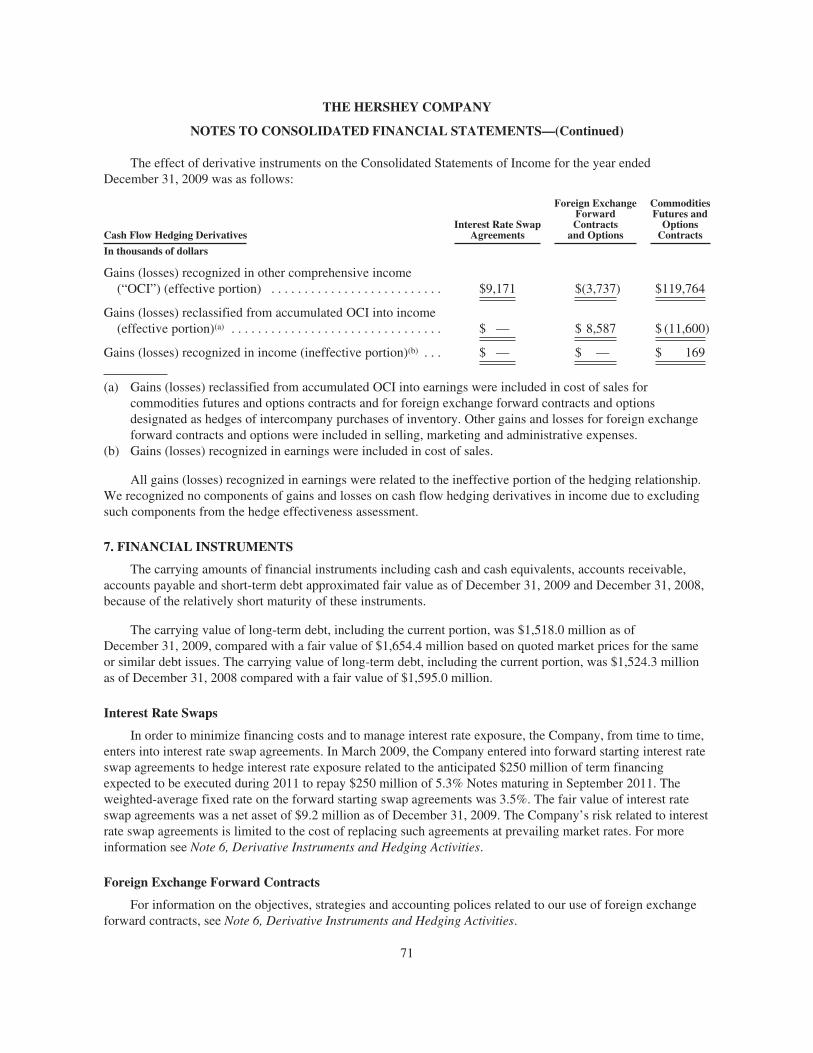
THE HERSHEY COMPANY
NOTES TO CONSOLIDATED FINANCIAL STATEMENTS—(Continued)
The effect of derivative instruments on the Consolidated Statements of Income for the year endedDecember 31, 2009 was as follows:
Cash Flow Hedging DerivativesInterest Rate Swap
Agreements
Foreign ExchangeForwardContracts
and Options
CommoditiesFutures and
OptionsContracts
In thousands of dollars
Gains (losses) recognized in other comprehensive income(“OCI”) (effective portion) . . . . . . . . . . . . . . . . . . . . . . . . . . $9,171 $(3,737) $119,764
Gains (losses) reclassified from accumulated OCI into income(effective portion)(a) . . . . . . . . . . . . . . . . . . . . . . . . . . . . . . . . $ — $ 8,587 $ (11,600)
Gains (losses) recognized in income (ineffective portion)(b) . . . $ — $ — $ 169
(a) Gains (losses) reclassified from accumulated OCI into earnings were included in cost of sales forcommodities futures and options contracts and for foreign exchange forward contracts and optionsdesignated as hedges of intercompany purchases of inventory. Other gains and losses for foreign exchangeforward contracts and options were included in selling, marketing and administrative expenses.
(b) Gains (losses) recognized in earnings were included in cost of sales.
All gains (losses) recognized in earnings were related to the ineffective portion of the hedging relationship.We recognized no components of gains and losses on cash flow hedging derivatives in income due to excludingsuch components from the hedge effectiveness assessment.
7. FINANCIAL INSTRUMENTS
The carrying amounts of financial instruments including cash and cash equivalents, accounts receivable,accounts payable and short-term debt approximated fair value as of December 31, 2009 and December 31, 2008,because of the relatively short maturity of these instruments.
The carrying value of long-term debt, including the current portion, was $1,518.0 million as ofDecember 31, 2009, compared with a fair value of $1,654.4 million based on quoted market prices for the sameor similar debt issues. The carrying value of long-term debt, including the current portion, was $1,524.3 millionas of December 31, 2008 compared with a fair value of $1,595.0 million.
Interest Rate Swaps
In order to minimize financing costs and to manage interest rate exposure, the Company, from time to time,enters into interest rate swap agreements. In March 2009, the Company entered into forward starting interest rateswap agreements to hedge interest rate exposure related to the anticipated $250 million of term financingexpected to be executed during 2011 to repay $250 million of 5.3% Notes maturing in September 2011. Theweighted-average fixed rate on the forward starting swap agreements was 3.5%. The fair value of interest rateswap agreements was a net asset of $9.2 million as of December 31, 2009. The Company’s risk related to interestrate swap agreements is limited to the cost of replacing such agreements at prevailing market rates. For moreinformation see Note 6, Derivative Instruments and Hedging Activities.
Foreign Exchange Forward Contracts
For information on the objectives, strategies and accounting polices related to our use of foreign exchangeforward contracts, see Note 6, Derivative Instruments and Hedging Activities.
71
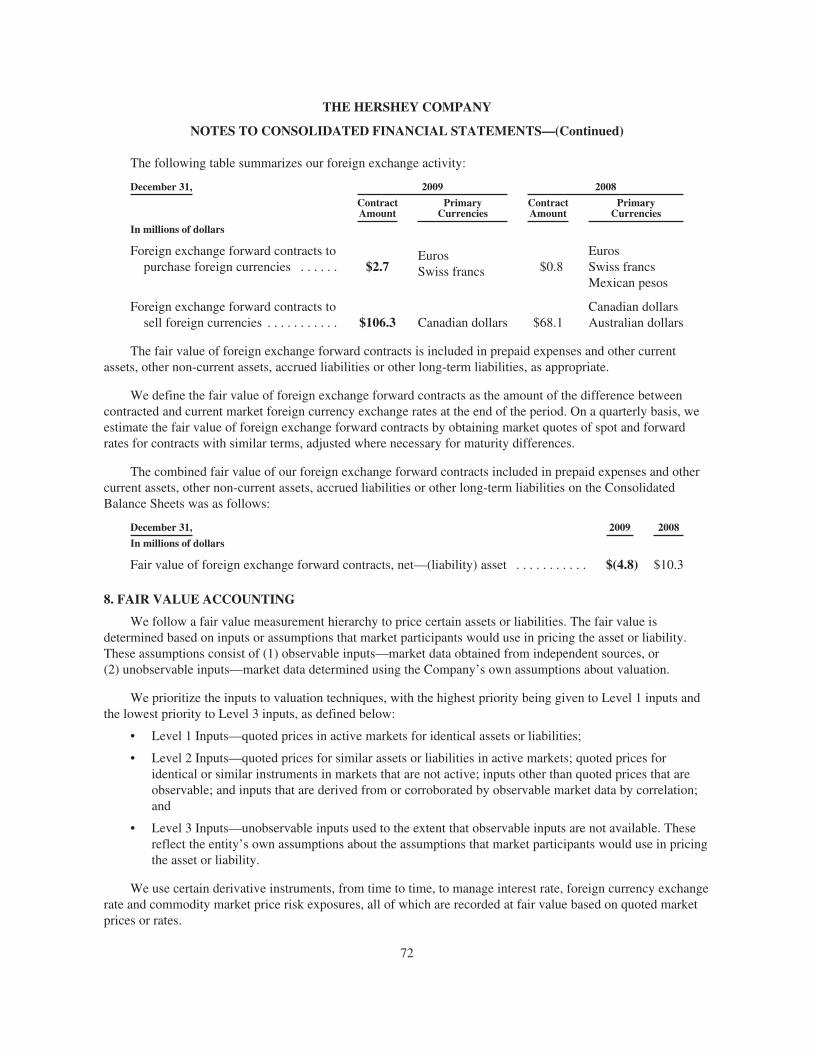
THE HERSHEY COMPANY
NOTES TO CONSOLIDATED FINANCIAL STATEMENTS—(Continued)
The following table summarizes our foreign exchange activity:
December 31, 2009 2008
ContractAmount
PrimaryCurrencies
ContractAmount
PrimaryCurrencies
In millions of dollars
Foreign exchange forward contracts topurchase foreign currencies . . . . . . $2.7
EurosSwiss francs $0.8
EurosSwiss francsMexican pesos
Foreign exchange forward contracts tosell foreign currencies . . . . . . . . . . . $106.3 Canadian dollars $68.1
Canadian dollarsAustralian dollars
The fair value of foreign exchange forward contracts is included in prepaid expenses and other currentassets, other non-current assets, accrued liabilities or other long-term liabilities, as appropriate.
We define the fair value of foreign exchange forward contracts as the amount of the difference betweencontracted and current market foreign currency exchange rates at the end of the period. On a quarterly basis, weestimate the fair value of foreign exchange forward contracts by obtaining market quotes of spot and forwardrates for contracts with similar terms, adjusted where necessary for maturity differences.
The combined fair value of our foreign exchange forward contracts included in prepaid expenses and othercurrent assets, other non-current assets, accrued liabilities or other long-term liabilities on the ConsolidatedBalance Sheets was as follows:
December 31, 2009 2008
In millions of dollars
Fair value of foreign exchange forward contracts, net—(liability) asset . . . . . . . . . . . $(4.8) $10.3
8. FAIR VALUE ACCOUNTING
We follow a fair value measurement hierarchy to price certain assets or liabilities. The fair value isdetermined based on inputs or assumptions that market participants would use in pricing the asset or liability.These assumptions consist of (1) observable inputs—market data obtained from independent sources, or(2) unobservable inputs—market data determined using the Company’s own assumptions about valuation.
We prioritize the inputs to valuation techniques, with the highest priority being given to Level 1 inputs andthe lowest priority to Level 3 inputs, as defined below:
• Level 1 Inputs—quoted prices in active markets for identical assets or liabilities;
• Level 2 Inputs—quoted prices for similar assets or liabilities in active markets; quoted prices foridentical or similar instruments in markets that are not active; inputs other than quoted prices that areobservable; and inputs that are derived from or corroborated by observable market data by correlation;and
• Level 3 Inputs—unobservable inputs used to the extent that observable inputs are not available. Thesereflect the entity’s own assumptions about the assumptions that market participants would use in pricingthe asset or liability.
We use certain derivative instruments, from time to time, to manage interest rate, foreign currency exchangerate and commodity market price risk exposures, all of which are recorded at fair value based on quoted marketprices or rates.
72
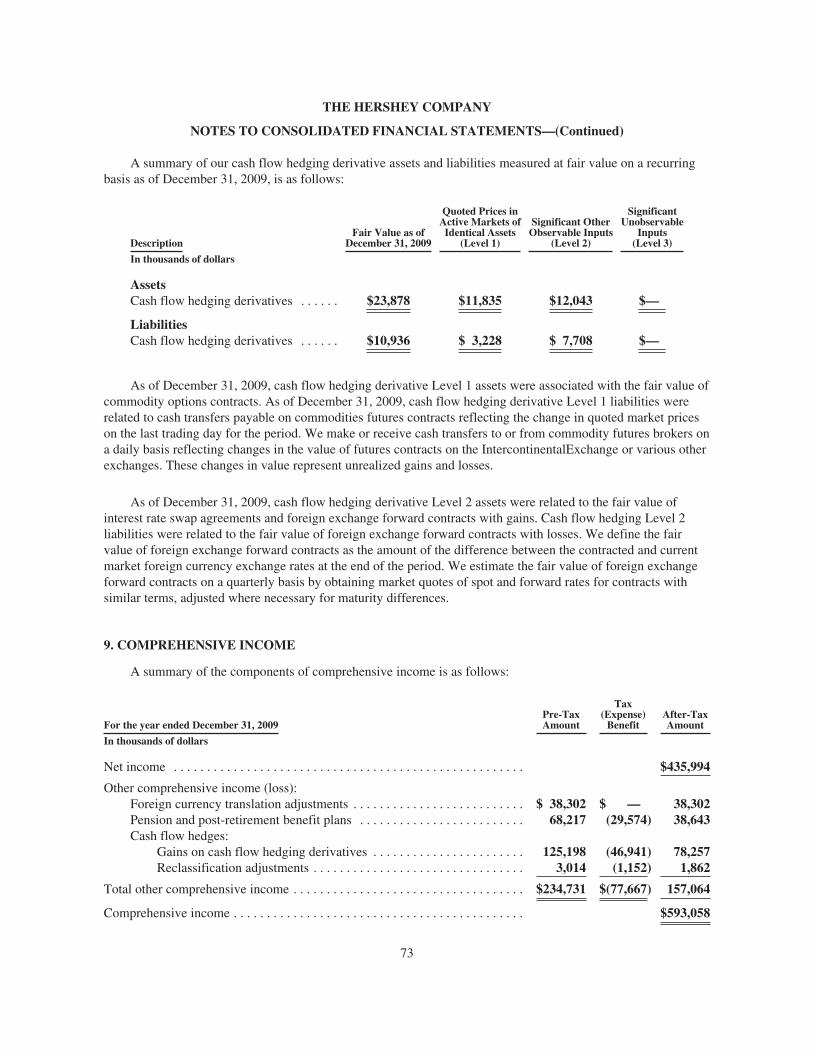
THE HERSHEY COMPANY
NOTES TO CONSOLIDATED FINANCIAL STATEMENTS—(Continued)
A summary of our cash flow hedging derivative assets and liabilities measured at fair value on a recurringbasis as of December 31, 2009, is as follows:
DescriptionFair Value as of
December 31, 2009
Quoted Prices inActive Markets ofIdentical Assets
(Level 1)
Significant OtherObservable Inputs
(Level 2)
SignificantUnobservable
Inputs(Level 3)
In thousands of dollars
AssetsCash flow hedging derivatives . . . . . . $23,878 $11,835 $12,043 $—
LiabilitiesCash flow hedging derivatives . . . . . . $10,936 $ 3,228 $ 7,708 $—
As of December 31, 2009, cash flow hedging derivative Level 1 assets were associated with the fair value ofcommodity options contracts. As of December 31, 2009, cash flow hedging derivative Level 1 liabilities wererelated to cash transfers payable on commodities futures contracts reflecting the change in quoted market priceson the last trading day for the period. We make or receive cash transfers to or from commodity futures brokers ona daily basis reflecting changes in the value of futures contracts on the IntercontinentalExchange or various otherexchanges. These changes in value represent unrealized gains and losses.
As of December 31, 2009, cash flow hedging derivative Level 2 assets were related to the fair value ofinterest rate swap agreements and foreign exchange forward contracts with gains. Cash flow hedging Level 2liabilities were related to the fair value of foreign exchange forward contracts with losses. We define the fairvalue of foreign exchange forward contracts as the amount of the difference between the contracted and currentmarket foreign currency exchange rates at the end of the period. We estimate the fair value of foreign exchangeforward contracts on a quarterly basis by obtaining market quotes of spot and forward rates for contracts withsimilar terms, adjusted where necessary for maturity differences.
9. COMPREHENSIVE INCOME
A summary of the components of comprehensive income is as follows:
For the year ended December 31, 2009Pre-TaxAmount
Tax(Expense)
BenefitAfter-TaxAmount
In thousands of dollars
Net income . . . . . . . . . . . . . . . . . . . . . . . . . . . . . . . . . . . . . . . . . . . . . . . . . . . . . $435,994
Other comprehensive income (loss):Foreign currency translation adjustments . . . . . . . . . . . . . . . . . . . . . . . . . . $ 38,302 $ — 38,302Pension and post-retirement benefit plans . . . . . . . . . . . . . . . . . . . . . . . . . 68,217 (29,574) 38,643Cash flow hedges:
Gains on cash flow hedging derivatives . . . . . . . . . . . . . . . . . . . . . . . 125,198 (46,941) 78,257Reclassification adjustments . . . . . . . . . . . . . . . . . . . . . . . . . . . . . . . . 3,014 (1,152) 1,862
Total other comprehensive income . . . . . . . . . . . . . . . . . . . . . . . . . . . . . . . . . . . $234,731 $(77,667) 157,064
Comprehensive income . . . . . . . . . . . . . . . . . . . . . . . . . . . . . . . . . . . . . . . . . . . . $593,058
73
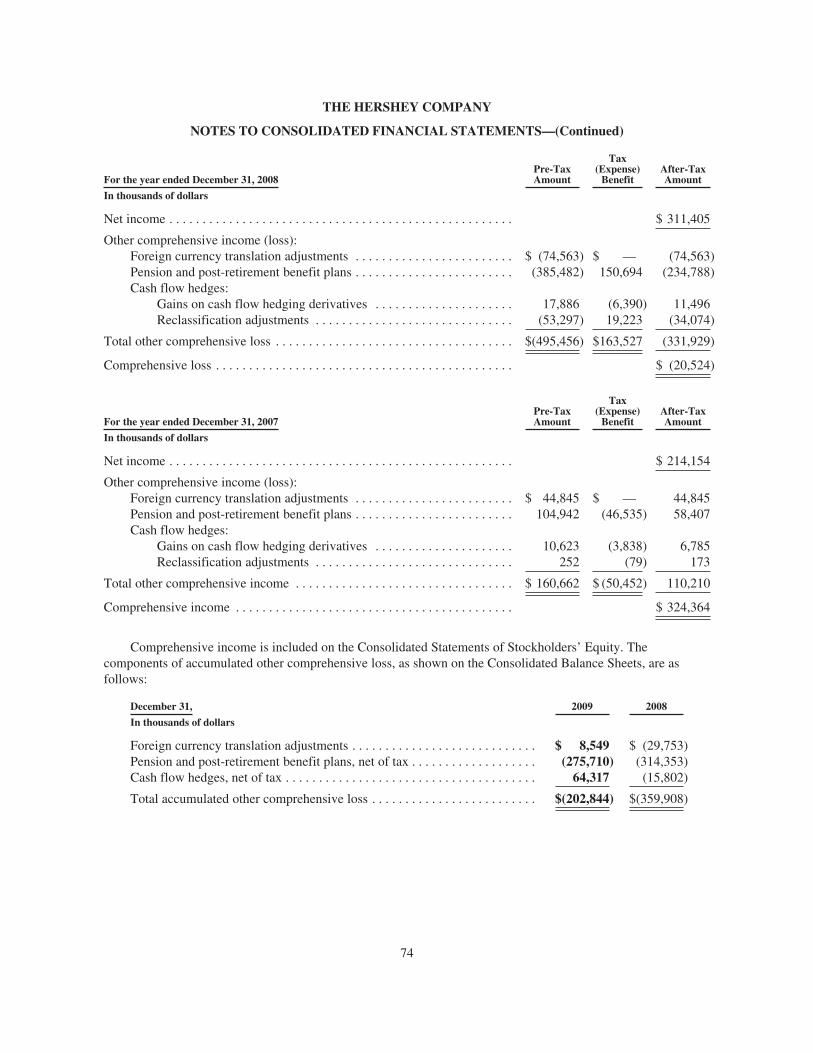
THE HERSHEY COMPANY
NOTES TO CONSOLIDATED FINANCIAL STATEMENTS—(Continued)
For the year ended December 31, 2008Pre-TaxAmount
Tax(Expense)
BenefitAfter-TaxAmount
In thousands of dollars
Net income . . . . . . . . . . . . . . . . . . . . . . . . . . . . . . . . . . . . . . . . . . . . . . . . . . . . $ 311,405
Other comprehensive income (loss):Foreign currency translation adjustments . . . . . . . . . . . . . . . . . . . . . . . . $ (74,563) $ — (74,563)Pension and post-retirement benefit plans . . . . . . . . . . . . . . . . . . . . . . . . (385,482) 150,694 (234,788)Cash flow hedges:
Gains on cash flow hedging derivatives . . . . . . . . . . . . . . . . . . . . . 17,886 (6,390) 11,496Reclassification adjustments . . . . . . . . . . . . . . . . . . . . . . . . . . . . . . (53,297) 19,223 (34,074)
Total other comprehensive loss . . . . . . . . . . . . . . . . . . . . . . . . . . . . . . . . . . . . $(495,456) $163,527 (331,929)
Comprehensive loss . . . . . . . . . . . . . . . . . . . . . . . . . . . . . . . . . . . . . . . . . . . . . $ (20,524)
For the year ended December 31, 2007Pre-TaxAmount
Tax(Expense)
BenefitAfter-TaxAmount
In thousands of dollars
Net income . . . . . . . . . . . . . . . . . . . . . . . . . . . . . . . . . . . . . . . . . . . . . . . . . . . . $ 214,154
Other comprehensive income (loss):Foreign currency translation adjustments . . . . . . . . . . . . . . . . . . . . . . . . $ 44,845 $ — 44,845Pension and post-retirement benefit plans . . . . . . . . . . . . . . . . . . . . . . . . 104,942 (46,535) 58,407Cash flow hedges:
Gains on cash flow hedging derivatives . . . . . . . . . . . . . . . . . . . . . 10,623 (3,838) 6,785Reclassification adjustments . . . . . . . . . . . . . . . . . . . . . . . . . . . . . . 252 (79) 173
Total other comprehensive income . . . . . . . . . . . . . . . . . . . . . . . . . . . . . . . . . $ 160,662 $ (50,452) 110,210
Comprehensive income . . . . . . . . . . . . . . . . . . . . . . . . . . . . . . . . . . . . . . . . . . $ 324,364
Comprehensive income is included on the Consolidated Statements of Stockholders’ Equity. Thecomponents of accumulated other comprehensive loss, as shown on the Consolidated Balance Sheets, are asfollows:
December 31, 2009 2008
In thousands of dollars
Foreign currency translation adjustments . . . . . . . . . . . . . . . . . . . . . . . . . . . . $ 8,549 $ (29,753)Pension and post-retirement benefit plans, net of tax . . . . . . . . . . . . . . . . . . . (275,710) (314,353)Cash flow hedges, net of tax . . . . . . . . . . . . . . . . . . . . . . . . . . . . . . . . . . . . . . 64,317 (15,802)
Total accumulated other comprehensive loss . . . . . . . . . . . . . . . . . . . . . . . . . $(202,844) $(359,908)
74
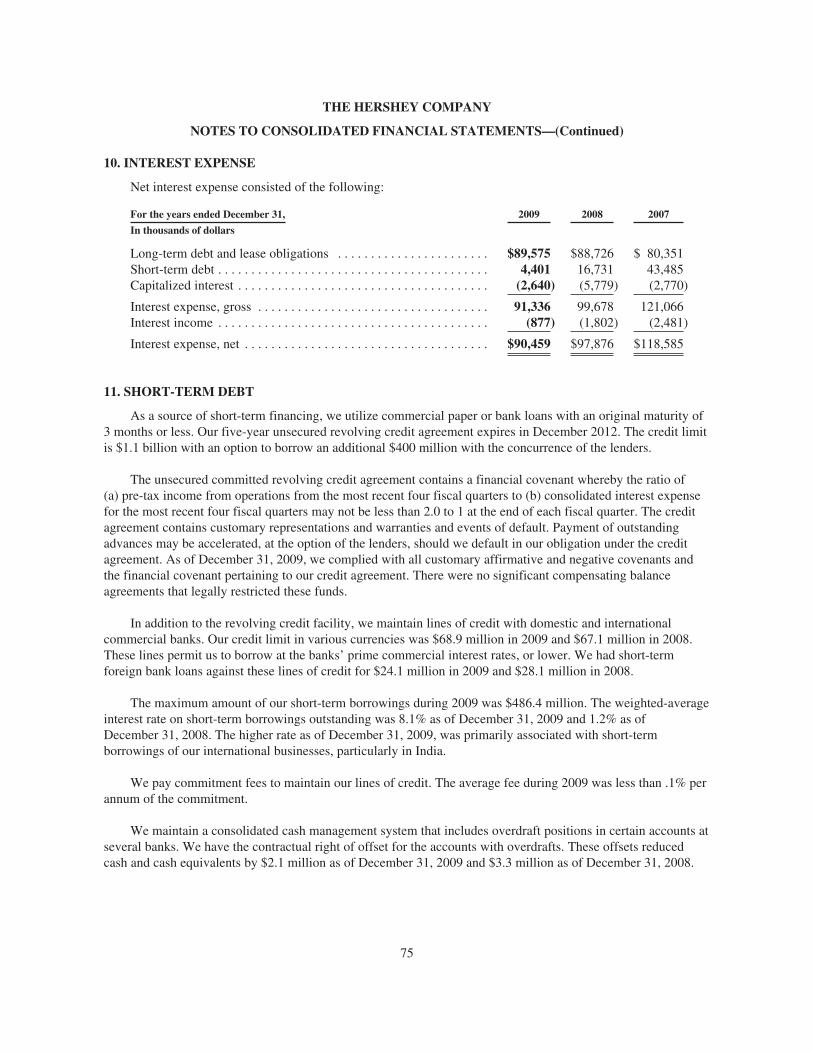
THE HERSHEY COMPANY
NOTES TO CONSOLIDATED FINANCIAL STATEMENTS—(Continued)
10. INTEREST EXPENSE
Net interest expense consisted of the following:
For the years ended December 31, 2009 2008 2007
In thousands of dollars
Long-term debt and lease obligations . . . . . . . . . . . . . . . . . . . . . . . $89,575 $88,726 $ 80,351Short-term debt . . . . . . . . . . . . . . . . . . . . . . . . . . . . . . . . . . . . . . . . . 4,401 16,731 43,485Capitalized interest . . . . . . . . . . . . . . . . . . . . . . . . . . . . . . . . . . . . . . (2,640) (5,779) (2,770)
Interest expense, gross . . . . . . . . . . . . . . . . . . . . . . . . . . . . . . . . . . . 91,336 99,678 121,066Interest income . . . . . . . . . . . . . . . . . . . . . . . . . . . . . . . . . . . . . . . . . (877) (1,802) (2,481)
Interest expense, net . . . . . . . . . . . . . . . . . . . . . . . . . . . . . . . . . . . . . $90,459 $97,876 $118,585
11. SHORT-TERM DEBT
As a source of short-term financing, we utilize commercial paper or bank loans with an original maturity of3 months or less. Our five-year unsecured revolving credit agreement expires in December 2012. The credit limitis $1.1 billion with an option to borrow an additional $400 million with the concurrence of the lenders.
The unsecured committed revolving credit agreement contains a financial covenant whereby the ratio of(a) pre-tax income from operations from the most recent four fiscal quarters to (b) consolidated interest expensefor the most recent four fiscal quarters may not be less than 2.0 to 1 at the end of each fiscal quarter. The creditagreement contains customary representations and warranties and events of default. Payment of outstandingadvances may be accelerated, at the option of the lenders, should we default in our obligation under the creditagreement. As of December 31, 2009, we complied with all customary affirmative and negative covenants andthe financial covenant pertaining to our credit agreement. There were no significant compensating balanceagreements that legally restricted these funds.
In addition to the revolving credit facility, we maintain lines of credit with domestic and internationalcommercial banks. Our credit limit in various currencies was $68.9 million in 2009 and $67.1 million in 2008.These lines permit us to borrow at the banks’ prime commercial interest rates, or lower. We had short-termforeign bank loans against these lines of credit for $24.1 million in 2009 and $28.1 million in 2008.
The maximum amount of our short-term borrowings during 2009 was $486.4 million. The weighted-averageinterest rate on short-term borrowings outstanding was 8.1% as of December 31, 2009 and 1.2% as ofDecember 31, 2008. The higher rate as of December 31, 2009, was primarily associated with short-termborrowings of our international businesses, particularly in India.
We pay commitment fees to maintain our lines of credit. The average fee during 2009 was less than .1% perannum of the commitment.
We maintain a consolidated cash management system that includes overdraft positions in certain accounts atseveral banks. We have the contractual right of offset for the accounts with overdrafts. These offsets reducedcash and cash equivalents by $2.1 million as of December 31, 2009 and $3.3 million as of December 31, 2008.
75
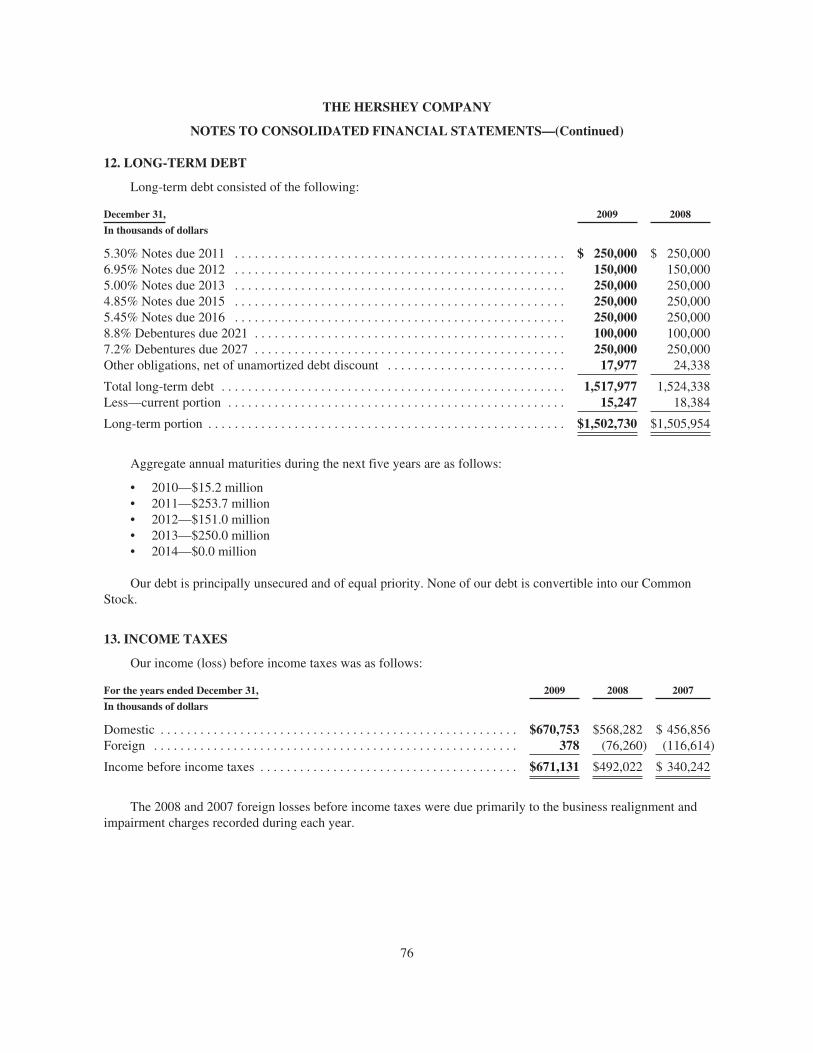
THE HERSHEY COMPANY
NOTES TO CONSOLIDATED FINANCIAL STATEMENTS—(Continued)
12. LONG-TERM DEBT
Long-term debt consisted of the following:
December 31, 2009 2008
In thousands of dollars
5.30% Notes due 2011 . . . . . . . . . . . . . . . . . . . . . . . . . . . . . . . . . . . . . . . . . . . . . . . . . . $ 250,000 $ 250,0006.95% Notes due 2012 . . . . . . . . . . . . . . . . . . . . . . . . . . . . . . . . . . . . . . . . . . . . . . . . . . 150,000 150,0005.00% Notes due 2013 . . . . . . . . . . . . . . . . . . . . . . . . . . . . . . . . . . . . . . . . . . . . . . . . . . 250,000 250,0004.85% Notes due 2015 . . . . . . . . . . . . . . . . . . . . . . . . . . . . . . . . . . . . . . . . . . . . . . . . . . 250,000 250,0005.45% Notes due 2016 . . . . . . . . . . . . . . . . . . . . . . . . . . . . . . . . . . . . . . . . . . . . . . . . . . 250,000 250,0008.8% Debentures due 2021 . . . . . . . . . . . . . . . . . . . . . . . . . . . . . . . . . . . . . . . . . . . . . . . 100,000 100,0007.2% Debentures due 2027 . . . . . . . . . . . . . . . . . . . . . . . . . . . . . . . . . . . . . . . . . . . . . . . 250,000 250,000Other obligations, net of unamortized debt discount . . . . . . . . . . . . . . . . . . . . . . . . . . . 17,977 24,338
Total long-term debt . . . . . . . . . . . . . . . . . . . . . . . . . . . . . . . . . . . . . . . . . . . . . . . . . . . . 1,517,977 1,524,338Less—current portion . . . . . . . . . . . . . . . . . . . . . . . . . . . . . . . . . . . . . . . . . . . . . . . . . . . 15,247 18,384
Long-term portion . . . . . . . . . . . . . . . . . . . . . . . . . . . . . . . . . . . . . . . . . . . . . . . . . . . . . . $1,502,730 $1,505,954
Aggregate annual maturities during the next five years are as follows:
• 2010—$15.2 million• 2011—$253.7 million• 2012—$151.0 million• 2013—$250.0 million• 2014—$0.0 million
Our debt is principally unsecured and of equal priority. None of our debt is convertible into our CommonStock.
13. INCOME TAXES
Our income (loss) before income taxes was as follows:
For the years ended December 31, 2009 2008 2007
In thousands of dollars
Domestic . . . . . . . . . . . . . . . . . . . . . . . . . . . . . . . . . . . . . . . . . . . . . . . . . . . . . . $670,753 $568,282 $ 456,856Foreign . . . . . . . . . . . . . . . . . . . . . . . . . . . . . . . . . . . . . . . . . . . . . . . . . . . . . . . 378 (76,260) (116,614)
Income before income taxes . . . . . . . . . . . . . . . . . . . . . . . . . . . . . . . . . . . . . . . $671,131 $492,022 $ 340,242
The 2008 and 2007 foreign losses before income taxes were due primarily to the business realignment andimpairment charges recorded during each year.
76
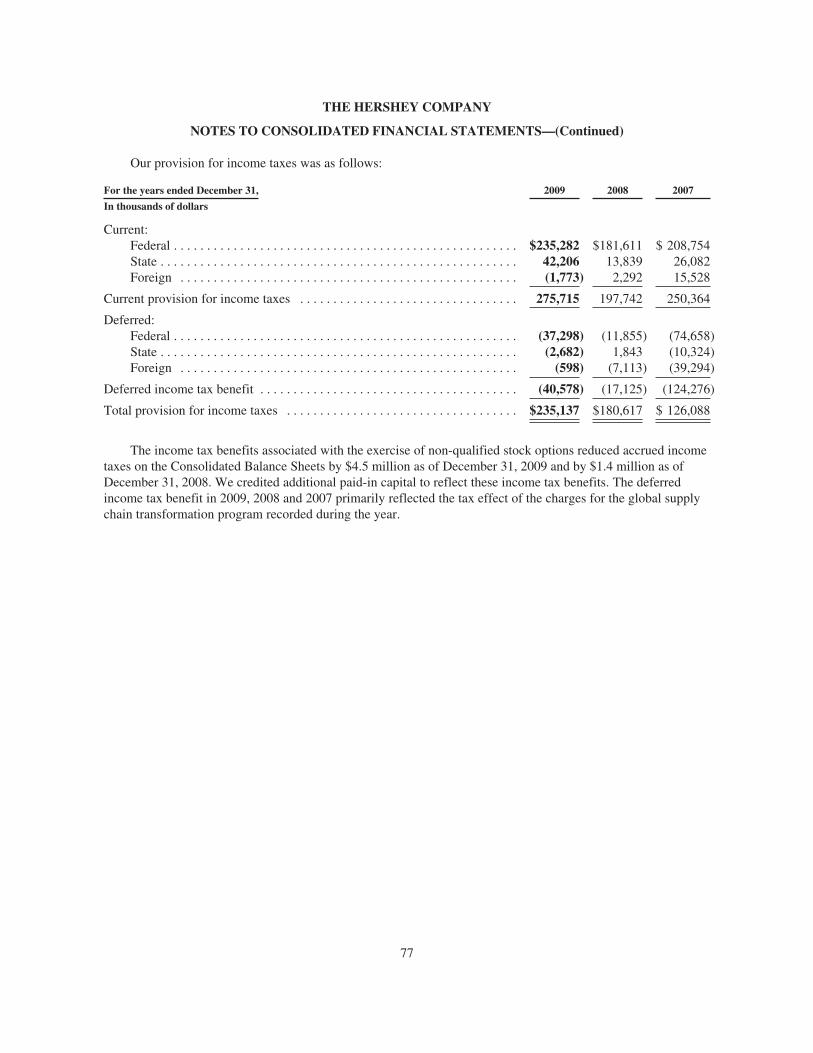
THE HERSHEY COMPANY
NOTES TO CONSOLIDATED FINANCIAL STATEMENTS—(Continued)
Our provision for income taxes was as follows:
For the years ended December 31, 2009 2008 2007
In thousands of dollars
Current:Federal . . . . . . . . . . . . . . . . . . . . . . . . . . . . . . . . . . . . . . . . . . . . . . . . . . . . $235,282 $181,611 $ 208,754State . . . . . . . . . . . . . . . . . . . . . . . . . . . . . . . . . . . . . . . . . . . . . . . . . . . . . . 42,206 13,839 26,082Foreign . . . . . . . . . . . . . . . . . . . . . . . . . . . . . . . . . . . . . . . . . . . . . . . . . . . (1,773) 2,292 15,528
Current provision for income taxes . . . . . . . . . . . . . . . . . . . . . . . . . . . . . . . . . 275,715 197,742 250,364
Deferred:Federal . . . . . . . . . . . . . . . . . . . . . . . . . . . . . . . . . . . . . . . . . . . . . . . . . . . . (37,298) (11,855) (74,658)State . . . . . . . . . . . . . . . . . . . . . . . . . . . . . . . . . . . . . . . . . . . . . . . . . . . . . . (2,682) 1,843 (10,324)Foreign . . . . . . . . . . . . . . . . . . . . . . . . . . . . . . . . . . . . . . . . . . . . . . . . . . . (598) (7,113) (39,294)
Deferred income tax benefit . . . . . . . . . . . . . . . . . . . . . . . . . . . . . . . . . . . . . . . (40,578) (17,125) (124,276)
Total provision for income taxes . . . . . . . . . . . . . . . . . . . . . . . . . . . . . . . . . . . $235,137 $180,617 $ 126,088
The income tax benefits associated with the exercise of non-qualified stock options reduced accrued incometaxes on the Consolidated Balance Sheets by $4.5 million as of December 31, 2009 and by $1.4 million as ofDecember 31, 2008. We credited additional paid-in capital to reflect these income tax benefits. The deferredincome tax benefit in 2009, 2008 and 2007 primarily reflected the tax effect of the charges for the global supplychain transformation program recorded during the year.
77
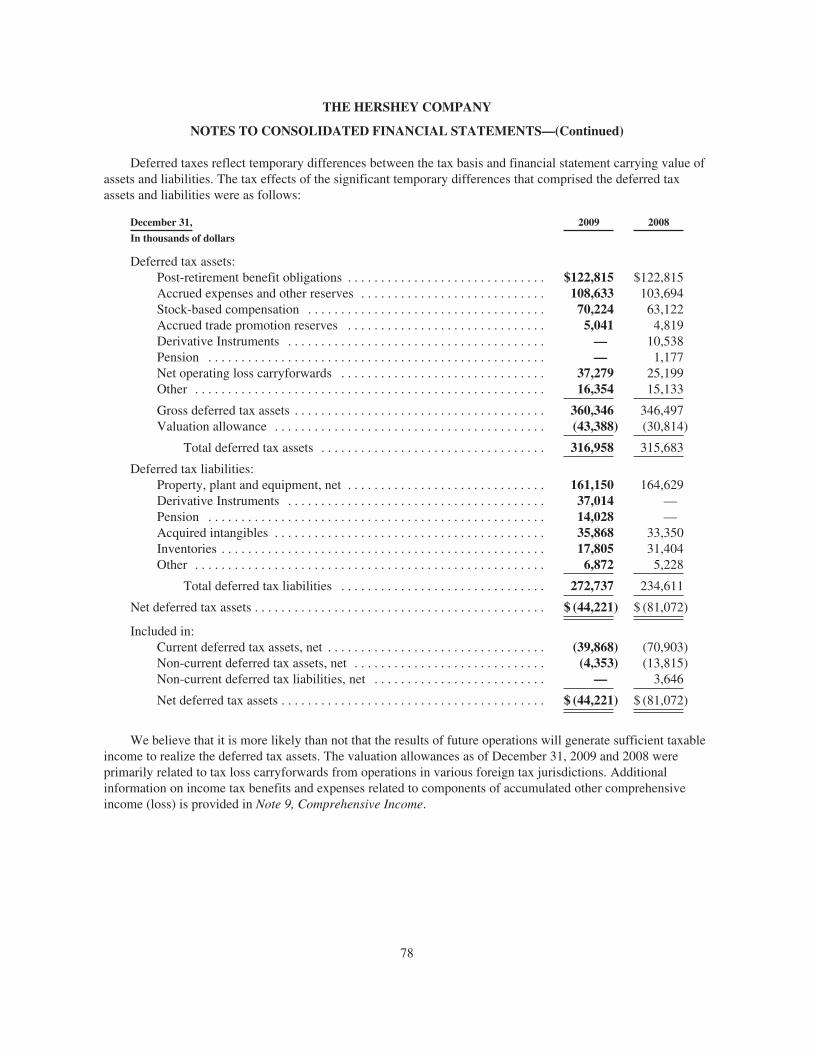
THE HERSHEY COMPANY
NOTES TO CONSOLIDATED FINANCIAL STATEMENTS—(Continued)
Deferred taxes reflect temporary differences between the tax basis and financial statement carrying value ofassets and liabilities. The tax effects of the significant temporary differences that comprised the deferred taxassets and liabilities were as follows:
December 31, 2009 2008
In thousands of dollars
Deferred tax assets:Post-retirement benefit obligations . . . . . . . . . . . . . . . . . . . . . . . . . . . . . . $122,815 $122,815Accrued expenses and other reserves . . . . . . . . . . . . . . . . . . . . . . . . . . . . 108,633 103,694Stock-based compensation . . . . . . . . . . . . . . . . . . . . . . . . . . . . . . . . . . . . 70,224 63,122Accrued trade promotion reserves . . . . . . . . . . . . . . . . . . . . . . . . . . . . . . 5,041 4,819Derivative Instruments . . . . . . . . . . . . . . . . . . . . . . . . . . . . . . . . . . . . . . . — 10,538Pension . . . . . . . . . . . . . . . . . . . . . . . . . . . . . . . . . . . . . . . . . . . . . . . . . . . — 1,177Net operating loss carryforwards . . . . . . . . . . . . . . . . . . . . . . . . . . . . . . . 37,279 25,199Other . . . . . . . . . . . . . . . . . . . . . . . . . . . . . . . . . . . . . . . . . . . . . . . . . . . . . 16,354 15,133
Gross deferred tax assets . . . . . . . . . . . . . . . . . . . . . . . . . . . . . . . . . . . . . . 360,346 346,497Valuation allowance . . . . . . . . . . . . . . . . . . . . . . . . . . . . . . . . . . . . . . . . . (43,388) (30,814)
Total deferred tax assets . . . . . . . . . . . . . . . . . . . . . . . . . . . . . . . . . . 316,958 315,683
Deferred tax liabilities:Property, plant and equipment, net . . . . . . . . . . . . . . . . . . . . . . . . . . . . . . 161,150 164,629Derivative Instruments . . . . . . . . . . . . . . . . . . . . . . . . . . . . . . . . . . . . . . . 37,014 —Pension . . . . . . . . . . . . . . . . . . . . . . . . . . . . . . . . . . . . . . . . . . . . . . . . . . . 14,028 —Acquired intangibles . . . . . . . . . . . . . . . . . . . . . . . . . . . . . . . . . . . . . . . . . 35,868 33,350Inventories . . . . . . . . . . . . . . . . . . . . . . . . . . . . . . . . . . . . . . . . . . . . . . . . . 17,805 31,404Other . . . . . . . . . . . . . . . . . . . . . . . . . . . . . . . . . . . . . . . . . . . . . . . . . . . . . 6,872 5,228
Total deferred tax liabilities . . . . . . . . . . . . . . . . . . . . . . . . . . . . . . . 272,737 234,611
Net deferred tax assets . . . . . . . . . . . . . . . . . . . . . . . . . . . . . . . . . . . . . . . . . . . . $ (44,221) $ (81,072)
Included in:Current deferred tax assets, net . . . . . . . . . . . . . . . . . . . . . . . . . . . . . . . . . (39,868) (70,903)Non-current deferred tax assets, net . . . . . . . . . . . . . . . . . . . . . . . . . . . . . (4,353) (13,815)Non-current deferred tax liabilities, net . . . . . . . . . . . . . . . . . . . . . . . . . . — 3,646
Net deferred tax assets . . . . . . . . . . . . . . . . . . . . . . . . . . . . . . . . . . . . . . . . $ (44,221) $ (81,072)
We believe that it is more likely than not that the results of future operations will generate sufficient taxableincome to realize the deferred tax assets. The valuation allowances as of December 31, 2009 and 2008 wereprimarily related to tax loss carryforwards from operations in various foreign tax jurisdictions. Additionalinformation on income tax benefits and expenses related to components of accumulated other comprehensiveincome (loss) is provided in Note 9, Comprehensive Income.
78
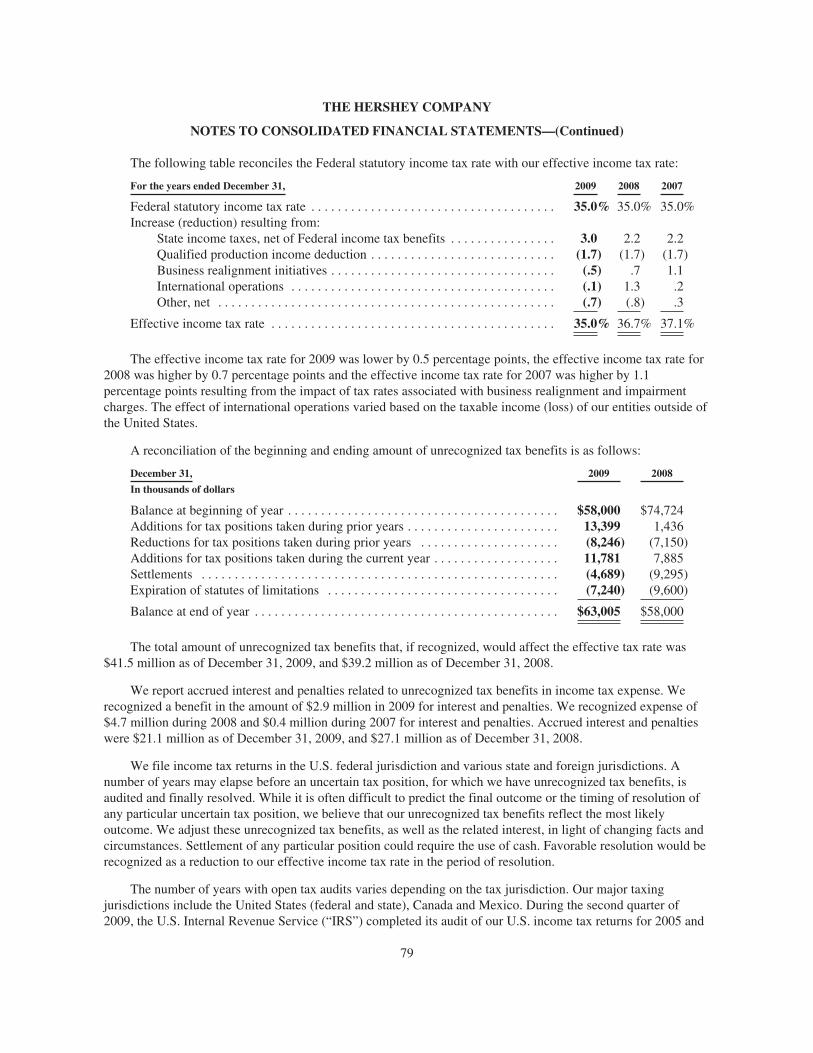
THE HERSHEY COMPANY
NOTES TO CONSOLIDATED FINANCIAL STATEMENTS—(Continued)
The following table reconciles the Federal statutory income tax rate with our effective income tax rate:
For the years ended December 31, 2009 2008 2007
Federal statutory income tax rate . . . . . . . . . . . . . . . . . . . . . . . . . . . . . . . . . . . . . 35.0% 35.0% 35.0%Increase (reduction) resulting from:
State income taxes, net of Federal income tax benefits . . . . . . . . . . . . . . . . 3.0 2.2 2.2Qualified production income deduction . . . . . . . . . . . . . . . . . . . . . . . . . . . . (1.7) (1.7) (1.7)Business realignment initiatives . . . . . . . . . . . . . . . . . . . . . . . . . . . . . . . . . . (.5) .7 1.1International operations . . . . . . . . . . . . . . . . . . . . . . . . . . . . . . . . . . . . . . . . (.1) 1.3 .2Other, net . . . . . . . . . . . . . . . . . . . . . . . . . . . . . . . . . . . . . . . . . . . . . . . . . . . (.7) (.8) .3
Effective income tax rate . . . . . . . . . . . . . . . . . . . . . . . . . . . . . . . . . . . . . . . . . . . 35.0% 36.7% 37.1%
The effective income tax rate for 2009 was lower by 0.5 percentage points, the effective income tax rate for2008 was higher by 0.7 percentage points and the effective income tax rate for 2007 was higher by 1.1percentage points resulting from the impact of tax rates associated with business realignment and impairmentcharges. The effect of international operations varied based on the taxable income (loss) of our entities outside ofthe United States.
A reconciliation of the beginning and ending amount of unrecognized tax benefits is as follows:
December 31, 2009 2008
In thousands of dollars
Balance at beginning of year . . . . . . . . . . . . . . . . . . . . . . . . . . . . . . . . . . . . . . . . . $58,000 $74,724Additions for tax positions taken during prior years . . . . . . . . . . . . . . . . . . . . . . . 13,399 1,436Reductions for tax positions taken during prior years . . . . . . . . . . . . . . . . . . . . . (8,246) (7,150)Additions for tax positions taken during the current year . . . . . . . . . . . . . . . . . . . 11,781 7,885Settlements . . . . . . . . . . . . . . . . . . . . . . . . . . . . . . . . . . . . . . . . . . . . . . . . . . . . . . (4,689) (9,295)Expiration of statutes of limitations . . . . . . . . . . . . . . . . . . . . . . . . . . . . . . . . . . . (7,240) (9,600)
Balance at end of year . . . . . . . . . . . . . . . . . . . . . . . . . . . . . . . . . . . . . . . . . . . . . . $63,005 $58,000
The total amount of unrecognized tax benefits that, if recognized, would affect the effective tax rate was$41.5 million as of December 31, 2009, and $39.2 million as of December 31, 2008.
We report accrued interest and penalties related to unrecognized tax benefits in income tax expense. Werecognized a benefit in the amount of $2.9 million in 2009 for interest and penalties. We recognized expense of$4.7 million during 2008 and $0.4 million during 2007 for interest and penalties. Accrued interest and penaltieswere $21.1 million as of December 31, 2009, and $27.1 million as of December 31, 2008.
We file income tax returns in the U.S. federal jurisdiction and various state and foreign jurisdictions. Anumber of years may elapse before an uncertain tax position, for which we have unrecognized tax benefits, isaudited and finally resolved. While it is often difficult to predict the final outcome or the timing of resolution ofany particular uncertain tax position, we believe that our unrecognized tax benefits reflect the most likelyoutcome. We adjust these unrecognized tax benefits, as well as the related interest, in light of changing facts andcircumstances. Settlement of any particular position could require the use of cash. Favorable resolution would berecognized as a reduction to our effective income tax rate in the period of resolution.
The number of years with open tax audits varies depending on the tax jurisdiction. Our major taxingjurisdictions include the United States (federal and state), Canada and Mexico. During the second quarter of2009, the U.S. Internal Revenue Service (“IRS”) completed its audit of our U.S. income tax returns for 2005 and
79
THE HERSHEY COMPANY
NOTES TO CONSOLIDATED FINANCIAL STATEMENTS—(Continued)
2006 resulting in the resolution of tax contingencies associated with the 2004, 2005 and 2006 tax years. Duringthe fourth quarter of 2009, the IRS commenced its audit of our U.S. income tax returns for 2007 and 2008. Taxexaminations by various state taxing authorities could generally be conducted for years beginning in 2004. Weare no longer subject to Canadian federal income tax examinations by the Canada Revenue Agency (“CRA”) foryears before 1999, and we are no longer subject to Mexican federal income tax examinations by Servicio deAdministracion Tributaria (“SAT”) for years before 2004. U.S., Canadian and Mexican federal audit issuestypically involve the timing of deductions and transfer pricing adjustments. We work with the IRS, the CRA andSAT to resolve proposed audit adjustments and to minimize the amount of adjustments. We do not anticipate thatany potential tax adjustments will have a significant impact on our financial position or results of operations.
We reasonably expect reductions in the liability for unrecognized tax benefits of approximately $16.5million within the next 12 months because of the expiration of statutes of limitations and settlements of taxaudits.
14. PENSION AND OTHER POST-RETIREMENT BENEFIT PLANS
We sponsor a number of defined benefit pension plans. Our policy is to fund domestic pension liabilities inaccordance with the minimum and maximum limits imposed by the Employee Retirement Income Security Actof 1974 (“ERISA”) and federal income tax laws. We fund non-domestic pension liabilities in accordance withlaws and regulations applicable to those plans.
We have two post-retirement benefit plans: health care and life insurance. The health care plan iscontributory, with participants’ contributions adjusted annually. The life insurance plan is non-contributory.
80
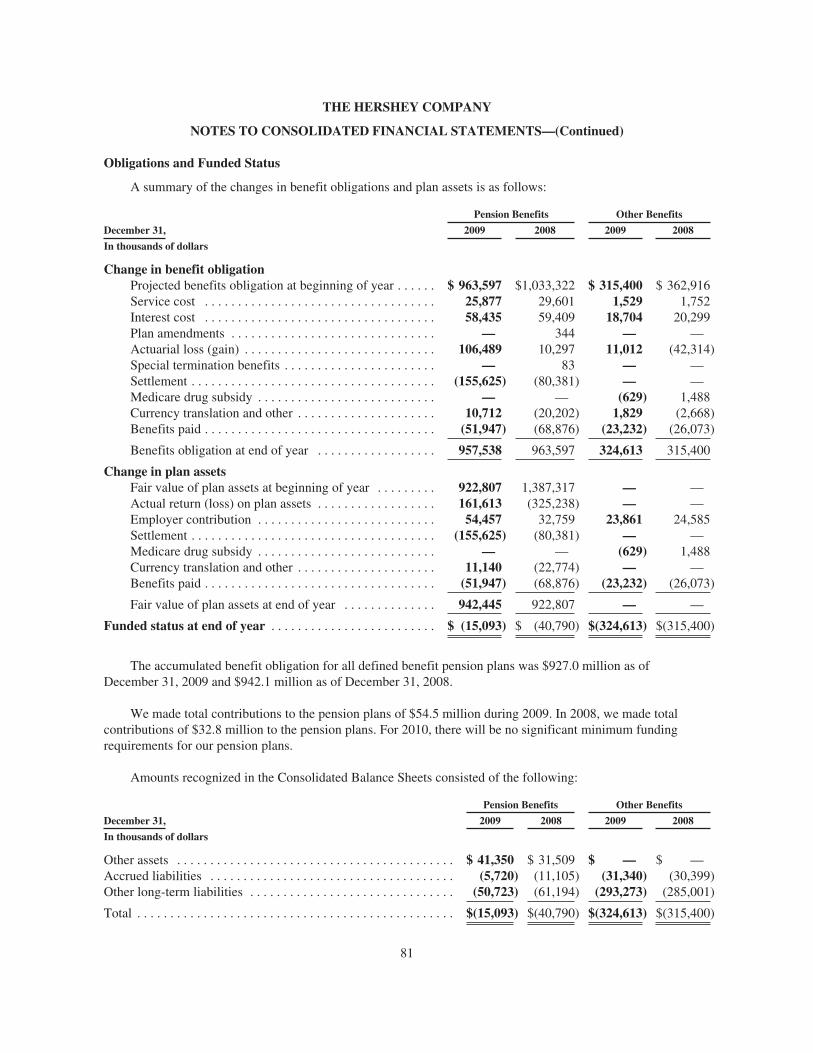
THE HERSHEY COMPANY
NOTES TO CONSOLIDATED FINANCIAL STATEMENTS—(Continued)
Obligations and Funded Status
A summary of the changes in benefit obligations and plan assets is as follows:
December 31,
Pension Benefits Other Benefits
2009 2008 2009 2008
In thousands of dollars
Change in benefit obligationProjected benefits obligation at beginning of year . . . . . . $ 963,597 $1,033,322 $ 315,400 $ 362,916Service cost . . . . . . . . . . . . . . . . . . . . . . . . . . . . . . . . . . . 25,877 29,601 1,529 1,752Interest cost . . . . . . . . . . . . . . . . . . . . . . . . . . . . . . . . . . . 58,435 59,409 18,704 20,299Plan amendments . . . . . . . . . . . . . . . . . . . . . . . . . . . . . . . — 344 — —Actuarial loss (gain) . . . . . . . . . . . . . . . . . . . . . . . . . . . . . 106,489 10,297 11,012 (42,314)Special termination benefits . . . . . . . . . . . . . . . . . . . . . . . — 83 — —Settlement . . . . . . . . . . . . . . . . . . . . . . . . . . . . . . . . . . . . . (155,625) (80,381) — —Medicare drug subsidy . . . . . . . . . . . . . . . . . . . . . . . . . . . — — (629) 1,488Currency translation and other . . . . . . . . . . . . . . . . . . . . . 10,712 (20,202) 1,829 (2,668)Benefits paid . . . . . . . . . . . . . . . . . . . . . . . . . . . . . . . . . . . (51,947) (68,876) (23,232) (26,073)
Benefits obligation at end of year . . . . . . . . . . . . . . . . . . 957,538 963,597 324,613 315,400
Change in plan assetsFair value of plan assets at beginning of year . . . . . . . . . 922,807 1,387,317 — —Actual return (loss) on plan assets . . . . . . . . . . . . . . . . . . 161,613 (325,238) — —Employer contribution . . . . . . . . . . . . . . . . . . . . . . . . . . . 54,457 32,759 23,861 24,585Settlement . . . . . . . . . . . . . . . . . . . . . . . . . . . . . . . . . . . . . (155,625) (80,381) — —Medicare drug subsidy . . . . . . . . . . . . . . . . . . . . . . . . . . . — — (629) 1,488Currency translation and other . . . . . . . . . . . . . . . . . . . . . 11,140 (22,774) — —Benefits paid . . . . . . . . . . . . . . . . . . . . . . . . . . . . . . . . . . . (51,947) (68,876) (23,232) (26,073)
Fair value of plan assets at end of year . . . . . . . . . . . . . . 942,445 922,807 — —
Funded status at end of year . . . . . . . . . . . . . . . . . . . . . . . . . $ (15,093) $ (40,790) $(324,613) $(315,400)
The accumulated benefit obligation for all defined benefit pension plans was $927.0 million as ofDecember 31, 2009 and $942.1 million as of December 31, 2008.
We made total contributions to the pension plans of $54.5 million during 2009. In 2008, we made totalcontributions of $32.8 million to the pension plans. For 2010, there will be no significant minimum fundingrequirements for our pension plans.
Amounts recognized in the Consolidated Balance Sheets consisted of the following:
December 31,
Pension Benefits Other Benefits
2009 2008 2009 2008
In thousands of dollars
Other assets . . . . . . . . . . . . . . . . . . . . . . . . . . . . . . . . . . . . . . . . . . $ 41,350 $ 31,509 $ — $ —Accrued liabilities . . . . . . . . . . . . . . . . . . . . . . . . . . . . . . . . . . . . . (5,720) (11,105) (31,340) (30,399)Other long-term liabilities . . . . . . . . . . . . . . . . . . . . . . . . . . . . . . . (50,723) (61,194) (293,273) (285,001)
Total . . . . . . . . . . . . . . . . . . . . . . . . . . . . . . . . . . . . . . . . . . . . . . . . $(15,093) $(40,790) $(324,613) $(315,400)
81
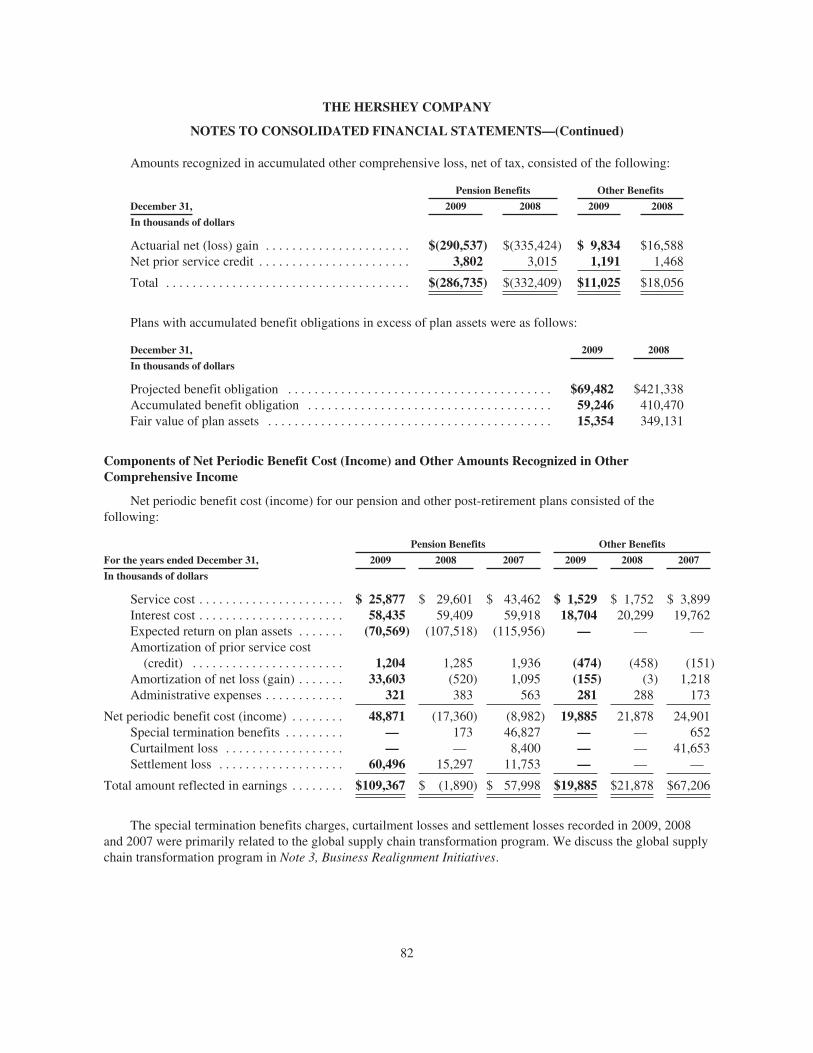
THE HERSHEY COMPANY
NOTES TO CONSOLIDATED FINANCIAL STATEMENTS—(Continued)
Amounts recognized in accumulated other comprehensive loss, net of tax, consisted of the following:
December 31,
Pension Benefits Other Benefits
2009 2008 2009 2008
In thousands of dollars
Actuarial net (loss) gain . . . . . . . . . . . . . . . . . . . . . . $(290,537) $(335,424) $ 9,834 $16,588Net prior service credit . . . . . . . . . . . . . . . . . . . . . . . 3,802 3,015 1,191 1,468
Total . . . . . . . . . . . . . . . . . . . . . . . . . . . . . . . . . . . . . $(286,735) $(332,409) $11,025 $18,056
Plans with accumulated benefit obligations in excess of plan assets were as follows:
December 31, 2009 2008
In thousands of dollars
Projected benefit obligation . . . . . . . . . . . . . . . . . . . . . . . . . . . . . . . . . . . . . . . . $69,482 $421,338Accumulated benefit obligation . . . . . . . . . . . . . . . . . . . . . . . . . . . . . . . . . . . . . 59,246 410,470Fair value of plan assets . . . . . . . . . . . . . . . . . . . . . . . . . . . . . . . . . . . . . . . . . . . 15,354 349,131
Components of Net Periodic Benefit Cost (Income) and Other Amounts Recognized in OtherComprehensive Income
Net periodic benefit cost (income) for our pension and other post-retirement plans consisted of thefollowing:
For the years ended December 31,
Pension Benefits Other Benefits
2009 2008 2007 2009 2008 2007
In thousands of dollars
Service cost . . . . . . . . . . . . . . . . . . . . . . $ 25,877 $ 29,601 $ 43,462 $ 1,529 $ 1,752 $ 3,899Interest cost . . . . . . . . . . . . . . . . . . . . . . 58,435 59,409 59,918 18,704 20,299 19,762Expected return on plan assets . . . . . . . (70,569) (107,518) (115,956) — — —Amortization of prior service cost
(credit) . . . . . . . . . . . . . . . . . . . . . . . 1,204 1,285 1,936 (474) (458) (151)Amortization of net loss (gain) . . . . . . . 33,603 (520) 1,095 (155) (3) 1,218Administrative expenses . . . . . . . . . . . . 321 383 563 281 288 173
Net periodic benefit cost (income) . . . . . . . . 48,871 (17,360) (8,982) 19,885 21,878 24,901Special termination benefits . . . . . . . . . — 173 46,827 — — 652Curtailment loss . . . . . . . . . . . . . . . . . . — — 8,400 — — 41,653Settlement loss . . . . . . . . . . . . . . . . . . . 60,496 15,297 11,753 — — —
Total amount reflected in earnings . . . . . . . . $109,367 $ (1,890) $ 57,998 $19,885 $21,878 $67,206
The special termination benefits charges, curtailment losses and settlement losses recorded in 2009, 2008and 2007 were primarily related to the global supply chain transformation program. We discuss the global supplychain transformation program in Note 3, Business Realignment Initiatives.
82
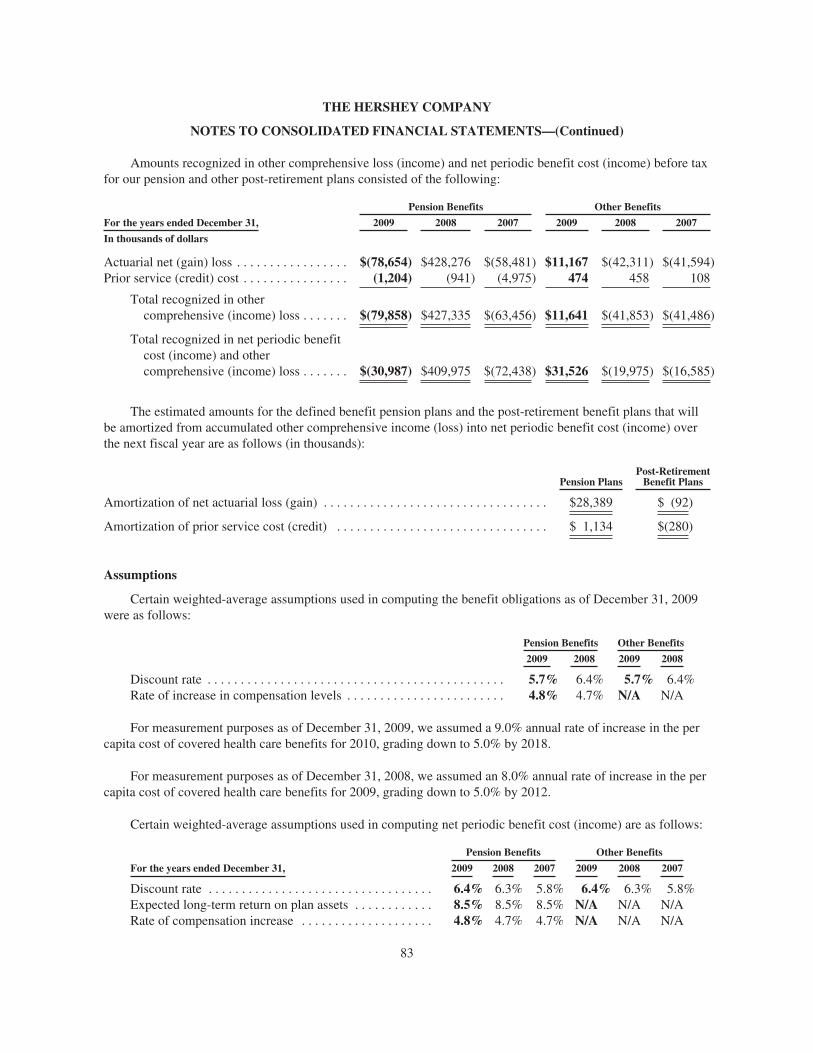
THE HERSHEY COMPANY
NOTES TO CONSOLIDATED FINANCIAL STATEMENTS—(Continued)
Amounts recognized in other comprehensive loss (income) and net periodic benefit cost (income) before taxfor our pension and other post-retirement plans consisted of the following:
For the years ended December 31,
Pension Benefits Other Benefits
2009 2008 2007 2009 2008 2007
In thousands of dollars
Actuarial net (gain) loss . . . . . . . . . . . . . . . . . $(78,654) $428,276 $(58,481) $11,167 $(42,311) $(41,594)Prior service (credit) cost . . . . . . . . . . . . . . . . (1,204) (941) (4,975) 474 458 108
Total recognized in othercomprehensive (income) loss . . . . . . . $(79,858) $427,335 $(63,456) $11,641 $(41,853) $(41,486)
Total recognized in net periodic benefitcost (income) and othercomprehensive (income) loss . . . . . . . $(30,987) $409,975 $(72,438) $31,526 $(19,975) $(16,585)
The estimated amounts for the defined benefit pension plans and the post-retirement benefit plans that willbe amortized from accumulated other comprehensive income (loss) into net periodic benefit cost (income) overthe next fiscal year are as follows (in thousands):
Pension PlansPost-Retirement
Benefit Plans
Amortization of net actuarial loss (gain) . . . . . . . . . . . . . . . . . . . . . . . . . . . . . . . . . . $28,389 $ (92)
Amortization of prior service cost (credit) . . . . . . . . . . . . . . . . . . . . . . . . . . . . . . . . $ 1,134 $(280)
Assumptions
Certain weighted-average assumptions used in computing the benefit obligations as of December 31, 2009were as follows:
Pension Benefits Other Benefits
2009 2008 2009 2008
Discount rate . . . . . . . . . . . . . . . . . . . . . . . . . . . . . . . . . . . . . . . . . . . . . 5.7% 6.4% 5.7% 6.4%Rate of increase in compensation levels . . . . . . . . . . . . . . . . . . . . . . . . 4.8% 4.7% N/A N/A
For measurement purposes as of December 31, 2009, we assumed a 9.0% annual rate of increase in the percapita cost of covered health care benefits for 2010, grading down to 5.0% by 2018.
For measurement purposes as of December 31, 2008, we assumed an 8.0% annual rate of increase in the percapita cost of covered health care benefits for 2009, grading down to 5.0% by 2012.
Certain weighted-average assumptions used in computing net periodic benefit cost (income) are as follows:
For the years ended December 31,
Pension Benefits Other Benefits
2009 2008 2007 2009 2008 2007
Discount rate . . . . . . . . . . . . . . . . . . . . . . . . . . . . . . . . . . 6.4% 6.3% 5.8% 6.4% 6.3% 5.8%Expected long-term return on plan assets . . . . . . . . . . . . 8.5% 8.5% 8.5% N/A N/A N/ARate of compensation increase . . . . . . . . . . . . . . . . . . . . 4.8% 4.7% 4.7% N/A N/A N/A
83
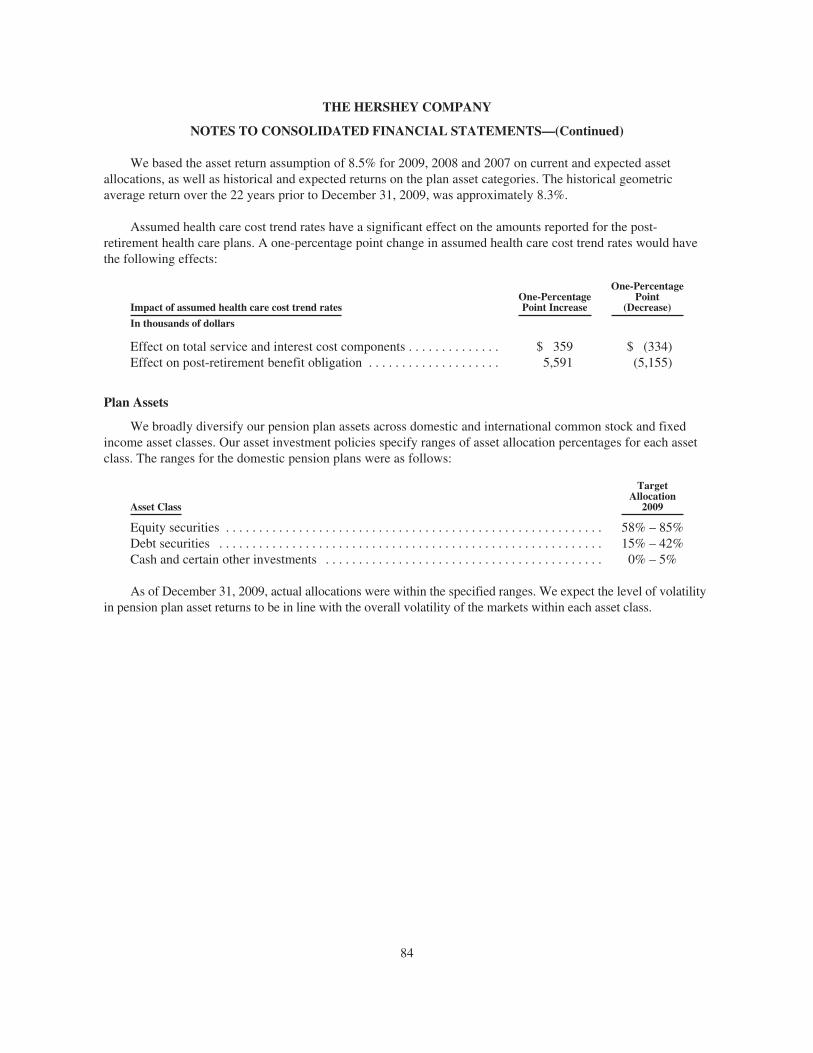
THE HERSHEY COMPANY
NOTES TO CONSOLIDATED FINANCIAL STATEMENTS—(Continued)
We based the asset return assumption of 8.5% for 2009, 2008 and 2007 on current and expected assetallocations, as well as historical and expected returns on the plan asset categories. The historical geometricaverage return over the 22 years prior to December 31, 2009, was approximately 8.3%.
Assumed health care cost trend rates have a significant effect on the amounts reported for the post-retirement health care plans. A one-percentage point change in assumed health care cost trend rates would havethe following effects:
Impact of assumed health care cost trend ratesOne-PercentagePoint Increase
One-PercentagePoint
(Decrease)
In thousands of dollars
Effect on total service and interest cost components . . . . . . . . . . . . . . $ 359 $ (334)Effect on post-retirement benefit obligation . . . . . . . . . . . . . . . . . . . . 5,591 (5,155)
Plan Assets
We broadly diversify our pension plan assets across domestic and international common stock and fixedincome asset classes. Our asset investment policies specify ranges of asset allocation percentages for each assetclass. The ranges for the domestic pension plans were as follows:
Asset Class
TargetAllocation
2009
Equity securities . . . . . . . . . . . . . . . . . . . . . . . . . . . . . . . . . . . . . . . . . . . . . . . . . . . . . . . . . 58% – 85%Debt securities . . . . . . . . . . . . . . . . . . . . . . . . . . . . . . . . . . . . . . . . . . . . . . . . . . . . . . . . . . 15% – 42%Cash and certain other investments . . . . . . . . . . . . . . . . . . . . . . . . . . . . . . . . . . . . . . . . . . 0% – 5%
As of December 31, 2009, actual allocations were within the specified ranges. We expect the level of volatilityin pension plan asset returns to be in line with the overall volatility of the markets within each asset class.
84
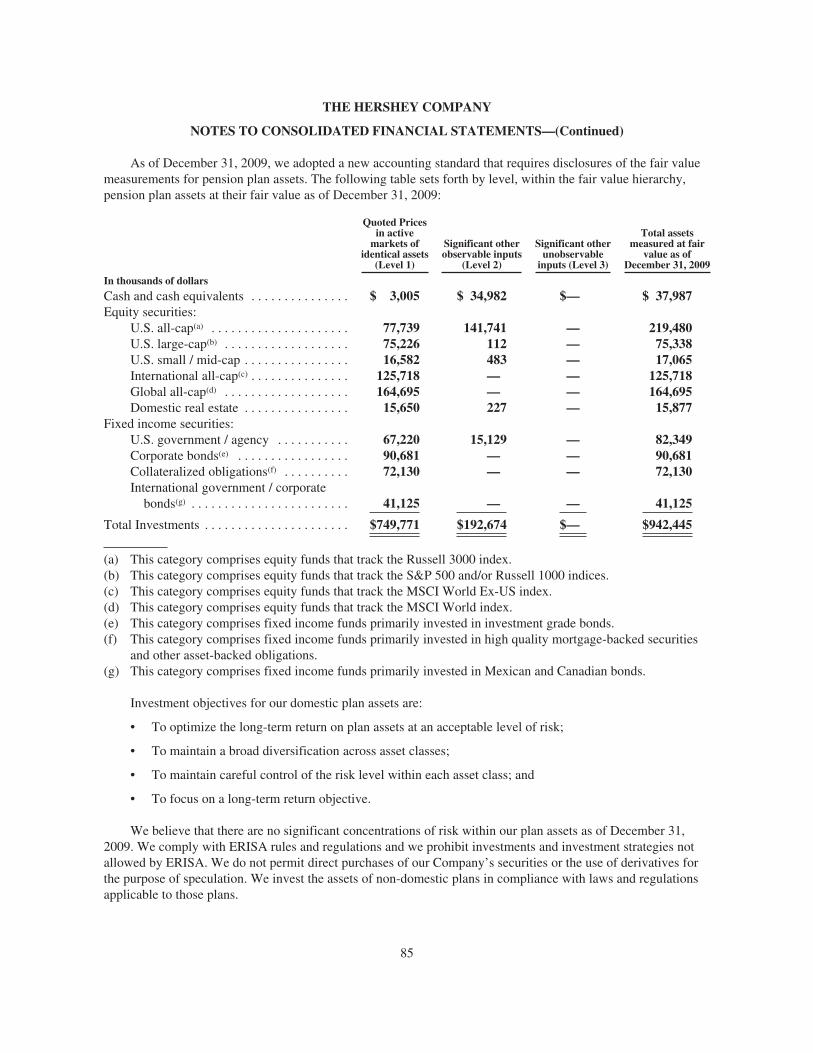
THE HERSHEY COMPANY
NOTES TO CONSOLIDATED FINANCIAL STATEMENTS—(Continued)
As of December 31, 2009, we adopted a new accounting standard that requires disclosures of the fair valuemeasurements for pension plan assets. The following table sets forth by level, within the fair value hierarchy,pension plan assets at their fair value as of December 31, 2009:
Quoted Pricesin active
markets ofidentical assets
(Level 1)
Significant otherobservable inputs
(Level 2)
Significant otherunobservable
inputs (Level 3)
Total assetsmeasured at fair
value as ofDecember 31, 2009
In thousands of dollars
Cash and cash equivalents . . . . . . . . . . . . . . . $ 3,005 $ 34,982 $— $ 37,987Equity securities:
U.S. all-cap(a) . . . . . . . . . . . . . . . . . . . . . 77,739 141,741 — 219,480U.S. large-cap(b) . . . . . . . . . . . . . . . . . . . 75,226 112 — 75,338U.S. small / mid-cap . . . . . . . . . . . . . . . . 16,582 483 — 17,065International all-cap(c) . . . . . . . . . . . . . . . 125,718 — — 125,718Global all-cap(d) . . . . . . . . . . . . . . . . . . . 164,695 — — 164,695Domestic real estate . . . . . . . . . . . . . . . . 15,650 227 — 15,877
Fixed income securities:U.S. government / agency . . . . . . . . . . . 67,220 15,129 — 82,349Corporate bonds(e) . . . . . . . . . . . . . . . . . 90,681 — — 90,681Collateralized obligations(f) . . . . . . . . . . 72,130 — — 72,130International government / corporate
bonds(g) . . . . . . . . . . . . . . . . . . . . . . . . 41,125 — — 41,125
Total Investments . . . . . . . . . . . . . . . . . . . . . . $749,771 $192,674 $— $942,445
(a) This category comprises equity funds that track the Russell 3000 index.(b) This category comprises equity funds that track the S&P 500 and/or Russell 1000 indices.(c) This category comprises equity funds that track the MSCI World Ex-US index.(d) This category comprises equity funds that track the MSCI World index.(e) This category comprises fixed income funds primarily invested in investment grade bonds.(f) This category comprises fixed income funds primarily invested in high quality mortgage-backed securities
and other asset-backed obligations.(g) This category comprises fixed income funds primarily invested in Mexican and Canadian bonds.
Investment objectives for our domestic plan assets are:
• To optimize the long-term return on plan assets at an acceptable level of risk;
• To maintain a broad diversification across asset classes;
• To maintain careful control of the risk level within each asset class; and
• To focus on a long-term return objective.
We believe that there are no significant concentrations of risk within our plan assets as of December 31,2009. We comply with ERISA rules and regulations and we prohibit investments and investment strategies notallowed by ERISA. We do not permit direct purchases of our Company’s securities or the use of derivatives forthe purpose of speculation. We invest the assets of non-domestic plans in compliance with laws and regulationsapplicable to those plans.
85
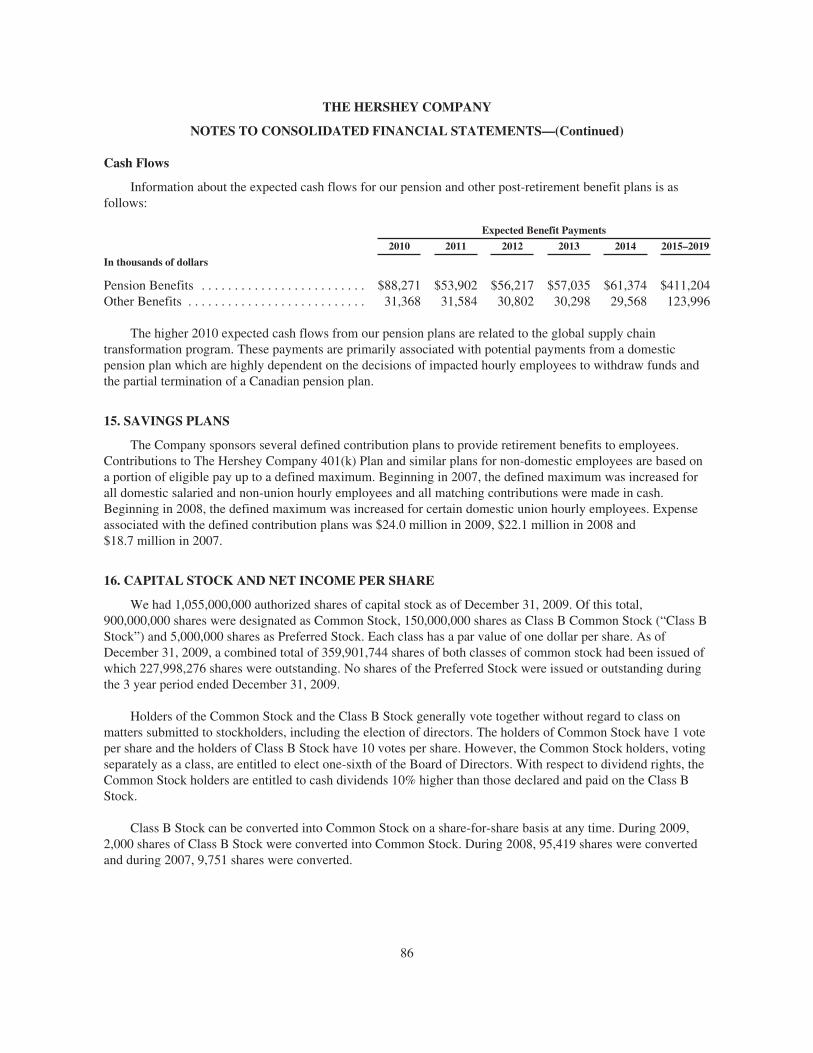
THE HERSHEY COMPANY
NOTES TO CONSOLIDATED FINANCIAL STATEMENTS—(Continued)
Cash Flows
Information about the expected cash flows for our pension and other post-retirement benefit plans is asfollows:
Expected Benefit Payments
2010 2011 2012 2013 2014 2015–2019
In thousands of dollars
Pension Benefits . . . . . . . . . . . . . . . . . . . . . . . . . $88,271 $53,902 $56,217 $57,035 $61,374 $411,204Other Benefits . . . . . . . . . . . . . . . . . . . . . . . . . . . 31,368 31,584 30,802 30,298 29,568 123,996
The higher 2010 expected cash flows from our pension plans are related to the global supply chaintransformation program. These payments are primarily associated with potential payments from a domesticpension plan which are highly dependent on the decisions of impacted hourly employees to withdraw funds andthe partial termination of a Canadian pension plan.
15. SAVINGS PLANS
The Company sponsors several defined contribution plans to provide retirement benefits to employees.Contributions to The Hershey Company 401(k) Plan and similar plans for non-domestic employees are based ona portion of eligible pay up to a defined maximum. Beginning in 2007, the defined maximum was increased forall domestic salaried and non-union hourly employees and all matching contributions were made in cash.Beginning in 2008, the defined maximum was increased for certain domestic union hourly employees. Expenseassociated with the defined contribution plans was $24.0 million in 2009, $22.1 million in 2008 and$18.7 million in 2007.
16. CAPITAL STOCK AND NET INCOME PER SHARE
We had 1,055,000,000 authorized shares of capital stock as of December 31, 2009. Of this total,900,000,000 shares were designated as Common Stock, 150,000,000 shares as Class B Common Stock (“Class BStock”) and 5,000,000 shares as Preferred Stock. Each class has a par value of one dollar per share. As ofDecember 31, 2009, a combined total of 359,901,744 shares of both classes of common stock had been issued ofwhich 227,998,276 shares were outstanding. No shares of the Preferred Stock were issued or outstanding duringthe 3 year period ended December 31, 2009.
Holders of the Common Stock and the Class B Stock generally vote together without regard to class onmatters submitted to stockholders, including the election of directors. The holders of Common Stock have 1 voteper share and the holders of Class B Stock have 10 votes per share. However, the Common Stock holders, votingseparately as a class, are entitled to elect one-sixth of the Board of Directors. With respect to dividend rights, theCommon Stock holders are entitled to cash dividends 10% higher than those declared and paid on the Class BStock.
Class B Stock can be converted into Common Stock on a share-for-share basis at any time. During 2009,2,000 shares of Class B Stock were converted into Common Stock. During 2008, 95,419 shares were convertedand during 2007, 9,751 shares were converted.
86
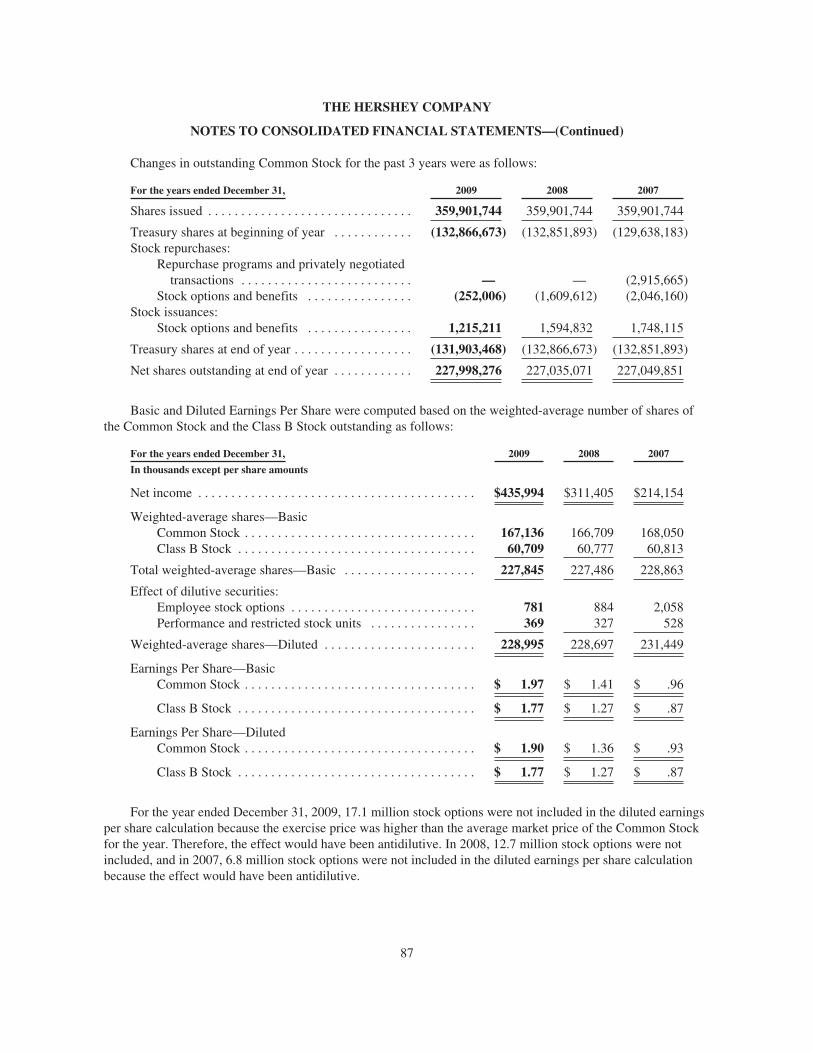
THE HERSHEY COMPANY
NOTES TO CONSOLIDATED FINANCIAL STATEMENTS—(Continued)
Changes in outstanding Common Stock for the past 3 years were as follows:
For the years ended December 31, 2009 2008 2007
Shares issued . . . . . . . . . . . . . . . . . . . . . . . . . . . . . . . 359,901,744 359,901,744 359,901,744
Treasury shares at beginning of year . . . . . . . . . . . . (132,866,673) (132,851,893) (129,638,183)Stock repurchases:
Repurchase programs and privately negotiatedtransactions . . . . . . . . . . . . . . . . . . . . . . . . . . — — (2,915,665)
Stock options and benefits . . . . . . . . . . . . . . . . (252,006) (1,609,612) (2,046,160)Stock issuances:
Stock options and benefits . . . . . . . . . . . . . . . . 1,215,211 1,594,832 1,748,115
Treasury shares at end of year . . . . . . . . . . . . . . . . . . (131,903,468) (132,866,673) (132,851,893)
Net shares outstanding at end of year . . . . . . . . . . . . 227,998,276 227,035,071 227,049,851
Basic and Diluted Earnings Per Share were computed based on the weighted-average number of shares ofthe Common Stock and the Class B Stock outstanding as follows:
For the years ended December 31, 2009 2008 2007
In thousands except per share amounts
Net income . . . . . . . . . . . . . . . . . . . . . . . . . . . . . . . . . . . . . . . . . . $435,994 $311,405 $214,154
Weighted-average shares—BasicCommon Stock . . . . . . . . . . . . . . . . . . . . . . . . . . . . . . . . . . . 167,136 166,709 168,050Class B Stock . . . . . . . . . . . . . . . . . . . . . . . . . . . . . . . . . . . . 60,709 60,777 60,813
Total weighted-average shares—Basic . . . . . . . . . . . . . . . . . . . . 227,845 227,486 228,863
Effect of dilutive securities:Employee stock options . . . . . . . . . . . . . . . . . . . . . . . . . . . . 781 884 2,058Performance and restricted stock units . . . . . . . . . . . . . . . . 369 327 528
Weighted-average shares—Diluted . . . . . . . . . . . . . . . . . . . . . . . 228,995 228,697 231,449
Earnings Per Share—BasicCommon Stock . . . . . . . . . . . . . . . . . . . . . . . . . . . . . . . . . . . $ 1.97 $ 1.41 $ .96
Class B Stock . . . . . . . . . . . . . . . . . . . . . . . . . . . . . . . . . . . . $ 1.77 $ 1.27 $ .87
Earnings Per Share—DilutedCommon Stock . . . . . . . . . . . . . . . . . . . . . . . . . . . . . . . . . . . $ 1.90 $ 1.36 $ .93
Class B Stock . . . . . . . . . . . . . . . . . . . . . . . . . . . . . . . . . . . . $ 1.77 $ 1.27 $ .87
For the year ended December 31, 2009, 17.1 million stock options were not included in the diluted earningsper share calculation because the exercise price was higher than the average market price of the Common Stockfor the year. Therefore, the effect would have been antidilutive. In 2008, 12.7 million stock options were notincluded, and in 2007, 6.8 million stock options were not included in the diluted earnings per share calculationbecause the effect would have been antidilutive.
87
THE HERSHEY COMPANY
NOTES TO CONSOLIDATED FINANCIAL STATEMENTS—(Continued)
Milton Hershey School Trust
Hershey Trust Company, as Trustee for the benefit of Milton Hershey School, as institutional fiduciary forestates and trusts unrelated to Milton Hershey School, and as direct owner of investment shares, held 13,222,387shares of our Common Stock as of December 31, 2009. As Trustee for the benefit of Milton Hershey School,Hershey Trust Company held 60,612,012 shares of the Class B Stock as of December 31, 2009, and was entitledto cast approximately 80% of the total votes of both classes of our common stock. The Milton Hershey SchoolTrust must approve the issuance of shares of Common Stock or any other action that would result in the MiltonHershey School Trust not continuing to have voting control of our Company.
Stockholder Protection Rights Agreement
In December 2000, our Board of Directors unanimously adopted a Stockholder Protection RightsAgreement and declared a dividend of 1 right (“Right”) for each outstanding share of Common Stock andClass B Stock payable to stockholders of record at the close of business on December 26, 2000. The Rights willat no time have voting power or receive dividends. The issuance of the Rights has no dilutive effect, does notaffect reported earnings per share and is not taxable. The Rights will not change the manner in which ourCommon Stock is traded.
The Rights become exercisable only upon:
• Resolution of the Board of Directors after any person (other than the Milton Hershey School Trust) hascommenced a tender offer that would result in such person becoming the beneficial owner of 15% ormore of the Common Stock;
• Our announcement that a person or group (other than the Milton Hershey School Trust) has acquired15% or more of the outstanding shares of Common Stock; or
• A person or group (other than the Milton Hershey School Trust) becoming the beneficial owner of morethan 35% of the voting power of all of the outstanding Common Stock and Class B Stock.
When exercisable, each Right entitles its registered holder to purchase from our Company, at a pre-determinedexercise price, one one-thousandth of a share of Series A Participating Preferred Stock, par value $1.00 per share.The Rights are convertible by holders of Class B Stock into Series B Participating Preferred Stock based on oneone-thousandth of a share of Series B Participating Preferred Stock for every share of Class B Stock held at thattime. Each one one-thousandth of a share of Series A Participating Preferred Stock has economic and voting termssimilar to those of one share of Common Stock. Similarly, each one one-thousandth of a share of Series BParticipating Preferred Stock has economic and voting terms similar to those of one share of Class B Stock.
Each Right will automatically become a right to buy that number of one one-thousandth of a share of SeriesA Participating Preferred Stock upon the earlier of:
• A public announcement by our Company that a person or group (other than the Milton Hershey SchoolTrust) has acquired 15% or more of the outstanding shares of Common Stock; or
• Such person or group (other than the Milton Hershey School Trust) has acquired more than 35% of thevoting power of the Common Stock and Class B Stock.
The purchase price is pre-determined. The market value of the preferred stock would be twice the exerciseprice. Rights owned by the acquiring person or group are excluded. In addition, if we are acquired in a merger orother business combination, each Right will entitle a holder to purchase from the acquiring company, for thepre-determined exercise price, preferred stock of the acquiring company having an aggregate market value equalto twice the exercise price.
88
THE HERSHEY COMPANY
NOTES TO CONSOLIDATED FINANCIAL STATEMENTS—(Continued)
Further, our Board of Directors may, at its option, exchange all (but not less than all) of the outstandingPreferred Stock (other than Rights held by the acquiring person or group) for shares of Common Stock or Class BStock, as applicable at any time after a person or group (other than the Milton Hershey School Trust) acquires:
• 15% or more (but less than 50%) of our Common Stock; or
• More than 35% of the voting power of all outstanding Common Stock and Class B Stock.
This may be done at an exchange ratio of one share of Common Stock or Class B Stock for each oneone-thousandth of a share of Preferred Stock.
Solely at our option, we may amend the Rights or redeem the Rights for $.01 per Right at any time beforethe acquisition by a person or group (other than the Milton Hershey School Trust) of beneficial ownership of15% or more of our Common Stock or more than 35% of the voting power of all of the outstanding CommonStock and Class B Stock. Unless redeemed earlier or extended by us, the Rights will expire on December 14,2010.
17. STOCK COMPENSATION PLANS
At our annual meeting of stockholders, held April 17, 2007, stockholders approved The Hershey CompanyEquity and Incentive Compensation Plan (“EICP”). The EICP is an amendment and restatement of our formerKey Employee Incentive Plan, a share-based employee incentive compensation plan, and is also a continuation ofour Broad Based Stock Option Plan, Broad Based Annual Incentive Plan and Directors’ Compensation Plan.Following its adoption on April 17, 2007, the EICP became the single plan under which grants using shares forcompensation and incentive purposes will be made.
The EICP provides for grants of one or more of the following stock-based compensation awards toemployees, non-employee directors and certain service providers upon whom the successful conduct of ourbusiness is dependent:
• Non-qualified stock options (“stock options”);
• Performance stock units and performance stock;
• Stock appreciation rights;
• Restricted stock units and restricted stock; and
• Other stock-based awards.
The EICP also provides for the deferral of stock-based compensation awards by participants if approved bythe Compensation and Executive Organization Committee of our Board and if in accordance with an applicabledeferred compensation plan of the Company. Currently, the Compensation and Executive OrganizationCommittee has authorized the deferral of performance stock unit and restricted stock unit awards by certaineligible employees under the Company’s Deferred Compensation Plan. Our Board has authorized ournon-employee directors to defer any portion of their cash retainer, committee chair fees and restricted stock unitsawarded after 2007 that they elect to convert into deferred stock units under our Directors’ Compensation Plan.As of December 31, 2009, 52.0 million shares were authorized and approved by our stockholders for grantsunder the EICP.
In July 2004, we announced a worldwide stock option grant under the Broad Based Stock Option Plan. Thisgrant provided over 13,000 eligible employees with 100 non-qualified stock options. The stock options weregranted at a price of $46.44 per share, have a term of 10 years and vested on July 19, 2009.
89
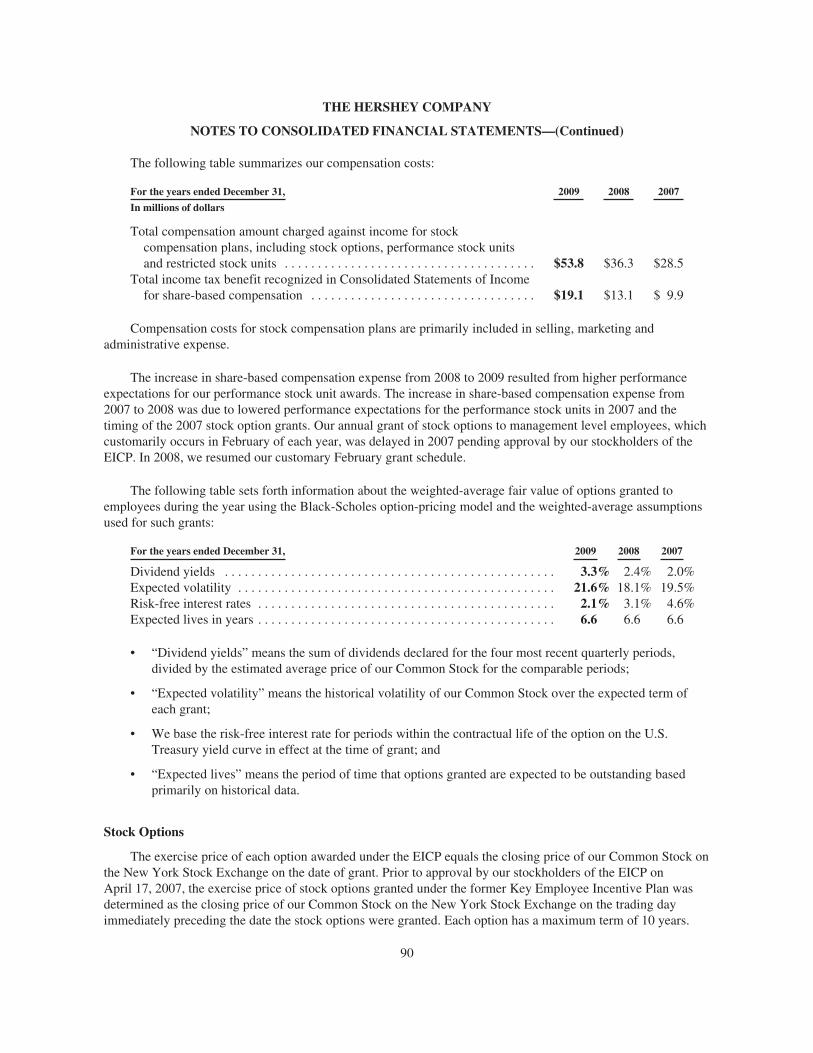
THE HERSHEY COMPANY
NOTES TO CONSOLIDATED FINANCIAL STATEMENTS—(Continued)
The following table summarizes our compensation costs:
For the years ended December 31, 2009 2008 2007
In millions of dollars
Total compensation amount charged against income for stockcompensation plans, including stock options, performance stock unitsand restricted stock units . . . . . . . . . . . . . . . . . . . . . . . . . . . . . . . . . . . . . . $53.8 $36.3 $28.5
Total income tax benefit recognized in Consolidated Statements of Incomefor share-based compensation . . . . . . . . . . . . . . . . . . . . . . . . . . . . . . . . . . $19.1 $13.1 $ 9.9
Compensation costs for stock compensation plans are primarily included in selling, marketing andadministrative expense.
The increase in share-based compensation expense from 2008 to 2009 resulted from higher performanceexpectations for our performance stock unit awards. The increase in share-based compensation expense from2007 to 2008 was due to lowered performance expectations for the performance stock units in 2007 and thetiming of the 2007 stock option grants. Our annual grant of stock options to management level employees, whichcustomarily occurs in February of each year, was delayed in 2007 pending approval by our stockholders of theEICP. In 2008, we resumed our customary February grant schedule.
The following table sets forth information about the weighted-average fair value of options granted toemployees during the year using the Black-Scholes option-pricing model and the weighted-average assumptionsused for such grants:
For the years ended December 31, 2009 2008 2007
Dividend yields . . . . . . . . . . . . . . . . . . . . . . . . . . . . . . . . . . . . . . . . . . . . . . . . . . 3.3% 2.4% 2.0%Expected volatility . . . . . . . . . . . . . . . . . . . . . . . . . . . . . . . . . . . . . . . . . . . . . . . . 21.6% 18.1% 19.5%Risk-free interest rates . . . . . . . . . . . . . . . . . . . . . . . . . . . . . . . . . . . . . . . . . . . . . 2.1% 3.1% 4.6%Expected lives in years . . . . . . . . . . . . . . . . . . . . . . . . . . . . . . . . . . . . . . . . . . . . . 6.6 6.6 6.6
• “Dividend yields” means the sum of dividends declared for the four most recent quarterly periods,divided by the estimated average price of our Common Stock for the comparable periods;
• “Expected volatility” means the historical volatility of our Common Stock over the expected term ofeach grant;
• We base the risk-free interest rate for periods within the contractual life of the option on the U.S.Treasury yield curve in effect at the time of grant; and
• “Expected lives” means the period of time that options granted are expected to be outstanding basedprimarily on historical data.
Stock Options
The exercise price of each option awarded under the EICP equals the closing price of our Common Stock onthe New York Stock Exchange on the date of grant. Prior to approval by our stockholders of the EICP onApril 17, 2007, the exercise price of stock options granted under the former Key Employee Incentive Plan wasdetermined as the closing price of our Common Stock on the New York Stock Exchange on the trading dayimmediately preceding the date the stock options were granted. Each option has a maximum term of 10 years.
90
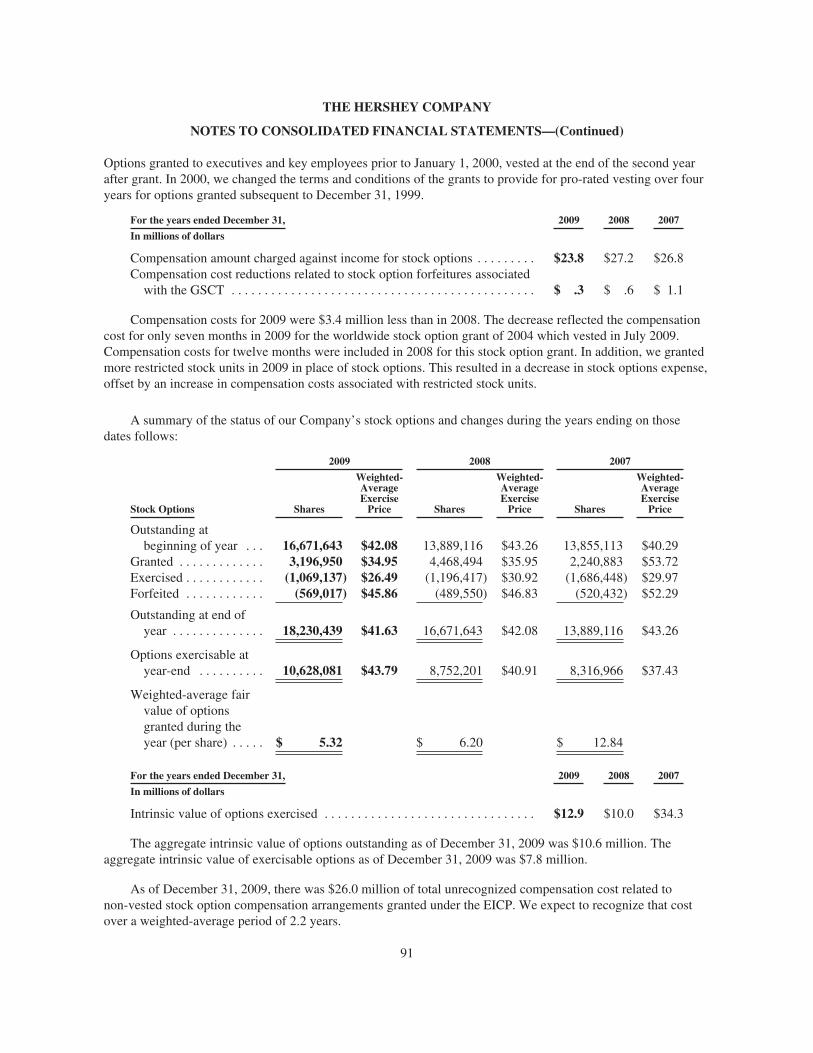
THE HERSHEY COMPANY
NOTES TO CONSOLIDATED FINANCIAL STATEMENTS—(Continued)
Options granted to executives and key employees prior to January 1, 2000, vested at the end of the second yearafter grant. In 2000, we changed the terms and conditions of the grants to provide for pro-rated vesting over fouryears for options granted subsequent to December 31, 1999.
For the years ended December 31, 2009 2008 2007
In millions of dollars
Compensation amount charged against income for stock options . . . . . . . . . $23.8 $27.2 $26.8Compensation cost reductions related to stock option forfeitures associated
with the GSCT . . . . . . . . . . . . . . . . . . . . . . . . . . . . . . . . . . . . . . . . . . . . . . $ .3 $ .6 $ 1.1
Compensation costs for 2009 were $3.4 million less than in 2008. The decrease reflected the compensationcost for only seven months in 2009 for the worldwide stock option grant of 2004 which vested in July 2009.Compensation costs for twelve months were included in 2008 for this stock option grant. In addition, we grantedmore restricted stock units in 2009 in place of stock options. This resulted in a decrease in stock options expense,offset by an increase in compensation costs associated with restricted stock units.
A summary of the status of our Company’s stock options and changes during the years ending on thosedates follows:
Stock Options
2009 2008 2007
Shares
Weighted-AverageExercise
Price Shares
Weighted-AverageExercise
Price Shares
Weighted-AverageExercise
Price
Outstanding atbeginning of year . . . 16,671,643 $42.08 13,889,116 $43.26 13,855,113 $40.29
Granted . . . . . . . . . . . . . 3,196,950 $34.95 4,468,494 $35.95 2,240,883 $53.72Exercised . . . . . . . . . . . . (1,069,137) $26.49 (1,196,417) $30.92 (1,686,448) $29.97Forfeited . . . . . . . . . . . . (569,017) $45.86 (489,550) $46.83 (520,432) $52.29
Outstanding at end ofyear . . . . . . . . . . . . . . 18,230,439 $41.63 16,671,643 $42.08 13,889,116 $43.26
Options exercisable atyear-end . . . . . . . . . . 10,628,081 $43.79 8,752,201 $40.91 8,316,966 $37.43
Weighted-average fairvalue of optionsgranted during theyear (per share) . . . . . $ 5.32 $ 6.20 $ 12.84
For the years ended December 31, 2009 2008 2007
In millions of dollars
Intrinsic value of options exercised . . . . . . . . . . . . . . . . . . . . . . . . . . . . . . . . $12.9 $10.0 $34.3
The aggregate intrinsic value of options outstanding as of December 31, 2009 was $10.6 million. Theaggregate intrinsic value of exercisable options as of December 31, 2009 was $7.8 million.
As of December 31, 2009, there was $26.0 million of total unrecognized compensation cost related tonon-vested stock option compensation arrangements granted under the EICP. We expect to recognize that costover a weighted-average period of 2.2 years.
91
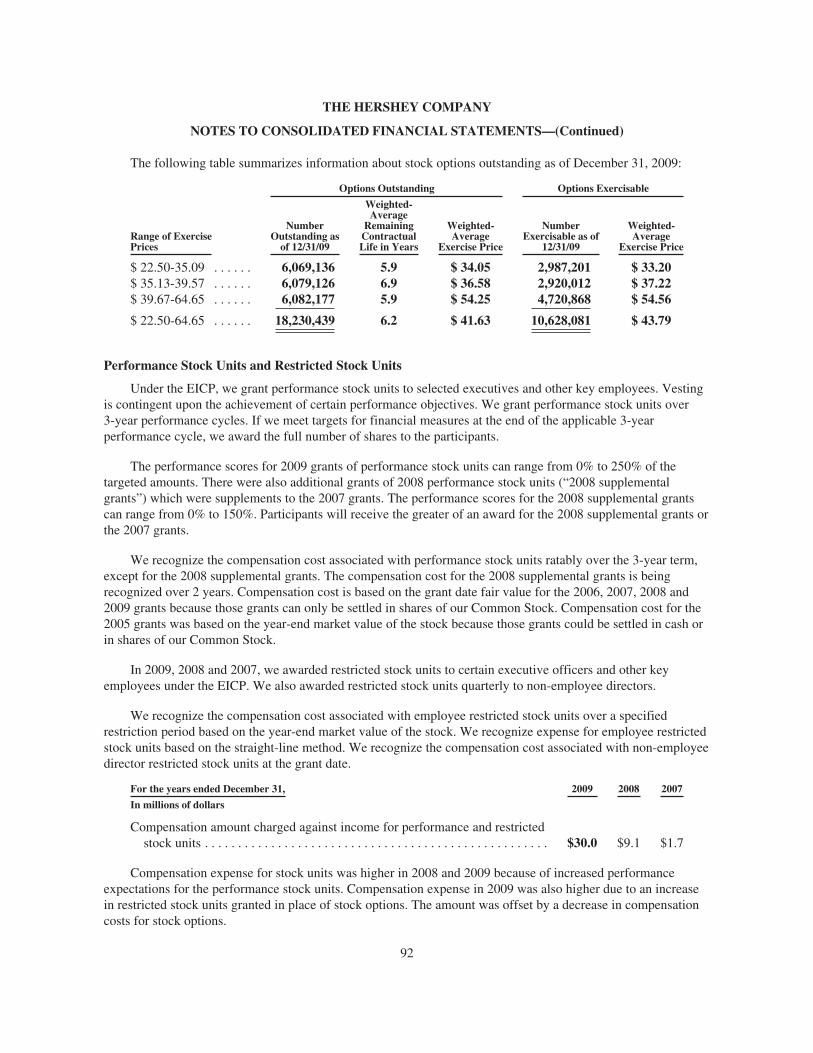
THE HERSHEY COMPANY
NOTES TO CONSOLIDATED FINANCIAL STATEMENTS—(Continued)
The following table summarizes information about stock options outstanding as of December 31, 2009:
Range of ExercisePrices
Options Outstanding Options Exercisable
NumberOutstanding as
of 12/31/09
Weighted-Average
RemainingContractualLife in Years
Weighted-Average
Exercise Price
NumberExercisable as of
12/31/09
Weighted-Average
Exercise Price
$ 22.50-35.09 . . . . . . 6,069,136 5.9 $ 34.05 2,987,201 $ 33.20$ 35.13-39.57 . . . . . . 6,079,126 6.9 $ 36.58 2,920,012 $ 37.22$ 39.67-64.65 . . . . . . 6,082,177 5.9 $ 54.25 4,720,868 $ 54.56
$ 22.50-64.65 . . . . . . 18,230,439 6.2 $ 41.63 10,628,081 $ 43.79
Performance Stock Units and Restricted Stock Units
Under the EICP, we grant performance stock units to selected executives and other key employees. Vestingis contingent upon the achievement of certain performance objectives. We grant performance stock units over3-year performance cycles. If we meet targets for financial measures at the end of the applicable 3-yearperformance cycle, we award the full number of shares to the participants.
The performance scores for 2009 grants of performance stock units can range from 0% to 250% of thetargeted amounts. There were also additional grants of 2008 performance stock units (“2008 supplementalgrants”) which were supplements to the 2007 grants. The performance scores for the 2008 supplemental grantscan range from 0% to 150%. Participants will receive the greater of an award for the 2008 supplemental grants orthe 2007 grants.
We recognize the compensation cost associated with performance stock units ratably over the 3-year term,except for the 2008 supplemental grants. The compensation cost for the 2008 supplemental grants is beingrecognized over 2 years. Compensation cost is based on the grant date fair value for the 2006, 2007, 2008 and2009 grants because those grants can only be settled in shares of our Common Stock. Compensation cost for the2005 grants was based on the year-end market value of the stock because those grants could be settled in cash orin shares of our Common Stock.
In 2009, 2008 and 2007, we awarded restricted stock units to certain executive officers and other keyemployees under the EICP. We also awarded restricted stock units quarterly to non-employee directors.
We recognize the compensation cost associated with employee restricted stock units over a specifiedrestriction period based on the year-end market value of the stock. We recognize expense for employee restrictedstock units based on the straight-line method. We recognize the compensation cost associated with non-employeedirector restricted stock units at the grant date.
For the years ended December 31, 2009 2008 2007
In millions of dollars
Compensation amount charged against income for performance and restrictedstock units . . . . . . . . . . . . . . . . . . . . . . . . . . . . . . . . . . . . . . . . . . . . . . . . . . . . $30.0 $9.1 $1.7
Compensation expense for stock units was higher in 2008 and 2009 because of increased performanceexpectations for the performance stock units. Compensation expense in 2009 was also higher due to an increasein restricted stock units granted in place of stock options. The amount was offset by a decrease in compensationcosts for stock options.
92
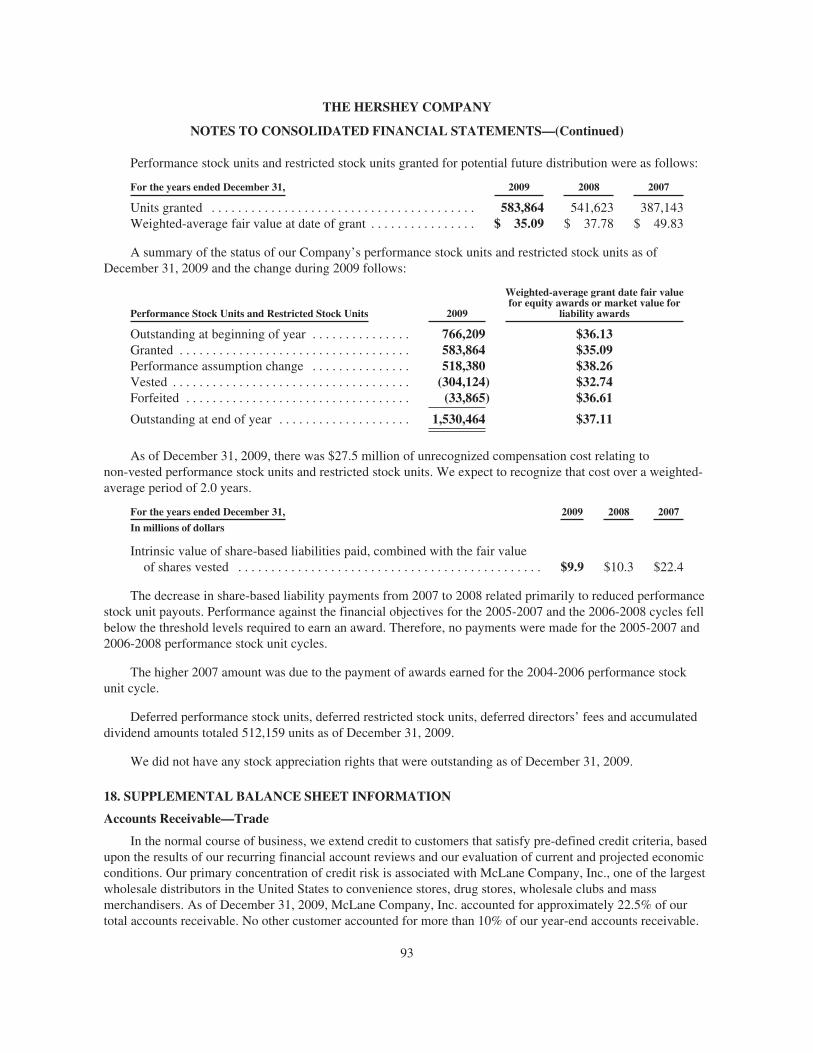
THE HERSHEY COMPANY
NOTES TO CONSOLIDATED FINANCIAL STATEMENTS—(Continued)
Performance stock units and restricted stock units granted for potential future distribution were as follows:
For the years ended December 31, 2009 2008 2007
Units granted . . . . . . . . . . . . . . . . . . . . . . . . . . . . . . . . . . . . . . . . 583,864 541,623 387,143Weighted-average fair value at date of grant . . . . . . . . . . . . . . . . $ 35.09 $ 37.78 $ 49.83
A summary of the status of our Company’s performance stock units and restricted stock units as ofDecember 31, 2009 and the change during 2009 follows:
Performance Stock Units and Restricted Stock Units 2009
Weighted-average grant date fair valuefor equity awards or market value for
liability awards
Outstanding at beginning of year . . . . . . . . . . . . . . . 766,209 $36.13Granted . . . . . . . . . . . . . . . . . . . . . . . . . . . . . . . . . . . 583,864 $35.09Performance assumption change . . . . . . . . . . . . . . . 518,380 $38.26Vested . . . . . . . . . . . . . . . . . . . . . . . . . . . . . . . . . . . . (304,124) $32.74Forfeited . . . . . . . . . . . . . . . . . . . . . . . . . . . . . . . . . . (33,865) $36.61
Outstanding at end of year . . . . . . . . . . . . . . . . . . . . 1,530,464 $37.11
As of December 31, 2009, there was $27.5 million of unrecognized compensation cost relating tonon-vested performance stock units and restricted stock units. We expect to recognize that cost over a weighted-average period of 2.0 years.
For the years ended December 31, 2009 2008 2007
In millions of dollars
Intrinsic value of share-based liabilities paid, combined with the fair valueof shares vested . . . . . . . . . . . . . . . . . . . . . . . . . . . . . . . . . . . . . . . . . . . . . . $9.9 $10.3 $22.4
The decrease in share-based liability payments from 2007 to 2008 related primarily to reduced performancestock unit payouts. Performance against the financial objectives for the 2005-2007 and the 2006-2008 cycles fellbelow the threshold levels required to earn an award. Therefore, no payments were made for the 2005-2007 and2006-2008 performance stock unit cycles.
The higher 2007 amount was due to the payment of awards earned for the 2004-2006 performance stockunit cycle.
Deferred performance stock units, deferred restricted stock units, deferred directors’ fees and accumulateddividend amounts totaled 512,159 units as of December 31, 2009.
We did not have any stock appreciation rights that were outstanding as of December 31, 2009.
18. SUPPLEMENTAL BALANCE SHEET INFORMATION
Accounts Receivable—Trade
In the normal course of business, we extend credit to customers that satisfy pre-defined credit criteria, basedupon the results of our recurring financial account reviews and our evaluation of current and projected economicconditions. Our primary concentration of credit risk is associated with McLane Company, Inc., one of the largestwholesale distributors in the United States to convenience stores, drug stores, wholesale clubs and massmerchandisers. As of December 31, 2009, McLane Company, Inc. accounted for approximately 22.5% of ourtotal accounts receivable. No other customer accounted for more than 10% of our year-end accounts receivable.
93
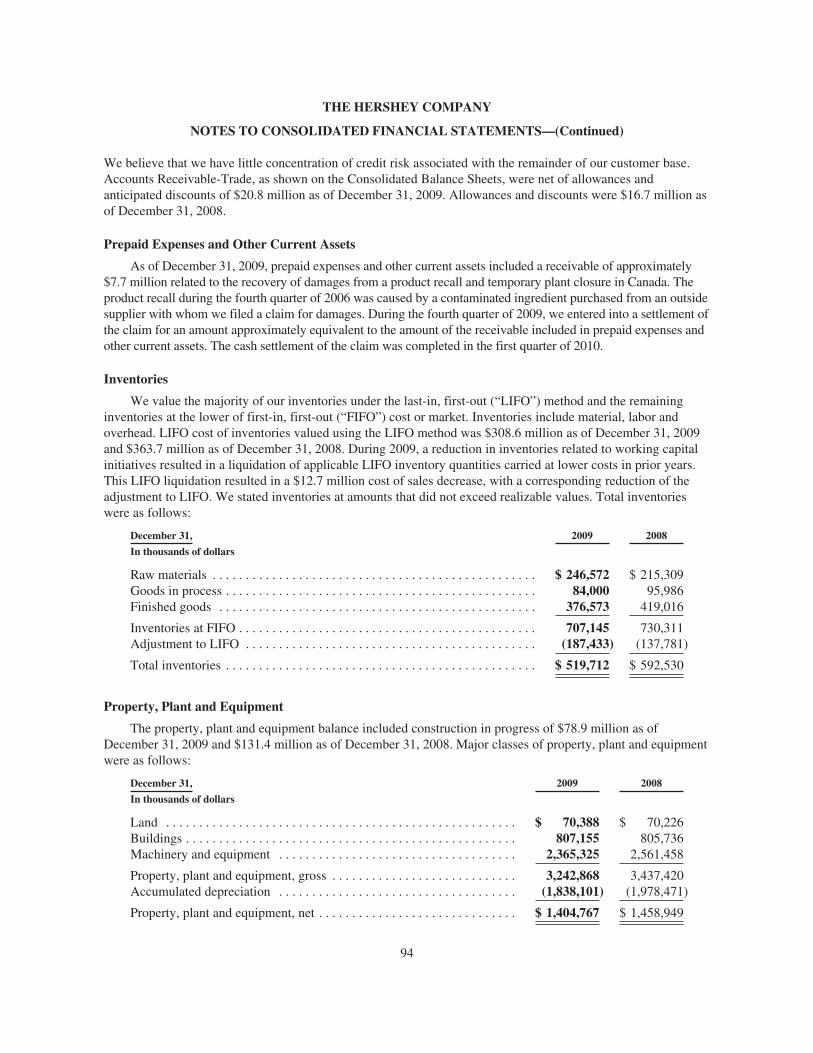
THE HERSHEY COMPANY
NOTES TO CONSOLIDATED FINANCIAL STATEMENTS—(Continued)
We believe that we have little concentration of credit risk associated with the remainder of our customer base.Accounts Receivable-Trade, as shown on the Consolidated Balance Sheets, were net of allowances andanticipated discounts of $20.8 million as of December 31, 2009. Allowances and discounts were $16.7 million asof December 31, 2008.
Prepaid Expenses and Other Current Assets
As of December 31, 2009, prepaid expenses and other current assets included a receivable of approximately$7.7 million related to the recovery of damages from a product recall and temporary plant closure in Canada. Theproduct recall during the fourth quarter of 2006 was caused by a contaminated ingredient purchased from an outsidesupplier with whom we filed a claim for damages. During the fourth quarter of 2009, we entered into a settlement ofthe claim for an amount approximately equivalent to the amount of the receivable included in prepaid expenses andother current assets. The cash settlement of the claim was completed in the first quarter of 2010.
Inventories
We value the majority of our inventories under the last-in, first-out (“LIFO”) method and the remaininginventories at the lower of first-in, first-out (“FIFO”) cost or market. Inventories include material, labor andoverhead. LIFO cost of inventories valued using the LIFO method was $308.6 million as of December 31, 2009and $363.7 million as of December 31, 2008. During 2009, a reduction in inventories related to working capitalinitiatives resulted in a liquidation of applicable LIFO inventory quantities carried at lower costs in prior years.This LIFO liquidation resulted in a $12.7 million cost of sales decrease, with a corresponding reduction of theadjustment to LIFO. We stated inventories at amounts that did not exceed realizable values. Total inventorieswere as follows:
December 31, 2009 2008
In thousands of dollars
Raw materials . . . . . . . . . . . . . . . . . . . . . . . . . . . . . . . . . . . . . . . . . . . . . . . . . $ 246,572 $ 215,309Goods in process . . . . . . . . . . . . . . . . . . . . . . . . . . . . . . . . . . . . . . . . . . . . . . . 84,000 95,986Finished goods . . . . . . . . . . . . . . . . . . . . . . . . . . . . . . . . . . . . . . . . . . . . . . . . 376,573 419,016
Inventories at FIFO . . . . . . . . . . . . . . . . . . . . . . . . . . . . . . . . . . . . . . . . . . . . . 707,145 730,311Adjustment to LIFO . . . . . . . . . . . . . . . . . . . . . . . . . . . . . . . . . . . . . . . . . . . . (187,433) (137,781)
Total inventories . . . . . . . . . . . . . . . . . . . . . . . . . . . . . . . . . . . . . . . . . . . . . . . $ 519,712 $ 592,530
Property, Plant and Equipment
The property, plant and equipment balance included construction in progress of $78.9 million as ofDecember 31, 2009 and $131.4 million as of December 31, 2008. Major classes of property, plant and equipmentwere as follows:
December 31, 2009 2008
In thousands of dollars
Land . . . . . . . . . . . . . . . . . . . . . . . . . . . . . . . . . . . . . . . . . . . . . . . . . . . . . $ 70,388 $ 70,226Buildings . . . . . . . . . . . . . . . . . . . . . . . . . . . . . . . . . . . . . . . . . . . . . . . . . . 807,155 805,736Machinery and equipment . . . . . . . . . . . . . . . . . . . . . . . . . . . . . . . . . . . . 2,365,325 2,561,458
Property, plant and equipment, gross . . . . . . . . . . . . . . . . . . . . . . . . . . . . 3,242,868 3,437,420Accumulated depreciation . . . . . . . . . . . . . . . . . . . . . . . . . . . . . . . . . . . . (1,838,101) (1,978,471)
Property, plant and equipment, net . . . . . . . . . . . . . . . . . . . . . . . . . . . . . . $ 1,404,767 $ 1,458,949
94
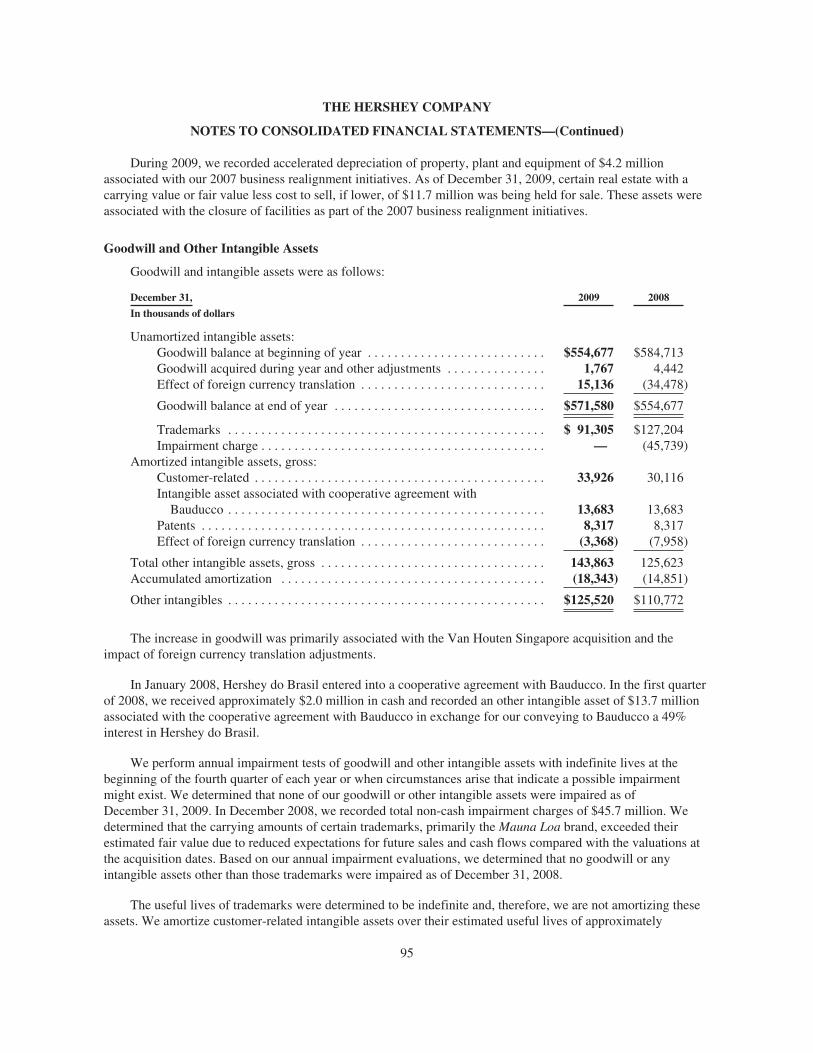
THE HERSHEY COMPANY
NOTES TO CONSOLIDATED FINANCIAL STATEMENTS—(Continued)
During 2009, we recorded accelerated depreciation of property, plant and equipment of $4.2 millionassociated with our 2007 business realignment initiatives. As of December 31, 2009, certain real estate with acarrying value or fair value less cost to sell, if lower, of $11.7 million was being held for sale. These assets wereassociated with the closure of facilities as part of the 2007 business realignment initiatives.
Goodwill and Other Intangible Assets
Goodwill and intangible assets were as follows:
December 31, 2009 2008
In thousands of dollars
Unamortized intangible assets:Goodwill balance at beginning of year . . . . . . . . . . . . . . . . . . . . . . . . . . . $554,677 $584,713Goodwill acquired during year and other adjustments . . . . . . . . . . . . . . . 1,767 4,442Effect of foreign currency translation . . . . . . . . . . . . . . . . . . . . . . . . . . . . 15,136 (34,478)
Goodwill balance at end of year . . . . . . . . . . . . . . . . . . . . . . . . . . . . . . . . $571,580 $554,677
Trademarks . . . . . . . . . . . . . . . . . . . . . . . . . . . . . . . . . . . . . . . . . . . . . . . . $ 91,305 $127,204Impairment charge . . . . . . . . . . . . . . . . . . . . . . . . . . . . . . . . . . . . . . . . . . . — (45,739)
Amortized intangible assets, gross:Customer-related . . . . . . . . . . . . . . . . . . . . . . . . . . . . . . . . . . . . . . . . . . . . 33,926 30,116Intangible asset associated with cooperative agreement with
Bauducco . . . . . . . . . . . . . . . . . . . . . . . . . . . . . . . . . . . . . . . . . . . . . . . . 13,683 13,683Patents . . . . . . . . . . . . . . . . . . . . . . . . . . . . . . . . . . . . . . . . . . . . . . . . . . . . 8,317 8,317Effect of foreign currency translation . . . . . . . . . . . . . . . . . . . . . . . . . . . . (3,368) (7,958)
Total other intangible assets, gross . . . . . . . . . . . . . . . . . . . . . . . . . . . . . . . . . . 143,863 125,623Accumulated amortization . . . . . . . . . . . . . . . . . . . . . . . . . . . . . . . . . . . . . . . . (18,343) (14,851)
Other intangibles . . . . . . . . . . . . . . . . . . . . . . . . . . . . . . . . . . . . . . . . . . . . . . . . $125,520 $110,772
The increase in goodwill was primarily associated with the Van Houten Singapore acquisition and theimpact of foreign currency translation adjustments.
In January 2008, Hershey do Brasil entered into a cooperative agreement with Bauducco. In the first quarterof 2008, we received approximately $2.0 million in cash and recorded an other intangible asset of $13.7 millionassociated with the cooperative agreement with Bauducco in exchange for our conveying to Bauducco a 49%interest in Hershey do Brasil.
We perform annual impairment tests of goodwill and other intangible assets with indefinite lives at thebeginning of the fourth quarter of each year or when circumstances arise that indicate a possible impairmentmight exist. We determined that none of our goodwill or other intangible assets were impaired as ofDecember 31, 2009. In December 2008, we recorded total non-cash impairment charges of $45.7 million. Wedetermined that the carrying amounts of certain trademarks, primarily the Mauna Loa brand, exceeded theirestimated fair value due to reduced expectations for future sales and cash flows compared with the valuations atthe acquisition dates. Based on our annual impairment evaluations, we determined that no goodwill or anyintangible assets other than those trademarks were impaired as of December 31, 2008.
The useful lives of trademarks were determined to be indefinite and, therefore, we are not amortizing theseassets. We amortize customer-related intangible assets over their estimated useful lives of approximately
95
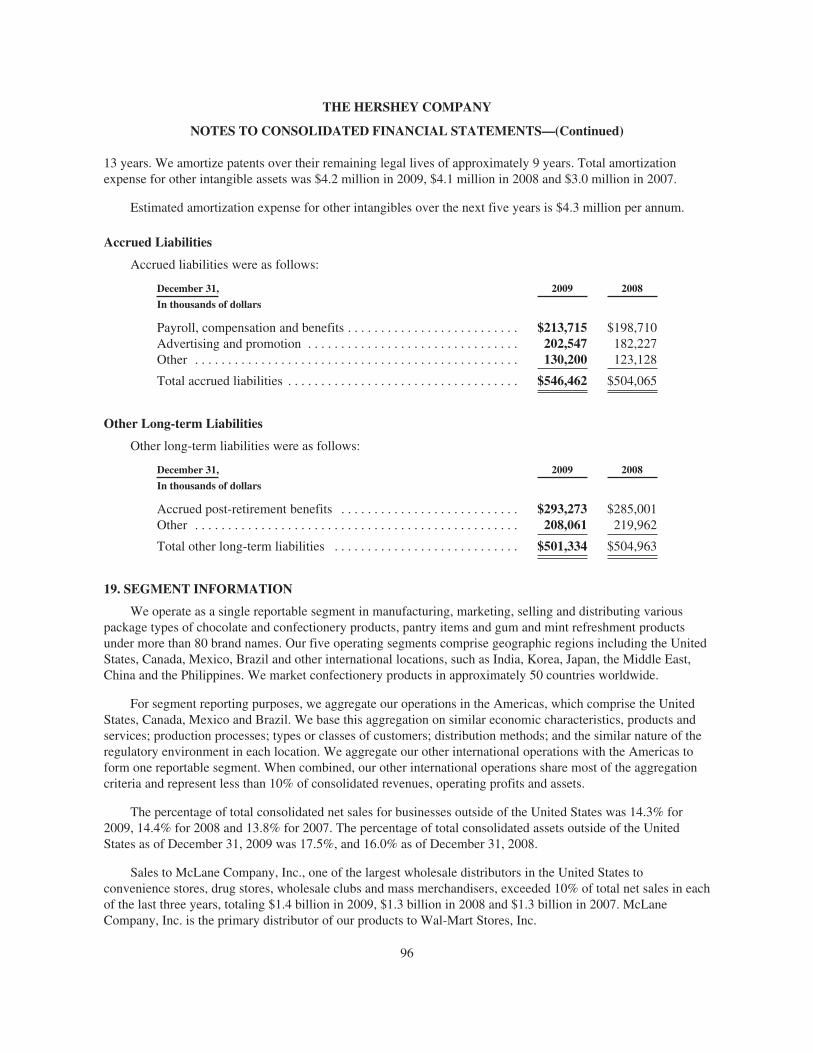
THE HERSHEY COMPANY
NOTES TO CONSOLIDATED FINANCIAL STATEMENTS—(Continued)
13 years. We amortize patents over their remaining legal lives of approximately 9 years. Total amortizationexpense for other intangible assets was $4.2 million in 2009, $4.1 million in 2008 and $3.0 million in 2007.
Estimated amortization expense for other intangibles over the next five years is $4.3 million per annum.
Accrued Liabilities
Accrued liabilities were as follows:
December 31, 2009 2008
In thousands of dollars
Payroll, compensation and benefits . . . . . . . . . . . . . . . . . . . . . . . . . . $213,715 $198,710Advertising and promotion . . . . . . . . . . . . . . . . . . . . . . . . . . . . . . . . 202,547 182,227Other . . . . . . . . . . . . . . . . . . . . . . . . . . . . . . . . . . . . . . . . . . . . . . . . . 130,200 123,128
Total accrued liabilities . . . . . . . . . . . . . . . . . . . . . . . . . . . . . . . . . . . $546,462 $504,065
Other Long-term Liabilities
Other long-term liabilities were as follows:
December 31, 2009 2008
In thousands of dollars
Accrued post-retirement benefits . . . . . . . . . . . . . . . . . . . . . . . . . . . $293,273 $285,001Other . . . . . . . . . . . . . . . . . . . . . . . . . . . . . . . . . . . . . . . . . . . . . . . . . 208,061 219,962
Total other long-term liabilities . . . . . . . . . . . . . . . . . . . . . . . . . . . . $501,334 $504,963
19. SEGMENT INFORMATION
We operate as a single reportable segment in manufacturing, marketing, selling and distributing variouspackage types of chocolate and confectionery products, pantry items and gum and mint refreshment productsunder more than 80 brand names. Our five operating segments comprise geographic regions including the UnitedStates, Canada, Mexico, Brazil and other international locations, such as India, Korea, Japan, the Middle East,China and the Philippines. We market confectionery products in approximately 50 countries worldwide.
For segment reporting purposes, we aggregate our operations in the Americas, which comprise the UnitedStates, Canada, Mexico and Brazil. We base this aggregation on similar economic characteristics, products andservices; production processes; types or classes of customers; distribution methods; and the similar nature of theregulatory environment in each location. We aggregate our other international operations with the Americas toform one reportable segment. When combined, our other international operations share most of the aggregationcriteria and represent less than 10% of consolidated revenues, operating profits and assets.
The percentage of total consolidated net sales for businesses outside of the United States was 14.3% for2009, 14.4% for 2008 and 13.8% for 2007. The percentage of total consolidated assets outside of the UnitedStates as of December 31, 2009 was 17.5%, and 16.0% as of December 31, 2008.
Sales to McLane Company, Inc., one of the largest wholesale distributors in the United States toconvenience stores, drug stores, wholesale clubs and mass merchandisers, exceeded 10% of total net sales in eachof the last three years, totaling $1.4 billion in 2009, $1.3 billion in 2008 and $1.3 billion in 2007. McLaneCompany, Inc. is the primary distributor of our products to Wal-Mart Stores, Inc.
96
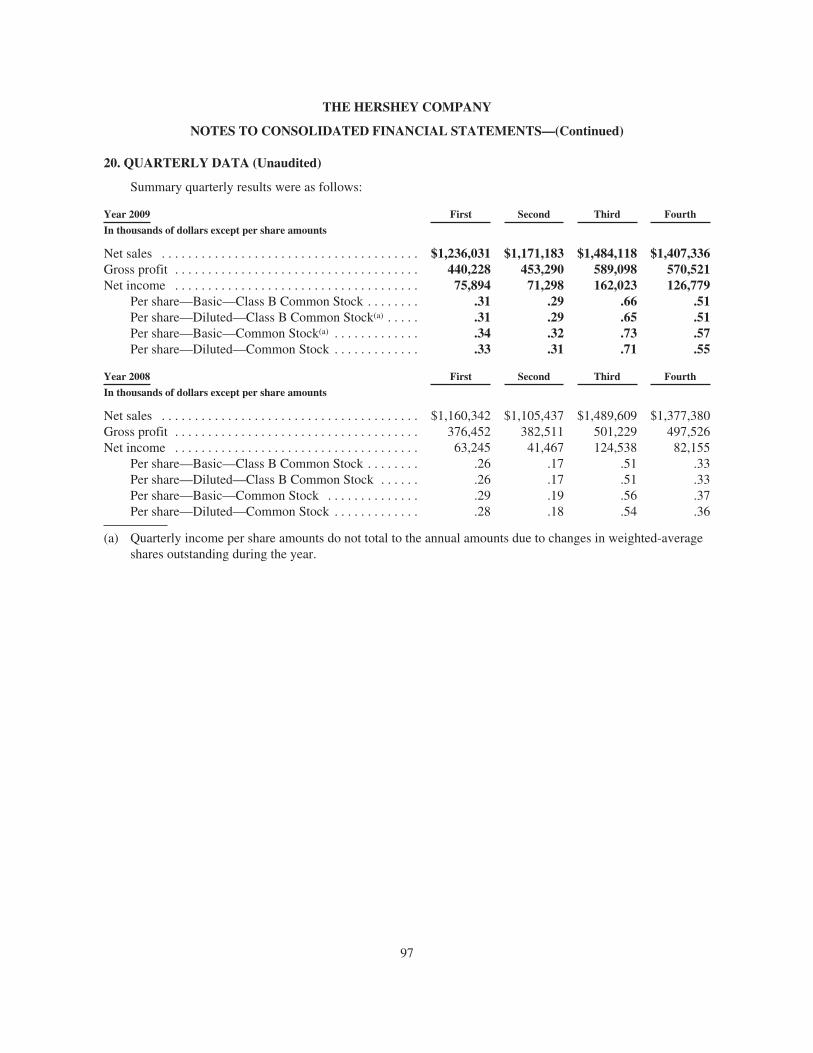
THE HERSHEY COMPANY
NOTES TO CONSOLIDATED FINANCIAL STATEMENTS—(Continued)
20. QUARTERLY DATA (Unaudited)
Summary quarterly results were as follows:
Year 2009 First Second Third Fourth
In thousands of dollars except per share amounts
Net sales . . . . . . . . . . . . . . . . . . . . . . . . . . . . . . . . . . . . . . . $1,236,031 $1,171,183 $1,484,118 $1,407,336Gross profit . . . . . . . . . . . . . . . . . . . . . . . . . . . . . . . . . . . . . 440,228 453,290 589,098 570,521Net income . . . . . . . . . . . . . . . . . . . . . . . . . . . . . . . . . . . . . 75,894 71,298 162,023 126,779
Per share—Basic—Class B Common Stock . . . . . . . . .31 .29 .66 .51Per share—Diluted—Class B Common Stock(a) . . . . . .31 .29 .65 .51Per share—Basic—Common Stock(a) . . . . . . . . . . . . . .34 .32 .73 .57Per share—Diluted—Common Stock . . . . . . . . . . . . . .33 .31 .71 .55
Year 2008 First Second Third Fourth
In thousands of dollars except per share amounts
Net sales . . . . . . . . . . . . . . . . . . . . . . . . . . . . . . . . . . . . . . . $1,160,342 $1,105,437 $1,489,609 $1,377,380Gross profit . . . . . . . . . . . . . . . . . . . . . . . . . . . . . . . . . . . . . 376,452 382,511 501,229 497,526Net income . . . . . . . . . . . . . . . . . . . . . . . . . . . . . . . . . . . . . 63,245 41,467 124,538 82,155
Per share—Basic—Class B Common Stock . . . . . . . . .26 .17 .51 .33Per share—Diluted—Class B Common Stock . . . . . . .26 .17 .51 .33Per share—Basic—Common Stock . . . . . . . . . . . . . . .29 .19 .56 .37Per share—Diluted—Common Stock . . . . . . . . . . . . . .28 .18 .54 .36
(a) Quarterly income per share amounts do not total to the annual amounts due to changes in weighted-averageshares outstanding during the year.
97
Item 9. CHANGES IN AND DISAGREEMENTS WITH ACCOUNTANTS ON ACCOUNTING ANDFINANCIAL DISCLOSURE
None.
Item 9A. CONTROLS AND PROCEDURES
As required by Rule 13a-15 under the Securities Exchange Act of 1934 (the “Exchange Act”), the Companyconducted an evaluation of the effectiveness of the design and operation of the Company’s disclosure controlsand procedures as of December 31, 2009. This evaluation was carried out under the supervision and with theparticipation of the Company’s management, including the Company’s Chief Executive Officer and ChiefFinancial Officer. Based upon that evaluation, the Chief Executive Officer and Chief Financial Officer concludedthat the Company’s disclosure controls and procedures are effective. There has been no change during the mostrecent fiscal quarter in the Company’s internal control over financial reporting identified in connection with theevaluation that has materially affected, or is likely to materially affect, the Company’s internal control overfinancial reporting.
Disclosure controls and procedures are controls and other procedures that are designed to ensure thatinformation required to be disclosed in the Company’s reports filed or submitted under the Exchange Act isrecorded, processed, summarized and reported within the time periods specified in the Securities and ExchangeCommission’s rules and forms. Disclosure controls and procedures include, without limitation, controls andprocedures designed to ensure that information required to be disclosed in the Company’s reports filed under theExchange Act is accumulated and communicated to management, including the Company’s Chief ExecutiveOfficer and Chief Financial Officer, as appropriate, to allow timely decisions regarding required disclosure.
The Company’s Common Stock is listed on the New York Stock Exchange (“NYSE”) under the tickersymbol “HSY.”
98
MANAGEMENT REPORT ON INTERNAL CONTROL OVER FINANCIAL REPORTING
The management of The Hershey Company is responsible for establishing and maintaining adequate internalcontrol over financial reporting, as such term is defined in Exchange Act Rule 13a-15(f). The Company’s internalcontrol system was designed to provide reasonable assurance to the Company’s management and Board ofDirectors regarding the preparation and fair presentation of published financial statements.
All internal control systems, no matter how well designed, have inherent limitations. Therefore, even thosesystems determined to be effective can provide only reasonable assurance with respect to financial statementpreparation and presentation.
The Company’s management, including the Company’s Chief Executive Officer and Chief FinancialOfficer, assessed the effectiveness of the Company’s internal control over financial reporting as of December 31,2009. In making this assessment, the Company’s management used the criteria set forth by the Committee ofSponsoring Organizations of the Treadway Commission (COSO) in Internal Control-Integrated Framework.Based on this assessment, management believes that, as of December 31, 2009, the Company’s internal controlover financial reporting was effective based on those criteria.
David J. WestChief Executive Officer
Humberto P. AlfonsoChief Financial Officer
99
REPORT OF INDEPENDENT REGISTERED PUBLIC ACCOUNTING FIRM
The Board of Directors and StockholdersThe Hershey Company:
We have audited The Hershey Company and subsidiaries (the “Company”) internal control over financialreporting as of December 31, 2009, based on criteria established in Internal Control-Integrated Framework issuedby the Committee of Sponsoring Organizations of the Treadway Commission (COSO). The Company’smanagement is responsible for maintaining effective internal control over financial reporting and for itsassessment of the effectiveness of internal control over financial reporting, included in the accompanyingmanagement report on internal control over financial reporting. Our responsibility is to express an opinion on theCompany’s internal control over financial reporting based on our audit.
We conducted our audit in accordance with the standards of the Public Company Accounting OversightBoard (United States). Those standards require that we plan and perform the audit to obtain reasonable assuranceabout whether effective internal control over financial reporting was maintained in all material respects. Ouraudit included obtaining an understanding of internal control over financial reporting, assessing the risk that amaterial weakness exists, and testing and evaluating the design and operating effectiveness of internal controlbased on the assessed risk. Our audit also included performing such other procedures as we considered necessaryin the circumstances. We believe that our audit provides a reasonable basis for our opinion.
A company’s internal control over financial reporting is a process designed to provide reasonable assuranceregarding the reliability of financial reporting and the preparation of financial statements for external purposes inaccordance with generally accepted accounting principles. A company’s internal control over financial reportingincludes those policies and procedures that (1) pertain to the maintenance of records that, in reasonable detail,accurately and fairly reflect the transactions and dispositions of the assets of the company; (2) provide reasonableassurance that transactions are recorded as necessary to permit preparation of financial statements in accordancewith generally accepted accounting principles, and that receipts and expenditures of the company are being madeonly in accordance with authorizations of management and directors of the company; and (3) provide reasonableassurance regarding prevention or timely detection of unauthorized acquisition, use, or disposition of thecompany’s assets that could have a material effect on the financial statements.
Because of its inherent limitations, internal control over financial reporting may not prevent or detectmisstatements. Also, projections of any evaluation of effectiveness to future periods are subject to the risk thatcontrols may become inadequate because of changes in conditions, or that the degree of compliance with thepolicies or procedures may deteriorate.
In our opinion, the Company maintained, in all material respects, effective internal control over financialreporting as of December 31, 2009, based on criteria established in Internal Control-Integrated Framework issuedby the Committee of Sponsoring Organizations of the Treadway Commission.
We also have audited, in accordance with the standards of the Public Company Accounting Oversight Board(United States), the consolidated balance sheets of The Hershey Company as of December 31, 2009 and 2008,and the related consolidated statements of income, cash flows and stockholders’ equity for each of the years inthe three-year period ended December 31, 2009, and our report dated February 19, 2010 expressed an unqualifiedopinion on those consolidated financial statements.
New York, New YorkFebruary 19, 2010
100

Item 9B. OTHER INFORMATION
None.
101
PART III
Item 10. DIRECTORS, EXECUTIVE OFFICERS AND CORPORATE GOVERNANCE
The names, ages, positions held with our Company, periods of service as a director, principal occupations,business experience and other directorships of directors and nominees for director of our Company, together witha discussion of the specific experience, qualifications, attributes and skills that led the Board to conclude that thedirector or nominee should serve as a director at this time, are located in the Proxy Statement in the sectionentitled “Proposal No. 1—Election of Directors,” following the question “Who are the nominees?,” whichinformation is incorporated herein by reference.
Our Executive Officers as of February 10, 2010
Name Age Positions Held During the Last Five Years
David J. West . . . . . . . . . . . . 46 President and Chief Executive Officer (December 2007); President (October2007); Executive Vice President, Chief Operating Officer (and ChiefFinancial Officer until July 2007, when his successor to that position waselected) (January 2007); Senior Vice President, Chief Financial Officer(January 2005)
Humberto P. Alfonso(1) . . . . 52 Senior Vice President, Chief Financial Officer (July 2007); Vice President,Finance and Planning, North American Commercial Group (October 2006);Vice President, Finance and Planning, U.S. Commercial Group (July 2006)
John P. Bilbrey . . . . . . . . . . 53 Senior Vice President, President Hershey North America (December 2007);Senior Vice President, President International Commercial Group (November2005); Senior Vice President, President Hershey International (November2003)
Charlene H. Binder(2) . . . . . . 49 Senior Vice President, Chief People Officer (April 2008)Michele G. Buck(3) . . . . . . . . 48 Senior Vice President, Global Chief Marketing Officer (December 2007);
Senior Vice President, Chief Marketing Officer, U.S. Commercial Group(November 2005); Senior Vice President, President U.S. Snacks (April 2005)
George F. Davis . . . . . . . . . . 61 Senior Vice President, Chief Information Officer (June 2008); Vice President,Chief Information Officer (December 2000)
Javier H. Idrovo(4) . . . . . . . . 42 Senior Vice President, Strategy and Business Development (December 2008)Thaddeus J. Jastrzebski . . . . 48 Senior Vice President, President Hershey International (December 2007);
Vice President, International Finance and Planning (September 2004)Terence L. O’Day(5) . . . . . . . 60 Senior Vice President, Global Operations (December 2008)Burton H. Snyder . . . . . . . . . 62 Senior Vice President, General Counsel and Secretary (November 2003)C. Daniel Azzara . . . . . . . . . 55 Vice President, Global Research and Development (April 2007); Vice
President, Global Innovation and Quality (October 2005); Vice President,Global Research and Development (June 2004)
David W. Tacka . . . . . . . . . . 56 Vice President, Chief Accounting Officer (February 2004)
There are no family relationships among any of the above-named officers of our Company.
(1) Mr. Alfonso was elected Vice President, Finance and Planning, U.S. Commercial Group effective July 17,2006. Prior to joining our Company he was Executive Vice President Finance, Chief Financial Officer,Americas Beverages, Cadbury Schweppes (March 2005); Vice President Finance, Global Supply Chain,Cadbury Schweppes (May 2003).
(2) Ms. Binder was elected Senior Vice President, Chief People Officer effective April 21, 2008. Prior tojoining our Company, Ms. Binder was Vice President, Human Resources for North America, The DannonCompany (January 2006); Senior Vice President, Global Human Resources, Unilever CosmeticsInternational (January 2001).
102
(3) Ms. Buck was elected Senior Vice President, President U.S. Snacks effective April 19, 2005. Prior tojoining our Company, Ms. Buck was Senior Vice President and General Manager, Kraft Confections(October 2001).
(4) Mr. Idrovo was elected Senior Vice President, Strategy and Business Development effective December 2,2008. Prior to joining our Company he was President, Dole Packaged Foods, LLC (January 2006); VicePresident and Chief Financial Officer, Dole Packaged Foods (April 2005); Senior Vice President, Strategy,Dole Food Company, Inc. (September 2004).
(5) Mr. O’Day was elected Senior Vice President, Global Operations effective December 2, 2008. Prior tojoining our Company he was Executive Vice President and Chief Operating Officer of Mannatech, Inc.(June 2006); Executive Vice President Operations, Refrigerated Foods, Conagra Refrigerated FoodsCompanies (January 2001).
Our Executive Officers are generally elected each year at the organization meeting of the Board in April.
Information regarding the identification of the Audit Committee as a separately-designated standingcommittee of the Board and information regarding the status of one or more members of the Audit Committeebeing an “audit committee financial expert” is located in the Proxy Statement in the section entitled “Governanceof the Company,” following the question “What are the committees of the Board and what are their functions?,”which information is incorporated herein by reference.
Reporting of any inadvertent late filings under Section 16(a) of the Securities Exchange Act of 1934, asamended, is located in the section of the Proxy Statement entitled “Section 16(a) Beneficial Ownership ReportingCompliance.” This information is incorporated herein by reference.
Information regarding our Code of Ethical Business Conduct applicable to our directors, officers andemployees is located in Part I of this Annual Report on Form 10-K, under the heading “Available Information.”
Item 11. EXECUTIVE COMPENSATION
Information regarding compensation of each of the named executive officers, including our Chief ExecutiveOfficer, and the Compensation Committee Report are set forth in the section of the Proxy Statement entitled“Executive Compensation,” which information is incorporated herein by reference. Information regardingcompensation of our directors is located in the section of the Proxy Statement entitled “Director Compensation,”which information is incorporated herein by reference.
Item 12. SECURITY OWNERSHIP OF CERTAIN BENEFICIAL OWNERS AND MANAGEMENT ANDRELATED STOCKHOLDER MATTERS
(a) Information concerning ownership of our voting securities by certain beneficial owners, individualnominees for director, the named executive officers, including persons serving as our Chief Executive Officerand Chief Financial Officer, and executive officers as a group, is set forth in the section entitled “Ownership ofthe Company’s Securities” in the Proxy Statement, which information is incorporated herein by reference.
103
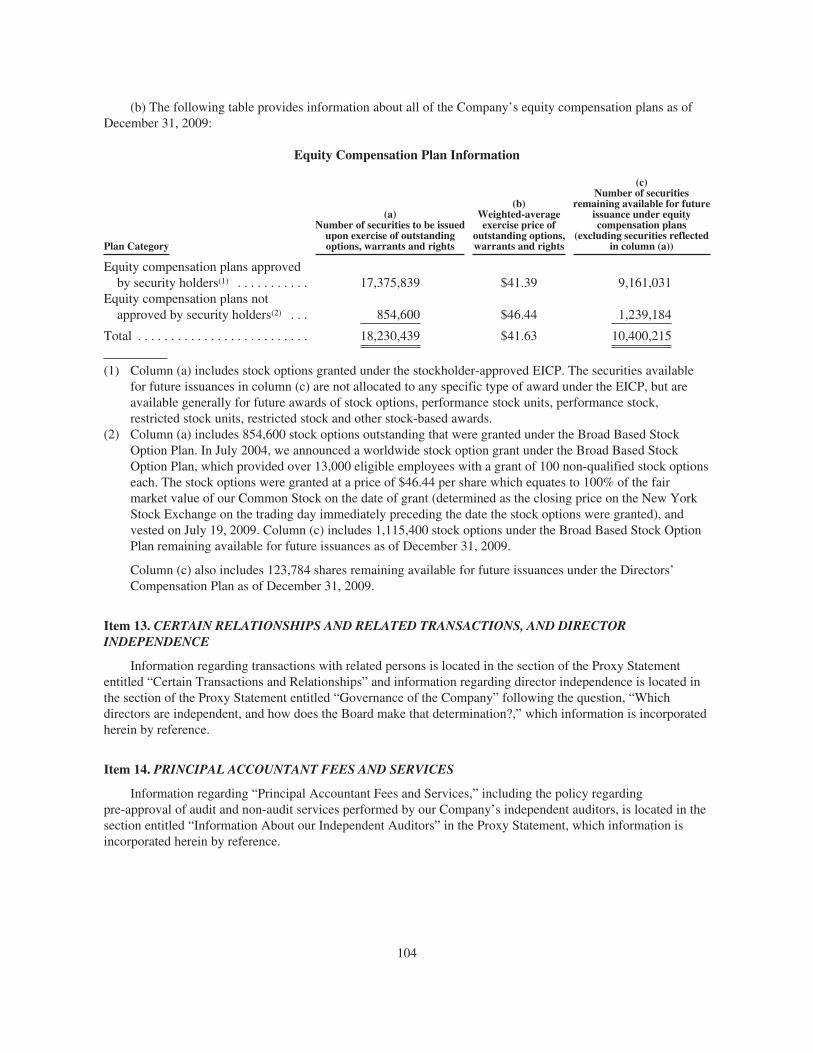
(b) The following table provides information about all of the Company’s equity compensation plans as ofDecember 31, 2009:
Equity Compensation Plan Information
Plan Category
(a)Number of securities to be issued
upon exercise of outstandingoptions, warrants and rights
(b)Weighted-averageexercise price of
outstanding options,warrants and rights
(c)Number of securities
remaining available for futureissuance under equitycompensation plans
(excluding securities reflectedin column (a))
Equity compensation plans approvedby security holders(1) . . . . . . . . . . . 17,375,839 $41.39 9,161,031
Equity compensation plans notapproved by security holders(2) . . . 854,600 $46.44 1,239,184
Total . . . . . . . . . . . . . . . . . . . . . . . . . . 18,230,439 $41.63 10,400,215
(1) Column (a) includes stock options granted under the stockholder-approved EICP. The securities availablefor future issuances in column (c) are not allocated to any specific type of award under the EICP, but areavailable generally for future awards of stock options, performance stock units, performance stock,restricted stock units, restricted stock and other stock-based awards.
(2) Column (a) includes 854,600 stock options outstanding that were granted under the Broad Based StockOption Plan. In July 2004, we announced a worldwide stock option grant under the Broad Based StockOption Plan, which provided over 13,000 eligible employees with a grant of 100 non-qualified stock optionseach. The stock options were granted at a price of $46.44 per share which equates to 100% of the fairmarket value of our Common Stock on the date of grant (determined as the closing price on the New YorkStock Exchange on the trading day immediately preceding the date the stock options were granted), andvested on July 19, 2009. Column (c) includes 1,115,400 stock options under the Broad Based Stock OptionPlan remaining available for future issuances as of December 31, 2009.
Column (c) also includes 123,784 shares remaining available for future issuances under the Directors’Compensation Plan as of December 31, 2009.
Item 13. CERTAIN RELATIONSHIPS AND RELATED TRANSACTIONS, AND DIRECTORINDEPENDENCE
Information regarding transactions with related persons is located in the section of the Proxy Statemententitled “Certain Transactions and Relationships” and information regarding director independence is located inthe section of the Proxy Statement entitled “Governance of the Company” following the question, “Whichdirectors are independent, and how does the Board make that determination?,” which information is incorporatedherein by reference.
Item 14. PRINCIPAL ACCOUNTANT FEES AND SERVICES
Information regarding “Principal Accountant Fees and Services,” including the policy regardingpre-approval of audit and non-audit services performed by our Company’s independent auditors, is located in thesection entitled “Information About our Independent Auditors” in the Proxy Statement, which information isincorporated herein by reference.
104
PART IV
Item 15. EXHIBITS AND FINANCIAL STATEMENT SCHEDULES
Item 15(a)(1): Financial Statements
The audited consolidated financial statements of the Company and its subsidiaries and the Report of theIndependent Registered Public Accounting Firm thereon, as required to be filed with this report, are locatedunder Item 8 of this report.
Item 15(a)(2): Financial Statement Schedule
Schedule II—Valuation and Qualifying Accounts (see Page 111) for our Company and its subsidiaries forthe years ended December 31, 2009, 2008 and 2007 is filed as required by Item 15(c).
We omitted other schedules which were not applicable or not required, or because we provided the requiredinformation in the consolidated financial statements or the notes to consolidated financial statements.
We omitted the financial statements of our parent company because we are primarily an operating companyand there are no significant restricted net assets of consolidated and unconsolidated subsidiaries.
Item 15(a)(3): Exhibits
The following items are attached or incorporated by reference in response to Item 15(c):
Articles of Incorporation and By-laws
3.1 The Company’s Restated Certificate of Incorporation, as amended, is incorporated by reference fromExhibit 3 to the Company’s Quarterly Report on Form 10-Q for the quarter ended April 3, 2005. TheBy-laws, as amended and restated as of December 4, 2007, are incorporated by reference from Exhibit3.1 to the Company’s Current Report on Form 8-K, filed December 7, 2007.
Instruments defining the Rights of security holders, including indentures
4.1 Stockholder Protection Rights Agreement between the Company and Mellon Investor Services LLC, asRights Agent, dated December 14, 2000, is incorporated by reference from Exhibit 4.1 to the Company’sAnnual Report on Form 10-K for the fiscal year ended December 31, 2000.
4.2 The Company has issued certain long-term debt instruments, no one class of which creates indebtednessexceeding 10% of the total assets of the Company and its subsidiaries on a consolidated basis. Theseclasses consist of the following:
1) 5.300% Notes due 2011
2) 6.95% Notes due 2012
3) 5.00% Notes due 2013
4) 4.850% Notes due 2015
5) 5.450% Notes due 2016
6) 8.8% Debentures due 2021
7) 7.2% Debentures due 2027
8) Other Obligations
105
We will furnish copies of the above debt instruments to the Commission upon request.
Material contracts
10.1 Kit Kat and Rolo License Agreement (the “License Agreement”) between the Company and RowntreeMackintosh Confectionery Limited is incorporated by reference from Exhibit 10(a) to the Company’sAnnual Report on Form 10-K for the fiscal year ended December 31, 1980. The License Agreementwas amended in 1988 and the Amendment Agreement is incorporated by reference from Exhibit 19 tothe Company’s Quarterly Report on Form 10-Q for the quarter ended July 3, 1988. The LicenseAgreement was assigned by Rowntree Mackintosh Confectionery Limited to Societe des ProduitsNestle SA as of January 1, 1990. The Assignment Agreement is incorporated by reference fromExhibit 19 to the Company’s Annual Report on Form 10-K for the fiscal year ended December 31,1990.
10.2 Peter Paul/York Domestic Trademark & Technology License Agreement between the Company andCadbury Schweppes Inc. (now Cadbury Ireland Limited) dated August 25, 1988, is incorporated byreference from Exhibit 2(a) to the Company’s Current Report on Form 8-K dated September 8, 1988.This agreement was assigned by the Company to its wholly-owned subsidiary, Hershey Chocolate &Confectionery Corporation.
10.3 Cadbury Trademark & Technology License Agreement between the Company and Cadbury Limited(now Cadbury UK Limited) dated August 25, 1988, is incorporated by reference from Exhibit 2(a) tothe Company’s Current Report on Form 8-K dated September 8, 1988. This agreement was assigned bythe Company to its wholly-owned subsidiary, Hershey Chocolate & Confectionery Corporation.
10.4 Trademark and Technology License Agreement between Huhtamaki and the Company datedDecember 30, 1996, is incorporated by reference from Exhibit 10 to the Company’s Current Report onForm 8-K dated February 26, 1997. This agreement was assigned by the Company to its wholly-ownedsubsidiary, Hershey Chocolate & Confectionery Corporation. The agreement was amended and restatedin 1999 and the Amended and Restated Trademark and Technology License Agreement is incorporatedby reference from Exhibit 10.2 to the Company’s Annual Report on Form 10-K for the fiscal year endedDecember 31, 1999.
10.5 Five Year Credit Agreement dated as of December 8, 2006 among the Company and the banks,financial institutions and other institutional lenders listed on the respective signature pages thereof(“Lenders”), Citibank, N.A., as administrative agent for the Lenders (as defined therein), Bank ofAmerica, N.A., as syndication agent, UBS Loan Finance LLC, as documentation agent, and CitigroupGlobal Markets, Inc. and Banc of America Securities LLC, as joint lead arrangers and joint bookmanagers is incorporated by reference from Exhibit 10.1 to the Company’s Current Report onForm 8-K, filed December 11, 2006.
10.6 Master Innovation and Supply Agreement between the Company and Barry Callebaut, AG, datedJuly 13, 2007, is incorporated by reference from Exhibit 10.1 to the Company’s Current Report onForm 8-K, filed July 19, 2007.
10.7 Supply Agreement for Monterrey, Mexico, between the Company and Barry Callebaut, AG, datedJuly 13, 2007, is incorporated by reference from Exhibit 10.2 to the Company’s Current Report onForm 8-K, filed July 19, 2007.
Executive Compensation Plans and Management Contracts
10.8 The Long-Term Incentive Program Participation Agreement is incorporated by reference fromExhibit 10.2 to the Company’s Current Report on Form 8-K filed February 18, 2005.
10.9 The Company’s Equity and Incentive Compensation Plan, as approved by our stockholders on April 17,2007, is incorporated by reference from Exhibit 10.1 to the Company’s Current Report on Form 8-Kfiled April 20, 2007.
106
10.10 Terms and Conditions of Nonqualified Stock Option Awards under the Equity and IncentiveCompensation Plan is incorporated by reference from Exhibit 10.1 to the Company’s Quarterly Reporton Form 10-Q for the quarter ended July 5, 2009.
10.11 The Company’s Executive Benefits Protection Plan (Group 3A), Amended and Restated as of July 1,2009, is incorporated by reference from Exhibit 10.2 to the Company’s Quarterly Report onForm 10-Q for the quarter ended July 5, 2009.
10.12 First Amendment to The Hershey Company Executive Benefits Protection Plan (Group 3A), Amendedand Restated as of July 1, 2009, is attached hereto and filed as Exhibit 10.12.
10.13 The Company’s Deferred Compensation Plan, Amended and Restated as of October 1, 2007, isincorporated by reference from Exhibit 10.5 to the Company’s Annual Report on Form 10-K for thefiscal year ended December 31, 2007.
10.14 First Amendment to The Hershey Company Deferred Compensation Plan (Amended and Restated asof October 1, 2007) is incorporated by reference from Exhibit 10.1 to the Company’s Quarterly Reporton Form 10-Q for the quarter ended June 29, 2008.
10.15 Second Amendment to The Hershey Company Deferred Compensation Plan (Amended and Restatedas of October 1, 2007) is incorporated by reference from Exhibit 10.3 to the Company’s AnnualReport on Form 10-K for the fiscal year ended December 31, 2008.
10.16 Executive Confidentiality and Restrictive Covenant Agreement is incorporated by reference fromExhibit 10.4 to the Company’s Quarterly Report on Form 10-Q for the quarter ended March 30, 2008.
10.17 Executive Confidentiality and Restrictive Covenant Agreement, adopted as of February 16, 2009, isincorporated by reference from Exhibit 10.4 to the Company’s Annual Report on Form 10-K for thefiscal year ended December 31, 2008.
10.18 The Company’s Supplemental Executive Retirement Plan, Amended and Restated as of October 2,2007, is incorporated by reference from Exhibit 10.6 to the Company’s Annual Report on Form 10-Kfor the fiscal year ended December 31, 2007.
10.19 First Amendment to the Company’s Supplemental Executive Retirement Plan, Amended and Restatedas of October 2, 2007, is incorporated by reference from Exhibit 10.5 to the Company’s Annual Reporton Form 10-K for the fiscal year ended December 31, 2008.
10.20 The Company’s Compensation Limit Replacement Plan, Amended and Restated as of January 1, 2009,is incorporated by reference from Exhibit 10.6 to the Company’s Annual Report on Form 10-K for thefiscal year ended December 31, 2008.
10.21 The Amended and Restated Executive Employment Agreement between the Company and DavidJ. West, dated as of October 2, 2007, is incorporated by reference from Exhibit 10.9 to the Company’sAnnual Report on Form 10-K for the fiscal year ended December 31, 2007.
10.22 First Amendment to Amended and Restated Executive Employment Agreement between the Companyand David J. West, effective as of February 13, 2008, is incorporated by reference from Exhibit 10.2 tothe Company’s Quarterly Report on Form 10-Q for the quarter ended March 30, 2008.
10.23 Second Amendment to Amended and Restated Executive Employment Agreement between theCompany and David J. West, effective as of December 29, 2008, is incorporated by reference fromExhibit 10.7 to the Company’s Annual Report on Form 10-K for the fiscal year ended December 31,2008.
10.24 Letter confirming changes to compensation of Burton H. Snyder, dated June 16, 2008, is incorporatedby reference from Exhibit 10.2 to the Company’s Quarterly Report on Form 10-Q for the quarterended June 29, 2008.
107

10.25 The Company’s Directors’ Compensation Plan, Amended and Restated as of December 2, 2008, isincorporated by reference from Exhibit 10.8 to the Company’s Annual Report on Form 10-K for thefiscal year ended December 31, 2008.
Broad Based Equity Compensation Plans
10.26 The Company’s Broad Based Stock Option Plan, as amended, is incorporated by reference fromExhibit 10.4 to the Company’s Annual Report on Form 10-K for the fiscal year ended December 31,2002.
Other Exhibits
12.1 Computation of ratio of earnings to fixed charges statement
A computation of ratio of earnings to fixed charges for the fiscal years ended December 31, 2009,2008, 2007, 2006 and 2005 is attached hereto and filed as Exhibit 12.1.
21.1 Subsidiaries of the Registrant
A list setting forth subsidiaries of the Company is attached hereto and filed as Exhibit 21.1.
23.1 Independent Auditors’ Consent
The consent dated February 19, 2010 to the incorporation of reports of the Company’s IndependentAuditors is attached hereto and filed as Exhibit 23.1.
31.1 Certification of David J. West, Chief Executive Officer, pursuant to Section 302 of the Sarbanes-Oxley Act of 2002, is attached hereto and filed as Exhibit 31.1.
31.2 Certification of Humberto P. Alfonso, Chief Financial Officer, pursuant to Section 302 of theSarbanes-Oxley Act of 2002, is attached hereto and filed as Exhibit 31.2.
32.1 Certification of David J. West, Chief Executive Officer, and Humberto P. Alfonso, Chief FinancialOfficer, pursuant to Section 906 of the Sarbanes-Oxley Act of 2002 is attached hereto and furnished asExhibit 32.1.
108
SIGNATURES
Pursuant to the requirements of Section 13 or 15(d) of the Securities Exchange Act of 1934, the Companyhas duly caused this report to be signed on its behalf by the undersigned, thereunto duly authorized, this19th day of February, 2010.
THE HERSHEY COMPANY
(Registrant)
By: /S/ HUMBERTO P. ALFONSO
Humberto P. AlfonsoSenior Vice President, Chief Financial Officer
Pursuant to the requirements of the Securities Exchange Act of 1934, this report has been signed below bythe following persons on behalf of the Company and in the capacities and on the date indicated.
Signature Title Date
/S/ DAVID J. WEST
(David J. West)Chief Executive Officer and Director February 19, 2010
/S/ HUMBERTO P. ALFONSO
(Humberto P. Alfonso)Chief Financial Officer February 19, 2010
/S/ DAVID W. TACKA
(David W. Tacka)Chief Accounting Officer February 19, 2010
/S/ ROBERT F. CAVANAUGH
(Robert F. Cavanaugh)
Director February 19, 2010
/S/ CHARLES A. DAVIS
(Charles A. Davis)Director February 19, 2010
/S/ JAMES E. NEVELS
(James E. Nevels)Director February 19, 2010
/S/ THOMAS J. RIDGE
(Thomas J. Ridge)Director February 19, 2010
/S/ DAVID L. SHEDLARZ
(David L. Shedlarz)Director February 19, 2010
/S/ LEROY S. ZIMMERMAN
(LeRoy S. Zimmerman)
Director February 19, 2010
109
REPORT OF INDEPENDENT REGISTERED PUBLIC ACCOUNTING FIRM
The Board of Directors and StockholdersThe Hershey Company:
Under date of February 19, 2010, we reported on the consolidated balance sheets of The Hershey Companyand subsidiaries as of December 31, 2009 and 2008, and the related consolidated statements of income, cashflows and stockholders’ equity for each of the years in the three-year period ended December 31, 2009, which areincluded in The Hershey Company’s Annual Report on Form 10-K. In connection with our audits of theaforementioned consolidated financial statements, we also audited the related financial statement schedule. Thisfinancial statement schedule is the responsibility of the Company’s management. Our responsibility is to expressan opinion on this financial statement schedule based on our audits.
In our opinion, such financial statement schedule, when considered in relation to the basic consolidatedfinancial statements taken as a whole, presents fairly, in all material respects, the information set forth therein.
/s/ KPMG LLP
New York, New YorkFebruary 19, 2010
110
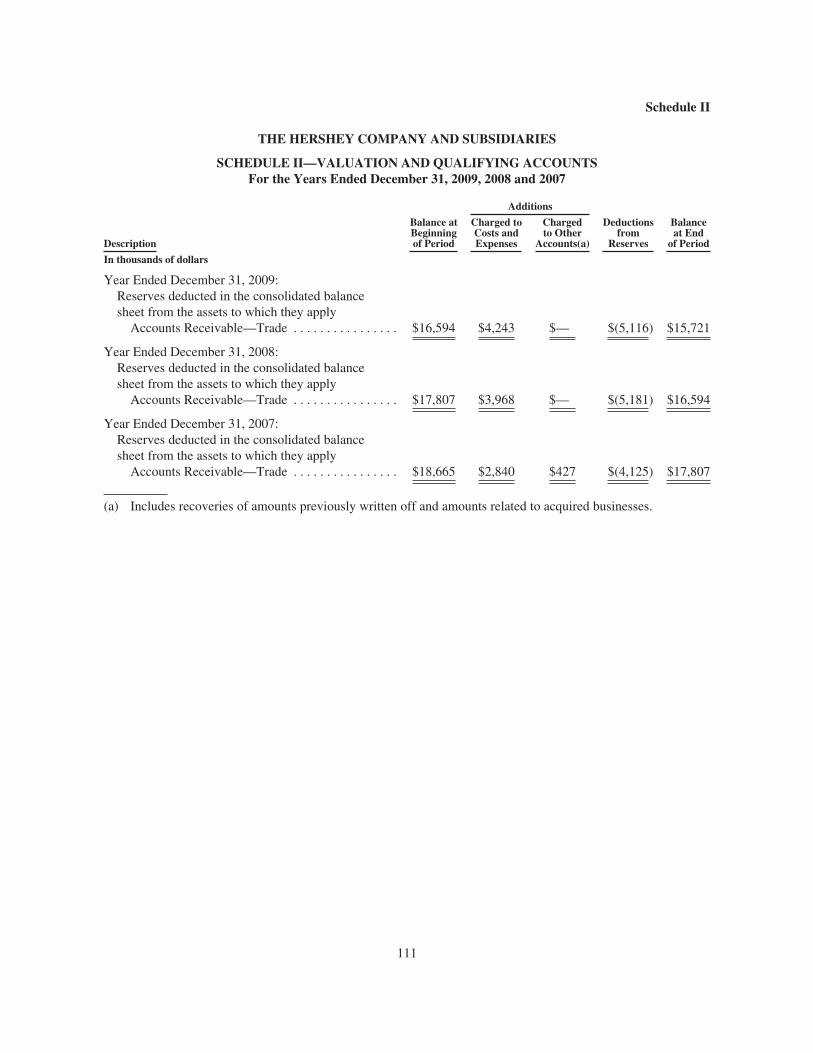
Schedule II
THE HERSHEY COMPANY AND SUBSIDIARIES
SCHEDULE II—VALUATION AND QUALIFYING ACCOUNTSFor the Years Ended December 31, 2009, 2008 and 2007
Additions
Description
Balance atBeginningof Period
Charged toCosts andExpenses
Chargedto Other
Accounts(a)
Deductionsfrom
Reserves
Balanceat End
of Period
In thousands of dollars
Year Ended December 31, 2009:Reserves deducted in the consolidated balancesheet from the assets to which they apply
Accounts Receivable—Trade . . . . . . . . . . . . . . . . $16,594 $4,243 $— $(5,116) $15,721
Year Ended December 31, 2008:Reserves deducted in the consolidated balancesheet from the assets to which they apply
Accounts Receivable—Trade . . . . . . . . . . . . . . . . $17,807 $3,968 $— $(5,181) $16,594
Year Ended December 31, 2007:Reserves deducted in the consolidated balancesheet from the assets to which they apply
Accounts Receivable—Trade . . . . . . . . . . . . . . . . $18,665 $2,840 $427 $(4,125) $17,807
(a) Includes recoveries of amounts previously written off and amounts related to acquired businesses.
111
CERTIFICATION
I, David J. West, certify that:
1. I have reviewed this Annual Report on Form 10-K of The Hershey Company;
2. Based on my knowledge, this report does not contain any untrue statement of a material fact or omit tostate a material fact necessary to make the statements made, in light of the circumstances under whichsuch statements were made, not misleading with respect to the period covered by this report;
3. Based on my knowledge, the financial statements, and other financial information included in thisreport, fairly present in all material respects the financial condition, results of operations and cashflows of the registrant as of, and for, the periods presented in this report;
4. The registrant’s other certifying officer(s) and I are responsible for establishing and maintainingdisclosure controls and procedures (as defined in Exchange Act Rules 13a-15(e) and 15d-15(e)) andinternal control over financial reporting (as defined in Exchange Act Rules 13a-15(f) and 15d-15(f)) forthe registrant and have:
(a) Designed such disclosure controls and procedures, or caused such disclosure controls andprocedures to be designed under our supervision, to ensure that material information relating tothe registrant, including its consolidated subsidiaries, is made known to us by others within thoseentities, particularly during the period in which this report is being prepared;
(b) Designed such internal control over financial reporting, or caused such internal control overfinancial reporting to be designed under our supervision, to provide reasonable assuranceregarding the reliability of financial reporting and the preparation of financial statements forexternal purposes in accordance with generally accepted accounting principles;
(c) Evaluated the effectiveness of the registrant’s disclosure controls and procedures and presented inthis report our conclusions about the effectiveness of the disclosure controls and procedures, as ofthe end of the period covered by this report based on such evaluation; and
(d) Disclosed in this report any change in the registrant’s internal control over financial reporting thatoccurred during the registrant’s most recent fiscal quarter (the registrant’s fourth fiscal quarter inthe case of an annual report) that has materially affected, or is reasonably likely to materiallyaffect, the registrant’s internal control over financial reporting; and
5. The registrant’s other certifying officer(s) and I have disclosed, based on our most recent evaluation ofinternal control over financial reporting, to the registrant’s auditors and the audit committee of theregistrant’s board of directors (or persons performing the equivalent functions):
(a) All significant deficiencies and material weaknesses in the design or operation of internal controlover financial reporting which are reasonably likely to adversely affect the registrant’s ability torecord, process, summarize and report financial information; and
(b) Any fraud, whether or not material, that involves management or other employees who have asignificant role in the registrant’s internal control over financial reporting.
David J. WestChief Executive Officer
February 19, 2010
112
CERTIFICATION
I, Humberto P. Alfonso, certify that:
1. I have reviewed this Annual Report on Form 10-K of The Hershey Company;
2. Based on my knowledge, this report does not contain any untrue statement of a material fact or omit tostate a material fact necessary to make the statements made, in light of the circumstances under whichsuch statements were made, not misleading with respect to the period covered by this report;
3. Based on my knowledge, the financial statements, and other financial information included in thisreport, fairly present in all material respects the financial condition, results of operations and cashflows of the registrant as of, and for, the periods presented in this report;
4. The registrant’s other certifying officer(s) and I are responsible for establishing and maintainingdisclosure controls and procedures (as defined in Exchange Act Rules 13a-15(e) and 15d-15(e)) andinternal control over financial reporting (as defined in Exchange Act Rules 13a-15(f) and 15d-15(f)) forthe registrant and have:
(a) Designed such disclosure controls and procedures, or caused such disclosure controls andprocedures to be designed under our supervision, to ensure that material information relating tothe registrant, including its consolidated subsidiaries, is made known to us by others within thoseentities, particularly during the period in which this report is being prepared;
(b) Designed such internal control over financial reporting, or caused such internal control overfinancial reporting to be designed under our supervision, to provide reasonable assuranceregarding the reliability of financial reporting and the preparation of financial statements forexternal purposes in accordance with generally accepted accounting principles;
(c) Evaluated the effectiveness of the registrant’s disclosure controls and procedures and presented inthis report our conclusions about the effectiveness of the disclosure controls and procedures, as ofthe end of the period covered by this report based on such evaluation; and
(d) Disclosed in this report any change in the registrant’s internal control over financial reporting thatoccurred during the registrant’s most recent fiscal quarter (the registrant’s fourth fiscal quarter inthe case of an annual report) that has materially affected, or is reasonably likely to materiallyaffect, the registrant’s internal control over financial reporting; and
5. The registrant’s other certifying officer(s) and I have disclosed, based on our most recent evaluation ofinternal control over financial reporting, to the registrant’s auditors and the audit committee of theregistrant’s board of directors (or persons performing the equivalent functions):
(a) All significant deficiencies and material weaknesses in the design or operation of internal controlover financial reporting which are reasonably likely to adversely affect the registrant’s ability torecord, process, summarize and report financial information; and
(b) Any fraud, whether or not material, that involves management or other employees who have asignificant role in the registrant’s internal control over financial reporting.
Humberto P. AlfonsoChief Financial Officer
February 19, 2010
113

DIRECTORS AND HERSHEY EXECUTIVE TEAMAs of March 22, 2010
Directors Audit Committee Hershey Executive TeamJames E. NevelsChairman of the Boardof DirectorsThe Hershey CompanyChairmanThe Swarthmore GroupPhiladelphia, PA
Robert F. CavanaughManaging DirectorDLJ Real Estate CapitalPartnersLos Angeles, CA
Charles A. DavisChief Executive OfficerStone Point Capital LLCGreenwich, CT
Thomas J. RidgePresident and ChiefExecutive OfficerRidge Global, LLCWashington, DC
David L. ShedlarzRetired Vice ChairmanPfizer Inc.New York, NY
David J. WestPresident and ChiefExecutive OfficerThe Hershey Company
LeRoy S. ZimmermanSenior CounselEckert Seamans Cherin &Mellott, LLCPittsburgh, PA
David L. Shedlarz, ChairRobert F. CavanaughCharles A. Davis
Compensation and ExecutiveOrganization Committee
Robert F. Cavanaugh, ChairJames E. NevelsDavid L. Shedlarz
Finance and RiskManagement Committee
Charles A. Davis, ChairRobert F. CavanaughThomas J. RidgeDavid L. Shedlarz
Governance CommitteeJames E. Nevels, ChairThomas J. RidgeLeRoy S. Zimmerman
Executive CommitteeJames E. Nevels, ChairRobert F. CavanaughCharles A. DavisDavid L. ShedlarzLeRoy S. Zimmerman
David J. WestPresident and ChiefExecutive Officer
Humberto P. AlfonsoSenior Vice PresidentChief Financial Officer
C. Daniel AzzaraVice PresidentGlobal Research andDevelopment
John P. BilbreySenior Vice PresidentPresident Hershey NorthAmerica
Charlene H. BinderSenior Vice PresidentChief People Officer
Michele G. BuckSenior Vice PresidentGlobal Chief Marketing Officer
George F. DavisSenior Vice PresidentChief Information Officer
Javier H. IdrovoSenior Vice PresidentStrategy and BusinessDevelopment
Thaddeus J. JastrzebskiSenior Vice PresidentPresident HersheyInternational
Terence L. O’DaySenior Vice PresidentGlobal Operations
Burton H. SnyderSenior Vice PresidentGeneral Counsel and Secretary
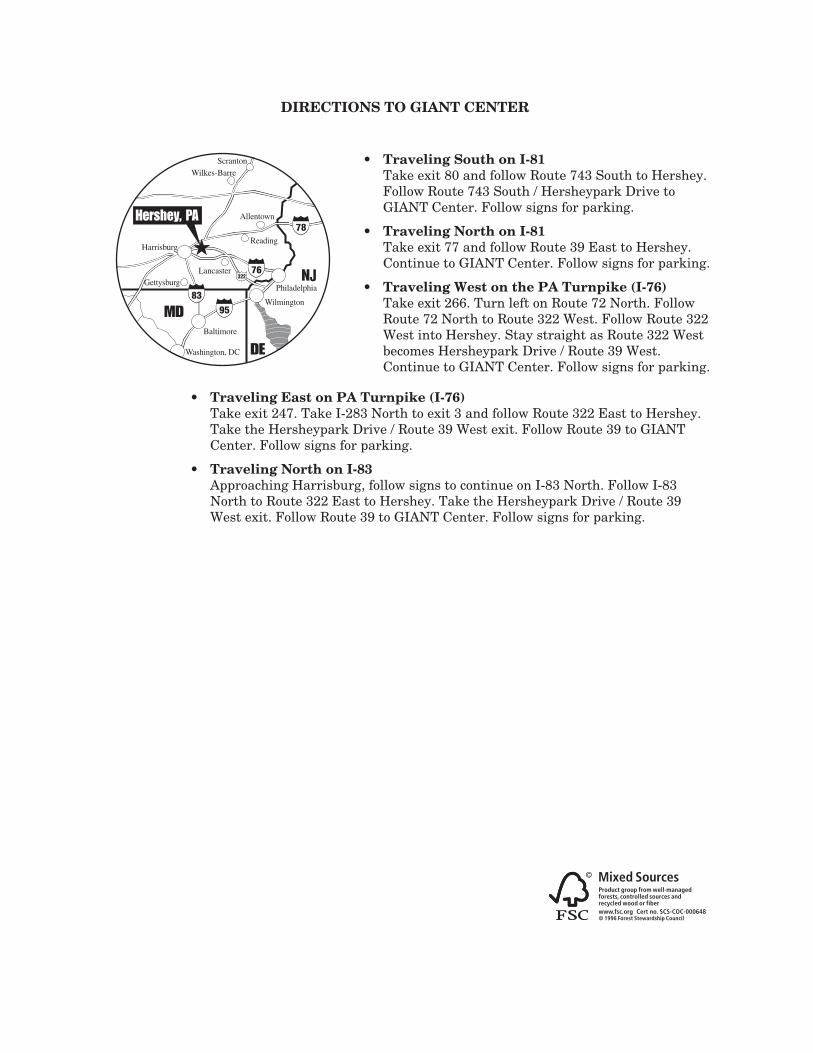
DIRECTIONS TO GIANT CENTER
ScrantonWilkes-Barre
Harrisburg
LancasterGettysburg
Baltimore
Washington, DC
MD
DE
N
Wilmington
Philadelphia
Reading
AllentownHershey, PA78
76
83
95
322
• Traveling South on I-81Take exit 80 and follow Route 743 South to Hershey.Follow Route 743 South / Hersheypark Drive toGIANT Center. Follow signs for parking.
• Traveling North on I-81Take exit 77 and follow Route 39 East to Hershey.Continue to GIANT Center. Follow signs for parking.
• Traveling West on the PA Turnpike (I-76)Take exit 266. Turn left on Route 72 North. FollowRoute 72 North to Route 322 West. Follow Route 322West into Hershey. Stay straight as Route 322 Westbecomes Hersheypark Drive / Route 39 West.Continue to GIANT Center. Follow signs for parking.
• Traveling East on PA Turnpike (I-76)Take exit 247. Take I-283 North to exit 3 and follow Route 322 East to Hershey.Take the Hersheypark Drive / Route 39 West exit. Follow Route 39 to GIANTCenter. Follow signs for parking.
• Traveling North on I-83Approaching Harrisburg, follow signs to continue on I-83 North. Follow I-83North to Route 322 East to Hershey. Take the Hersheypark Drive / Route 39West exit. Follow Route 39 to GIANT Center. Follow signs for parking.
Cert no. SCS-COC-000648