the hidden american immigration consensus: a …jhain/paper/ajps2015c.pdf · the hidden american...
TRANSCRIPT
The Hidden American Immigration Consensus: AConjoint Analysis of Attitudes toward Immigrants
Jens Hainmueller Stanford UniversityDaniel J. Hopkins Georgetown University
Many studies have examined Americans’ immigration attitudes. Yet prior research frequently confounds multiple questions,including which immigrants to admit and how many to admit. To isolate attitudes on the former question, we use a conjointexperiment that simultaneously tests the influence of nine immigrant attributes in generating support for admission.Drawing on a two-wave, population-based survey, we demonstrate that Americans view educated immigrants in high-status jobs favorably, whereas they view those who lack plans to work, entered without authorization, are Iraqi, or donot speak English unfavorably. Strikingly, Americans’ preferences vary little with their own education, partisanship, labormarket position, ethnocentrism, or other attributes. Beneath partisan divisions over immigration lies a broad consensusabout who should be admitted to the country. The results are consistent with norms-based and sociotropic explanationsof immigration attitudes. This consensus points to limits in both theories emphasizing economic and cultural threats, andsheds new light on an ongoing policy debate.
In recent years, the immigrant population in theUnited States has grown rapidly, and it now standsat over 40 million (U.S. Census Bureau 2011). At
the same time, immigration has become a salient polit-ical issue across the federal system, with Congress con-sidering major immigration reforms repeatedly. Thesecontentious, ongoing debates make it clear that at boththe elite and mass levels, there are stark divisions overimmigration.
Over that same period, scholars have been workingto better understand immigration attitudes and to iden-tify whether attitudes toward immigrants are primarilydriven by economic competition, ethnocentrism, con-cerns about norms and national identity, or other factors(see Hainmueller and Hopkins 2014 for a detailed lit-erature review). Still, in seeking to explain immigrationattitudes, prior research has frequently confounded atleast three distinct questions: Which types of immigrants
Jens Hainmueller is Associate Professor, Department of Political Science and Graduate School of Business, Stanford University, Stanford, CA94305 ([email protected]). Daniel J. Hopkins is Associate Professor, Department of Government, Intercultural Center 681, GeorgetownUniversity, Washington, DC 20057 ([email protected]).
We thank participants in seminars at BYU, MIT, Stanford University, Temple University, the University of California–Berkeley, the Universityof California–San Diego, the University of Michigan’s Gerald R. Ford School of Public Policy, the University of Pennsylvania, and the 2012Annual Meeting of the Midwest Political Science Association, as well as Adam Berinsky, Jack Citrin, Rafaela Dancygier, Shana KushnerGadarian, Todd Hartman, Chad Hazlett, Gabriel Lenz, Deborah Schildkraut, Jasjeet Sekhon, John Sides, David Singer, Cara Wong, andMatt Wright for helpful comments. For excellent research assistance, we acknowledge Christopher Duffner, Katherine Foley, DouglasKovel, Clare Tilton, Amelia Whitehead, Marzena Zukowsa, and especially Anton Strezhnev. Stefan Subias provided considerable assistancein fielding the survey. The usual disclaimer applies. The data used in this study are available in the AJPS Data Archive on Dataverse(http://dvn.iq.harvard.edu/dvn/dv/ajps).
should be admitted, how many immigrants should be ad-mitted, and how should the United States address thoseimmigrants who are already here? In this study, we seekto disentangle those questions and to focus on the first byidentifying the types of immigrants who are supportedfor admission.
Certainly, there are prior studies examining whichimmigrant attributes affect attitudes toward immigrants.Yet to date, survey experiments on these questions havemanipulated only a few immigrant attributes at a time,such as immigrants’ countries of origin, skill levels, skintones, or English abilities (e.g. Adida, Laitin, and Valfort2010; Brader, Valentino, and Suhay 2008; Hainmuellerand Hiscox 2010; Harell et al. 2012; Iyengar et al. 2013;Ostfeld 2012; Sniderman, Hagendoorn, and Prior 2004;Valentino and Iyengar 2011). This empirical strategy hasenabled scholars to test likely influences on immigra-tion attitudes in isolation, but it has not allowed for
American Journal of Political Science, Vol. 59, No. 3, July 2015, Pp. 529–548
C©2014, Midwest Political Science Association DOI: 10.1111/ajps.12138
529

530 JENS HAINMUELLER AND DANIEL J. HOPKINS
comprehensive tests of the competing hypotheses. To ad-dress that limitation, we introduce to political science anexperimental design—conjoint analysis—that can iden-tify the attributes of immigrants that provoke especiallypositive or negative reactions.1
Our experiment asks a population-based sample ofU.S. citizens to decide between pairs of immigrants ap-plying for admission to the United States. In each case, arespondent sees application information for two immi-grants, including notes about their education, countriesof origin, and several other attributes that vary randomlyacross pairings. Instead of limiting our analysis to one ortwo factors, this experimental design enables us to varymany immigrant attributes simultaneously and to evalu-ate which attributes make immigrants more or less likelyto be granted admission. This design therefore allows usto compare the relative explanatory power of various hy-potheses, from those emphasizing labor market threator fiscal burdens to those emphasizing sociotropic im-pacts, norm adherence, or prejudice. Unlike prior obser-vational research (such as Hainmueller and Hangarter’s2013 study of Swiss votes on naturalization applications),this research makes use of a sample that is both nation-ally representative and observed at the individual level.Individual-level data make it possible to assess a wide vari-ety of theoretical mechanisms, and so to address our cen-tral question: whether various subgroups of Americansrespond differently to specific immigrant attributes. Un-like prior experimental studies of immigration attitudes,including Sniderman, Hagendoorn, and Prior (2004) andBrader, Valentino, and Suhay (2008), this research inde-pendently randomizes numerous immigrant attributes ina single experiment, allowing us to identify and comparethe unique effects of each.
We find that hypotheses emphasizing immigrants’adherence to national norms and their expected economiccontributions receive strong support. For our respon-dents, immigrants with bachelor’s degrees are 20 per-centage points more likely to win admission over thosewith no formal education, for example. We also find thatimmigrants who have good language skills, have job expe-rience, and work in high-status jobs are viewed favorably,whereas immigrants who lack plans to work or enteredwithout authorization are not. Moreover, immigrants’countries of origin matter, with respondents penalizingIraqi immigrants by 14 percentage points (compared toimmigrants from the most preferred origin, Germany)and with more ethnocentric respondents penalizing
1In a companion article, we develop the statistical tools for con-joint analysis utilized in this study (Hainmueller, Hopkins, andYamamoto 2014).
immigrants from several African and Asian countries.Yet such effects are relatively small in magnitude andlimited in scope. Once we provide information on edu-cation, language, and other factors, Mexican immigrantsappear to suffer little penalty as compared to German im-migrants, a finding that distinguishes these results fromthose of Brader, Valentino, and Suhay (2008) and suggeststhe limits of ethnocentrism-based explanations.
The results provide us with substantial leverage toreconsider various theoretical explanations of attitudestoward immigrants. Our findings are at odds with ex-planations emphasizing labor market threat, since pref-erences for highly skilled immigrants and those planningto work do not vary with respondents’ skill levels, oc-cupations, or industries. Yet they are also at odds withexplanations highlighting other types of variation acrossindividuals. Indeed, the most striking pattern to emergeis not anticipated by prior scholarship emphasizing eco-nomic or cultural factors. Past theories have consistentlyposited individual-level differences in attitudes towardimmigrants, whether they are based on respondents’ la-bor market positions, fiscal exposure to immigration, at-titudes toward outgroups, partisanship, or other traits.The divisive national debates of recent years certainly re-inforce the expectation of individual-level differences inimmigration-related attitudes. In contrast, our results un-cover a sweeping consensus across different groups aboutwhich types of immigrants to admit. These preferencesdiffer little based on the respondents’ education, income,race/ethnicity, partisanship, or other demographic andattitudinal characteristics.
A wealth of recent scholarship reports pronounceddifferences in attitudes across partisan groups, both onpreferred immigration policies (e.g., Knoll, Redlawsk, andSanborn 2011) and on a host of other political issues(e.g., Gerber and Huber 2009). Given the expansive in-fluence of partisanship, the underlying American consen-sus on preferred immigrants is all the more remarkable.The strength of this unacknowledged consensus under-cuts explanations of attitudes toward immigrants thathighlight individual-level differences, such as claims thatanti-immigrant attitudes are primarily driven by distri-butional concerns. It also helps us better understandthe roots of contemporary divisions over immigrationpolicy—those divisions cannot be masking divisions overthe types of immigrants to admit, as on that point, thereis widespread agreement. Immigrants are being assessedin similar ways by Democrats and Republicans, by highschool graduates and college graduates, and by rich andpoor. The operative question appears to be not how im-migrants affect specific individuals but how they are per-ceived to affect the nation as a whole.

THE HIDDEN AMERICAN IMMIGRATION CONSENSUS 531
A wide variety of robustness checks provides con-fidence that these results are not artifacts of specificchoices made during survey administration or analy-sis. The results are not especially pronounced amongthose with a tendency to “self-monitor,” among thosewho saw less typical immigrant profiles, or among re-sponses to profiles seen early or late. Methodologi-cally, the conjoint analysis employed here has potentialvalue in studying problems well beyond immigrationattitudes.
To be sure, on most issues, public attitudes do nottranslate directly into policy, and prior research suggeststhat the disconnect between public opinion and policy-making has been especially pronounced on immigration(e.g., Messina 1989; Tichenor 2002). On the whole, thepublic is thought to be more restrictionist than electedofficials. But the existence of a “hidden American im-migration consensus” on whom to admit is nonethelessimportant in understanding contemporary immigrationattitudes and immigration policymaking, even if there isno similar consensus on immigration policy. First, themass-level consensus indicates that any disagreementsamong the mass public are more likely to be over howmany immigrants to admit or how to handle immigrantsalready here than over whom to admit. More tentatively,our findings are consistent with the claim that salientdisagreements over immigration policy might stem fromthe selective mobilization of people, groups, and atti-tudes on this issue (see also Tichenor 2002). Even so,as the Conclusion discusses, key elements of the Sen-ate’s 2013 immigration reform follow the tenets of theconsensus uncovered here. That proposed reform empha-sized skill-based immigration, English-language acquisi-tion, increased border security, and penalties for unau-thorized migration. Each of those policies is in line withAmerican public opinion about whom to admit. So whilethere is no analogous consensus on immigration pol-icy among interest groups or policy makers, the shadowof the hidden consensus uncovered here is visible inpolicymaking.
Why Do Natives Oppose Immigrants?
As immigrant populations have grown in developeddemocracies, hypotheses about the sources of native-bornopinion about immigrants have proliferated as well. Herewe organize several theoretical approaches based on thehypotheses they generate about two questions: What im-migrant attributes influence native-born attitudes, andwhich native-born groups are influenced?
Economic Self-Interest and SociotropicConcerns
One approach to immigration attitudes takes economicself-interest as its starting point. In this view, the native-born perceive immigrants as competitors for scarce jobsand will oppose immigrants if they have skill profiles andoccupations similar to their own (Mayda 2006; Scheveand Slaughter 2001). For example, high-skilled respon-dents are expected to oppose high-skilled immigrants, butnot low-skilled immigrants. Another variant of the mate-rial self-interest approach hypothesizes that immigrantsmight influence native-born residents through their im-pact on taxes and spending (Facchini and Mayda 2009;Hanson, Scheve, and Slaughter 2007). Those native-bornresidents whose level of income and place of residence ex-pose them to higher costs from immigration are expectedto be especially opposed. For example, a wealthy respon-dent in a heavily immigrant state with a high incometax is likely to be more anti-immigration than a similarrespondent in a state with no income tax. Under this hy-pothesis, we might also expect that immigrants’ intentionto work will influence their reception, with high-incomeAmericans especially wary of immigrants not planning towork.
Other scholarship has contested hypotheses basedon material self-interest, either by pointing out that eco-nomic perceptions are weak predictors of immigration-related attitudes (e.g., Burns and Gimpel 2000; Citrin et al.1997; Sides and Citrin 2007) or by demonstrating that thepreference for high-skilled immigrants is evident amongall subgroups of natives (Hainmueller and Hiscox 2007,2010). To the extent that more educated individuals aremore supportive of immigration, such a finding might re-flect increased tolerance. Moreover, Hainmueller, Hiscox,and Margalit (2014) show that attitudes toward immi-gration are very similar among native workers in U.S.industries that vary in their dependence on immigrantlabor, their labor mobility, or the skill mix of the immi-grants they employ (but see Malhotra, Margalit, and Mo2013). These findings are inconsistent with the argumentthat egocentric concerns about labor market competitionstrongly influence immigration attitudes.
Still, there are also sociotropic economic explanationsthat remain viable even in the face of these objections.According to a sociotropic account, native-born Ameri-cans respond to immigrants based on perceptions abouttheir economic contribution to the nation as a whole. Ifso, native-born Americans might prefer well-educated,experienced, high-status professionals based on percep-tions about their impact on the national economy or theirlikely tax contribution (Citrin et al. 1997; Hainmueller

532 JENS HAINMUELLER AND DANIEL J. HOPKINS
and Hiscox 2007). Sociotropic hypotheses have been welldeveloped in explaining Americans’ perceptions of eco-nomic performance (e.g., Kinder and Kiewiet 1981), butcould extend to their assessments of immigrants as well.
Prejudice and Ethnocentrism
As with race-related questions, immigration is an emo-tionally charged issue addressing the rights of peoplewho are predominantly nonwhite (e.g., Brader, Valentino,and Suhay 2008). Research indicates that those whohold negative stereotypes about immigrants (Burns andGimpel 2000) or more biased implicit associations (Perez2010) are more opposed to immigration. In the UnitedStates and Europe, there is substantial variation in sup-port based on immigrants’ countries of origin (Dust-mann and Preston 2007; Hainmueller and Hangartner2013; but see Sniderman et al. 2002). Given those ob-servations, an alternate set of explanations holds thatnon-Hispanic whites’ immigration attitudes—and per-haps those of other groups—are structured similarly totheir racial views. These viewpoints begin from the con-tention that racial and immigration-related attitudes stemfrom a common underlying factor, whether it is ethno-centrism (e.g., Kinder and Kam 2009), authoritarianism(Hetherington and Weiler 2009), or social dominance ori-entation (Newman, Hartman, and Taber 2014). Buildingon the close relationship between immigrants’ countriesof origin and their ethnic or racial backgrounds, this ap-proach generates two hypotheses: that native-born Amer-icans will be more opposed to immigrants from countriesthat are more ethnically and culturally distinctive and thatnative-born Americans with higher levels of ethnocen-trism will be especially opposed (Kinder and Kam 2009,138).
In one variant of hypotheses emphasizing prejudice,immigration-related attitudes are straightforward exten-sions of racial attitudes. Thus, native-born white Ameri-cans are likely to be more supportive of immigrants fromEurope. In this view, sources of intergroup difference thatare common to racial ascription, such as skin tone, arelikely to shape attitudes on immigration. Maintainingthe emphasis on prejudice or ethnocentrism, a secondapproach allows for the possibility that the content ofthe anti-immigrant stereotypes might differ from thatof antiblack stereotypes. In this view, there are severalimmigrant attributes that might increase perceptions ofsocial and cultural distance, from difficulty with English(Hopkins 2014) to differing religious or cultural practices(Adida, Laitin, and Valfort 2010; Ostfeld 2012). This hy-pothesis could explain why immigrants who do not speak
English or those from outside Europe are viewed morenegatively. With respect to the Middle East, threats relatedto terrorism could exacerbate such differences (Harellet al. 2012; Schildkraut 2011).
American Identity and Norms
Another theoretical approach begins from the premisethat natives evaluate immigrants based on their adherenceto norms related to American identity (Schildkraut 2011).With respect to immigration, many Americans identifystrongly with their nationality (Theiss-Morse 2009; Wong2010), and concerns that immigration might dilute na-tional identity are widespread (Burns and Gimpel 2000;Citrin et al. 1997; Schildkraut 2011; Wright 2011). Atti-tudes toward immigrants might thus hinge on whetherthey are seen as upholding American norms (Wright andCitrin 2011). But what are “American norms”? One con-cerns assimilation (Schildkraut 2005, 2011): We shouldexpect those immigrants who demonstrate an interest inAmerica and its culture to win higher levels of support.Over 90% of Americans indicate that speaking Englishis an important element of American identity (Theiss-Morse 2009; Wong 2010), so we hypothesize that speakingEnglish will matter too.
The norm-based approach also produces the expec-tation that immigrants’ labor market credentials will beinfluential, albeit for reasons not related to economicself-interest. Given Americans’ strong adherence to work-related norms, immigrants’ professions, job experiences,and employment plans are signals of adherence to thosenorms. Whereas the hypothesis grounded in self-interestpredicts that immigrants’ professions should interact withhosts’ professions, this norm-based account expects acommon influence across host subgroups. Immigrantswho want to enter the United States to improve their jobprospects might be rewarded relative to others. A relatedline of thinking might lead immigrants who are more fa-miliar with the United States, perhaps having spent timein the country, to garner more support. Notice the simi-larity between the observable implications of this norms-based approach and the sociotropic approach. To the ex-tent that norms about American identity are related toprofessional success, these two approaches yield overlap-ping expectations.
Conversely, one of the central norms that manycontemporary immigrants are perceived to violate re-gards authorized entry (Hood and Morris 1998). If so,immigrants who have previously been in the UnitedStates without authorization might be penalized despitetheir increased familiarity with the country. One of the
THE HIDDEN AMERICAN IMMIGRATION CONSENSUS 533
liabilities of the norms-based account is that there is nocomprehensive list of norms related to American identity,giving the hypothesis substantial flexibility. Nonetheless,our focus here is on well-defined norms, such as thosearound language, work, and law. This theoretical discus-sion does not pretend to be exhaustive, but it organizesprior theorizing into three broad approaches. Most hy-potheses lead us to expect pronounced individual-leveldifferences in attitudes toward immigrants, whereas a fewtheories predict a more common response.
Limits of Existing Evidence
Pioneering studies played a critical role in identifyingthe correlates of immigration attitudes (e.g., Burns andGimpel 2000; Citrin et al. 1997; Scheve and Slaughter2001), but these early studies emphasized immigrationattitudes in general. Prior studies have only rarely con-sidered attitudes about whom to admit separately fromthose about how many to admit. Also, as this literature hasexpanded, scholars have increasingly supplemented ob-servational studies with experimental approaches. Suchexperiments vary one, two, or at most three immigrantattributes at a time, including the immigrant’s countryof origin, education, language use, or skin tone (Adida,Laitin, and Valfort 2010; Brader, Valentino, and Suhay2008; Hainmueller and Hiscox 2010; Harell et al. 2012;Hopkins 2014; Ostfeld 2012; Schildkraut 2011; Snider-man, Hagendoorn, and Prior 2004; Sniderman et al.2002; Valentino and Iyengar 2011; Wright and Citrin2011). Yet even these second-generation studies are lim-ited in their ability to test the relative strength of var-ious hypotheses. There is also the possibility of con-founding if the experimentally manipulated attributesare correlated with other influential attributes. For ex-ample, if an experiment includes information only onimmigrants’ countries of origin, it is unclear whetherimmigrants from Mexico are penalized because of per-ceptions about their education levels or levels of unau-thorized entry, or for other reasons, such as deep-seededprejudice. Certainly, it is difficult to identify a single ma-nipulation that can definitively test a hypothesis, andit is difficult to make direct comparisons between es-timates obtained from experiments with different de-signs, manipulations, and dependent variables. More-over, prior research has focused on only a small subset ofthe sources of immigrant-native distinction. Given theselimitations, the following section proposes a research de-sign that enables comparisons of a much wider rangeof theoretically relevant immigrant attributes on a singlescale.
Experimental Design, Data,Measurement, and Analysis
We employ a choice-based conjoint design to obtaina more comprehensive picture of citizens’ opinions onwhom to admit. Conjoint analyses have been widely usedin marketing (e.g., Raghavarao, Wiley, and Chitturi 2011),but they have seen little use in political science (Hain-mueller, Hopkins, and Yamamoto 2014). Our experimentputs respondents in the position of immigration officials,asking them to make decisions between pairs of immi-grants applying for admission. We require a choice be-tween each pair of immigrants to simplify the decisiontask, given the limits of short-term memory (Krosnick1999). Following a short introduction explaining the ex-ercise, we show respondents a screen with profiles of twoimmigrants as displayed in Figure 1. The instructionsasked respondents to “please indicate which of the twoimmigrants you would personally prefer to see admittedto the United States.” As detailed below, the results arenot sensitive to this particular framing of the task.2 Weprovide details on the question wording, variable coding,and survey administration in the Supporting Information(SI).
Below the immigrant profiles, we measure the out-come in two ways. The first question asks respondents toreport a preference for one of the profiles. We code theresponses to this question in a binary variable, ImmigrantPreferred, which is 1 if the immigrant profile is preferredand 0 otherwise. This variable is our primary outcomeof interest. The question has the advantage that it forcesrespondents to make trade-offs, as someone must be ad-mitted and someone else rejected. Requiring a decisionalso neutralizes attitudes about overall levels of immi-gration, enabling us to focus on the attributes that makeimmigrants more or less attractive to the native-born. Asa robustness check, we also use responses to a pair ofquestions that ask respondents to rate each immigrant ona 7-point scale.3 We use these ratings to code a binaryvariable (Immigrant Supported) as 1 if the rating is abovethe midpoint and 0 otherwise.
2The similarities between these results and those of Wright, Levy,and Citrin (2014) further suggest that the core results detailedbelow are likely to be robust to the specific framing of the surveytask.
3Our focus is on which immigrants receive support, and our em-phasis on the forced-choice outcome reflects that. Given our design,it is plausible that responses to the forced-choice question influ-enced the ratings provided immediately afterward. Future workmight consider randomizing the format of the outcome variable soas to evaluate its effects. For an example of a conjoint design usinga different response format, see Wright, Levy, and Citrin (2014).

534 JENS HAINMUELLER AND DANIEL J. HOPKINS
FIGURE 1 Experimental Design
Note: This figure illustrates the experimental design for the conjoint experiment.
Each respondent evaluates five comparisons betweenpairs of immigrants, each displayed on a new screen. Werandomly vary the two immigrants’ profiles on nine at-tributes that previous studies identify as potentially in-fluential. The attributes include each immigrant’s gender,education, employment plans, job experience, profession,language skills, country of origin, reasons for applying, andprior trips to the United States. These attributes were cho-
sen to approximate the information available to immigra-tion officials, and that rationale explains why other factorssuch as religion were omitted. Each of the attributes cantake on multiple values. For example, job experience hasfive values ranging from “no job training or prior expe-rience” to “more than five years.” For each profile, werandomly assign the values of each attribute such thatthe two immigrants’ profiles vary within and across the

THE HIDDEN AMERICAN IMMIGRATION CONSENSUS 535
binary comparisons. Table 1 contains the full list of at-tribute values. They cover a wide range—in theory, thereare just under 900,000 unique immigrant profiles—to as-sess various theoretical dimensions that are potentiallyinfluential.
While some profiles are more typical than others, thepopulation of immigrants to the United States is itselflarge and diverse, and the attribute values were chosento be common, distinctive, plausible, and theoreticallyrelevant. For example, the professions include a varietyof occupations in which contemporary immigrants arelikely to be found. Also, the 10 chosen countries jointlyare the sending countries for approximately 43% of allimmigrants in the United States today. Table A.1 in theSI reinforces these impressions by using Current Popu-lation Surveys to estimate the share of immigrants fromeach of our 10 national-origin groups with some col-lege education or a bachelor’s degree. It confirms thateven seemingly atypical profiles likely correspond to sig-nificant numbers of actual immigrants. Below, we alsoaddress the question of typicality by identifying respon-dents who saw profiles that were more or less typical.4
For each respondent, we also randomly assign the or-der of the attributes to rule out primacy and recencyeffects.5
Our design has several advantages over prior obser-vational and experimental approaches. First, given thatthe attribute values are randomized, the design allows usto identify the effect of each immigrant attribute on theprobability of being preferred for admission. Put differ-ently, the randomization provides new leverage to disen-tangle the effects of correlated attributes such as languageskills and country of origin. Moreover, given that we varyall the attributes and measure their effects on the samescale, the design allows us to examine the attributes’ rela-tive importance. For instance, we can compare the effectof a college education with that of being Mexican. Second,we can examine possible interactions in the effect of theimmigrant attributes (e.g., do skill levels matter more formore culturally distinctive immigrants?). This allows usto test the conditions under which some attributes mat-
4We impose two restrictions on the randomization to rule outimplausible profiles. First, we restrict immigrants who apply foradmission to “escape persecution” to come from “Iraq,” “Sudan,”or “Somalia.” Second, we restrict the randomization for professionsuch that high-skill occupations “financial analyst,” “research sci-entist,” “doctor,” and “computer programmer” are included onlyif the education level is 2 years of college or more.
5However, the order of the attributes is fixed for each respondentacross the five comparisons to reduce complexity. Moreover, werestrict the randomization of the attribute order such that the work-related attributes profession, job experience, and employment plansalways appear consecutively in a randomized order.
ter more or less. Finally, the design allows us to considerinteractions between respondent and immigrant char-acteristics (e.g., do ethnocentric voters care more aboutimmigrants’ countries of origin?). These interactions pro-vide opportunities to test additional hypotheses.
Sample
Our data come from a two-wave, nationally representa-tive panel survey of U.S. citizens administered throughKnowledge Networks (KN) between December 2011 andJanuary 2012. Uniquely among American survey compa-nies, KN recruits respondents using random-digit dialingor address-based sampling, and it provides Internet ac-cess to those who lack it. All members of the KN panelhave a known probability of selection, so our samplingprocedure constitutes a two-stage probability design. TheKN panel covers the online and offline U.S. populationsaged 18 years and older, and previous research has shownthat it closely approximates national demographic bench-marks (Chang and Krosnick 2009). The SI provides a fulllist of the survey questions as well as details about surveyadministration.
The first wave of our survey contained 1,714 com-pleted interviews and measured key covariates, includingattitudes toward immigration, levels of self-monitoring(Berinsky and Lavine 2011), and ethnocentrism (Kinderand Kam 2009). After a 3-week washout period, we re-interviewed respondents in a survey containing the con-joint experiment. Respondents were not made aware ofthe connection between the surveys. Although consid-erably more costly than a cross-section, this panel de-sign enables us to measure potential moderating variableswithout priming respondents or introducing differentialmeasurement bias. The second wave yielded 1,407 com-pleted interviews, so attrition within the panel was limitedto 18%. In SI Table A.2, we use t-tests to demonstrate thatthe attrition was not related to any of our core variables.In the second wave, we also measured additional covari-ates such as respondents’ employment status, industry,and occupation. In all analyses, we use post-stratificationweights to adjust the data for common sources of surveyerror.
Analysis
Conjoint experiments frequently involve many moreunique profiles than there are observations in the dataset. In this case, there are just under 900,000 possible pro-files, only a small fraction of which are ever observed.

536 JENS HAINMUELLER AND DANIEL J. HOPKINS
TABLE 1 Attributes for Immigrant Profiles in Conjoint Experiment
Attributes Values
Education Level No formal education
Equivalent to completing fourth grade in the U.S.
Equivalent to completing eighth grade in the U.S.
Equivalent to completing high school in the U.S.
Equivalent to completing two years at college in the U.S.
Equivalent to completing a college degree in the U.S.
Equivalent to completing a graduate degree in the U.S.
Gender Female
Male
Country of Origin Germany
France
Mexico
Philippines
Poland
India
China
Sudan
Somalia
Iraq
Language During admission interview, this applicant spoke fluent English
During admission interview, this applicant spoke broken English
During admission interview, this applicant tried to speak English but was unable
During admission interview, this applicant spoke through an interpreter
Reason for Application Reunite with family members already in U.S.
Seek better job in U.S.
Escape political/religious persecution
Profession Gardener
Waiter
Nurse
Teacher
Child care provider
Janitor
Construction worker
Financial analyst
Research scientist
Doctor
Computer programmer
Job Experience No job training or prior experience
One to two years
Three to five years
More than five years
Employment Plans Has a contract with a U.S. employer
Does not have a contract with a U.S. employer, but has done job interviews
Will look for work after arriving in the U.S.
Has no plans to look for work at this time
Prior Trips to the U.S. Never been to the U.S.
Entered the U.S. once before on a tourist visa
Entered the U.S. once before without legal authorization
Has visited the U.S. many times before on tourist visas
Spent six months with family members in the U.S.
Note: This table shows the attributes and attribute values that are used to generate the immigrant profiles for the conjoint experiment.

THE HIDDEN AMERICAN IMMIGRATION CONSENSUS 537
Yet the estimation of treatment effects is straightforwardon account of the randomization and the resulting or-thogonality of each attribute with respect to every other.In survey experiments, researchers commonly randomizepotential confounders (such as the question order) andthen analyze the treatment effects by averaging over thoseorthogonal attributes. Here we evaluate the relative im-portance of immigrant attributes in an analogous way. Wefollow the statistical approach developed in Hainmueller,Hopkins, and Yamamoto (2014) and estimate averagemarginal component effects (AMCEs). The AMCE rep-resents the average difference in the probability of beingpreferred for admission when comparing two different at-tribute values—for example, an immigrant with “fluentEnglish” versus an immigrant with “broken English”—where the average is taken over all possible combinationsof the other immigrant attributes. Thanks to the randomassignment of attributes, profiles with “fluent English”will have the same distribution for all other attributes onaverage as compared to profiles with “broken English,” al-lowing for a straightforward comparison of means. Hain-mueller, Hopkins, and Yamamoto (2014) show that theAMCE is nonparametrically identified given the condi-tionally independent randomization of the attributes andcan be easily estimated using a regression of the binaryoutcome variable, Immigrant Preferred, on sets of indica-tor variables measuring the levels of each attribute. Theadvantage of this approach is that the estimator for theAMCEs is fully nonparametric and does not require func-tional form assumptions about the choice probabilities.6
Note that since the unit of analysis is the rated immi-grant profile, we have up to 14,000 observations in somemodels—each of our 1,407 respondents rated five pair-ings, with two immigrant profiles per pairing. To obtainaccurate variance estimates, we cluster the standard errorsby the respondent because observed choice outcomes arenot independent across the profiles rated by a single re-spondent.
Effects of Immigrant Attributes onSupport for Admission
Figure 2 displays the results for all respondents. It usesdots to indicate point estimates and lines to illustrate95% confidence intervals for the AMCE of each attributevalue on the probability that respondents chose a par-
6This sets it apart from other estimation approaches in the conjointliterature, such as conditional logit. Nonetheless, all the resultsreported below obtain when estimated via conditional logit.
ticular applicant for admission. The dots without confi-dence intervals denote reference categories. For exam-ple, the second line from the top indicates that maleimmigrants are 2.4 percentage points less likely to winsupport for admission than female immigrants. The es-timates are based on the benchmark regression modeldescribed above where the Immigrant Preferred variableis regressed on sets of indicator variables for each levelof each immigrant attribute (omitting the reference cat-egories). The full regression model is displayed in SITable B.1.7
Confirming prior research (Hainmueller and Hiscox2007, 2010; Sniderman, Hagendoorn, and Prior 2004),the KN panelists prefer immigrants with higher levels ofeducation, and the effect is roughly monotonic: the moreeducated the immigrant, the greater the support. In fact,immigrants with a B.A. are 19.5 percentage points (SE =2.1) more likely to be supported for admission than immi-grants without formal education. Differences in the im-migrants’ ability to use English have similarly sized effects.Compared to an applicant who speaks fluent English, onewho uses an interpreter sees a decline in support of 16.2percentage points (SE = 1.4). There is some penalty forspeaking broken English (6.4, SE = 1.4), but the penaltyfor being unable to use English is much larger. Languageis commonly considered a cultural indicator, but in thiscontext, it might be considered an economic skill to somedegree.
A variety of other cultural differences are correlatedwith immigrants’ countries of origin, from their religionsand manners of dress to phenotypical differences such asskin tone. Conditional on detailed information about im-migrants’ education, job experience, occupation, and lan-guage, it seems reasonable to consider country of originan imprecise indicator of cultural differences. Yet despitethe emphasis past research places on cultural differences,the effects for the immigrants’ countries of origin are typ-ically small and statistically insignificant, with only fourcountries (China, Iraq, Sudan, and Somalia) reducing theprobability of admission as compared to the baseline In-dian immigrant. The difference between coming fromthese four countries and Germany—the most preferredcountry of origin—is statistically significant (p < .05,two-sided). Iraqi immigrants are viewed more negatively
7Notice that we include the full set of pairwise interactions forthe attributes that are linked through the restrictions on the ran-domization. As explained in Hainmueller, Hopkins, and Yamamoto(2014), the AMCEs for these linked attributes need to be estimatedas the weighted average of the effect of a specific attribute averagedover the valid strata of the linked attribute (e.g., we average theeffect of going from a “janitor” to a “waiter” across each educationlevel).

538 JENS HAINMUELLER AND DANIEL J. HOPKINS
FIGURE 2 Effects of Immigrant Attributes on Probability of Being Preferred forAdmission
once w/o authorization six months with family many times as tourist once as tourist neverPrior trips to U.S.:
escape persecution seek better job reunite with familyApplication reason:
no plans to look for work will look for work interviews with employer contract with employerJob plans:
5+ years 3−5 years 1−2 years noneJob experience:
doctor research scientist nurse computer programmer teacher construction worker financial analyst gardener child care provider waiter janitorProfession:
Iraq Somalia Sudan China India Poland Philippines Mexico France GermanyOrigin:
used interpreter tried English but unable broken English fluent EnglishLanguage:
graduate degree college degree two−year college high school 8th grade 4th grade no formalEducation:
male femaleGender:
−.2 0 .2Effect on Pr(Immigrant Preferred for Admission)
Note: This plot shows estimates of the effects of the randomly assigned immigrant attribute values on the probabilityof being preferred for admission to the United States. Estimates are based on the benchmark OLS model withclustered standard errors detailed in SI Table B.1; bars represent 95% confidence intervals. The points withouthorizontal bars denote the attribute value that is the reference category for each attribute.
THE HIDDEN AMERICAN IMMIGRATION CONSENSUS 539
than others, as being from Iraq reduces the probabilityof admission by 10.6 percentage points (SE = 2.6) com-pared to Indian immigrants. Given the two wars betweenthe United States and Iraq, and given the salience of ter-rorism after 9/11, it is plausible that Iraqi immigrantsare viewed as security threats. Intriguingly, despite mediaframes focusing on low-skilled, unauthorized immigra-tion from Mexico, there is little evidence of a penaltyspecific to Mexicans. Mexican immigrants are treated in amanner indistinguishable from Polish or German immi-grants and earn more support than Indian immigrants.This estimate is conditional on information about the im-migrant’s prior trips to the United States, suggesting thatMexican immigrants might be viewed negatively in othercontexts because of their association with unauthorizedimmigration.
We also find evidence that the prospective immi-grant’s profession matters, with construction workers(5.3, SE = 2.1), nurses (8.9, SE = 2.1), doctors (18.5,SE = 3.5), and research scientists (14.4, SE = 3.7) enjoy-ing a bonus over janitors. Generally, those in high-skillprofessions are more likely to win support, although itseems plausible that respondents’ perceptions about la-bor market demand or expectations about immigrants’societal contributions also matter. Computer program-mers and financial analysts are in high-skill professions,but not ones that advantage would-be immigrants as de-cisively. The bonuses are 9.8 (SE = 3.6) and 7.9 (SE = 3.8)percentage points, respectively. Job experience makes animmigrant more desirable as well. In a sense, our sur-vey respondents act like employers, screening for thosewho will contribute to the U.S. economy. But they alsoapply noneconomic criteria about different professions’relative contributions. This pattern is in keeping with thesociotropic hypothesis.
Turning to the applicant’s job plans, we observe thatimmigrants who have a contract with an employer earnsignificantly more support than those who have con-ducted interviews or will look for work after arriving.This observation lends credence to the idea that labormarket demand is influential, with Americans more inter-ested in immigrants if U.S.-based employers signal theirneed. At the same time, immigrants without plans to workare penalized more than immigrants with any other sin-gle attribute. Immigrants who do not plan to work are15.1 percentage points (SE = 1.5) less likely to be sup-ported than an immigrant who will look for work afterarriving, and 26.9 percentage points less likely than animmigrant with a contract. This observation is compati-ble with explanations based on immigrants’ expected taxburden or their compliance with American norms. By
contrast, immigrants’ reason for seeking admission haslittle influence, with only a hint that those immigrantswho seek better jobs are viewed more negatively than oth-ers (–2.5 percentage points, SE = 1.2). Those immigrantswho seek to escape from religious or political persecutionare viewed a bit more favorably (5.9 percentage points,SE = 2.2).
Our final attribute summarizes the applicant’s priortrips to the United States. Immigrants who have spenttime in the United States are likely to be perceived ashaving a stronger connection to the country. In fact, ascompared to those who have never been to the UnitedStates, immigrants who have been to the United Statesonce, those who have been many times, and those whospent six months with family in the United States areall between 5.7 and 8.5 percentage points more likely towin admission. Yet the most striking result is the 10.8percentage point (SE = 1.6) penalty for coming previ-ously without authorization. Whatever familiarity withthe United States an unauthorized immigrant might gainis outweighed by the violation of norm and law. Whetherthis penalty comes from concerns about the illegal entryitself, about future lawbreaking, or from other factors isa productive question for future research. Social desir-ability concerns should be muted with respect to unau-thorized immigrants, as our respondents have a clear,nonracial rationale for treating them differently. In thislight, the fact that a shift from German to Iraqi origin(–14.5) has a more negative impact than a shift from neverhaving visited the United States to having come withoutauthorization (–10.8) is informative. It suggests that re-sponses to immigrants’ countries of origin vary in mean-ingful ways, even with social desirability potentially atwork.
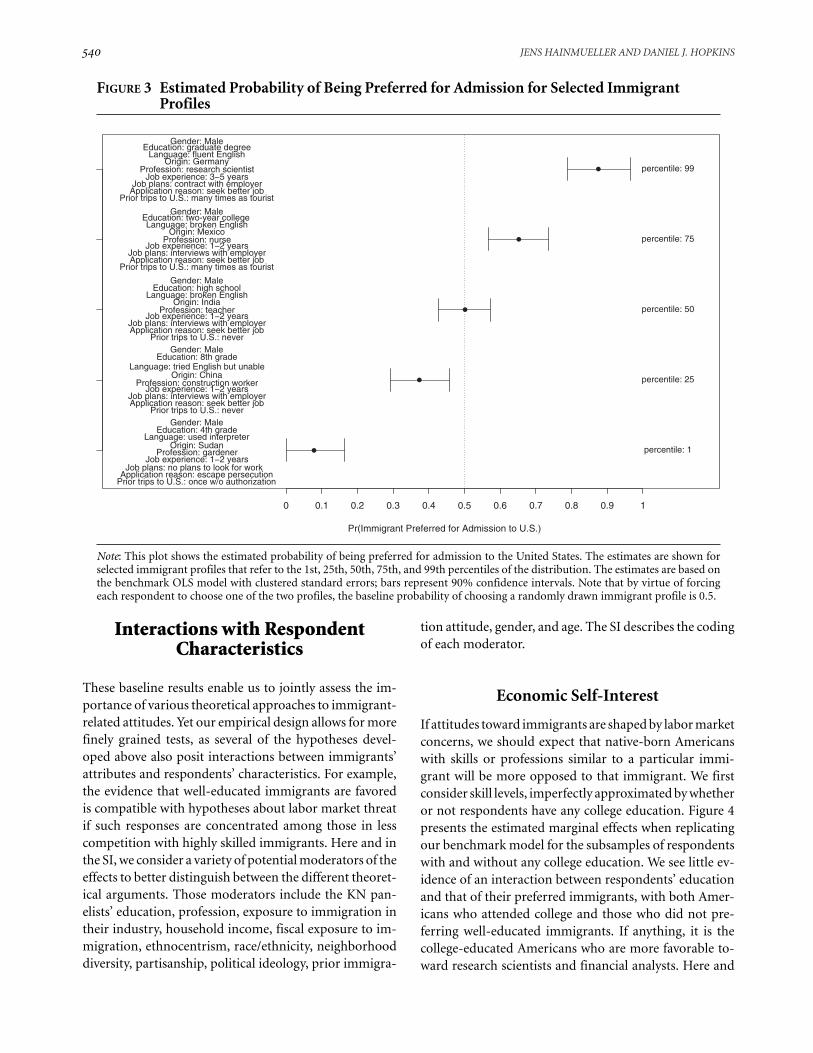
To better understand the substantive meaning ofthese results, Figure 3 illustrates the predicted proba-bility of being preferred for admission from our base-line model for immigrant profiles that correspond to the1st, 25th, 50th, 75th, and 99th percentiles of estimatedsupport. The first percentile is occupied by a Sudanesegardener with a fourth-grade education, no English, lit-tle job experience, no plans to work, and a prior unau-thorized trip. Such an immigrant would win support in8.1% of pairings (SE = 4.9). On the other extreme is aGerman research scientist with a graduate degree, fluentEnglish, 3–5 years of job experience, and a job contractwho had previously visited the United States many times.This applicant wins support 87.7% of the time (SE = 5.3).Taken together, our findings reveal that Americans’ viewsabout immigrants vary dramatically depending on theirattributes.
540 JENS HAINMUELLER AND DANIEL J. HOPKINS
FIGURE 3 Estimated Probability of Being Preferred for Admission for Selected ImmigrantProfiles
•
•
•
•
•
Pr(Immigrant Preferred for Admission to U.S.)
0 0.1 0.2 0.3 0.4 0.5 0.6 0.7 0.8 0.9 1
Gender: MaleEducation: 4th grade
Language: used interpreterOrigin: Sudan
Profession: gardenerJob experience: 1−2 years
Job plans: no plans to look for workApplication reason: escape persecution
Prior trips to U.S.: once w/o authorization
Gender: MaleEducation: 8th grade
Language: tried English but unableOrigin: China
Profession: construction workerJob experience: 1−2 years
Job plans: interviews with employerApplication reason: seek better job
Prior trips to U.S.: never
Gender: MaleEducation: high school
Language: broken EnglishOrigin: India
Profession: teacherJob experience: 1−2 years
Job plans: interviews with employerApplication reason: seek better job
Prior trips to U.S.: never
Gender: MaleEducation: two-year collegeLanguage: broken English
Origin: MexicoProfession: nurse
Job experience: 1−2 yearsJob plans: interviews with employerApplication reason: seek better job
Prior trips to U.S.: many times as tourist
Gender: MaleEducation: graduate degree
Language: fluent EnglishOrigin: Germany
Profession: research scientistJob experience: 3−5 years
Job plans: contract with employerApplication reason: seek better job
Prior trips to U.S.: many times as tourist
percentile: 1
percentile: 25
percentile: 50
percentile: 75
percentile: 99
Note: This plot shows the estimated probability of being preferred for admission to the United States. The estimates are shown forselected immigrant profiles that refer to the 1st, 25th, 50th, 75th, and 99th percentiles of the distribution. The estimates are based onthe benchmark OLS model with clustered standard errors; bars represent 90% confidence intervals. Note that by virtue of forcingeach respondent to choose one of the two profiles, the baseline probability of choosing a randomly drawn immigrant profile is 0.5.
Interactions with RespondentCharacteristics
These baseline results enable us to jointly assess the im-portance of various theoretical approaches to immigrant-related attitudes. Yet our empirical design allows for morefinely grained tests, as several of the hypotheses devel-oped above also posit interactions between immigrants’attributes and respondents’ characteristics. For example,the evidence that well-educated immigrants are favoredis compatible with hypotheses about labor market threatif such responses are concentrated among those in lesscompetition with highly skilled immigrants. Here and inthe SI, we consider a variety of potential moderators of theeffects to better distinguish between the different theoret-ical arguments. Those moderators include the KN pan-elists’ education, profession, exposure to immigration intheir industry, household income, fiscal exposure to im-migration, ethnocentrism, race/ethnicity, neighborhooddiversity, partisanship, political ideology, prior immigra-
tion attitude, gender, and age. The SI describes the codingof each moderator.
Economic Self-Interest
If attitudes toward immigrants are shaped by labor marketconcerns, we should expect that native-born Americanswith skills or professions similar to a particular immi-grant will be more opposed to that immigrant. We firstconsider skill levels, imperfectly approximated by whetheror not respondents have any college education. Figure 4presents the estimated marginal effects when replicatingour benchmark model for the subsamples of respondentswith and without any college education. We see little ev-idence of an interaction between respondents’ educationand that of their preferred immigrants, with both Amer-icans who attended college and those who did not pre-ferring well-educated immigrants. If anything, it is thecollege-educated Americans who are more favorable to-ward research scientists and financial analysts. Here and

THE HIDDEN AMERICAN IMMIGRATION CONSENSUS 541
FIGURE 4 Effects of Immigrant Attributes on Probability of Being Preferred for Admission byEducation of Respondent
Educational attainment: No College Educational attainment: Some College or More
once w/o authorization six months with family many times as tourist once as tourist neverPrior trips to U.S.:
escape persecution seek better job reunite with familyApplication reason:
no plans to look for work will look for work interviews with employer contract with employerJob plans:
5+ years 3−5 years 1−2 years noneJob experience:
doctor research scientist nurse computer programmer teacher construction worker financial analyst gardener child care provider waiter janitorProfession:
Iraq Somalia Sudan China India Poland Philippines Mexico France GermanyOrigin:
used interpreter
broken Englishtried English but unable
fluent EnglishLanguage:
graduate degree college degree two−year college high school 8th grade 4th grade no formalEducation:
male femaleGender:
−0.2 −0.1 0.0 0.1 0.2 −0.2 −0.1 0.0 0.1 0.2Effect on Pr(Immigrant Preferred for Admission)
Note: These plots show estimates of the effects of the randomly assigned immigrant attributes on the probability of being preferredfor admission to the United States. Estimates are based on the benchmark OLS model with clustered standard errors estimated forthe group of respondents without and with some college education, respectively; bars represent 95% confidence intervals. The pointswithout horizontal bars denote the attribute value that is the reference category for each attribute.
in all subgroup analyses, we present the results separatelyby subgroup in our figures, while using joint models withinteraction effects to estimate the statistical significanceof any differential effects.8 Hypotheses based on relativeskill levels do little to make sense of these results, althoughhypotheses based on immigrants’ sociotropic impacts areconsistent with this pattern. Examining other attributes,we see that the responses are quite similar irrespective ofthe respondents’ educational levels. Whether college ed-ucated or not, Americans agree that immigrants are more
8The AMCEs of financial analyst and research scientist are bothsignificantly different for respondents with and without collegeeducation, at p < .0005 and p < .005, respectively. To test for dif-ferences in the conditional AMCEs, we fit a fully interacted modelto the pooled data and then conduct an F-test against the restrictionthat the conditional AMCEs are the same in both samples.
desirable when they speak English, have a job contract,and have no history of unauthorized entry.
Another test of labor market competition considerswhether respondents are more likely to oppose an im-migrant who shares their profession. Here we augmentour benchmark model to include an indicator variablefor whether the immigrant’s listed profession matchedthe respondent’s. The results are shown in SI Table B.2.Respondents are not less likely to prefer or support animmigrant who shares their profession—the point esti-mates are very close to zero and insignificant. Similarly, SIFigure B.1 illustrates that respondents who work in indus-tries with high or low concentrations of immigrants arenot much different in their responses. None of these testsuncovers evidence consistent with labor market threat.
Other interest-based hypotheses lead us to expectindividual-level differences as well. For example, if
542 JENS HAINMUELLER AND DANIEL J. HOPKINS
voters are concerned that immigrants will increase publicspending, such concerns might be especially pronouncedamong those whose income or state of residence exposesthem to potential tax increases (Hanson, Scheve, andSlaughter 2007). In SI Figures B.2 and B.3, we presentthe results separately based on respondents’ householdincome and fiscal exposure to immigration. We find nomeaningful change in the penalty for such immigrantsacross these subsets.9 Taken together, these results suggestthat fiscal concerns stemming from material self-interestare far from paramount. Still, these findings are consis-tent with sociotropic concerns: Immigrants who have noplans to work might be perceived as a burden for thecountry as a whole.
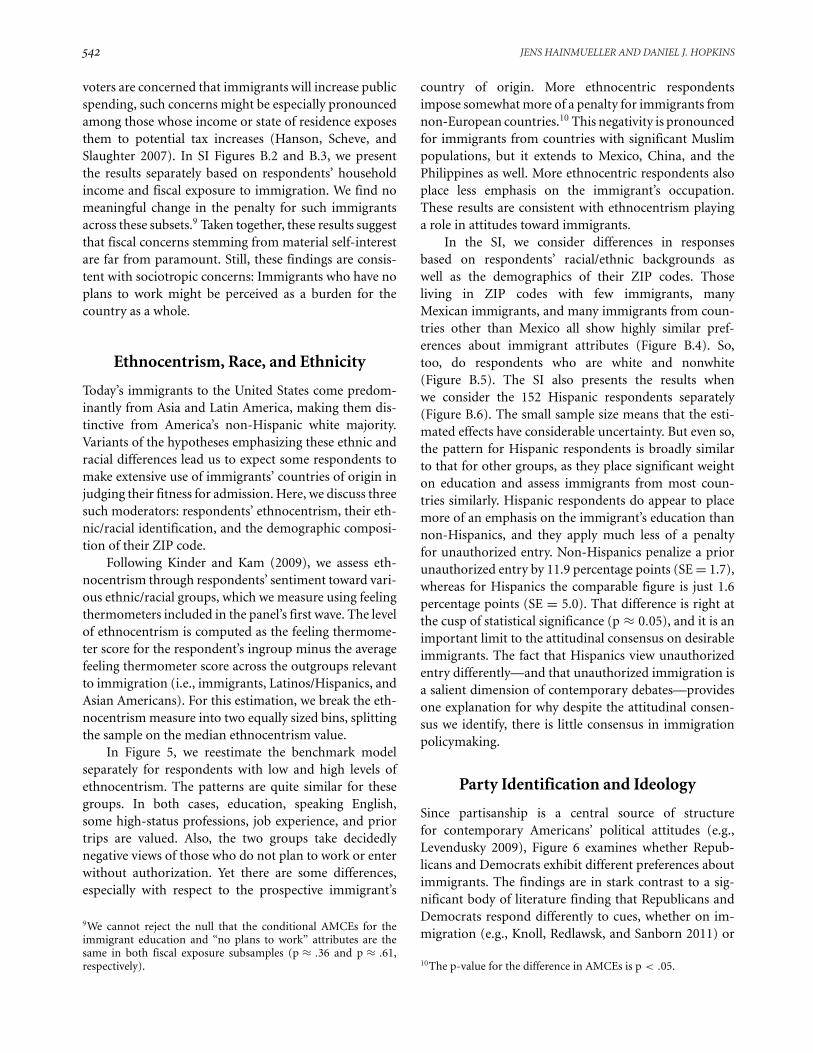
Ethnocentrism, Race, and Ethnicity
Today’s immigrants to the United States come predom-inantly from Asia and Latin America, making them dis-tinctive from America’s non-Hispanic white majority.Variants of the hypotheses emphasizing these ethnic andracial differences lead us to expect some respondents tomake extensive use of immigrants’ countries of origin injudging their fitness for admission. Here, we discuss threesuch moderators: respondents’ ethnocentrism, their eth-nic/racial identification, and the demographic composi-tion of their ZIP code.
Following Kinder and Kam (2009), we assess eth-nocentrism through respondents’ sentiment toward vari-ous ethnic/racial groups, which we measure using feelingthermometers included in the panel’s first wave. The levelof ethnocentrism is computed as the feeling thermome-ter score for the respondent’s ingroup minus the averagefeeling thermometer score across the outgroups relevantto immigration (i.e., immigrants, Latinos/Hispanics, andAsian Americans). For this estimation, we break the eth-nocentrism measure into two equally sized bins, splittingthe sample on the median ethnocentrism value.
In Figure 5, we reestimate the benchmark modelseparately for respondents with low and high levels ofethnocentrism. The patterns are quite similar for thesegroups. In both cases, education, speaking English,some high-status professions, job experience, and priortrips are valued. Also, the two groups take decidedlynegative views of those who do not plan to work or enterwithout authorization. Yet there are some differences,especially with respect to the prospective immigrant’s
9We cannot reject the null that the conditional AMCEs for theimmigrant education and “no plans to work” attributes are thesame in both fiscal exposure subsamples (p ≈ .36 and p ≈ .61,respectively).
country of origin. More ethnocentric respondentsimpose somewhat more of a penalty for immigrants fromnon-European countries.10 This negativity is pronouncedfor immigrants from countries with significant Muslimpopulations, but it extends to Mexico, China, and thePhilippines as well. More ethnocentric respondents alsoplace less emphasis on the immigrant’s occupation.These results are consistent with ethnocentrism playinga role in attitudes toward immigrants.
In the SI, we consider differences in responsesbased on respondents’ racial/ethnic backgrounds aswell as the demographics of their ZIP codes. Thoseliving in ZIP codes with few immigrants, manyMexican immigrants, and many immigrants from coun-tries other than Mexico all show highly similar pref-erences about immigrant attributes (Figure B.4). So,too, do respondents who are white and nonwhite(Figure B.5). The SI also presents the results whenwe consider the 152 Hispanic respondents separately(Figure B.6). The small sample size means that the esti-mated effects have considerable uncertainty. But even so,the pattern for Hispanic respondents is broadly similarto that for other groups, as they place significant weighton education and assess immigrants from most coun-tries similarly. Hispanic respondents do appear to placemore of an emphasis on the immigrant’s education thannon-Hispanics, and they apply much less of a penaltyfor unauthorized entry. Non-Hispanics penalize a priorunauthorized entry by 11.9 percentage points (SE = 1.7),whereas for Hispanics the comparable figure is just 1.6percentage points (SE = 5.0). That difference is right atthe cusp of statistical significance (p ≈ 0.05), and it is animportant limit to the attitudinal consensus on desirableimmigrants. The fact that Hispanics view unauthorizedentry differently—and that unauthorized immigration isa salient dimension of contemporary debates—providesone explanation for why despite the attitudinal consen-sus we identify, there is little consensus in immigrationpolicymaking.
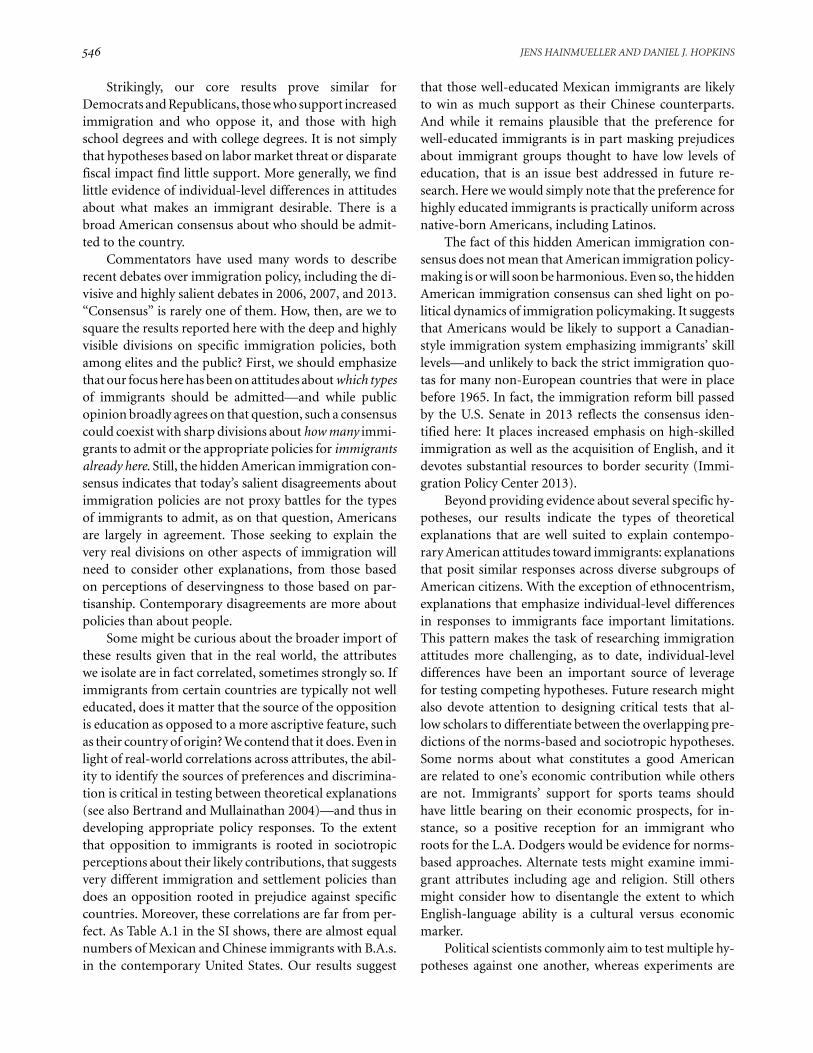
Party Identification and Ideology
Since partisanship is a central source of structurefor contemporary Americans’ political attitudes (e.g.,Levendusky 2009), Figure 6 examines whether Repub-licans and Democrats exhibit different preferences aboutimmigrants. The findings are in stark contrast to a sig-nificant body of literature finding that Republicans andDemocrats respond differently to cues, whether on im-migration (e.g., Knoll, Redlawsk, and Sanborn 2011) or
10The p-value for the difference in AMCEs is p < .05.

THE HIDDEN AMERICAN IMMIGRATION CONSENSUS 543
FIGURE 5 Effects of Immigrant Attributes on Probability of Being Preferred for Admission byEthnocentrism of Respondent
Low Ethnocentrism High Ethnocentrism
once w/o authorization six months with family many times as tourist once as tourist neverPrior trips to U.S.:
escape persecution seek better job reunite with familyApplication reason:
no plans to look for work will look for work interviews with employer contract with employerJob plans:
5+ years 3−5 years 1−2 years noneJob experience:
doctor research scientist nurse computer programmer teacher construction worker financial analyst gardener child care provider waiter janitorProfession:
Iraq Somalia Sudan China India Poland Philippines Mexico France GermanyOrigin:
used interpreter tried English but unable broken English fluent EnglishLanguage:
graduate degree college degree two−year college high school 8th grade 4th grade no formalEducation:
male femaleGender:
−0.2 −0.1 0.0 0.1 0.2 −0.2 −0.1 0.0 0.1 0.2Effect on Pr(Immigrant Preferred for Admission)
Note: These plots show estimates of the effects of the randomly assigned immigrant attributes on the probability of being preferredfor admission to the United States. Estimates are based on the benchmark OLS model with clustered standard errors estimatedfor the group of respondents with low and high levels of ethnocentrism, respectively; bars represent 95% confidence intervals. Thepoints without horizontal bars denote the attribute value that is the reference category for each attribute.
on other issues (e.g., Gerber and Huber 2009; Zaller1992). For a significant majority of the attribute values,the responses by Democrats and Republicans are highlysimilar. Republicans are much less supportive of immi-grants who have no plans to work or those who en-tered the United States without authorization—but soare Democrats. Irrespective of partisanship, Americansprefer well-educated immigrants in certain high-skillprofessions. The penalty for coming from Iraq is al-most identical, at –11.1 for Republicans and –10.7 forDemocrats.11 Overall, Democrats and Republicans eval-uate immigrant attributes in surprisingly similar ways.The same holds true for self-reported liberals and con-servatives, as shown in SI Figure B.7. The results are
11The p-value for the difference in AMCEs is p ≈ .94.
also stable when comparing respondents based on theirprior immigration attitudes (Figure B.8), gender (Fig-ure B.9), and age (Figure B.10). Partisanship, ideology,race/ethnicity, gender, and age structure a wide rangeof Americans’ political attitudes. But in understandingchoices between immigrants, these characteristics giveus little leverage. Strikingly, the American consensus onwhat constitutes a desirable immigrant cuts across eventhe most common correlates of differences in publicopinion.
Robustness Checks
One indication of these results’ robustness comes fromthe fact that they appear for the full set of respondents

544 JENS HAINMUELLER AND DANIEL J. HOPKINS
FIGURE 6 Effects of Immigrant Attributes on Probability of Being Preferred for Admission byParty Identification of Respondent
Republican Democrat
once w/o authorization six months with family many times as tourist once as tourist neverPrior trips to U.S.:
escape persecution seek better job reunite with familyApplication reason:
no plans to look for work will look for work interviews with employer contract with employerJob plans:
5+ years 3−5 years 1−2 years noneJob experience:
doctor research scientist nurse computer programmer teacher construction worker financial analyst gardener child care provider waiter janitorProfession:
Iraq Somalia Sudan China India Poland Philippines Mexico France GermanyOrigin:
used interpreter tried English but unable broken English fluent EnglishLanguage:
graduate degree college degree two−year college high school 8th grade 4th grade no formalEducation:
male femaleGender:
−0.2 −0.1 0.0 0.1 0.2 −0.2 −0.1 0.0 0.1 0.2Effect on Pr(Immigrant Preferred for Admission)
Note: These plots show estimates of the effects of the randomly assigned immigrant attributes on the probability of being preferred foradmission to the United States. Estimates are based on the benchmark OLS model with clustered standard errors estimated for the groupof respondents who identify with or lean toward the Republican or Democratic parties, respectively; bars represent 95% confidenceintervals. The points without horizontal bars denote the attribute value that is the reference category for each attribute.
as well as for many theoretically relevant subgroups. Inthe SI, we report a wide variety of additional robustnesschecks.
First, we replicate the benchmark model using aprofile-specific outcome measure. The analyses aboveemploy the Immigrant Preferred outcome, in which re-spondents were asked to choose between the two immi-grant profiles presented in each pairing. This design hasan important advantage: It enables us to separate atti-tudes about overall levels of immigration from attitudesabout preferred types of immigrants, since everyone mustchoose one of the two immigrants. Still, it is informativeto test whether the results are sensitive to the specificationof the dependent variable. We do so by using two ques-tions that we asked immediately after the forced-choicequestion. For each profile, those questions asked respon-
dents to assess the immigrant on a scale from 1 to 7, where1 indicates that the United States should “absolutely notadmit” the immigrant and 7 indicates that the UnitedStates “definitely should admit” the immigrant. We di-chotomize the answers, coding them as 1 if the responseis above the midpoint (and so indicates support for ad-mission) and 0 otherwise. The results are reported in SIFigure C.1. The core conclusions differ little from thosefor the forced-choice outcome.12
As additional robustness checks, we examined differ-ent ways of addressing the clustering of profiles by respon-dents. We replicated the benchmark model while adding
12To be sure, the presence of these rating questions immediatelyafter the forced-choice question could influence responses, as re-spondents might rate chosen profiles more highly or unchosenprofiles less so.

THE HIDDEN AMERICAN IMMIGRATION CONSENSUS 545
respondent fixed effects (SI Figure C.2) and respondentrandom effects (SI Figure C.3). The results are almostidentical to those from the benchmark model reportedabove.
Third, we show that the results do not differ for long-time members of the KN panel (SI Figure C.4) and arevery similar across the five pairings evaluated by each re-spondent (SI Figure C.5). These results add to the externalvalidity of our findings, as the effects of the immigrantattributes do not change as respondents become familiareither with survey taking in general or our survey specif-ically.
Fourth, we consider the extent to which responsesare shaped by social desirability. Following Berinsky andLavine (2011), we do so using three first-wave questions tomeasure self-monitoring, one aspect of self-presentationthat is closely connected to social desirability. Respon-dents high in self-monitoring exert more effort to presentthemselves in an appealing way. However, when reesti-mating the marginal effects while separating respondentsinto those who are low or high in self-monitoring,13
we find that any differences are minor (SI Figure C.6).High self-monitors seem somewhat less opposed to im-migrants who entered once without authorization.14 Boththose who engage in more self-monitoring and thosewho do not are more negative toward Iraqi or Somaliimmigrants.15 The weak effect of Mexico, for example,does not appear to be driven by those high in self-monitoring.16 While these patterns do not rule out theinfluence of social desirability, our substantive conclu-sions would be similar even when restricting our atten-tion to a subset of respondents least likely to give so-cially desirable answers. Moreover, online survey admin-istration is known to reduce respondents’ tendency toreport socially desirable answers (Chang and Krosnick2009).
Fifth, we checked whether respondents react differ-ently to atypical profiles. We identified combinations ofattribute values that might be considered atypical, suchas profiles from poor countries with high-status jobs.We then subdivided our respondents into those who saw0–3 atypical profiles, those who saw 4–5, and those whosaw 7–10. The core results differ little across these subsets
13We divide the sample at the median of the self-monitoring scale,which is an additive index of the three self-monitoring questions.The Cronbach’s alpha for the three items is .69.
14The p-value for the difference in the AMCEs is p < .04.
15The p-values for the differences in the AMCEs are p ≈ .77 andp ≈ .79, respectively.
16The p-value for the difference in ACMEs is p ≈ .81.
of respondents and are not driven by reactions to lesscommon profiles (SI Figure C.7).
Finally, we conducted additional robustness checksusing Mechanical Turk in which we asked respondentsto perform the conjoint task described above. In the firstMechanical Turk study, we added a question that asked re-spondents to explain their choice for each pairing in theirown words. The clusters of words that the respondents useto explain their decisions match the findings that comefrom the conjoint analysis closely, further validating themethod (see SI Table C.1). In the second Mechanical Turkstudy, we randomly varied the introduction to the con-joint task to include or exclude the phrase about acting“as if you were an immigration official.” The results werealmost identical across the two conditions, suggestingthe results are robust to these different framings(SI Figure C.8). Moreover, the overall results from theMechanical Turk samples were similar to those from theKN sample detailed above.
Discussion and Conclusion
By identifying specific immigrant attributes that shapeimmigration opinions, scholarship using survey experi-ments has advanced our understanding in critical ways.In separate experiments, prior research has manipulatedfactors including immigrants’ skill levels, countries oforigin, skin tones, and languages. But as survey exper-iments proliferate, the task of comparing the explanatorypower of the many immigrant attributes on a single scalebecomes increasingly important. This article introducesconjoint analysis to vary nine theoretically relevant at-tributes of hypothetical immigrants, and thus to makeexplicit comparisons between the explanatory strength ofvarious hypotheses.
Two types of explanations—sociotropic explanationsand norms-based explanations—receive strong support.Americans express a pronounced preference for immi-grants who are well educated, are in high-skilled profes-sions, and plan to work upon arrival. They prefer English-speaking immigrants with no unauthorized prior trips.We do find that country of origin matters, with Iraqis pe-nalized and with more ethnocentric respondents relyingmore heavily on country of origin in making decisions.But this attribute’s explanatory power is limited. Con-ditional on information about prior trips to the UnitedStates, there is no penalty for immigrants from Mexico,which is the single largest sender of immigrants to thecontemporary United States.
546 JENS HAINMUELLER AND DANIEL J. HOPKINS
Strikingly, our core results prove similar forDemocrats and Republicans, those who support increasedimmigration and who oppose it, and those with highschool degrees and with college degrees. It is not simplythat hypotheses based on labor market threat or disparatefiscal impact find little support. More generally, we findlittle evidence of individual-level differences in attitudesabout what makes an immigrant desirable. There is abroad American consensus about who should be admit-ted to the country.
Commentators have used many words to describerecent debates over immigration policy, including the di-visive and highly salient debates in 2006, 2007, and 2013.“Consensus” is rarely one of them. How, then, are we tosquare the results reported here with the deep and highlyvisible divisions on specific immigration policies, bothamong elites and the public? First, we should emphasizethat our focus here has been on attitudes about which typesof immigrants should be admitted—and while publicopinion broadly agrees on that question, such a consensuscould coexist with sharp divisions about how many immi-grants to admit or the appropriate policies for immigrantsalready here. Still, the hidden American immigration con-sensus indicates that today’s salient disagreements aboutimmigration policies are not proxy battles for the typesof immigrants to admit, as on that question, Americansare largely in agreement. Those seeking to explain thevery real divisions on other aspects of immigration willneed to consider other explanations, from those basedon perceptions of deservingness to those based on par-tisanship. Contemporary disagreements are more aboutpolicies than about people.
Some might be curious about the broader import ofthese results given that in the real world, the attributeswe isolate are in fact correlated, sometimes strongly so. Ifimmigrants from certain countries are typically not welleducated, does it matter that the source of the oppositionis education as opposed to a more ascriptive feature, suchas their country of origin? We contend that it does. Even inlight of real-world correlations across attributes, the abil-ity to identify the sources of preferences and discrimina-tion is critical in testing between theoretical explanations(see also Bertrand and Mullainathan 2004)—and thus indeveloping appropriate policy responses. To the extentthat opposition to immigrants is rooted in sociotropicperceptions about their likely contributions, that suggestsvery different immigration and settlement policies thandoes an opposition rooted in prejudice against specificcountries. Moreover, these correlations are far from per-fect. As Table A.1 in the SI shows, there are almost equalnumbers of Mexican and Chinese immigrants with B.A.s.in the contemporary United States. Our results suggest
that those well-educated Mexican immigrants are likelyto win as much support as their Chinese counterparts.And while it remains plausible that the preference forwell-educated immigrants is in part masking prejudicesabout immigrant groups thought to have low levels ofeducation, that is an issue best addressed in future re-search. Here we would simply note that the preference forhighly educated immigrants is practically uniform acrossnative-born Americans, including Latinos.
The fact of this hidden American immigration con-sensus does not mean that American immigration policy-making is or will soon be harmonious. Even so, the hiddenAmerican immigration consensus can shed light on po-litical dynamics of immigration policymaking. It suggeststhat Americans would be likely to support a Canadian-style immigration system emphasizing immigrants’ skilllevels—and unlikely to back the strict immigration quo-tas for many non-European countries that were in placebefore 1965. In fact, the immigration reform bill passedby the U.S. Senate in 2013 reflects the consensus iden-tified here: It places increased emphasis on high-skilledimmigration as well as the acquisition of English, and itdevotes substantial resources to border security (Immi-gration Policy Center 2013).
Beyond providing evidence about several specific hy-potheses, our results indicate the types of theoreticalexplanations that are well suited to explain contempo-rary American attitudes toward immigrants: explanationsthat posit similar responses across diverse subgroups ofAmerican citizens. With the exception of ethnocentrism,explanations that emphasize individual-level differencesin responses to immigrants face important limitations.This pattern makes the task of researching immigrationattitudes more challenging, as to date, individual-leveldifferences have been an important source of leveragefor testing competing hypotheses. Future research mightalso devote attention to designing critical tests that al-low scholars to differentiate between the overlapping pre-dictions of the norms-based and sociotropic hypotheses.Some norms about what constitutes a good Americanare related to one’s economic contribution while othersare not. Immigrants’ support for sports teams shouldhave little bearing on their economic prospects, for in-stance, so a positive reception for an immigrant whoroots for the L.A. Dodgers would be evidence for norms-based approaches. Alternate tests might examine immi-grant attributes including age and religion. Still othersmight consider how to disentangle the extent to whichEnglish-language ability is a cultural versus economicmarker.
Political scientists commonly aim to test multiple hy-potheses against one another, whereas experiments are

THE HIDDEN AMERICAN IMMIGRATION CONSENSUS 547
typically designed to recover the causal effects of a smallnumber of manipulated treatments. For that reason, theyface inherent limitations in testing competing theoreticalexplanations. The conjoint analysis employed here helpsreduce the tension between the discipline’s theoreticalgoals and its methodological tools, as this design enablesresearchers to experimentally evaluate many hypotheseson a single scale. It also encourages scholars to think notin binary terms about hypotheses that are falsified butabout relative levels of support for different claims. Here,we have focused on perceptions about immigrants, andWright, Levy, and Citrin (2014) provide a valuable exten-sion by considering the attributes that make native-borncitizens more or less likely to support deporting unau-thorized immigrants. But as discussed in Hainmueller,Hopkins, and Yamamoto (2014), the technique’s applica-bility is likely to be substantially wider. It could shed lighton major questions in the study of voting and politicalbehavior, such as the relative weight that voters place onvarious candidate attributes in their decision making orhow they evaluate multidimensional policy bundles suchas immigration or health care reform.
References
Adida, Claire L., David D. Laitin, and Marie-Anne Val-fort. 2010. “Identifying Barriers to Muslim Integration inFrance.”Proceedings of the National Academy of Sciences107(52): 22384–90.
Berinsky, Adam J., and Howard Lavine. 2011. “Self-Monitoringand Political Attitudes”. In Improving Public Opinion Surveys:Interdisciplinary Innovation and the American National Elec-tion Studies, ed. John H. Aldrich, and Kathleen M. McGraw.Princeton, NJ: Princeton University Press.
Bertrand, Marianne, and Sendhil Mullainathan. 2004. “AreEmily and Brendan More Employable Than Latoya andTyrone? Evidence on Racial Discrimination in the LaborMarket from a Large Randomized Experiment.”AmericanEconomic Review 94(4): 991–1013.
Brader, Ted, Nicholas Valentino, and Elizabeth Suhay. 2008. “IsIt Immigration or the Immigrants? The Emotional Influenceof Groups on Public Opinion and Political Action.”AmericanJournal of Political Science 52(4): 959–78.
Burns, Peter, and James G. Gimpel. 2000. “Economic Insecurity,Prejudicial Stereotypes, and Public Opinion on ImmigrationPolicy.”Political Science Quarterly 115(2): 201–25.
Chang, Linchiat, and Jon A. Krosnick. 2009. “National Surveysvia RDD Telephone Interviewing versus the Internet.”PublicOpinion Quarterly 73(4): 641–78.
Citrin, Jack, Donald P. Green, Christopher Muste, and CaraWong. 1997. “Public Opinion toward Immigration Reform:The Role of Economic Motivations.”Journal of Politics 59(3):858–81.
Dustmann, Christian, and Ian Preston. 2007. “Racial and Eco-nomic Factors in Attitudes to Immigration.”BE Journal ofEconomic Analysis & Policy 7(1): 1–39.
Facchini, Giovanni, and Anna Maria Mayda. 2009. “Does theWelfare State Affect Individual Attitudes toward Immi-grants? Evidence across Countries.”Review of Economics andStatistics 91(2): 295–314.
Gerber, Alan S., and Gregory A. Huber. 2009. “Partisanship andEconomic Behavior: Do Partisan Differences in EconomicForecasts Predict Real Economic Behavior?”American Polit-ical Science Review 103(3): 407–26.
Hainmueller, Jens, and Dominik Hangartner. 2013. “Who Getsa Swiss Passport? A Natural Experiment in Immigrant Dis-crimination.”American Political Science Review 107(1): 159–87.
Hainmueller, Jens, Michael Hiscox, and Yotam Margalit. 2014.“Do Concerns about Labour Market Competition Shape At-titudes toward Immigration? New Evidence from U.S. Work-ers.” Journal of International Economics. Forthcoming.
Hainmueller, Jens, and Michael J. Hiscox. 2007. “Educated Pref-erences: Explaining Attitudes toward Immigration in Eu-rope.”International Organization 61(2): 399–442.
Hainmueller, Jens, and Michael J. Hiscox. 2010. “Attitudes to-ward Highly Skilled and Low-Skilled Immigration: Evidencefrom a Survey Experiment.”American Political Science Re-view 104(1): 61–84.
Hainmueller, Jens, and Daniel J. Hopkins. 2014. “Public Atti-tudes toward Immigration.”Annual Review of Political Sci-ence 17: 225–249.
Hainmueller, Jens, Daniel J. Hopkins, and Teppei Yamamoto.2014. “Causal Inference in Conjoint Analysis: Understand-ing Multidimensional Choices via Stated Preference Experi-ments.”Political Analysis 22(1): 1–30.
Hanson, Gordon H., Kenneth Scheve, and Matthew J. Slaugh-ter. 2007. “Public Finance and Individual Preferences overGlobalization Strategies.”Economics and Politics 19(1): 1–33.
Harell, Allison, Stuart Soroka, Shanto Iyengar, and NicholasValentino. 2012. “The Impact of Economic and CulturalCues on Support for Immigration in Canada and theUnited States.”Canadian Journal of Political Science 45(3):499–530.
Hetherington, Marc J., and Jonathan Weiler. 2009. Authori-tarianism and Polarization in American Politics. New York:Cambridge University Press.
Hood, M. V., and Irwin L. Morris. 1998. “Give Us Your Tired,Your Poor...But Make Sure They Have a Green Card: The Ef-fects of Documented and Undocumented Migrant Contexton Anglo Opinion toward Immigration.”Political Behavior20(1): 1–15.
Hopkins, Daniel J. 2014. “The Upside of Accents: Language, SkinTone, and Attitudes towards Immigration.”British Journal ofPolitical Science. doi: 10.1017/S0007123413000483.
Immigration Policy Center. 2013. “Guide to S.744: Un-derstanding the 2013 Senate Immigration Bill.” http://www.immigrationpolicy.org/special-reports/guide-s744-understanding-2013-senate-immigration-bill.
Iyengar, Shanto, Simon Jackman, Solomon Messing, NicholasValentino, Toril Aalberg, Raymond Duch, Kyu S. Hahn, Stu-art Soroka, Allison Harell, and Tetsuro Kobayashi. 2013.“Do Attitudes about Immigration Predict Willingness to

548 JENS HAINMUELLER AND DANIEL J. HOPKINS
Admit Individual Immigrants? A Cross-National Test ofthe Person-Positivity Bias.”Public Opinion Quarterly 77(3):641–65.
Kinder, Donald R., and Cindy D. Kam. 2009. Us Against Them:Ethnocentric Foundations of American Opinion. Chicago:University of Chicago Press.
Kinder, Donald R., and D. Roderick Kiewiet. 1981. “SociotropicPolitics: The American Case.”British Journal of Political Sci-ence 11: 129–61.
Knoll, Benjamin R., David Redlawsk, and Howard San-born. 2011. “Framing Labels and Immigration Policy At-titudes in the Iowa Caucuses: ‘Trying to Out-TancredoTancredo.”Political Behavior 33(3): 433–54.
Krosnick, Jon A. 1999. “Survey Research.”Annual Review ofPsychology 50(1): 537–67.
Levendusky, Matthew. 2009. The Partisan Sort: How LiberalsBecame Democrats and Conservatives Became Republicans.Chicago: University of Chicago Press.
Malhotra, Neil, Yotam Margalit, and Cecilia Mo. 2013. “Eco-nomic Explanations for Opposition to Immigration: Dis-tinguishing between Prevalence and Magnitude.”AmericanJournal of Political Science 57(2): 391–410.
Mayda, Anna Maria. 2006. “Who Is Against Immigrants? ACross-Country Investigation of Individual Attitudes towardsImmigrants.”Review of Economics and Statistics 88(3): 510–30.
Messina, Anthony M. 1989. Race and Party Competition inBritain. Oxford: Clarendon Press.
Newman, Benjamin J., Todd K. Hartman, and Charles S. Taber.2014. “Social Dominance and the Cultural Politics of Immi-gration.” Political Psychology. 35: 165–186.
Ostfeld, Mara Cecilia. 2012. “Shaping Attitudes toward Immi-gration: Understanding the Role of Race and Assimilation.”Paper presented at the Annual Meeting of the Midwest Po-litical Science Association, Chicago, IL.
Perez, Efren O. 2010. “Explicit Evidence on the Import ofImplicit Attitudes: The IAT and Immigration Policy Judg-ments.”Political Behavior 32(4): 517–45.
Raghavarao, Damaraju, James B. Wiley, and Pallavi Chitturi.2011. Choice-Based Conjoint Analysis: Models and Designs.BOCA RATON, FL: CRC Press.
Scheve, Kenneth, and Matthew Slaughter. 2001. “Labor MarketCompetition and Individual Preferences over ImmigrationPolicy.”Review of Economics and Statistics 83(1): 133–45.
Schildkraut, Deborah. 2005. Press One for English: LanguagePolicy, Public Opinion, and American Identity. Princeton, NJ:Princeton University Press.
Schildkraut, Deborah. 2011. Americanism in the Twenty-FirstCentury: Public Opinion in the Age of Immigration. New York:Cambridge University Press.
Sides, John, and Jack Citrin. 2007. “European Opinion aboutImmigration: The Role of Identities, Interests, and Informa-tion.”British Journal of Political Science 37: 477–504.
Sniderman, Paul, Louk Hagendoorn, and Markus Prior. 2004.“Predisposing Factors and Situational Triggers: Exclusion-ary Reactions to Immigrant Minorities.”American PoliticalScience Review 98(1): 35–49.
Sniderman, Paul M., Pierangelo Peri, Rui J. P. de Figueiredo, andThomas Piazza. 2002. The Outsider: Prejudice and Politics inItaly. Princeton, NJ: Princeton University Press.
Theiss-Morse, Elizabeth. 2009. Who Counts as an American?The Boundaries of National Identity. New York: CambridgeUniversity Press.
Tichenor, Daniel. 2002. Dividing Lines: The Politics of Immigra-tion Control in America. Princeton, NJ: Princeton UniversityPress.
U.S. Census Bureau. 2011. “Fact Finder.” www.census.gov.
Valentino, Nicholas A., and Shanto Iyengar. 2011. “Skin vs.Skill: Exploring Economic vs. Racial Threats as Drivers ofImmigration Opinion in the Comparative Context.” Paperpresented at the 2011 Meeting of the Midwest political Sci-ence Association, Chicago, IL.
Wong, Cara J. 2010. Boundaries of Obligation in American Pol-itics: Geographic, National, and Racial Communities. NewYork: Cambridge University Press.
Wright, Matthew. 2011. “Diversity and the Imagined Com-munity: Immigrant Diversity and Conceptions of NationalIdentity.”Political Psychology 32(5): 837–62.
Wright, Matthew, and Jack Citrin. 2011. “Saved by the Stars andStripes? Images of Protest, Salience of Threat, and Immigra-tion Attitudes.”American Politics Research 39(2): 323–43.
Wright, Matthew, Morris Levy, and Jack Citrin. 2014. “Com-paring the Foundations of American Public Opinion towardLegal and Illegal Immigration.” Paper presented at the An-nual Meeting of the Midwest Political Science Association,Chicago, IL.
Zaller, John R. 1992. The Nature and Origins of Mass Opinion.New York: Cambridge University Press.
Supporting Information
Additional Supporting Information may be found in theonline version of this article at the publisher’s website:
Appendix A: Data DescriptionAppendix B: Additional ResultsAppendix C: Robustness Checks