the hiroshima neutron dosimetry enigma: missing puzzle piece no. 6
TRANSCRIPT

The Hiroshima neutron dosimetry enigma: Missing puzzlepiece No. 6
Raymond Gold
Metrology Control Corporation (MC2), Richland, WA 99352, USA
Received 16 December 1998; received in revised form 12 March 1999
Abstract
More than a decade has elapsed since the serious nature of the discrepancy between neutron dosimetry1
experiments (E) and neutron transport calculations (C) for the Hiroshima site was identi®ed. Since that timeextensive e�orts to resolve this Hiroshima neutron dosimetry enigma have not only failed, but now demonstratethat the magnitude of this discrepancy is much greater than initially estimated. The currently evaluated E/C ratio
for thermal neutron ¯uence at the Hiroshima site increases rapidly with increasing slant range from the epicenter. Inthe slant range region beyond 1000 m, E/C exceeds unity by one to two orders of magnitude depending on thespeci®c dosimetry data that are utilized.
Principal features that characterize the Hiroshima neutron dosimetry enigma are summarized. Puzzle Piece No. 6:In-situ production and Prompt fallout of radionuclides from Little Boy is advanced as a possible contributoryphenomenon to this enigma. (The atom bomb detonated over Hiroshima was called Little Boy.) Measurements of60Co and 152Eu speci®c activity at the Hiroshima site are used to obtain order of magnitude numerical estimatesthat show this conjecture is plausible. Comparison of di�erent 60Co measurements at the Hiroshima site reveals thatthe variation of E/C with slant range depends on the method used to quantify 60Co speci®c activity as well as thetype of dosimetry samples that are employed. These 60Co comparisons lend additional qualitative credence to this
conjecture. Within the limits of presently available data, these assessments show that Puzzle Piece No. 6qualitatively satis®es the principal features that characterize the Hiroshima neutron dosimetry enigma. Nevertheless,current lack of data prevent this conjecture from being conclusively con®rmed or refuted. Consequently, speci®c
recommendations are advanced to resolve the Hiroshima neutron dosimetry enigma with emphasis on experimentaltests that can quantitatively evaluate Puzzle Piece No. 6. # 1999 Elsevier Science Ltd. All rights reserved.
Keywords: Hiroshima; Neutron dosimetry; Little Boy; 60Co; 152Eu
Radiation Measurements 30 (1999) 435±451
1350-4487/99/$ - see front matter # 1999 Elsevier Science Ltd. All rights reserved.
PII: S1350-4487(99 )00070-0
www.elsevier.com/locate/radmeas
1 Throughout this exposition the term dosimetry is used in the context of radiation metrology rather than the context of radio-
biology. The operational meaning of the term dosimetry is di�erent in these two scienti®c specialities. In radiobiology, biological
e�ects are expressed as a function of dose, which is the energy deposited per gram of tissue by a speci®c component of the radi-
ation ®eld. In contrast with this speci®c de®nition of dose in radiobiology, the term dosimetry possesses a very broad operational
meaning in radiation metrology. In radiation metrology, the term dosimetry describes activities undertaken to characterize or quan-
tify radiation ®eld observables. These radiation ®eld observables can change from one application or experiment to the next and
include such quantities as reactions, reaction rates and speci®c activity as well as the intensity and energy distribution of speci®c
radiation ®eld components.

1. Introduction
International programs have been conducted over
the last ®ve decades to quantify the exposure of atom
bomb survivors from Hiroshima and Nagasaki.
Perhaps the most comprehensive of these e�orts was
the US±Japan program conducted in the early 1980s
under the auspices of the joint US±Japan Radiation
E�ects Research Foundation (RERF). Included in this
program was the construction of a replica of Little
Boy, which was operated as a critical assembly at Los
Alamos National Laboratory (LANL). The Little Boy
replica provided a benchmark neutron ®eld for the
intercomparison of experimental and calculational
methods. This program culminated in a ®nal report
designated as Dosimetry System 1986 (DS86), (Roesch,
1987) which provided an extensive description of
e�orts expended (prior to 1987) to quantify neutron
and gamma-ray doses experienced by atom bomb sur-
vivors. This DS86 ®nal report contains the ®rst serious
recognition and appreciation of the neutron dosimetry2
discrepancy between calculation and experiment at the
Hiroshima site (Loewe et al., 1987).
Extensive e�orts have been expended to resolve this
neutron dosimetry discrepancy. More comprehensive
neutron measurements have been conducted with 60Co,152Eu, and 154Eu radiometric monitors at the
Hiroshima site (Hoshi et al., 1989; Kerr et al., 1990;
Kimura et al., 1990; Nakanishi et al., 1991; Shizuma et
al., 1993, 1998). Additional analyses of 36Cl accelerator
mass spectroscopy (AMS) monitors have con®rmed
the overall behavior of E/C as a function of slant
range (Straume et al., 1990, 1992; Straume, 1996,
1998). More re®ned calculations have been performed
(Kaul et al., 1994). These extensive e�orts have not
only failed to resolve this neutron dosimetry enigma,
but demonstrate that the magnitude of this enigma is
much greater than initially estimated. At present, the
unresolved discrepancy between experimental results
(E) and calculations (C) for thermal neutron ¯uences
at the Hiroshima site is signi®cant. The currently eval-
uated E/C ratio increases rapidly with increasing slant
range, s. (Slant range, s, is measured from the epicen-
ter, i.e., the burst point, whereas ground range, r, is
measured from the hypocenter, which is the point on
the ground immediately under the epicenter. The el-
evation of the Little Boy weapon at the time of deto-
nation was approximately 580 m.) In the region
se1000 m, E/C exceeds unity by one to two orders of
magnitude depending on the speci®c dosimetry data
that are utilized.
Because of the persistent and perplexing nature of
this discrepancy, in recent analyses it has been called
the DS86 neutron dosimetry enigma (Gold, 1994,
1995a). In these previous analyses, the complexity of
the DS86 neutron dosimetry enigma was revealed by
identifying ®ve missing puzzle pieces or factors, which
underlie the enigma. These missing puzzle pieces are:
1. Little-Boy Replica Power Normalization.
2. Angular Anisotropy.
3. Global Shielding.
4. The Gamma-Ray Component.
5. Environmental Neutrons.
Through a detailed analysis of factors (1), (2) and (3),
it was demonstrated that DS86 calculations and exper-
imental neutron dosimetry results were in acceptable
agreement out to a slant range, s, of approximately
800 m at the Hiroshima site. While these analyses pro-
vided no resolution of the DS86 neutron dosimetry
enigma in the region s> 800 m, speci®c experiments
and calculations were advanced that could provide
insight into certain aspects of this complex enigma
(Gold, 1994, 1995a).
In view of the extensive e�orts expended since the
DS86 ®nal report was issued, it is more appropriate at
the present time to refer to this persistent and unre-
solved discrepancy as the Hiroshima neutron dosimetry
enigma. The following six principal features character-
ize the nature of the Hiroshima neutron dosimetry
enigma:
(F1) Acceptable agreement between E and C have
been obtained for the Nagasaki site, but not for the
Hiroshima site (Kaul et al., 1994).
(F2) At the Hiroshima site, E and C are in accepta-
ble agreement for s< 800 m. For s> 800 m, E/C
increases monotonically with increasing s from ap-
proximately unity at s 1 800 m to values exceeding
10 in the neighborhood of s 1 1500 m.
(F3) Calculations (C) are based on neutron trans-
port codes and analyses described in the DS86 ®nal
report (Kerr et al., 1987) as well as subsequent
re®nements, which are referred to as 93Rev (Kaul
et al., 1994).
(F4) Experiments (E) are based on measurements
with three radiometric monitors: 60Co, 152Eu and154Eu as well as one AMS monitor: 36Cl. All four
of these monitors are predominantly thermal neu-
tron dosimeters.
(F5) The neutron ¯uence at both the Hiroshima
and Nagasaki sites decreases rapidly with increasing
distance as measured either in ground range from
the hypocenter or slant range from the epicenter.
Based on DS86 calculations, (Kerr et al., 1987) the
decrease in thermal neutron ¯uence between the
hypocenter and a ground range of 2000 m exceeds
®ve orders of magnitude.2 See footnote 1.
R. Gold / Radiation Measurements 30 (1999) 435±451436

(F6) While these neutron dosimeters provide E/Cvalues for thermal ¯uence signi®cantly greater than
unity in the region s > 1000 m, E/C values for152Eu and 36Cl monitors are systematically largerthan those of 60Co. This systematic e�ect was ®rst
identi®ed and assessed with AMS 36Cl monitors byStraume et al. (1992) and subsequently con®rmedby Shizuma et al. (1993).
Proposed resolutions of the Hiroshima neutron dosim-etry enigma should take these six features into account.For example, an important consequence of feature F5
is that a small and slowly varying background com-ponent that exists at the Hiroshima site, but not theNagasaki site, could explain the Hiroshima neutron
dosimetry enigma. In the region s < 800 m, the rela-tive contribution of this background component to thetotal signal could be negligible. However, since thethermal neutron ¯uence decreases so rapidly with
increasing ground range, r, from the hypocenter, therelative contribution from a slowly varying back-ground component could become dominant for su�-
ciently large r. For this reason, earlier analyses treatedPuzzle Piece No. 5: Environmental Neutrons (EN) inconsiderable detail (Gold, 1994, 1995a). Since the EN
background component may still play an importantrole, experiments to quantify EN intensity at theHiroshima site are recommended in Section 5 below.In this treatise, In-situ production and Prompt fall-
out of radionuclides from Little-Boy is advanced as aphenomenon that could create a signi®cant back-ground and thereby contribute to the Hiroshima neu-
tron dosimetry enigma. Section 2 provides aqualitative description of Puzzle Piece No. 6.Numerical estimates for Puzzle Piece No. 6 are con-
sidered in Section 3. Comparisons of di�erent 60Comeasurements at the Hiroshima site are presented inSection 4. Recommendations for a more quantitative
evaluation of Puzzle Piece No. 6 are advanced inSection 5 and conclusions are provided in Section 6.
2. Puzzle Piece No. 6: In-situ production and Prompt
fallout of radionuclides from Little Boy
2.1. In-situ production of 36Cl, 60Co, 152Eu and 154Eu
Chlorine, cobalt and europium posses importantproperties that permit `a posteriori' neutron dosimetry
to be conducted at the Hiroshima and Nagasaki sites.The isotopes 35Cl, 59Co, 151Eu and 153Eu possess size-able neutron activation cross sections. The resulting
radionuclides produced by neutron capture, namely36Cl, 60Co, 152Eu and 154Eu, possess distinct decaytransitions with half-lives that are long enough to pro-
vide detectable radioactivity even some ®fty years afterthe detonation of these two atomic bombs.
The existence of 35Cl, 59Co, 151Eu and 153Eu asminor constituents in dosimetry samples recoveredfrom the Hiroshima and Nagasaki sites is an equally
important property of these neutron dosimeters. Thisproperty stems from the existence of Cl, Co and Eu asminor constituents in the composition of the earth's
crust. As a consequence of the existence of Cl, Co andEu in the earth's crust, 35Cl, 59Co, 151Eu and 153Euexist as minor constituents in all natural materials as
well as all manufactured or processed materials.Components of the Little Boy weapon used atHiroshima and the Fat Man weapon used at Nagasakifall into this latter category.
The neutron energy spectra emitted by the LittleBoy weapon detonated over Hiroshima and the FatMan weapon detonated over Nagasaki are remarkably
di�erent. This striking di�erence has been described indetail in the DS86 ®nal report and this di�erence isascribed to the massive steel casing that existed in the
Little Boy weapon (Whalen, 1987). The Little Boyweapon weighed about 5 tons, consisting chie¯y of athick steel casing surrounding a uranium core. Even
though 35Cl, 59Co, 151Eu and 153Eu exist only as minorconstituents in Little Boy components, the radioac-tivity of the 36Cl, 60Co, 152Eu and 154Eu radionuclidesproduced within Little Boy, i.e., in-situ production,
was orders of magnitude greater than that produced atthe surface of the Hiroshima site. Only a few percentof the neutrons produced by Little Boy could have
escaped to the atmosphere through the massive steelcasing. Moreover, the attenuation of neutrons throughthe intervening atmosphere between the epicenter of
the Little Boy burst and the surface of the Hiroshimasite is equally, if not more, signi®cant. As a conse-quence, only a very small fraction of the neutrons pro-duced by Little Boy could have reached the surface of
the Hiroshima site. Estimates for the in-situ productionof 36Cl, 60Co and 152Eu in Little Boy can be found inAppendix A.
2.2. Prompt fallout
The term fallout generally refers to the dispersal ofradioactivity from atomic detonations. Fallout fromatomic bombs is widely dispersed throughout the
earth's atmosphere. Environmental radiation measure-ments at the air±land interface attest to world widecontamination due to fallout. Consequently, fallout
invariably refers to the global dispersal of radioactivityfor extended time periods after a given atomic detona-tion. Meterological conditions, i.e., wind, rain, humid-
ity, atmospheric pressure . . .etc., e�ect the generalpattern and spatial distribution of fallout.In contrast to the usual meaning of fallout, the term
R. Gold / Radiation Measurements 30 (1999) 435±451 437

prompt fallout is introduced to describe the site-speci®c
deposition of radioactivity in a short time period after
the atomic burst. Prompt fallout arises in the time
domain between the atomic burst and the onset of
meteorological conditions that lead to the more wide-
spread dispersal of radioactivity and eventually global
fallout. The actual time period of prompt fallout is on
the order of an hour or so. A deposition function di(r )
can be introduced to describe the surface density,
nuclei/cm2, due to prompt fallout of the ith radio-
nuclide as a function of ground range, r. Clearly, di(r )
is a function of the complex hydrodynamics created by
the atomic bomb, which includes the early time-depen-
dent behavior of the ®reball and shock wave. In order
for Puzzle Piece No. 6 to be a signi®cant contributor
to the Hiroshima neutron dosimetry enigma, prompt
fallout need only be a small fraction of total fallout.
Fallout patterns observed at the Hiroshima and
Nagasaki sites have been described in the DS86 ®nal
report (Okajima et al., 1987; Okajima, 1987) and in
one post-DS86 publication (Shizuma et al., 1989).
Areas of concentrated fallout were created at both
sites, namely in the Koi-Takasu area about 3000 m
west of the hypocenter in Hiroshima and in the
Nishiyama area about 3000 m east of the hyocenter in
Nagasaki. These fallout patterns were measured with
electroscopes and ionization chambers several months
after the atomic detonation at both sites. Some years
later, measurements of 137Cs in soil samples provided
additional fallout data. Consequently, there is no
assurance that these observed fallout patterns can be
ascribed to prompt fallout. There is, however, one
interesting comment in the DS86 description of fallout
at Hiroshima and Nagasaki that bears upon prompt
fallout and merits a verbatim quote (Okajima et al.,
1987):
`Survivors reported a ``black rain'' in both cities
about one half-hour after the explosions. This rain
was carrying down soot and dirt from the explosion;
and presumably also radioactivity.'
In addition to the complex behavior of di(r ), one
must consider the retention of di�erent radionuclides
deposited on di�erent types of samples between the
time of deposition and the time of measurement, i.e.,
some 40 to 50 years later. Among the most frequently
used neutron dosimetry sample materials at the
Hiroshima site are concrete, steel, granite, roof tile and
wall tile. The retention factor for the ith radionuclide
deposited on the surface of the jth sample material, fij,
depends on the di�usion, migration and possible
chemical reactions of the ith radionuclide with the jth
sample surface. These processes depend, in turn, on
the material type, i.e., crystalline or amorphous; com-
position and porosity of the sample material; as well
as environmental variables such as temperature,humidity and atmospheric pressure. Moreover, these
environmental variables were not static during promptfallout, but possessed signi®cant time-dependence. Theharsh nature of these environmental conditions could
have produced considerable corrosion and pitting ofsample surfaces.
2.3. Synopsis
In summary, radioactivity observed in Hiroshima
site dosimetry samples can arise either directly fromneutron activation or indirectly from Puzzle Piece No.6, as described above. Since the measurement of thespeci®c activity of Hiroshima site dosimetry samples is
used to infer neutron ®eld characteristics, any radioac-tivity contributed by Puzzle Piece No. 6 can beregarded as an undesirable contamination that pro-
duces a background component of speci®c activity.The purpose of this treatise is to show that PuzzlePiece No. 6 provides a plausible explanation of the
Hiroshima neutron dosimetry enigma. From this pro-spective, detailed considerations of the complex beha-vior of both di(r ) and fij lie outside the scope of this
treatise.In addition to the factors introduced above to
describe Puzzle Piece No. 6, the resulting backgroundcomponent of speci®c activity depends sensitively upon
properties of the Hiroshima site neutron dosimetrysamples as well as processing procedures used to quan-tify the speci®c activity of these samples. Hence, the
numerical estimates of this background componentgiven in the next section depend on many parameters.Numerical values for some of these parameters are not
known at this time. For example, one of the more cru-cial unknown parameters is the composition of theLittle Boy steel casing (see Appendix A). Furthermore,a number of simplifying assumptions are used to
obtain these numerical estimates. As a consequence,the numerical estimates presented here can only beconsidered order of magnitude estimates. Since the
purpose of this exposition is to establish the plausi-bility of Puzzle Piece No. 6, order of magnitude esti-mates will su�ce.
3. Numerical estimates
3.1. Deposition and retention of prompt fallout
The sample surface density (radionuclei/cm2) atground range r, nij(r ), of the ith radionuclide on the
jth sample material at the time of the dosimetrymeasurement is given by
nij�r� � exp�ÿlit� fijdi�r�, �1�
R. Gold / Radiation Measurements 30 (1999) 435±451438

where li is the decay constant (secÿ1) of the ith radio-nuclide and t is the time interval (sec) between detona-
tion and measurement. As de®ned in Section 2.2above, di(r ) is the deposition surface density for the ithradionuclide and fij is the retention factor of the jth
sample material for the ith radionuclide. The totalnumber of radionuclei of the ith radionuclide depositedat the Hiroshima site, Di, is given by
Di � 2p�r00
di�r�r dr, �2�
where the ground range r0 de®nes the range over
which prompt fallout occurred. From the descriptionof fallout in the DS86 ®nal report, one can assumethat r0=3000 m for both the Hiroshima and Nagasaki
sites (Okajima et al., 1987).Since Pi is the total in-situ production of the ith
radionuclide from the Little Boy weapon, then
Ei � Di=Pi, �3�
is the fraction of the total production of the ith radio-nuclide that was deposited by prompt fallout at theHiroshima site.
Let nij and di be the average values of nij(r ) anddi(r ) over the range 0ErEr0, where prompt falloutoccurred. Using Eq. (1), one can write
nij � exp�ÿlit� fijdi: �4�
Since di=Di/(pr0)2, one has from Eq. (3)
di � Di
pr20� Eipi, �5a�
where
pi � Pi
pr20: �5b�
Using Eqs. (5a) in Eq. (4), one ®nds
nij � exp�ÿlit� fijEipi: �6�
While nij is the average surface density (radionuclei/cm2) of the ith radionuclide retained by the jth samplematerial at the time of the dosimetry measurement, thequantity pi is the maximum surface density (radionu-
clei/cm2) of the ith radionuclide that can be deposited.In the plausibility assessments presented below, quan-tities that depend linearly on the average values di and
nij will be used.Values for maximum possible surface density, pi,
have been obtained by using the in-situ production
estimates, Pi, from Appendix A in Eq. (5b). The resultsare shown in Table 1. The two di�erent values of pigiven in Table 1 correspond to the thermal neutron
and resonance integral neutron estimates provided inAppendix A.
3.2. Enrichment processing procedures for neutrondosimetry samples
Comparison between experiments and calculationsfor the Hiroshima site have been carried out in terms
of speci®c activity (Bq/mg) at the time of detonation.Hence this background component will be obtained inthe same speci®c activity units. Correcting Eq. (6) for
radionuclide decay, one ®nds the average backgroundsurface density, Bij, of radionuclei (radionuclide/cm2)at the time of detonation is given by
Bij � exp�lit�nij � gijpi, �7�
where
gij � fijEi: �8�
The most recent Hiroshima site neutron dosimetrymeasurements employed samples which were directly
exposed to A-bomb neutrons without any interveningshielding. Such dosimetry samples are called line-of-sight (LOS) samples (with respect to the epicenter of
the burst). Let As be the exposed surface area (cm2) ofthe LOS neutron dosimetry sample and Ei be therecovery e�ciency of the enrichment process used for
the ith radionuclide. Hence, the average number ofbackground nuclei, bij, of the ith radionuclide in theenriched sample at the time of detonation is given by
bij � EiAsBij � EiAsgijpi: �9�
Let me be the mass (g) of the enriched sample and mibe the weight fraction of the ith element in theenriched sample (in mg per g), then the average back-ground speci®c activity, cij, in the enriched sample (in
Bq/mg) at the time of detonation is
cij � �libij �=�mime� � �liEiAsgijpi �=�mime�: �10�
Table 1
Maximum possible surface deposition densities ( pi )
Maximum surface densitya
Radionuclide Thermal Resonance integral
36Cl 1.1E+10 6.7E+0960Co 5.6E+08 2.5E+09152Eu 1.2E+09 2.1E+09
a Surface density in number of radionuclei/cm2.
R. Gold / Radiation Measurements 30 (1999) 435±451 439
3.3. Plausibility criterion
If a large fraction of the total number of radionuclei
available (from in-situ production) is required to createa signi®cant background component, then this conjec-ture is not plausible. Conversely, if only a small frac-tion of the radionuclei available (from in-situ
production) is required to create a signi®cant back-ground component, then this conjecture is plausible. Interms of the average background surface density, Bij,
and the maximum possible surface density, pi, theplausibility criterion is simply
Bij � pi, �11�
or equivalently from Eq. (7)
gij � 1: �12�
Consequently, numerical estimates of gij can be used in
Eq. (12) to assess the plausibility of Puzzle Piece No.6.Note that an upper bound for Bij can be obtained
from Eq. (7) by setting gij=1. Consequently, denoting
UB(Bij ) as the upper bound of Bij, one can write
UB�Bij � � pi: �13�
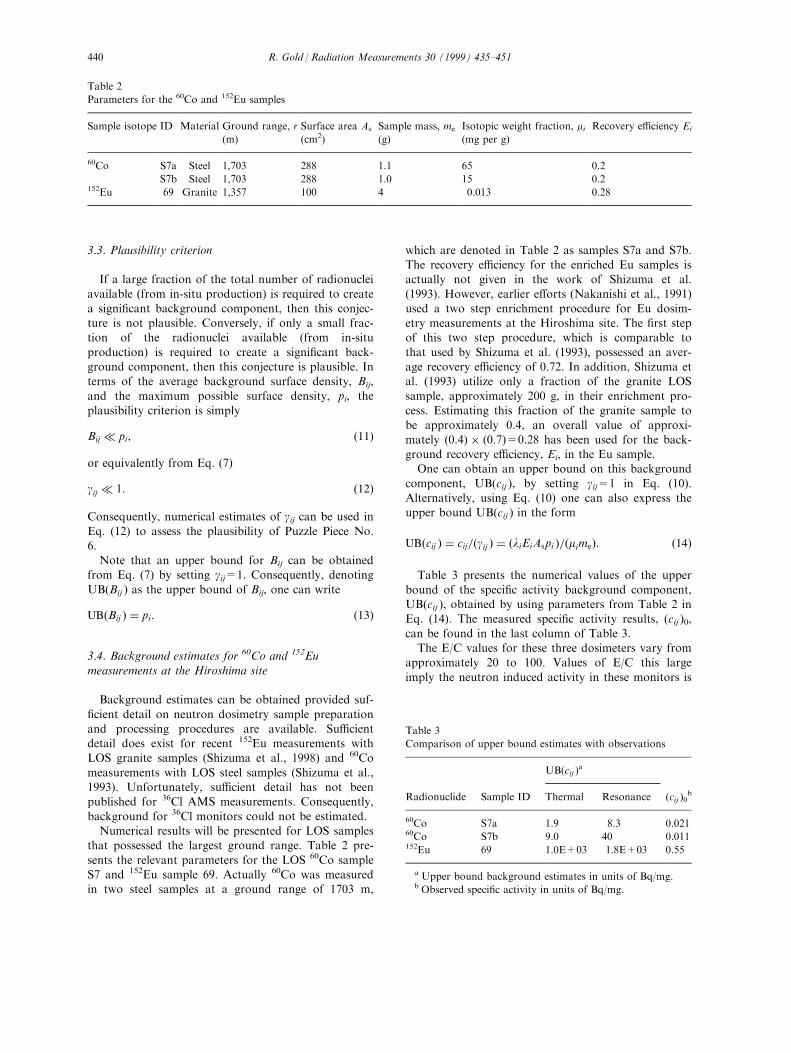
3.4. Background estimates for 60Co and 152Eu
measurements at the Hiroshima site
Background estimates can be obtained provided suf-
®cient detail on neutron dosimetry sample preparationand processing procedures are available. Su�cientdetail does exist for recent 152Eu measurements withLOS granite samples (Shizuma et al., 1998) and 60Co
measurements with LOS steel samples (Shizuma et al.,1993). Unfortunately, su�cient detail has not beenpublished for 36Cl AMS measurements. Consequently,
background for 36Cl monitors could not be estimated.Numerical results will be presented for LOS samples
that possessed the largest ground range. Table 2 pre-
sents the relevant parameters for the LOS 60Co sampleS7 and 152Eu sample 69. Actually 60Co was measuredin two steel samples at a ground range of 1703 m,
which are denoted in Table 2 as samples S7a and S7b.The recovery e�ciency for the enriched Eu samples isactually not given in the work of Shizuma et al.
(1993). However, earlier e�orts (Nakanishi et al., 1991)used a two step enrichment procedure for Eu dosim-etry measurements at the Hiroshima site. The ®rst stepof this two step procedure, which is comparable to
that used by Shizuma et al. (1993), possessed an aver-age recovery e�ciency of 0.72. In addition, Shizuma etal. (1993) utilize only a fraction of the granite LOS
sample, approximately 200 g, in their enrichment pro-cess. Estimating this fraction of the granite sample tobe approximately 0.4, an overall value of approxi-
mately (0.4) � (0.7)=0.28 has been used for the back-ground recovery e�ciency, Ei, in the Eu sample.One can obtain an upper bound on this background
component, UB(cij ), by setting gij=1 in Eq. (10).Alternatively, using Eq. (10) one can also express theupper bound UB(cij ) in the form
UB�cij � � cij=�gij � � �liEiAspi �=�mime�: �14�
Table 3 presents the numerical values of the upper
bound of the speci®c activity background component,UB(cij ), obtained by using parameters from Table 2 inEq. (14). The measured speci®c activity results, (cij )0,
can be found in the last column of Table 3.The E/C values for these three dosimeters vary from
approximately 20 to 100. Values of E/C this large
imply the neutron induced activity in these monitors is
Table 2
Parameters for the 60Co and 152Eu samples
Sample isotope ID Material Ground range, r
(m)
Surface area As
(cm2)
Sample mass, me
(g)
Isotopic weight fraction, mi(mg per g)
Recovery e�ciency Ei
60Co S7a Steel 1,703 288 1.1 65 0.2
S7b Steel 1,703 288 1.0 15 0.2152Eu 69 Granite 1,357 100 4 0.013 0.28
Table 3
Comparison of upper bound estimates with observations
UB(cij )a
Radionuclide Sample ID Thermal Resonance (cij )0b
60Co S7a 1.9 8.3 0.02160Co S7b 9.0 40 0.011152Eu 69 1.0E+03 1.8E+03 0.55
a Upper bound background estimates in units of Bq/mg.b Observed speci®c activity in units of Bq/mg.
R. Gold / Radiation Measurements 30 (1999) 435±451440

negligible compared to the background component.Under these conditions, the experimental results aredominated by the background component, so that one
can write
�cij �0 � cij: �15�
Using Eq. (15) in Eq. (14), one ®nds
gij � �cij �0=UB�cij �: �16�
Estimates of gij obtained from Eq. (16) are shown in
Table 4. All the estimates of gij given in Table 4 arevery small. As a consequence, the plausibility criteriongiven by Eq. (12) is satis®ed for all cases of interest.
4. Comparison of 60Co measurements at the Hiroshima
site
In this section, it is shown that Puzzle Piece No. 6provides a qualitative explanation of behavior patterns
that arise from comparing di�erent 60Co measurementsat the Hiroshima site. In Fig. 1, the most recent 60Comeasurements of Shizuma et al. (1998) with LOS steel
samples are compared with earlier 60Co measurementsthat employed di�erent types of steel and iron samplesas well as di�erent experimental techniques for quanti-
fying 60Co speci®c activity. Hashizume et al. (1967)and Kawamura et al. (1967) used samples from ironreinforcing bars (rebars) that were imbedded withinconcrete structures as well as iron rings from rooftops,
whereas Kimura et al. (1990) and Kerr et al. (1990)used LOS steel samples obtained from a handrail atthe top of a smoke stack and from the top of a bridge.
The solid curve and dashed curve shown in Fig. 1 areseparate least squares ®ts of the results of Shizuma etal. (1998) and earlier results, respectively.
To obtain these least squares ®ts, the dependence ofE/C on slant range, s, was assumed to be
ln�E=C� � a� bs, �17�
where a and b are constants determined by the least
squares analysis. No physical signi®cance should beattached to the relation between E/C and s assumed inEq. (17). These least squares curves have been gener-
ated to provide trends in the behavior of E/C results,which are useful in comparing results from di�erenttypes of steel and iron samples as well as from di�er-
ent experimental techniques used in the measurementof speci®c activity. In particular, comparison of trendsin E/C results in the region se800 m are especiallygermane to Puzzle Piece No. 6. Examination of Fig. 1
in this slant range region reveals a distinct di�erencebetween the E/C results of Shizuma et al. (1998) andthe E/C results of earlier work. Since the dosimetry
samples utilized by Shizuma et al. (1998) were exclu-sively LOS samples, this comparison provides furthercon®rmation of the plausibility of Puzzle Piece No. 6.
4.1. Subset comparisons
To further investigate the apparent di�erence dis-
played in Fig. 1, comparisons between the E/C resultsof Shizuma et al. (1998) and subsets of earlier workare instructive. Comparisons based on subsets that uti-
lize di�erent types of steel or iron samples or compari-sons of methods that employed di�erent sampleprocessing procedures would be of particular utility in
assessing Puzzle Piece No. 6. The earlier work used inthe comparison of Fig. 1 is comprised of three distinctsubsets corresponding to three di�erent types of
Table 4
Estimated values of gij
Sample E/C gij
Radionuclide Material ID Thermal Resonance
60Co Steel S7a 95 1.1Eÿ02 2.5Eÿ0360Co Steel S7b 50 1.2Eÿ03 2.8Eÿ04152Eu Granite 69 20 5.5Eÿ04 3.1Eÿ04
Fig. 1. Comparison of the slant range dependence of E/C for60Co measurements showing the systematic variations that
arise from the use of di�erent methods to quantify speci®c ac-
tivity as well as from the application of di�erent types of do-
simetry samples. The solid line is a least squares ®t of the
results of Shizuma et al. (1998) and the dashed curve is a least
squares ®t of earlier results (see text).
R. Gold / Radiation Measurements 30 (1999) 435±451 441

samples. Earlier measurements of Hashizume et al.(1967) and Kawamura et al. (1967) can be partitioned
into two subjects, namely the rebar and ring subsets.Earlier measurements of Kimura et al. (1990) and Kerret al. (1990) comprise the LOS subset.
It can not be assumed that samples from the ringsubset are LOS samples. Indeed, the uncertainty in the
location, orientation and application of these ringsamples has been emphasized by Hashizume (1983).Hence, the ring subset will not be used for further
comparisons.Since the rebar subset consists of samples that were
imbedded within concrete structures at the Hiroshimasite, one would expect the background from PuzzlePiece No. 6 to be signi®cantly reduced, if not elimi-
nated from these samples. Hence, the existenceof a distinct di�erence between the rebar results
and the LOS results of Shizuma et al. (1998)would lend additional credence to Puzzle PieceNo. 6.
For the LOS subset of 60Co measurements, Kimuraet al. (1990) and Kerr et al. (1990) used LOS steelsamples of the same origin, but included in the sample
preparation procedure initial cleaning steps that werenot utilized by Shizuma et al. (1998). These LOS steel
samples were obtained from a handrail at the top of a
smoke stack at s 1 880 m and from the top of a
bridge at s 1 1410 m. To remove paint and rust, Kerr
et al. (1990) sand blasted the surface of the LOS steel
samples and then etched the samples in a warm 3 M
HCl solution to remove surface contamination.
Kimura et al. (1990) burned the paint o� the LOS
steel samples and then etched the samples in a hot 3 M
HCl solution to remove residual surface contami-
nation. As a consequence of these cleaning procedures,
one would expect the background due to Puzzle Piece
No. 6 to be signi®cantly reduced. Hence if Puzzle Piece
No. 6 is plausible, then a comparison of the results of
Kimura et al. (1990) and Kerr et al. (1990) with the
results of Shizuma et al. (1998) should reveal a distinct
di�erence.
In Fig. 2, the E/C results of Shizuma et al. (1998)
are compared with the rebar and LOS subsets. Fig. 2
reveals a distinct di�erence between the E/C results of
Shizuma et al. (1998) and E/C results of the rebar
and LOS subsets. The di�erence in E/C results
observed in Fig. 2 is similar to the di�erence in E/C
results observed in Fig. 1. In fact, the dashed least
squares trend curves in Figs. 1 and 2 are virtually
identical.
These two ®gures reveal that the recent results of
Shizuma et al. (1998) render the characteristic feature
F6 of the Hiroshima neutron dosimetry enigma non
sequitur. Inclusion of the more recent results of
Shizuma et al. (1998) provides an E/C dependence on
slant range for the 60Co results that is now consistent
with the E/C slant range behavior observed for both152Eu and 36Cl. Without the more recent results of
Shizuma et al. (1998), Figs. 1 and 2 reveal that the
slant range dependence of the E/C results for 60Co
were dominated by the subset of results consisting of
the rebar data from Hashizume et al. (1967) and
Kawamura et al. (1967) and the LOS data of Kimura
et al. (1990) and Kerr et al. (1990). Based on the
data that existed at that time, it is understandable
that characteristic feature F6 was advanced by
Straume et al. (1992) and con®rmed by Shizuma et al.
(1993).
The contrasting behavior of the E/C results from
Shizuma et al. (1998) and the E/C results of this subset
of earlier work is even of greater signi®cance for
Puzzle Piece No. 6. Fig. 2 demonstrates that the E/C
results of Shizuma et al. (1998) increase much more
rapidly with increasing s than the E/C results of the
subset. Hence in the slant range beyond s 1 1100 m,
the E/C values of Shizuma et al. (1998) are much
larger than the E/C values of the subset. Given that
this subset is comprised of results from rebar samples
and LOS samples whose surfaces were subjected
to extensive cleaning, these comparisons provide
Fig. 2. Comparison of the slant range dependence of E/C for60Co measurements showing the systematic variations that
arise from the use of di�erent methods to quantify speci®c ac-
tivity as well as from the application of di�erent types of do-
simetry samples. The solid line is a least squares ®t of the
results of Shizuma et al. (1998) and the dashed curve is a least
squares ®t of earlier results consisting of the rebar results of
Hashizume et al. (1967) and Kawamura et al. (1967) and the
LOS results of Kimura et al. (1990) and Kerr et al. (1990)
(see text).
R. Gold / Radiation Measurements 30 (1999) 435±451442

further con®rmation of the plausibility of Puzzle PieceNo. 6.
Additional inferences can be advanced based on thecomparison given in Fig. 2. It must be stressed, how-ever, that these additional inferences are more specu-
lative. In some cases the subsets that are comparedcontain fewer data points, especially in the slant rangeregion of interest, i.e., se800 m. Under these con-
ditions, trends identi®ed between such subsets couldeither possess physical signi®cance or be the randomstatistical consequence of comparing a limited number
of data points that possess signi®cant uncertainty.
4.1.1. Inference 1The comparison in Fig. 2 suggests the existence of
two background components. The dominant back-
ground component can be attributed to Puzzle PieceNo. 6, since the E/C values of Shizuma et al. (1998)are signi®cantly greater than the E/C values of the sub-set in the range se1,400 m. One candidate for the
smaller background component is environmental neu-trons (EN), which has already been considered (Gold,1995a) and will be further elaborated upon in Section
5.4 below.
4.1.2. Inference 2Examination of Fig. 2 reveals that the E/C rebar
results are consistently larger than the E/C results for
the LOS samples. This systematic di�erence impliesthat the rebar samples have retained a larger fractionof the surface deposition density than the LOS samples
which have been subjected to the extensive cleaningprocedures of Kimura et al. (1990) and Kerr et al.(1990), i.e., the retained surface deposition density nij islarger for these rebar samples than for these LOS
samples. The systematic di�erence between the E/Cresults for the rebar and LOS samples also implies thatthis subset still possesses a non-negligible background
component from Puzzle Piece No. 6.Additional support for this inference is provided by
the E/C results from the LOS sample measurements of
Kimura et al. (1990) and Kerr et al. (1990). For thehandrail sample at s 1 880 m, the measurement ofKimura et al. (1990) is in excellent agreement with themeasurement of Kerr et al. (1990) (see Fig. 2). In this
regard, it must be stressed that the agreement betweenthese two experimental results was attained using inde-pendent methods to measure 60Co speci®c activity in
these LOS samples. Kimura et al. (1990) used a chemi-cal enrichment procedure, whereas Kerr et al. (1990)counted the LOS samples directly.
Samples from the bridge at s 1 1410 m providedthree E/C results based on one measurement ofKimura et al. (1990) and two measurements of Kerr et
al. (1990). Kimura et al. (1990) used a LOS samplefrom the bridge, whereas the two bridge samples used
by Kerr et al. (1990) were not actually LOS samples.The two bridge samples used by Kerr et al. (1990)were designated the C plate and the D plate.
Another signi®cant di�erence arose between thenon-LOS C and D plate samples of Kerr et al. (1990)and the LOS sample of Kimura et al. (1990). During
preparation for counting, Kerr et al. (1990) discoveredthe C plate was inadvertently contaminated. Toremove this contamination, the surfaces of the C
plate were dressed by machining. Tables in thereport of Kerr et al. (1990) imply that the surfacesof the D plate were also dressed by machining.Hence, two reasons can be used to explain the large
di�erence between the E/C values of the C and Dplates, namely:
1. The C and D plates were non-LOS samples of
di�erent orientation.2. The process of machine dressing could have pro-
duced a di�erent reduction in the surface deposition
density, nij, of the C and D plates.
On the basis of these two reasons, one would expectthe E/C values of the C and D plates to be bounded
from above by the E/C result from the LOS bridgesample used by Kimura et al. (1990). Examination ofFig. 2 not only con®rms this expectation, but implies
that the LOS bridge sample used by Kimura et al.(1990) still possesses a background component due toPuzzle Piece No. 6. Since the E/C results for the rebarsamples are systematically higher than the E/C values
of the LOS samples of Kimura et al. (1990), one canalso infer that the rebar results still possess a back-ground component due to Puzzle Piece No. 6.
5. Recommendations
The small values of gij shown in Table 4 establishthe plausibility of Puzzle Piece No. 6. The negligiblebackground contributions near the hypocenter esti-
mated in Appendix B supply further credence for thisconjecture. Comparisons of di�erent 60Co measure-ments carried out in Section 4 above also lend ad-ditional credence to this conjecture. While these factors
provide credence for Puzzle Piece No. 6, it must beemphasized that only plausibility has been established.The current lack of data make it impossible to conclus-
ively con®rm or refute this conjecture. Consequently,to investigate and more quantitatively evaluate thisconjecture, a number of recommendations are
advanced below.Puzzle Piece No. 6 can also be qualitatively
appraised in terms of the six principal features intro-
R. Gold / Radiation Measurements 30 (1999) 435±451 443

duced to characterize the Hiroshima neutron dosimetryenigma (see Section 1). While it is clear that this con-
jecture accounts for principal features F2±F6, an ade-quate assessment of principal feature F1 is notpossible in this regard. Based on the signi®cant di�er-
ence in neutron source terms (Whalen, 1987), onemight expect that in-situ radioisotope production wasconsiderably greater in Little Boy than Fat Man.
However, limited knowledge of Fat Man character-istics as well as limitations in presently availableNagasaki site data preclude an adequate assessment
of the ability of this conjecture to account for princi-pal feature F1. Sections 5.1.1. and 5.2.2. below pro-vide further elaboration and recommendations fordata needed to reach a proper assessment with regard
to principal feature F1.
5.1. Neutron dosimetry measurements with 36Cl, 60Coand 152Eu
Some obvious consequences of this conjecture canbe tested by application of the advanced neutron do-simetry methods developed for 36Cl, 60Co and 152Eu.To obtain critical evaluations of this conjecture, the
three di�erent experimental investigations describedbelow should employ LOS samples from the regionse1000 m.
5.1.1. Nagasaki site measurements
The existence of a background component due toPuzzle Piece No. 6 at the Nagasaki site should beexplored. Currently available dosimetry data at the
Nagasaki site is too limited to permit such an investi-gation. Measurements with advanced 36Cl, 60Co and152Eu dosimetry methods should be carried out at theNagasaki site. These measurements should employ
both LOS and non-LOS dosimetry samples of thesame type at the same ground range locations. Use ofthese re®ned dosimetry methods at the Nagasaki site
should provide data necessary to assess the existenceof a background component due to Puzzle Piece No. 6at the Nagasaki site.
5.1.2. Spatial distribution measurements at theHiroshima site
At the Hiroshima site, the spatial distribution ofspeci®c activity should be investigated with thesere®ned dosimetry methods. In obtaining the numerical
estimates above, it was tacitly assumed that the depo-sition distribution of the ith radionuclide depends onlyon ground range, r. Realistically, one would expect the
deposition to also exhibit angular variation about thehypocenter, i.e., di=di(r, y ), where y is the polar angleabout the hypocenter. Hence, the spatial variation of
the speci®c activity should be examined to determineany contribution due to a prompt fallout pattern. Both
the r and y dependence of speci®c activity measure-ments should be investigated. In particular, any devi-ation of the r and y dependence from symmetry could
imply a non-negligible contribution from in-situ pro-duction of the 36Cl, 60Co and 152Eu radionuclides inLittle Boy subsequently followed by prompt fallout,
i.e., a prompt fallout pattern.
5.1.3. Depth pro®le measurements at the Hiroshima siteAt Hiroshima and Nagasaki, depth pro®le distri-
butions have been obtained by measuring 152Euspeci®c activity in rock, concrete and granite (Hasai et
al., 1987; Okajima and Miyajima, 1987; Sakanoue etal., 1987). Unfortunately, these depth pro®le measure-ments were conducted close to the hypocenter, i.e.,
s 1 600 m, and possessed a spatial resolution of only afew centimeters.Background created by in-situ production and
prompt fallout from Little Boy can be expected todecrease rapidly with increasing depth from the surfaceof LOS dosimetry samples. Hence to adequately evalu-ate this conjecture, depth pro®le distributions of
speci®c activity within a few centimeters of the exposedsurface of LOS samples collected from the regionse1000 m are required. To meet this requirement, one
must measure the depth pro®le of speci®c activity with®ne spatial resolution. Unfortunately, enrichment pro-cedures that are employed in the advanced techniques
developed for 60Co and 152Eu monitors requiresamples of signi®cant size from the region se1000 m.The sample size requirements of these enrichment pro-
cedures preclude attaining depth pro®le data of accep-table spatial resolution.Measurements of 36Cl using the advanced AMS
technique possess greater sensitivity. Hence, the appli-
cability of the 36Cl AMS method for measuring therequired depth pro®le distributions should be investi-gated. In fact, the procedure developed for AMS 36Cl
monitors normally includes depth pro®le measurementsof concrete cores (Straume, 1998). Unfortunately thesedepth pro®le data have not been published, so the
spatial resolution a�orded by this method can not beassessed.Another possible approach to attaining depth pro®le
distributions of ®ne spatial resolution is suggested by
the discussion of the E/C results for 60Co given inSection 4 above. One can include in the sample prep-aration procedures a method for removing surface ma-
terial from the sample, such as chemical etching ormachining. At this point one has three alternatives,namely the speci®c activity can be measured in: (1) the
sample; or (2) the removed surface material; or (3)both the sample and the removed surface material.Assuming the background due to Puzzle Piece No. 6 is
R. Gold / Radiation Measurements 30 (1999) 435±451444

the dominant component of speci®c activity, measure-ment of the removed surface material would be advan-
tageous. Under these conditions, the uncertainty dueto counting statistics would be signi®cantly decreasedfor the removed surface material in comparison to that
of the sample. Repeating this procedure, by successiveremoval of surface material, could provide depth pro-®le data of ®ner spatial resolution.
If the requirement of ®ne spatial resolution can notbe met, then one can resort to comparisons betweenLOS samples of di�erent spatial orientation or com-
parisons between the exposed surface of LOS samplesand the unexposed surface of LOS samples.Comparisons between LOS samples and non-LOSsamples, e.g., imbedded samples, could also be utilized.
Such comparisons must naturally utilize the samesample material and be collected from the same lo-cation (in the region se1000 m).
In any event, comparison of observations fromdi�erent sample types are complex and calculationsmay be required to help interpret the results. Indeed,
the depth dependence of speci®c activity may possessthree non-negligible components. In addition to thedesired foreground contribution from neutron induced
activation in the sample, which will be spatially depen-dent, there exist two background components that pos-sess di�erent spatial variation. The backgroundcomponent created by in-situ production and prompt
fallout from Little Boy can be expected to decreaserapidly with increasing depth from the exposed surfaceof the LOS sample. In sharp contrast, environmental
neutrons (EN) produce a background component thatincreases rapidly with increasing depth from theexposed surface of the LOS sample. Recommendations
for the treatment of this EN background componentare considered in Section 5.4 below.
5.2. Production estimates
The production estimates obtained in Appendix A
are admittedly crude. Ways to improve these pro-duction estimates are considered here.
5.2.1. Composition of the Little Boy steel casingOf all the parameters needed to estimate this conjec-
ture, the least well known are the abundances of Cl,Co and Eu in the Little Boy steel casing. If any archive
steel characterizing the Little Boy steel casing exists, itshould be used to quantitatively determine the abun-dance of minor constituents. In absence of archive ma-
terial, the best one can do is to substitute comparablesteel from the same foundry and era for abundance de-terminations. While the abundances of Cl, Co and Eu
would have highest priority, abundances of other con-stituents should also be quanti®ed. Other minor con-stituents could have existed in the Little Boy steel
casing, which could be used for `a posteriori' measure-ments in the region se1000 m at the Hiroshima site
and thereby furnish additional data for the evaluationof this conjecture.
5.2.2. CalculationsProduction estimates in Appendix A were obtained
assuming spherical symmetry as well as a di�usion the-ory form for the radial variation of the ¯uence in theLittle Boy steel casing. Improved characterization of
the constituents of the Little Boy steel casing wouldjustify more rigorous calculations of radionuclide pro-duction using present day multi-group computer codes.
These calculations should be based on the exact ma-terial composition and geometrical con®guration avail-able from Little Boy speci®cations.Currently available data do not permit in-situ pro-
duction of radioisotopes to be estimated for the FatMan weapon detonated over Nagasaki. In-situ pro-duction estimates for Little Boy were based on power
normalization experiments in the Little Boy replica(see Appendix A). Comparable power normalizationdata for Fat Man do not exist, because no critical
assembly replica of Fat Man has ever been assembled.Consequently, in-situ production estimates from theFat Man weapon should be calculated using the exact
material composition and geometrical con®gurationavailable from Fat Man speci®cations. These calcu-lations together with the dosimetry measurements rec-ommended in Section 5.1.1 above should provide for
an adequate assessment of the ability of Puzzle PieceNo. 6 to satisfy principal feature F1.
5.2.3. 63Ni AMS measurementsA method of `a posteriori' neutron dosimetry based
on AMS measurements of the fast neutron reaction63Cu(n, p)63Ni is being developed by Straume et al.(1998). In addition to the fast neutron reaction of63Cu, 63Ni is also produced by neutron absorption in62Ni. The isotopic fraction of 62Ni, which exists innature, is approximately 0.036 and the thermal neutron
capture cross section of 62Ni is approximately 15 b.Since Cu and Ni are minor constituents in most steels,the in-situ production of 63Ni in the Little Boy steelcasing is likely to have been signi®cant. Consequently,
AMS measurements of 63Ni could also furnish ad-ditional data for the evaluation of Puzzle Piece No. 6.Both the 63Cu(n, p)63Ni and 62Ni(n, g )63Ni reactions
would have to be taken into account for the proper in-terpretation of the 63Ni AMS data.
5.3. Solid State Track Recorder (SSTR) neutrondosimetry at the Hiroshima site
Fission tracks observed in selected SSTR specimensfrom the Hiroshima site can only arise from neutron
R. Gold / Radiation Measurements 30 (1999) 435±451 445

induced ®ssion or spontaneous ®ssion. Fission tracks
in SSTR from spontaneous ®ssion arise from the natu-
ral uranium impurity in all SSTR materials. The fall-
out of uranium from Little Boy could, in principle,
produce ®ssion tracks at the exposed surfaces of SSTR
specimens. However, estimates of this background con-
tribution show that it is completely negligible. As a
consequence, in-situ production and prompt fallout of
radioactivity will have essentially no e�ect on the ®s-
sion track densities observed in suitable SSTR speci-
mens from the Hiroshima site. Hence, SSTR neutron
dosimetry could provide critical data for the evaluation
of Puzzle Piece No. 6.
The applicability of SSTR neutron dosimetry for
Hiroshima and Nagasaki has been reviewed (Gold,
1995b). On the basis of this review, it was concluded
that suitable SSTR specimens could provide reason-
ably accurate thermal ¯uence data out to a ground
range of approximately 1200 m. However, it was also
concluded that SSTR neutron dosimetry at the
Hiroshima site would be a formidable endeavour. Not
only would it be di�cult to secure suitable SSTR spe-
cimens, but many critical requirements were identi®ed
that must be satis®ed in order to assure that the SSTR
data possessed acceptable uncertainty. In spite of these
overall di�culties, it is recommended that SSTR neu-
tron dosimetry be pursued at the Hiroshima site
because it can furnish critical data for the evaluation
of this conjecture that are independent of radiometric
and AMS neutron dosimetry results.
Fig. 3. Spatial variation of the EN thermal neutron energy
group, 0.025±0.215 eV, at the air±land interface. The negative
half-space is air and the positive half-space is either dry soil,
wet soil 25% or water. The plot for water represents the EN
spatial variation at the air±water interface.
Fig. 4. Spatial variation of the EN epi-thermal neutron energy
group, 0.215±0.465 eV, at the air±land interface. The negative
half-space is air and the positive half-space is either dry soil,
wet soil 25% or water. The plot for water represents the EN
spatial variation at the air±water interface.
Fig. 5. Spatial variation of the EN fast neutron energy group,
2.5±4.5 MeV, at the air±land interface. The negative half-
space is air and the positive half-space is either dry soil, wet
soil 25% or water. The plot for water represents the EN
spatial variation at the air±water interface.
R. Gold / Radiation Measurements 30 (1999) 435±451446

5.4. Measurement of environmental neutrons (EN) atthe Hiroshima site
Neutrons are a component of the mixed radiation
®eld that exists in the natural environment.Environmental neutrons (EN) are produced by cosmic-ray interactions in the atmosphere and in the earth as
well as by (a, n) reactions in the earth's curst. In earlieranalyses, EN were considered as Puzzle Piece No. 5(Gold, 1994, 1995a). In these analyses, the background
component induced by EN was estimated for 60Co,152Eu, 154Eu and 36Cl monitors at the Hiroshima site.
These background estimates possess large uncertaintiesbecause EN intensity can vary widely at the air±landinterface.
To provide a better understanding of the EN back-ground component, Figs. 3±5 present the calculated
spatial variation for di�erent energy groups of the ENspectrum at the air±land interface. The energy groupspresented in Figs. 3±5 are a thermal or slow neutron
energy group: 0.025±0.215 eV, an epi-thermal energygroup: 0.215±0.465 eV and a fast energy group: 2.5±4.0 MeV, respectively. These ®gures are based on SN
multi-group computer calculations carried out sometime ago (Kastner et al., 1970).
It is clear that the behavior of EN intensity at theair±land interface is very complex. EN spatial intensityat the air±land interface varies very rapidly and
depends sensitively on both neutron energy and watercontent (hydrogen) in the soil. To further emphasize
the sensitive dependence on hydrogen content, thebehavior of EN intensity at the air±water interface hasalso been included in these ®gures. The behavior of the
EN thermal neutron group, as shown in Fig. 3, couldhave a signi®cant bearing on the Hiroshima neutrondosimetry enigma. The rapid increase of the EN ther-
mal neutron energy group at the air±land interface cre-ates a background component of speci®c activity that
increases with increasing depth from the exposed sur-faces of LOS dosimetry samples. This is exactly theopposite behavior of the background component due
to in-situ production and prompt fallout, which isexpected to decrease rapidly with increasing depth
from the exposed surface of LOS dosimetry samples.Hence, comparison of neutron dosimetry results fromdi�erent samples in the region se1000 m, as rec-
ommended in Sections 5.1 and 5.2 above, must becarefully conducted and interpreted.
Rather than continue to be plagued with the largeuncertainty in the EN background component, whichcould be very signi®cant in the region se1000 m, a
more accurate assessment of EN background is necess-ary at the Hiroshima site. It is therefore recommendedthat experiments be conducted to quantify the EN
component of the natural radiation ®eld at theHiroshima site. These EN experiments should cover
the slant range region: 580EsE2000 m. Emphasisshould be placed on locations previously used for do-
simetry measurements at the Hiroshima site in theregion se1000 m. At these locations, the depth pro®leof EN intensity should be measured with ®ne spatial
resolution in the same sample materials that were pre-viously used for Hiroshima site neutron dosimetry.
6. Conclusions
The plausibility of Puzzle Piece No. 6 is establishedby the small estimates of gij in Table 4. Decreasing theabundances of Cl, Co and Eu used for these estimates
(see Table A1 of Appendix A) by a factor of six (tothe abundances that exist in the earth's crust) wouldincrease the gij estimates by a factor of six, but would
still not change this conclusion. Introducing slowlyvarying deposition models, rather than the averagevalues used here, would again not alter this conclusion.
For example, if one assumes that the deposition den-sity, di(r ), decreases linearly by a factor of two overthe range from the hypocenter at r = 0 out tor=r0=3000 m, then one can show that over in the
same range, gij will only vary by approximately 30%from the gij value corresponding to the average depo-sition density. Comparisons of E/C results for 60Co
measurements at the Hiroshima site lend further cre-dence to this conjecture. In addition, background esti-mates due to Puzzle Piece No. 6 near the hypocenter
are negligible (see Appendix B).Of the experiments recommended above, those ex-
periments that must be carried out with samples from
the Hiroshima and Nagasaki sites are the most formid-able. This degree of e�ort for Hiroshima and Nagasakisite experiments is not unexpected. Indeed, in theseHiroshima and Nagasaki site experiments, low level
counting methods must be implemented in order tosearch for extremely small e�ects. However for theselow level counting experiments to succeed, these extre-
mely small e�ects must not only be detected, but mustbe adequately quanti®ed in order to properly evaluatethis conjecture.
The outcome of these e�orts would provide a touchof irony, should this conjecture prove to be the domi-nant cause of the Hiroshima neutron dosimetryenigma. Such an outcome would signify that both cal-
culations and experiments are substantially correct.Calculations would be predicting the speci®c activitycreated by neutron absorption in Hiroshima site
samples correctly. Experiments would be measuringthe existing speci®c activity correctly. However, thetacit assumption that neutron absorption in Hiroshima
site dosimetry samples is responsible for all the speci®cactivity observed in samples collected from the regionse1000 m would be incorrect.
R. Gold / Radiation Measurements 30 (1999) 435±451 447

Acknowledgements
The author is indebted to William E. Loewe for a
review of these e�orts, which has been helpful in clari-fying certain aspects of this exposition.
Appendix A. Radionuclide production from Little Boy
It will be assumed that the in-situ production of36Cl, 60Co, 152Eu and 154Eu in the Little Boy weaponarose in the massive steel casing of the weapon.Radioisotope production in all other components of
Little Boy will be ignored. Some of the relevant par-ameters of 35Cl, 59Co and 151Eu needed for in-situ pro-duction estimates are given in Table A1. The
parameters in Table A1 are well established except forthe elemental abundance of Cl, Co and Eu in theLittle Boy steel casing.
Elemental abundances of Cl, Co and Eu in steel arenot generally speci®ed in handbooks and referencebooks on the properties of steel. Because of theabsence of any general knowledge and the lack of any
detailed knowledge on the composition of the steel cas-ing of Little Boy, the abundance of Co in steel wasobtained from recent dosimetry e�orts with steel
samples from the Hiroshima site. Cobalt abundance ineleven steel samples can be inferred from the e�orts ofShizuma et al. (1998). The Co abundances in these
samples vary from approximately 4 to 300 parts permillion (ppm) by weight. Omitting three outliers, theaverage of the remaining eight samples is approxi-mately 130 ppm. This average value was used as the
Co abundance in the Little Boy steel casing. Kimura etal. (1990) report Co abundances of 111 ppm and 190ppm for two steel samples from the Hiroshima site.
These results imply that the value of 130 ppm is areasonable assumption for the Co abundance in theLittle Boy steel casing.
Abundances of Cl and Eu in the Little Boy steel cas-ing have been obtained from this average Co value. Inorder to obtain estimates for Cl and Eu abundances in
the Little Boy steel casing, the relative abundance ofCl and Eu to that of Co in the earth's crust was usedto scale the average 130 ppm value for Co. The abun-
dance results are presented in Table A1.To simplify calculation of in-situ radioisotope pro-
duction, Little Boy is assumed to possess spherical
symmetry. On the basis of this assumption, the pro-duction, Pi, of the ith radionuclide (in total number ofradionuclei produced) is given by
Pi � siMri
�F�t� dv, �A1�
where F(t ) is the neutron ¯uence (n/cm2) at radial lo-cation t in the steel casing, si is the activation crosssection (in cm2), M is the density of the Little Boy
steel casing (g/cm3) and ri is the isotopic atom density(g/cm3). Because certain aspects of the Little Boyweapon may still be classi®ed, actual details of these
production calculations will not be described. Instead,an outline form of these calculations is presented.The radial variation of the ¯uence in the Little Boy
steel casing was assumed to be given by the di�usion
theory form
F�t� � �k=t� exp�ÿat�, �A2�
where the constant k is determined from the ¯uence atthe inner surface of the steel casing and a value of0.145 cmÿ1 was used for the attenuation coe�cient a.
Table A1
Radioisotope production parameters
Isotope Isotope fraction Elemental abundancea (ppm) Thermal cross sectionb (b) Resonance integralc (b) Isotopic density (atoms/g)
35Cl 0.7577 314 1800 44 12.4 2.3E+1959Co 1.000 23 130 38 78 1.3E+18153Eu 0.479 1.1 6.3 8800 7320d 1.2E+16
a The values on the left are abundances in the earth's crust (Handbook of Chemistry and Physics, 1998). The values on the right
are inferred values used for the Little Boy steel casing (see text). Abundance units are parts per million (ppm) by weight.b Neutron Cross Sections (1995).c Reactor Physics Constants (1963).d Calculated value.
Table A2
In-situ radionuclide production in Little Boy
Productiona
Radionuclide Thermal Resonance integral
36Cl 3.1E+21 1.9E+2160Co 1.6E+20 7.0E+20152Eu 3.3E+20 5.8E+20
a Production in total number of radionuclei.
R. Gold / Radiation Measurements 30 (1999) 435±451448

This value of a was obtained from neutron dosimetry
e�orts in Light Water Reactor (LWR) pressure vessel(PV) surveillance (Gold and McElroy, 1987).Using thermal neutron cross sections as well as res-
onance integral data, two estimates of the production,Pi have been obtained. The thermal neutron estimateassumes that production is created predominantly byneutrons with energies less than approximately 0.5 eV
and the contribution from higher energy neutrons isnegligible. The resonance integral estimate assumesthat production is created predominantly by epi-ther-
mal neutrons with energies greater than approximately0.5 eV and the contribution of lower energy neutronsis negligible. In contrast with multi-group computer
codes used in present day neutron transport analyses,these assumptions are admittedly crude. Nevertheless,these assumptions will provide the order of magnitude
estimates required to establish credibility.To determine the constant k, estimates of the ther-
mal and resonance integral ¯uence at the inner surfaceof the steel casing were obtained from ®ssion rate
power normalization experiments in the Little Boyreplica with Solid State Truck Recorders (SSTR)(Gold et al., 1989). The radioisotope production in the
Little Boy steel casing Pi estimated on this basis for36Cl, 60Co and 152Eu are given in Table A2.
Appendix B. Background estimates near the hypocenter
Using the results of background estimates given inSection 3 together with the rapid ground range depen-dence of the thermal ¯uence, one would expect that
background estimates near the hypocenter to be negli-
gible. One can use 60Co and 152Eu measurements nearthe hypocenter to examine this expectation. Thespeci®c monitors selected near the hypocenter are
sample 15 for 152Eu (Shizuma et al., 1993) and sampleS1 for 60Co (Shizuma et al., 1998). The relevant par-ameters for these two samples are summarized inTable B1.
Using the parameters from Table B1 in Eq. (10) ofSection 3, one can obtain numerical background esti-mates, cij, for these monitors near the hypocenter.
These background estimates, cij, are compared withobservations, (cij )0, in Table B2. There are two back-ground estimates for the 60Co monitor near the hypo-
center, which correspond to the two values of gijobtained from the two 60Co samples S7a and S7b. Theresults for all cases in Table B2 con®rm that the back-
ground due to Puzzle Piece No. 6 near the hypocenteris considerably less than experimental uncertainty andtherefore completely negligible.
References
Gold, R., 1994. The DS86 neutron dosimetry enigma: some
missing pieces to the puzzle. In: Proc. of the Eighth
ASTM-EURATOM Symposium on Reactor Dosimetry,
Vail, Colorado, August 29±September 3, 1993, ASTM
STP 1228, pp. 751±760.
Gold, R., 1995a. The DS86 neutron dosimetry enigma: an
analysis of some missing pieces to the puzzle. Radiat.
Meas. 24, 9±29.
Gold, R., 1995b. Critical requirements for `a posteriori' track
recorder neutron dosimetry at Hiroshima and Nagasaki.
Radiat. Meas. 24, 31±42.
Gold, R., McElroy, W.N., 1987. Radiation-induced embrittle-
ment in light water reactor pressure vessels. Nucl. Engr.
and Design 104, 155±174.
Gold, R., Roberts, J.H., Preston, C.C., 1989. Little-Boy
replica power normalization. 34th Annual Meeting of the
Health Physics Society, June 25±29, 1989, Albuquerque
(special issue). Health Phys. 56, 547.
Handbook of Chemistry and Physics, CRC Press, Cleveland,
Ohio. Current edition.
Hasai, H., Iwatani, K., Shizuma, K., Hoshi, M., Kosako, T.,
Morishima, Y., 1987. 152Eu depth pro®le of stone bridge
pillar exposed to the Hiroshima atomic bomb. In: US±
Japan Joint Reassessment of Atomic Bomb Radiation
Table B1
Parameters for the 60Co and 152Eu samples near the hypocenter
Isotope ID Sample material Ground range, r
(m)
Surface area, As
(cm2)
Sample mass, me
(g)
Isotopic weight fraction, mi(mg per g)
Recovery e�ciency Ei
60Co S1 Steel 163 204 0.94 9.9 0.2152Eu 15 Granite 145 100 4 0.0167 0.28
Table B2
Comparison of background estimates with observations near
the hypocenter
Radionuclide Sample ID pi gij cija (cij )0
b
60Co S1 6.2E+06 0.11 9.9620.5560Co S1 6.9E+05 0.013 9.9620.55152Eu 15 6.2E+05 0.43 10728
a Background estimates in units of Bq/mg.b Observed speci®c activity in units of Bq/mg.
R. Gold / Radiation Measurements 30 (1999) 435±451 449

Dosimetry in Hiroshima and Nagasaki, Final Report, Vol.
2. Radiation E�ects Research Foundation, 5±2 Hijiyama
Park, Minami-ku, Hiroshima, 732, Japan, Chapter 5,
Appendix 13.
Hashizume, T., 1983. Present plans for dose reassessment ex-
periments by the Japanese. In: US±Japan Workshop for
Reassessment of Atomic Bomb Radiation Dosimetry in
Hiroshima and Nagasaki, 16±17 February, Nagasaki.
Radiation E�ects Research Foundation, 5±2 Hijiyama
Park, Minami-ku, Hiroshima, 732, Japan, pp. 7±12.
Hashizume, T., Maruyama, T., Shiragi, A., Tanaka, E.,
Izawa, M., Kawamura, S., Nagaoka, S., 1967. Estimation
of air dose from atomic bombs in Hiroshima and
Nagasaki. Health Phys. 13, 149±161.
Hoshi, M., Yokoro, K., Sawada, S., Shizuma, K., Iwatani,
K., Hasai, H., Oka, T., Morishima, H., Brenner, D.J.,
1989. Europium-152 activity induced by Hiroshima atomic
bomb neutrons. Health Phys. 57, 831±837.
Kastner, J., Oltman, B.G., Feige, Y., Gold, R., Congel, F.,
1970. Nuclear radiation detection for the natural environ-
ment. IEEE Trans. Nucl. Sci. NS (17), 144±150.
Kaul, D.C., Woolson, W.A., Egbert, S.D., Straume, T., 1994.
A brief summary of comparisons between the DS86 A-
Bomb survivor dosimetry system and in-situ measurements
in light of new measurements, revised nuclear data and
improved calculational methods. In: Eighth International
Conference on Radiation Shielding, April 24±28, 1994,
Arlington, Texas. American Nuclear Society, Lagrange
Park, Ill.
Kawamura, S., Izawa, M., Maruyama, T., Tanake, E.,
Hashizume, T., 1967. Determination of 60Co to Co ratio
for the estimation of fast neutron dose from the atomic
bombs in Hiroshima and Nagasaki. Health Phys. 13, 801±
806.
Kerr, G.D., Pace, J.V. III, Mendelsohn, E., Loewe, W.E.,
Kaul, D.C., Dolastshahi, F., Egbert, S.D., Gritzner, M.,
Scott, W.H. Jr, Marcum, J., Kosako, T., Kanda, K., 1987.
Transport of initial radiations in air over ground. In: US±
Japan Joint Reassessment of Atomic Bomb Radiation
Dosimetry in Hiroshima and Nagasaki, Final Report, Vol.
1, 3. Radiation E�ects Research Foundation, 5±2
Hijiyama Park, Minami-ku, Hiroshima, 732, Japan,.
Kerr, G.D., Dyer, F.F., Pace, J.V. III, Brodzinski, R.L.,
Marcum, J., 1990. Activation of Cobalt by neutrons from
the Hiroshima bomb. ORNL-6590.
Kimura, T., Takano, N., Iba, T., Fujita, S., Watanabe, T.,
Maruyama, T., Hamada, T., 1990. Determination of
speci®c activity in cobalt (60Co/Co) in steel samples
exposed to the atomic bomb in Hiroshima. J. Radiat. Res.
31, 207±213.
Loewe, W.E., Mendelsohn, E., Hamada, T., Maruyama, T.,
Okajima, S., Pace, J.V. III, Sakanoue, M., Kondo, S.,
Hashizume, T., Marcum, J., Woolson, W.A., 1987.
Measurements of neutron ¯uences. In: US±Japan Joint
Reassessment of Atomic Bomb Radiation Dosimetry in
Hiroshima and Nagasaki, Final Report, Vol. 1, 5.
Radiation E�ects Research Foundation, 5±2 Hijiyama
Park, Minami-ku, Hiroshima, 732, Japan.
Nakanishi, T., Ohtani, T., Mizuochi, R., Miyaji, K.,
Yamamoto, T., Kobayashi, K., Imanaka, T., 1991.
Residual neutron-induced radioactivities in samples
exposed to the nuclear explosion over Hiroshima: compari-
son of the measured values with the calculated values. J.
Radiat. Res. Suppl. 32, 69±82.
Neutron, Cross Sections 1965 BNL-325, Second Edition,
Suppl. No. 2, Vol III.
Okajima, S., 1987. Exposure of Nishiyama residents in
Nagasaki to radioactive fallout. In: US±Japan Joint
Reassessment of Atomic Bomb Radiation Dosimetry in
Hiroshima and Nagasaki, Final Report, Vol. 2. Radiation
E�ects Research Foundation, 5±2 Hijiyama Park,
Minami-ku, Hiroshima, 732, Japan, Chapter 6, Appendix
1.
Okajima, S., Miyajima, J., 1987. Quantitative measurement of
the depth distribution of 152Eu activity in rocks exposed to
the Nagasaki atomic bomb. In: US±Japan Joint
Reassessment of Atomic Bomb Radiation Dosimetry in
Hiroshima and Nagasaki, Final Report, Vol. 2. Radiation
E�ects Research Foundation, 5±2 Hijiyama Park,
Minami-ku, Hiroshima, 732, Japan, Chapter 5, Appendix
6.
Okajima, S., Fujita, S., Harley, J.H., 1987. Radiation doses
from residual radioactivity. In: US±Japan Joint
Reassessment of Atomic Bomb Radiation Dosimetry in
Hiroshima and Nagasaki, Final Report, Vol. 1. Radiation
E�ects Research Foundation, 5±2 Hijiyama Park,
Minami-ku, Hiroshima, 732, Japan, Chapter 6.
Reactor, Physics Constants 1963 Second Edition, ANL-5800.
Roesch, W.C. (Ed.), 1987. US±Japan Joint Reassessment of
Atomic Bomb Radiation Dosimetry in Hiroshima and
Nagasaki, Final Report, Vols. 1 and 2. Radiation E�ects
Research Foundation, 5±2 Hijiyama Park, Minami-ku,
Hiroshima, 732, Japan.
Sakanoue, M., Tan, K.L., Komura, K., 1987. In situ measure-
ment and depth pro®le of residual 152Eu activity induced
by neutrons from the atomic bomb in Hiroshima. Chapter
5, Appendix 7. In: US±Japan Joint Reassessment of
Atomic Bomb Radiation Dosimetry in Hiroshima and
Nagasaki, Final Report, Vol. 2. Radiation E�ects
Research Foundation, 5±2 Hijiyama Park, Minami-ku,
Hiroshima, 732, Japan.
Shizuma, K., Iwatani, K., Hasai, H., Hoshi, M., 1989.
Fallout in the hypocenter area of the Hiroshima atomic
bomb. Health Phys. 57, 1013±1016.
Shizuma, K., Iwatani, K., Hasai, H., Hoshi, M., Oka, T.,
Morishima, H., 1993. Residual 152Eu and 60Co activities
induced by neutrons from the Hiroshima atomic bomb.
Health Phys. 65, 272±282.
Shizuma, K., Iwatani, K., Hasai, H., Oka, T., Endo, S.,
Takada, J., Hoshi, M., Fujita, S., Watanabe, T., Imanaka,
T., 1998. 60Co activity in steel samples exposed to the
Hiroshima atomic-bomb neutrons. Health Phys. 75, 278±
284.
Straume, T., 1996. Risk implications of the neutron discre-
pancy in the Hiroshima DS86 dosimetry system. Radiation
Protection Dosimetry 67, 9±12.
Straume, T., 1998. New techniques developed to quantify
Hiroshima neutron ¯uence. Health Phys. 26 Newsletter,
Walchuk, M. Assoc. Ed.
Straume, T., Finkel, R.C., Eddy, D., Kubik, P.W., Gove,
H.E., Sharma, P., Fujita, S., Hoshi, M., 1990. Use of
R. Gold / Radiation Measurements 30 (1999) 435±451450

accelerator mass spectroscopy in the dosimetry of
Hiroshima neutrons. Nucl. Instr. and Meth. B52, 522±566.
Straume, T., Egbert, S.D., Woolson, W.A., Finkel, R.C.,
Kubik, P.W., Gove, H.E., Sharma, P., Hoshi, M., 1992.
Neutron discrepancies in the DS86 Hiroshima dosimetry
system. Health Phys. 63, 421±426.
Whalen, P.P., 1987. Calculation and Veri®cation of Source
Terms. In: US±Japan Joint Reassessment of Atomic
Bomb Radiation Dosimetry in Hiroshima and Nagasaki,
Final Report, Vol. 2, 2. Radiation E�ects Research
Foundation, 5±2 Hijiyama Park, Minami-ku, Hiroshima,
732, Japan.
R. Gold / Radiation Measurements 30 (1999) 435±451 451