the history of health care costs and health insurance: a wisconsin
TRANSCRIPT
Republished with permission.
Originally published by the Wisconsin Policy Research Institute, Inc. in October 2006
THE HISTORY OF HEALTH CARE COSTS AND
HEALTH INSURANCEby: Linda Gorman, Ph.d.
Executive Summary .......................................................................................................................................... 1
Introduction ...................................................................................................................................................... 3
Legislating Amess: Government Intervention And The Early History Of The Health Care Payments System ........................................................................................................... 3
Health Insurance Replaces Sickness Payments ............................................................................................... 6
The Medicare And Medicaid Entitlement: Unintended Consequences Structured By Politicians For Politicians ...................................................................................................... 10
Rand Health Experiment: Expanding Out-ofpocket Payments Reduces Expenditures With No Measurable Effect On Average Health ...........................................................................................11
Spending Takes Off; Out-of-pocket Costs Decline .....................................................................................12
Spending Growth In Other Industrialized Countries Outpaces That In U.s. ............................................14
Higher American Spending Produces Better Health Care ..........................................................................15
Health Policy Experts Embrace Centralized Control In An Effort To Control Costs .............................18
The Search For Quality Measures To Replace Consumers .......................................................................... 21
The Promise Of Consumer-directed Care ....................................................................................................23
Summary .........................................................................................................................................................26
Notes ................................................................................................................................................................28

EXECUTIVE SUMMARY
Locked into an eighty-year-old model that prescribes central planning for every aspect of the U.S. health system,America’s system of delivering health care has lost sight of the important role that consumers play in controllinghealth system costs and quality. Real world experiments suggest that people who pay for their own care cut utiliza-tion by 10% to 30% with no discernable effect on health. Saving even 10% of Wisconsin’s 2002-2003 health carespending would have saved $260 million.
But how did this happen? How did the Wisconsin health care consumer become a passive cog in a very expen-sive machine? Interestingly, the answer has its roots in the Great Depression when health care consumers weredivorced from decisions about spending on their health.
Hospitals, hit hard by the Great Depression, rushed to embrace plans for prepaid health care as a way to survive.In 1939 the American Hospital Association began allowing plans that met its standards to use the Blue Cross nameand logo. State legislatures agreed not to treat Blue Cross plans as insurance, based on the rationale that they wereowned by hospitals. This permitted Blue Cross plans to operate as non-profit corporations, escaping the 2% to 3%premiums generally charged private insurance companies, and exempted them from insurance company reserverequirements.
Worried that the hospitals would expand the Blue Cross concept into physician services, physicians began think-ing about their own organization. By 1946 all of the prepaid physician services plans had affiliated and becameknown as Blue Shield.
Since the primary concern of the early Blue Cross and Blue Shield plans was to ensure that hospitals and physi-cians were paid, the plans covered all costs, and everyone in the same geographic area paid the same price. Thisencouraged patients and their doctors to use medical care without worrying about costs.
By 1945 Blue Cross had captured 59% of the health insurance market. The idea of prepaid health insurance wassolidified on the American landscape in 1954, when the Internal Revenue Code codified the deductibility of healthinsurance payments. The employer deduction significantly reduced the cost of health insurance for consumers eligi-ble for an employer-provided group plan.
The federal government cast the Blue Cross Blue Shield approach in regulatory concrete in 1965 when Congresspassed the Medicare and Medicaid programs. Medicare copied the Blue Cross Blue Shield pay-as-you-go approachto health insurance and applied it to almost all Americans over 65. Ironically, at the time, relatively few people wereexpected to benefit, since for men born in 1950 life expectancy was only 66 years. For women it was 71.7 years. Aslife expectancy has grown, so too has spending on the two government programs.
Unable to impassively watch as health care spending spiraled upward, federal health care planners imposed anarmada of regulations on the manner in which health care was provided to Medicare and Medicaid patients. The reg-ulatory binge in U.S. health care since the 1970s has produced nearly 50 kinds of federal and state health services’regulations, which by 2002 was costing roughly $340 billion, about 20% of total health spending of $1,560 billion.
More promising recent reforms emphasize a return to consumer-directed health spending in which consumerswho spend less on their health benefit directly. Health Savings Accounts made their debut in 2002. Early results fromemployers offering these and less consumer-friendly arrangements suggest that people spending their own moneyspend less, have fewer hospital admissions and emergency room visits, and are more meticulous in their use of pre-scription drugs. As Health Savings Account balances will likely build up rapidly for the majority of people who arein good health, they also provide hope for the fiscal Titanic that is Medicare.
In 2002, the State of Colorado turned conventional wisdom on its head with a pilot program that allowed about146 severely disabled Medicaid patients to use state funds to hire and fire their own home health aides. Averagemonthly spending dropped by 21%. Care was better and patients split the savings 50/50 with the state, allowing themto buy needed equipment like voice-activated telephones.
1

Two clear choices face those who would shape future U.S. health care policy. Continuing to follow old habits oflayered regulation, third party payment, and increasing government control will continue the current cost spiral andthe recent deterioration in patient care. To protect a bankrupt Medicare program, government involvement will beextended into every nook and cranny of U.S. medical care. The regulatory overload will end private medicine andencourage those who can afford it to purchase their health care abroad.
The other choice is to deregulate, returning insurance to its traditional role as protection against bankruptcy andpromoting savings to pay for the higher health expenses that generally accompany old age. Let consumers spend theirown money on health care, free of interference from professors with statistical studies and bureaucrats with specificnotions of how people ought to behave. This is the choice that has the potential to stop the cost spiral, lower costs,and provide better health care for all Americans.
2

INTRODUCTION
For the last 100 years, a health care regulatory project enthusiastically endorsed by generations of health policyexperts has been encrusting U.S. health care with layer upon layer of increasingly intrusive regulation. Though eachregulation may be innocuous in its own right, taken together they have had the unfortunate effect of divorcing patientsfrom spending on their health, creating explosive growth in Wisconsin’s Medicaid budget, and making Wisconsin’smarket for hospital services one of the least competitive in the United States.
In hindsight, the regulatory program had had three major achievements. It has excluded consumers from healthcare decisions, consistently moving the power to make decisions about the shape and substance of health care andhealth care financing from individuals to central planners. It has increased the number of health services that indi-viduals could receive and have paid for by other people’s money. Finally, it has perpetuated and refined a paymentsystem that was originally intended to protect hospital incomes during the Great Depression. With the addition ofprice controls, that system now threatens to afflict Americans with the same health services problems that plagueCanada, Britain, New Zealand, and the European systems.
With its focus on cost and third party payment, the regulatory program has also managed to shift the publicdebate. The historical focus on caring for an individual patient has been subsumed in discussions of pricing, cost con-trol, and the merits of using a variety of delivery systems for expanding the third party payments system to an ever-increasing fraction of the population, legal or not. The collateral damage has been high. People have lost sight of theimportant role that involved consumers spending their own money play in controlling system costs and quality. Theyalso have scant appreciation for the fact that the private health care delivery system that evolved in the United Stateswas unique in its ability to produce superior health care at lower cost for all income levels.
The regulations removing consumers from direct decisions about health care expenditures have contributed a greatdeal to Wisconsin’s exploding health care costs. The good news is that judicious deregulation has the potential to putconsumers back in charge Doing this requires a clear understanding how injudicious regulation has short-circuited nor-mal market mechanisms for controlling expenditure, and an appreciation for the enormous benefits to be gained frommeaningful consumer involvement. This paper examines why the reforms of the regulatory project backfired, whymany current proposals have the potential to do the same, and why the new initiatives in consumer-directed care havesuch promise.
LEGISLATING A MESS:GOVERNMENT INTERVENTION AND THE EARLY HISTORY OF THE HEALTH CARE PAYMENTS SYSTEM
Those alarmed at current health care costs and nostalgic for those of times gone by generally fail to appreciatethat policy makers in the 1920s considered health care too costly and were concerned that the majority of Americanhouseholds lacked access to it.
As late as 1910, “the cost of health care treatment was considered a minor problem compared to the loss of wagesdue to sickness for most workers.”1 In the early 1900s, patients either lived or died. Care was largely limited to pre-venting disease by keeping clean, recommending good diets, providing good nursing, performing basic surgery, andpraying for a rapid recovery.
Although Semmelweis had demonstrated the importance of hand washing as early as 1847, and Lister had shownthat properly used antiseptics could cut post-operative mortality for amputations to 15% from 46% by 1867, medicalprogress of direct benefit to patients proceeded at a measured pace at the end of the 1800s.2 With the exception ofsmallpox, vaccines against diseases caused by viruses were not developed until after World War II.
The most dramatic medical advance in the 1920s occurred when Banting, Best, and Macleod converted diabetesfrom a death sentence to a treatable condition by discovering the active ingredient in insulin at the University ofToronto in 1921.3 Unfortunately, they were unable to produce large quantities of it. In 1922, scientists at Eli Lillyformed “the first long-term, large-scale case of biomedical collaborative research between a North American uni-versity and a pharmaceutical firm,” in an effort to produce insulin in reliable quantities.4 Lilly finally succeeded in1923 after its chief chemist, George Walden, developed a new method of isoelectric precipitation in late 1922.5
3

The Health Care Cost Spiral of the 1920s
For most of the 1800s, hospitals had been a place where the chronically ill and indigent received charitable carebecause they had no family capable of shouldering the burden. Those who could afford it received care at home. Butas the importance of asepsis began to be appreciated, surgical and acute care patients were more likely to be treatedin hospitals designed to facilitate antiseptic conditions. Hospitals began charging for the use of their facilities.
During the transition, medical bills began absorbing significant amounts of family income. Hospital costs rosefrom 7.6% of total family medical bills in 1918, to 13% in 1929.6 According to the Historical Statistics of the UnitedStates, average annual earnings in all industries and occupations in 1926 were $1,473 when farm labor was excluded.Thomasson reports that surveys of medical care expenditures from 1929 show that U.S. urban families, with above-average annual incomes of $2,000 to $3,000 that had no expenses for hospitalization, spent an average of $67 a year,2% to 3% of income, on medical care. With hospitalization, the average was $261, 8% to 13% of annual income.7
According to Ross, by 1934 “hospital bills and physicians’ bills for inpatient services had grown further to 40%of total family medical cost. These rising costs alarmed leaders in medicine, labor, and government. The discussionof health insurance was reborn.”8
Comparing the health care costs of modern families with those borne by people in the early 1900s helps put themodern health care cost discussion in perspective. Table 1 shows the percentage of family income spent on healthcare for various periods since 1917. As a fraction of total actual expenditures, health care costs grew until 1960 andthen declined. By the late 1980s they were a lower fraction of a family budget than they were in 1917-1919. Thesefigures do not include expenditures for employer-provided health insurance.
Data from the 2002 Consumer Expenditure Survey suggest that out-of-pocket spending is still below levels pre-vailing in the middle of the century. In 2002, married husband and wife families in the United States earned an aver-age of $72,720 before taxes. Members of this group are generally healthy and covered by group insurance purchased
from their employers withpretax payments. As a group,they spent an annual averageof $2,676 on health care,about 4% of income beforetaxes.9
These spending data arein accord with data from theMedical Expenditure PanelSurvey. Average out-of-pock-et spending for modernAmericans, the amountroughly equivalent toexpenses for the 1929 family,averaged $1,308 per family.This ranges from 3.6% offamily income at the bottomof the middle income catego-
ry to less than 2% of family income at the top, less than half of the amount paid for a comparable family in 1929.10
Early Expert Recommendations to Control Costs
Then as now, rising health care costs were the subject of active public debate. Proposals to solve the problemabounded. It is striking how little the reform recommendations of physicians groups, academics, and governmentbureaucrats have changed between the early 1900s and the early 2000s. Despite revolutions in economics that haveled to a far deeper understanding of the essential role that prices and profit play in delivering consumer value, reduc-ing costs, and encouraging innovation, and to an unveiling of the potential for self-interested behavior on the part of
4
TABLE 1 SHARES OF FAMILY CONSUMPTION (FOR AN URBAN FAMILY WITH ONE
WAGE EARNER) USING ACTUAL EXPENDITURES, IN PERCENT.
Component 1917-19 1950 1960-61 1972-73 1986-87
Food 41.1 32.5 26.0 22.6 19.4
Housing 26.8 26.0 29.2 29.3 33.7
Transportation 3.1 13.8 15.1 24.1 25.7
Clothing 17.6 11.6 10.3 8.4 5.2
Health care 4.7 5.1 6.6 4.7 4.0
Other 6.7 11.0 12.8 10.9 12.0
SOURCE: Eva Jacobs and Stephanie Shipp, “How family spending haschanged in the U.S.,” Monthly Labor Review, March 1990, pp. 20-27 cited in David S.Johnson, John M. Rogers and Lucilla Tan. May 2001. “A Century of Family Budgets inthe United States,” Monthly Labor Review, online editionhttp://www.bls.gov/opub/mlr/2001/05/art3full.pdf (accessed November 13, 2005), p.32.

non-profit groups like government, health policy experts still recommend the same non-market reforms that werepopular at the beginning of the last century.
Following the lead of the European countries that had created tax-supported, government-run health careschemes, the Progressive party included national health insurance for the United States in its party platform in 1912.World War I and public opposition defeated the measure at the national level. By 1915, the drive for national insur-ance had shifted to the states. The American Association for Labor Legislation drafted a model state medical careinsurance bill, and introduced it in sixteen states. Unlike modern proposals, the model insurance created by theAssociation was a blend of health insurance and disability. It would have covered both health care costs and two-thirds of lost wages for 26 weeks.11
At the 1926 American Medical Association (AMA) national convention, “15 frustrated delegates decided toinvestigate, and attempt to solve, the organizational problems leading to the rising costs of medical care.”12 Concernwas high. In 1927, “the inability of the people to pay the cost of modern scientific medicine” was the first item onthe agenda at the AMA convention. A committee of the AMA produced the first estimate of national health carespending, about 4% of national income or $3.66 billion in 1929.13
The committee’s final recommendations reflect the economic zeitgeist of the times, an era suffused with pro-gressive reformers, socialists, trade unionists, and admirers of Bismarkian social insurance schemes, all unified intheir devotion to decidedly murky forms of egalitarian social justice, and their conviction that central planning couldcure most human ills. Scant attention was paid to the benefits of competition or to the harm that would follow whenself-interested government agencies and non-profit organizations gained control of the legislative machinery dictat-ing the practice and delivery of health care.
In the committee’s final report, the majority opinion concluded that “even among the highest income group,insufficient care is the rule, and [that] the basic solution to this problem was to increase the proportion of nationalresources going to medicine.”14 Although it opposed compulsory health insurance, the majority opinion came downon the side of prescriptions that were decidedly group-oriented. The contemporary New York Times headline informedreaders that “Socialized Medicine Is Urged in Survey.”15
Then as now, comprehensive medical services were to be reorganized for delivery “largely by organized groupsof practitioners, organized preferably around hospitals, encouraging high standards, and preserving personal relations.”Scant consideration was given to the nitty-gritty details of how such a scheme would actually operate in practice.
Both the American Medical Association and Dr. William J. Mayo, one of the founders of the Mayo Clinic, weremembers of the minority on the committee. Dr. Mayo’s disagreement is especially interesting. By 1929, a number ofgroup practices, including the Mayo Clinic, had achieved national reputations. It was one of the largest group prac-tices in the nation. Employing nearly 400 doctors and dentists and a thousand other clinicians, it was just the sort oforganized group practice that the members of the majority had in mind when they recommended that care be deliv-ered via organized groups affiliated with hospitals. Other large group practices that presumably fit the majority modelat the time were the Cleveland Clinic, founded in 1891; the Marshfield Clinic, founded in 1916; the MenningerClinic, founded in Topeka, Kansas in 1919; and the Lahey Clinic, founded in Boston in 1925.
As has so often been the case in the past two decades, the committee recommended radical reforms in servicedelivery based on what were said to be good results achieved by a relatively small number of current practitioners.At the time, group practices were the exception. According to Stewart, “various national surveys identified one hun-dred fifty to three hundred group practices (depending on definition), with an average group size of six to elevenphysicians.”16 Assuming eleven physicians per practice, this means that approximately 3,300 of the nation’s rough-ly 154,000 physicians were in practices of the type the committee thought should become the main delivery vehiclefor medical care in the United States.
At the time the committee’s recommendations were finalized, the American Medical Association had alreadyspent almost two decades methodically raising educational requirements for physicians. It had succeeded in tighten-ing licensing requirements as a part of its efforts to raise professional standards. Those activities almost certainly con-tributed to the health care cost spiral in the early 1900s. Then as now, the ironic result was that by requiring creden-tials that may or may not have had any consumer benefit, a committee convened to reduce costs almost certainlyended up increasing them.
5

Centralized Solutions Ignore Consumers, Empower Producers.
After its founding in 1847, the American Medical Association had a number of unsuccessful programs to raisepayments to orthodox physicians. Its successful effort to raise member income began at the turn of the century andincluded both a membership drive and a push for legislatively-enacted professional standards. Members werepromised smoother access to hospital privileges, protection from malpractice litigation, and the benefits of organizedcounty medical societies. The new formula worked. Between 1900 and 1925, membership increased from less than10% of U.S. medical practitioners to almost 50%.
Bolstered by its new grassroots support, the AMA campaigned to encourage state legislatures to set standards formedical education and physician licensing. As is always the case when a trade association seeks to limit entry intoits business or profession, the benefits of higher professional standards come with increased costs. As consumers mayneither want nor need higher-quality services, there is no guarantee that requiring them will improve consumer wel-fare.
The standards effort had began in earnest in 1906 when the AMA had its Council on Medical Education inspectthe nation’s medical schools. It determined that more than half of them were deficient. To add weight to the AMAfindings, the respected Carnegie Foundation commissioned Abraham Flexner to evaluate American medical schools.Enormously influential, the Flexner report helped convince legislators in a number of states that only graduates ofClass A medical schools were fit to be licensed as medical doctors. It also succeeded in convincing state governmentsthat the certification of medical schools should be delegated to the AMA.
With the AMA in charge of certifying both medical schools and the standards for licensing physicians, the num-ber of medical schools fell from 162 in 1906 to 85 in 1919. The schools that survived were generally associated withhospitals and universities.
As training requirements became increasingly arduous and expensive, the number of physicians per capita in theUnited States declined from 157 per 100,000 in 1900 to 125 per 100,000 in 1930.17 The AMA was successful in con-trolling the number of U.S. training slots for physicians for the rest of the century.
HEALTH INSURANCE REPLACES SICKNESS PAYMENTS
While the health care community and academics searched for a single insurance plan for delivering health care,the absence of regulation left individual Americans free to solve the problem on their own. They proceeded to do so,aided in the effort by a number of medical entrepreneurs.
In spite of the price increases, most people still paid for medical care out of their own pockets. Estimated healthexpenditures in 1929 were $3,649 million. Of that, consumers paid $2,937 million, public sources paid $495 million,and philanthropy paid $217 million.
Employer plans covered only a tiny minority of people. Most sickness insurance was provided by mutual bene-fit associations unrelated to work—fraternal societies like the Loyal Order of Moose, the Knights and Ladies ofSecurity, the Ladies of the Maccabees, and the Société Française de Bienfaisance Mutuelle, which built SanFrancisco’s French Hospital in 1852. According to Stewart, there were thousands of fraternal societies operating inNew York’s Lower East Side at the beginning of the 1900s. Existing for the benefit of their members and offeringbenefits that were not contingent on employment, many of the societies “employed or contracted with physicians tocare for dues-paying members for as little as $1 to $2 per year per member. In some eastern and southern cities, athird to a half of some ethnic groups depended on these organizations for medical care. In New Orleans 88% of theentire population was said to be covered by some form of prepaid ‘contract medicine,’ also known as ‘lodge medi-cine’ by 1888.”18
Historian David Beito estimates that in 1910 at least one-third of adult males belonged to fraternal societies thatprovided nearly every service of the modern welfare state “including orphanages, hospitals, job exchanges, homesfor the elderly, and scholarship programs.”19 Fraternal societies had a number of competitors including “commercial-group plans, government workmen’s compensation programs, trade unions and industrial unions, company-spon-sored mutual benefit societies, and other fraternal orders that provided life insurance or non-stipulated (discretionary)relief.”20
6

The fact is that the fraternal societies knew their members gave them an advantage in issuing disability and sick-ness insurance. Lodges had home visiting committees that helped uncover false claims and one or two week waitingperiods requiring members applying for aid to shoulder some of the financial load. Unlike many of the public pro-posals, the societies also had behavioral requirements that made life less attractive while receiving payments. Emeryreports that fraternal groups could require that “members receiving benefits could not drink or gamble and in somecases were not allowed to be away from their residence after dark.”
The voluntary payment arrangements epitomized by the fraternal societies came under attack at the turn of thecentury. By 1910 the medical societies developed as a part of the American Medical Association’s effort to organizephysicians had begun pressuring licensing authorities to deny licenses to doctors who accepted lodge contracts.Hospitals were also pressured to “close their doors to fraternal members who used ‘lodge doctors.’”
A broader form of prepaid employer-provided hospital care appeared at the end of the 1920s when a group ofDallas teachers arranged for Baylor hospital to provide 21 days of hospitalization to its members in return for a $6.00annual payment. As described by Melissa Thomasson of Miami University, “the Baylor insurance was developed asa way to ensure that people paid their bills. One official connected with the plan compared hospital bills to cosmet-ics, noting that the nation’s cosmetic bill was actually more than the nation’s hospital bill, but that ‘We spend a dol-lar or so at a time for cosmetics and do not notice the high cost. The ribbon counter clerk can pay 50¢, 75¢, or $1 amonth, yet . . . it would take about twenty years to set aside a large hospital bill.”21
By attaching sickness insurance to the workplace, the Baylor plan automatically selected for healthier people. Itsmembers had to be well enough to work. In 1929, Donald Ross and H. Clifford Loos contracted with the Los AngelesDepartment of Water and Power to provide prepaid comprehensive health care to its employees and their dependents.By the mid-1930s other employee associations had joined, and the plan covered 37,000 people.
States Protect Hospitals With Laws Favoring Blue Cross
Hospitals hit hard by the Great Depression wanted to make sure they were paid and rushed to embrace plans forprepaid health care. As the banks failed, Americans tightened their belts. According to Paul Starr, “in just one yearafter the crash [of 1929], average hospital receipts per person fell from $236.12 to $59.26.”22 Though public hospi-tals that accepted charity care filled 89% of their beds, by 1931 private hospitals were reduced to 62% occupancy.23
Hospitals had facilities to support and staff to pay whether patients used their facilities or not. They knew that pre-paid health plans could benefit them by producing a steady cash flow. The American Hospital Association (AHA),began to market prepaid hospitalization plans as something that also benefited patients by “relieving [them] . . . fromfinancial embarrassment, and even from disaster in the emergency of sickness, those who are in receipt of limitedincomes.”24
Because prepaid plans run by single hospitals generated competition among hospitals, “community hospitalsbegan to organize with each other to offer network hospital coverage reducing inter-hospital competition. These planseventually combined under the auspices of the American Hospital Association, which in 1939 adopted the Blue Crossname and logo as the national symbol for plans that met its requirements.”25 Member hospitals began offering dis-counts to Blue Cross plans in the 1930s.
As had been the case with physicians, state legislatures were more than willing to let the American HospitalAssociation set the terms under which hospital health insurance would operate. It was perceived that Blue Cross planswere not insurance because they were owned by hospitals; states exempted them from normal insurance companyrequirements. They were allowed to operate as non-profit corporations, escape the taxes of 2% to 3% of premiumsthat most states levied from private insurance companies, and exempted from reserve requirements designed to insurethe solvency of regular insurance companies.
Pay-As-You-Go Insurance Puts Non-Profit Bureaucracies in Control
As Blue Cross plans and the idea of national health insurance became more popular in the mid-1930s, physiciansbegan worrying that hospitals would expand the prepaid plan concept into physician services. In 1934 the AmericanMedical Association adopted ten principles aimed at answering proponents of national insurance and preventing hos-pital service plans from underwriting physicians’ services. Legislation exempting prepaid physician services plans
7

from insurance regulations and establishing their non-profit status was passed, along with requirements that ensuredphysician representation on plans providing prepaid physician services. In 1939, the first prepaid physician servicesplan began operation in California. The American Medical Association encouraged state and local medical societiesaround the country to form similar plans, and in 1946 they affiliated and became known as Blue Shield.26
The special legislation exempting the Blues from normal insurance company requirements in exchange for anon-profit status channeled the various experiments in American health insurance towards a pay-as-you-go cost-plussystem run by non-profit bureaucrats. It is likely that the special legislative treatment given the Blues in their earlydays helped fuel their explosive growth. According to economist John Goodman, at the beginning of the 1990s “netrevenues (premiums minus benefit payments) on group policies [were] usually less than 5% of total premiums,[therefore] a 2% to 3% premium tax is equal to about 50% to 60% of net revenues.”27 And because Blue Cross com-bined hospitals into a network that prevented competition from stand-alone facilities, its structure made it almostimpossible for any other kind of insurer to offer benefits that differed markedly from the Blue Cross Standard.
In effect, ad hoc legislation designed to protect hospitals resulted in a system that limited product innovation.Potential competitors to the Blues would have to surmount almost impossible tax advantages. Then as now, patientswho were not members of a hospital-favored insurance plan would have to pay more for services and since all ser-vices were paid for by a third party, patient incentives to watch over costs were effectively blunted.
The intellectual climate of the 1920s and 1930s had celebrated the superiority of socialist ideas of economicorganization. Unfortunately, the notion that more tax money and enhanced centralized control can reduce health carecosts has proven to be extraordinarily durable. The following decades were to see the implementation of many of thesolutions proposed by the Committee on the Costs of Medical Care. Preserved in the regulatory amber that accretedsteadily in the 1930s, 1940s, 1950s, and 1960s, the flaws inherent in the 1930s solutions plague U.S. health care con-sumers to this day.
In 1939, just 6% of the U.S. population had any kind of private health insurance for hospitalization. By 1941,the number had increased to 12.4%. Fifty-one percent of those covered had a policy from Blue Cross Blue Shield,33% had group or individual policies from insurance companies, and almost 14% had insurance provided by com-munity groups, individual practice plans, unions, private group clinics, or similar arrangements. The number ofinsured had risen to 23% by 1945, 59% of whom were covered by Blue Cross Blue Shield. As the U.S. financial sys-tem developed, more private insurers entered the market and the Blue Cross Blue Shield percentage drifted slowlydownwards, falling to 49% by 1950, and 44% in 1960. By 1970, an estimated 86% of the population had some sortof hospitalization coverage, 46% of which was provided by Blue Cross Blue Shield.28 This suggests that, then as now,roughly 14% of the population was uninsured.
The Pay-As-You-Go System Supplants Conventional Insurance
There were large differences between Blue Cross operations and the operation of conventional insurance com-panies, differences that were to have profound effects on the cost of health care in the decades that followed. Normalinsurance contracts are a bilateral arrangement between an insured and his insurance company. A homeowner whosuffers a loss because his house burns down works with a claims adjuster from his insurance company to determinethe amount he is owed by the company. The company performs on its contract by paying him an agreed-upon amount.The owner than goes out and hires the people needed to rebuild his home. In order to ensure that it is able to meet itscontractual obligations to pay for unexpected losses, a conventional insurance company does two things: it chargesthe homeowner a premium based on the likelihood that he will incur a loss, and it maintains assets and reserves suf-ficient to pay for expected losses.
Though a homeowner rebuilding a house may incur costs for several years, his insurance company need not beinvolved after it pays him a lump sum at the time of his loss. His ability to pay for the services he needs is not con-tingent on continuing to pay premiums to his insurer while he rebuilds. The lump sum payment also gives the home-owner a large incentive to search for contractors who offer good value.
Under the pay-as-you-go system created by the Blues, insured members receive services as they are needed, butthe company reimburses those providing the service, rather than those who either pay for the policy or receive thehealth care. No reserves are created from past premium income to pay losses. Next year’s premiums are roughly theexpected total costs of services demanded by members divided by the total number of members. And if a member
8

incurs a loss that will require a stream of future payments, an insurer is liable for continued payments only if aninsured both continues to be covered by his employer and pays his premiums.
With a pay-as-you-go system for homeowner’s insurance, each separate contractor would submit its bill to theinsurer as the house was being rebuilt, and all insured homeowners would have their premiums increased to bear theadditional costs. The costs would be whatever the insured and his contractors determined they should be, limited onlyby the maximum on his policy. If the homeowner becomes unemployed, changes employers, or stops paying his pre-mium before his new house is finished, his insurer would stop paying for the rebuilding. John Goodman of theNational Center for Policy Analysis points out that if life insurance operated on a pay-as-you-go basis, elderly wid-ows expecting to receive monthly annuities from their husband’s life insurance companies would have to continuepaying monthly premiums to the life insurance company that, in time, could increase to exceed the value of theirmonthly annuity checks.29
To make matters worse, because the primary concern of the early Blue Cross and Blue Shield plans was to makesure their members got paid, they stipulated that the plans cover all costs, even those for routine, easily affordable,services. Checkups and diagnostic procedures were covered, and people using plan benefits owed neither deductiblesnor copays. Free of any direct financial responsibility, doctors and patients could command whatever medical ser-vices they wanted, and expect that payment would be made mostly with other people’s money. And because theBlues’ enabling legislation generally required community rating, early plans charged everyone in a given geograph-ic group the same premium. The pattern was set for decades to come; people who used little medical care paid thesame amount as those who used a lot.
By paying the charges of whatever hospital a doctor or patient picked, the Blue Cross reimbursement system alsoinsulated hospital costs from any sort of competitive price system. As late as 1976, 50% of Blue Cross plans werereimbursing hospitals on a cost-plus basis.30
The most common method was the per diem formula. Blue Cross simply divided a hospital’s stated total costsby total patient days and then multiplied that amount by the fraction of total patient days accounted for by Blue Crosspatients. The second formula, known as the Department Method, calculated the Blue Cross payment by multiplyingeach hospital department’s cost by the fraction of total patients who were covered by Blue Cross and used the depart-ment. The third method, the Combination Method, arrived at the Blue Cross payment by calculating the per diem costof routine services, multiplying it by the percent of patient days accounted for by Blue Cross patients and then addingthat to the Blue Cross percentage of the total cost of ancillary services.
The three reimbursement methods used by the Blues did not create normal business incentives. They assumedthat all hospital costs should be paid whether or not they were generated by an inefficient organization. For the non-profit Blues, a reduction in costs reduced the amount of revenue collected.
The reimbursement formulas also allowed hospital managements to manipulate prices so that payments from theprivately insured could be used to subsidize the care given to other patients. By 1980, U.S. hospitals had no incen-tive to minimize their costs, figure out what hospital care really cost, control capacity expansions, specialize in ser-vices in which they were the low cost producer, or minimize patient stays. They also had no way to gauge how muchvalue patients put on different aspects of their services.
Congress Penalizes Individuals, Subsidizes Employer-Provided Group Health Insurance
The regulatory changes that propelled the rapid expansion of employer-provided health insurance during andafter World War II helped fuel the hospital cost spiral by completely removing consumers from any contact withhealth care costs. After Blue Cross showed the way, commercial insurers quickly realized that insuring employeesthrough their employer was a good business and an effective way to lower risk. Companies also learned that experi-ence rating, the practice of setting business premiums by looking at a few years of a group’s past claims experience,was an adequate predictor of next year’s costs.
Employer-provided insurance might have coexisted with policies offered by other groups had Congress, in the1942 Stabilization Act, not chosen to give preferential tax treatment to employer-provided health insurance policies.The Stabilization Act imposed price controls on employers by limiting employee wage increases. Price controlsalways create problems, so at the request of employers it contained a loophole allowing employers to compete forscarce workers by offering health insurance to employees as a pre-tax fringe benefit.
9

In 1943, an administrative tax ruling stated that employers’ payments to commercial insurance companies forgroup medical and hospitalization premiums on behalf of their employees were not taxable as employee wages.Thomasson stresses that the 1943 ruling was a limited one, and that it was not until 1954, when the new InternalRevenue Code was issued, that the deductibility of health insurance payments was clarified and made widely applic-able. Its effects were far reaching—it reduced the cost of health insurance, and by making group insurance widelyavailable, may have accounted for “up to 41% of the rise in the predicted probability of having insurance.”31
In a world in which American corporations faced little competition for their products thanks to a war that hadreduced their main competitors’ factories to rubble, rich tax-free benefits packages that covered even the most triv-ial medical expense became the norm. Vision insurance was added in 1957. It was followed by insurance for dentalcare in 1959. In 1951, 100,000 employees and their dependents were covered by major medical plans. By the end of1960, major medical coverage had been extended to 32 million people. By the end of 1986, the number had reached156 million.32
THE MEDICARE AND MEDICAID ENTITLEMENT:UNINTENDED CONSEQUENCES STRUCTURED BY POLITICIANS FOR POLITICIANS
The Blue Cross Blue Shield approach to health insurance was cast into regulatory concrete when the Democratswon a majority in Congress in 1964 and immediately passed the Medicare and Medicaid programs in 1965. Medicarecopied the Blue Cross Blue Shield pay-as-you-go approach to health insurance and applied it to almost all Americansover 65. Relatively few people were expected to benefit since men born in 1950 had a life expectancy of 66 yearsand women 71.7 years.33 Medicare Part A covered hospital services, promising to pay usual and customary rates.Medicare Part B provided subsidized reimbursement for physician services at usual, customary, and reasonable rates.
Developed in closed sessions of the Ways and Means Committee without any of the public hearings that wouldhave stimulated an informed public debate, the final Medicare bill was a poorly understood grab bag of special interestlegislation 300 pages long.34 Many of the federal and state health reforms that followed were developed in similarly ster-ilized forums designed to eliminate debate and grease the skids to ideologically-motivated, ill-tested, initiatives.
Most privately-designed commercial health insurance plans make people pay for smaller expenses up to someout-of-pocket limit, usually a few thousand dollars. After that, all expenses in a year are paid for up to the policy limitof $1 million to $ 3 million because people typically buy health insurance to pay for losses that they cannot.
Politically-designed health systems like Medicare answer to politicians, not customers. They typically concen-trate on making large numbers of voters grateful by providing small benefits to a large number of people. Small num-bers of extremely unhappy people make little difference. They have only one vote, and if they are in poor health theywill soon be dead anyway.
As the Medicare program has developed, it has become apparent that it protects against relatively small lossesand provides no protection at all for the relatively small number of people who incur large ones by spending morethan 150 days in the hospital. This is a particular problem for the elderly because unlike virtually every reputable pri-vate health insurance policy, Medicare has no cap on the maximum amount its beneficiaries can be liable for eachyear. Medicare copayments automatically increase with health care costs, and individual liability can be substantial.They are quoted as 20% of the Medicare-approved amount for each service rather than as a fixed dollar amount. In1997, 39,840 American citizens enrolled in Medicare had health care liabilities averaging $22,124 per person. If theylacked supplemental insurance, they were responsible for all charges.
The other problem with Medicare is that, unlike private insurance policies, it is not a contract. Congress canchange benefits at will. Enrollment in Part A is virtually automatic at age 65. American citizens cannot reject cover-age without forgoing Social Security benefits, a condition that most people cannot afford.35
Though people who equate health insurance with access to health care often attribute the decline in elderly mor-tality to the universal health entitlement created by Medicare, economists Amy Finkelstein and Robin McKnightfound that Medicare had no effect on mortality in the elderly in the decade following its founding.36 Mortalitydeclines for 55 to 64-year-olds began several years before Medicare, suggesting that the decline for those aged 65 to74, that began slightly after Medicare’s inception, was not a result of the program itself.
Medicare did substantially reduce “the elderly’s exposure to out of pocket [sic] medical expenditure risk” byforcing current taxpayers to pay for the care of retirees. Medicare participants in the top quartile of the out-of-pock-
10

et spending medical expenditure distribution spent almost 50% less, a reduction in average spending of about $1,200per person.37 In short, Medicare shifted responsibility for medical care payments from the elderly to younger peoplestill in the labor force. In doing this, Medicare simultaneously reduced the incentive to save for old age and degrad-ed the ability of younger workers to do so.
Medicaid, the federal means-tested program to provide a rich menu of medical services to the poor, promisedthat the federal government would pay half of the costs of various benefits for those who qualified. Participatingstates were required to pay the other half, and to offer a minimum set of benefits to all comers. Other benefits weremade optional, allowing the states to tailor their programs. Like Medicare, Medicaid paid providers for each indi-vidual service. Because the federal government paid half of all charges it encouraged state politicians to replace thestate programs that had previously assisted the ill and destitute. Medicaid also removed virtually all financial respon-sibility from consumers. It now provides first dollar coverage for everything from transportation to and from the doc-tor, to school counseling for teenagers, to attendant care for the disabled.
Medicaid and Medicare revolutionized the way in which citizens of the United States thought about health care,changing it from something that people had to save for to an entitlement. Rather than encourage people to pay for theirhealth care with their own money, Medicare and Medicaid institutionalized the notion that people could buy healthcare and pay for it with other people’s money. As economist Burton Weisbrod noted, although the spread of insuranceand public entitlement plans might have created an incentive for “patients and their physicians to utilize more healthcare resources,” thus increasing aggregate health care expenditures to a level above what they would otherwise havebeen, it “does not follow that insurance would cause expenditures on health care to grow more rapidly.”38 Unless, ofcourse, the number of people included under insurance and public entitlement plans continued to grow as well.
RAND HEALTH EXPERIMENT: EXPANDING OUT-OF-POCKET PAYMENTS REDUCES EXPENDITURES WITH
NO MEASURABLE EFFECT ON AVERAGE HEALTH
Because the spread of insurance and public entitlement plans coincided with rapidly growing health care expen-ditures, the question of how cost-sharing affected medical expenses was an important part of the Medicare andMedicaid debates in the 1960s and 1970s. As health economist Joseph P. Newhouse explained, “cost-sharingappealed to many conservatives, who believed that patients sought (or physicians delivered) much ‘unnecessary’medical care when care was free. But many liberals saw cost-sharing as a barrier, especially for the poor, to receiv-ing ‘necessary’ care.”39 In the final legislation, Medicaid cost-sharing requirements were nonexistent and it was clearthat the conservatives had lost the debate. In 2002, copayments for a large number of Wisconsin Medicaid servicesranged from $0.50 to $3.00.40
In order to settle the questions about the effect of cost-sharing, the federal government funded a major experi-ment on the effects of self-pay requirements on health care utilization. One of the largest and most carefully con-structed social experiments ever conducted, the RAND Health Insurance Experiment studied the health and healthexpenditures of approximately 2,000 non-elderly families from six areas of the United States. Participants were fol-lowed for three to five years between 1974 and 1982.
Participating families were assigned either to a prepaid group practice or one of 14 fee-for-service insuranceplans. The fee-for-service plans varied only in the fraction of charges billed to the participant and the maximum dol-lar expenditure cap. There were four coinsurance percentages: 0 (free care), 25%, 50%, and 95%. The coinsurancerate referred to the fraction of billed charges paid by the insured. There were also three levels of maximum dollarexpenditures, caps on the amount that any family was expected to pay during each 12 month accounting period. Themaximum dollar expenditures were 5%, 10%, or 15% of family income or $1,000 whichever was less. As a result,the highest maximum dollar expenditure was roughly equivalent to $3,000 in today’s dollars.
The results of the RAND experiment were stunning. The most important result was that per capita expenses onthe free plan were 45% higher than those for the 95% cost-sharing plan. Savings primarily came from a reduction inthe number of contacts rather than in the intensity of services. For average adults, the health of those who spent lessappeared to be just as good as those who spent more.
The 45% higher per capita expense on the free plan had modest benefits for the poor. For example, under thefree plan, low-income hypertensives enjoyed better blood pressure control, and had an associated gain in predicted
11

mortality. Yet, further analysis showed that the improvement in blood pressure control was primarily due to the ini-tial screening examination.”41 In fact, almost all of the beneficial effects of free care were for conditions that wererelatively common, could be detected with relatively inexpensive diagnostic tests.”42 Insurance that provided freemedical care was a very expensive way to discover and treat these problems.
In all, the RAND Health Insurance Experiment showed that the average consumer spent far less on medical carewhen he was spending his own money, and that he chose reductions that were not harmful to health in any measur-able fashion. As Table 2 shows, emergency room visits responded robustly to cost sharing. People who were payingfor their own care reduced visits for conditions that can safely be endured while waiting to see a physician duringnormal business hours. Cost sharing had little effect on visits for serious problems likely to require immediate atten-tion—head injuries, abdominal disease, chest pain/acute heart disease, and acute eye injuries.
The fact that patients reduced costs by limiting the number of contacts with health care providers means thatencouraging consumers to make more out-of-pocket payments for health care has the potential to significantly reduceU.S. health care spending by reducing utilization.
SPENDING TAKES OFF; OUT-OF-POCKET COSTS DECLINE
Historically, of course, out-of-pocket payments have almost become an endangered species in U.S. health care.As private insurance plans modeled after the Blue Cross Blue Shield plans spread and added more benefits to take
12
TABLE 2 RAND HEALTH EXPERIMENT EMERGENCY DEPARTMENT USAGE:(BY INSURANCE PLAN AND DIAGNOSIS)
Annual Visits per 10,000 persons
Cost-sharing plans Free Plan Cost-sharing visits as proportion of free
plan visits
More urgent diagnoses
Fracture/dislocation 134 168 0.80
Head injury 36 33 1.09
Surgical abdominal disease 42 38 1.11
Asthma 30 83 0.36
Ear infection 40 78 0.51
Chest pain/acute heart disease 59 57 1.04
Urinary tract infection 22 43 0.51
Acute eye injury 34 31 1.01
Burn, second degree/complicated 19 22 0.86
Less Urgent diagnoses
Abrasion/contusion 228 403 0.54
Sprain 164 249 0.63
Gastroenteritis/diarrhea 36 67 0.62
Headache 8 59 0.11
Influenza/viral syndrome 40 61 0.65
Source: Joseph P. Newhouse. 1996. Free For All? Harvard University Press, Table 5.3 p. 155.
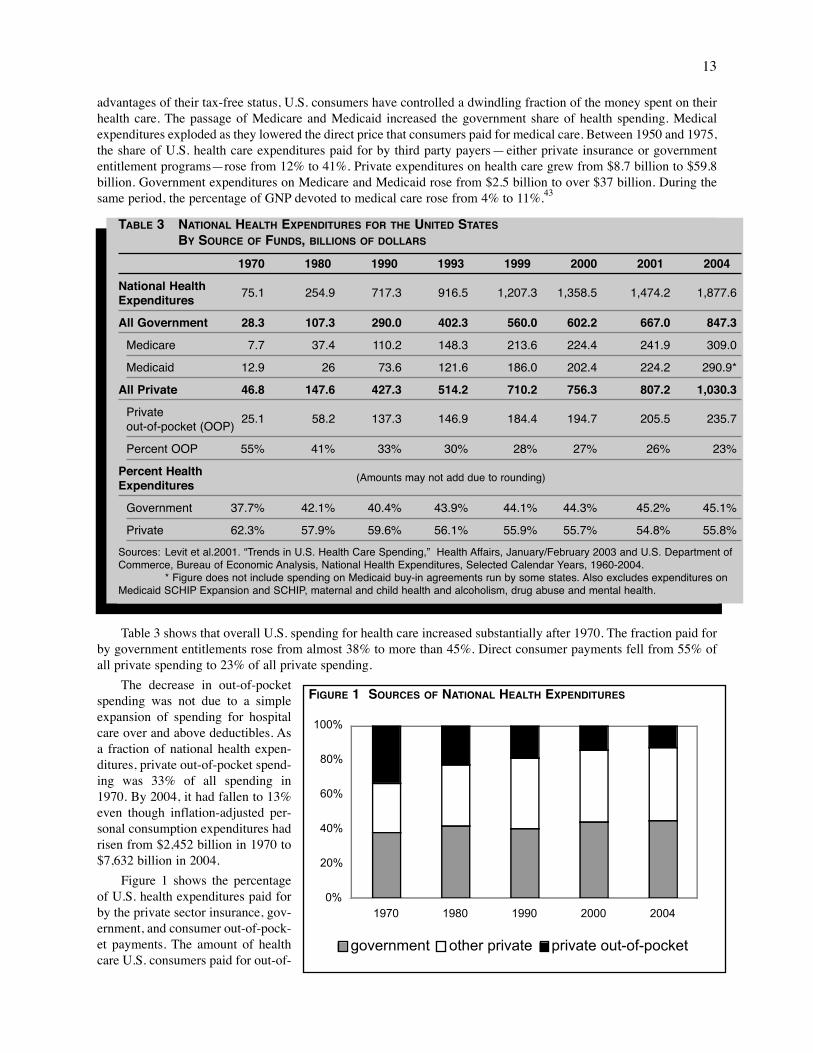
advantages of their tax-free status, U.S. consumers have controlled a dwindling fraction of the money spent on theirhealth care. The passage of Medicare and Medicaid increased the government share of health spending. Medicalexpenditures exploded as they lowered the direct price that consumers paid for medical care. Between 1950 and 1975,the share of U.S. health care expenditures paid for by third party payers—either private insurance or governmententitlement programs—rose from 12% to 41%. Private expenditures on health care grew from $8.7 billion to $59.8billion. Government expenditures on Medicare and Medicaid rose from $2.5 billion to over $37 billion. During thesame period, the percentage of GNP devoted to medical care rose from 4% to 11%.43
Table 3 shows that overall U.S. spending for health care increased substantially after 1970. The fraction paid forby government entitlements rose from almost 38% to more than 45%. Direct consumer payments fell from 55% ofall private spending to 23% of all private spending.
The decrease in out-of-pocketspending was not due to a simpleexpansion of spending for hospitalcare over and above deductibles. Asa fraction of national health expen-ditures, private out-of-pocket spend-ing was 33% of all spending in1970. By 2004, it had fallen to 13%even though inflation-adjusted per-sonal consumption expenditures hadrisen from $2,452 billion in 1970 to$7,632 billion in 2004.
Figure 1 shows the percentageof U.S. health expenditures paid forby the private sector insurance, gov-ernment, and consumer out-of-pock-et payments. The amount of healthcare U.S. consumers paid for out-of-
13
TABLE 3 NATIONAL HEALTH EXPENDITURES FOR THE UNITED STATES
BY SOURCE OF FUNDS, BILLIONS OF DOLLARS
1970 1980 1990 1993 1999 2000 2001 2004
National Health 75.1 254.9 717.3 916.5 1,207.3 1,358.5 1,474.2 1,877.6Expenditures
All Government 28.3 107.3 290.0 402.3 560.0 602.2 667.0 847.3
Medicare 7.7 37.4 110.2 148.3 213.6 224.4 241.9 309.0
Medicaid 12.9 26 73.6 121.6 186.0 202.4 224.2 290.9*
All Private 46.8 147.6 427.3 514.2 710.2 756.3 807.2 1,030.3
Private 25.1 58.2 137.3 146.9 184.4 194.7 205.5 235.7out-of-pocket (OOP)
Percent OOP 55% 41% 33% 30% 28% 27% 26% 23%
Percent Health (Amounts may not add due to rounding)Expenditures
Government 37.7% 42.1% 40.4% 43.9% 44.1% 44.3% 45.2% 45.1%
Private 62.3% 57.9% 59.6% 56.1% 55.9% 55.7% 54.8% 55.8%
Sources: Levit et al.2001. “Trends in U.S. Health Care Spending,” Health Affairs, January/February 2003 and U.S. Department ofCommerce, Bureau of Economic Analysis, National Health Expenditures, Selected Calendar Years, 1960-2004.
* Figure does not include spending on Medicaid buy-in agreements run by some states. Also excludes expenditures onMedicaid SCHIP Expansion and SCHIP, maternal and child health and alcoholism, drug abuse and mental health.
0%
20%
40%
60%
80%
100%
1970 1980 1990 2000 2004
government other private private out-of-pocket
FIGURE 1 SOURCES OF NATIONAL HEALTH EXPENDITURES

pocket fell substantiallybetween 1970 and 2004 whenmeasured as a percentage oftotal spending. Out-of pocketspending accounted for about33% of total health care spend-ing in 1970. It was only 12.5%of the total by 2004.
In addition to encouragingconsumers to pay more, theswitch to third party paymentchanged the behavior of chari-ties. As government spendinggrew and individual paymentsfor medical care fell, manynon-profit groups stoppedusing their funds to pay med-ical bills for the needy, andturned instead to funding sup-
port to groups that lobbied for increased government spending on systemic reforms that would benefit their favoredconstituencies.
SPENDING GROWTH IN OTHER INDUSTRIALIZED COUNTRIES OUTPACES THAT IN U.S.
Although U.S. health spending has grown rapidly, it is important to keep its growth rate in perspective. The1970s were a period of rapid inflation in the United States. Spending comparisons with past periods that fail to takethat inflation into account exaggerate the rise in health spending. Roughly taking inflation into account using the con-sumer price index rather than the medical price deflator or the GDP deflator, United States spending on health roseby a factor of 10 between 1970 and 2004. Figure 2 shows the growth in U.S. health spending in both nominal andinflation-adjusted terms.
Despite the massive growth in the regulatory burden created by Medicare and Medicaid, and the rapid growthof demand fueled by technology, increasing wealth, and public entitlement programs, the percentage growth in U.S.health care spending has been unremarkable relative to that in other industrialized countries. Table 4 shows inflation-adjusted per capita health spending for selected Organization for Economic Cooperation and Development (OECD)countries for three decades beginning in 1970. In 1970-1980 and 1990-2001, the growth in U.S. health expenditureswas below average. It was considerably above average in 1980-1990, at least partly fueled by the explosion of newmedical technologies and their rapid adoption in the U.S. Even though U.S. out-of-pocket spending as a percentageof total household consumption is on par with a number of countries that have government-controlled health care sys-tems, both it and South Korea are distinguished by the relatively large role the private sector plays in allocating theirhealth care dollars.44
OECD data like those shown in Table 5 (on page 16) are often used by health policy commentators in out-of-context comparisons of U.S. health spending with that of other industrialized countries. The inevitable conclusion isthat the U.S. “spends too much on health care.” The commentary typically ignores the fact that U.S. per capita GDPis 23% higher than Canada’s and 36% higher than Germany’s. Wealthier people spend more on many things, includ-ing entertainment, housing, vacation travel, transportation, and health care. Though U.S. citizens undoubtedly spendmore than they need to on health care due to a regulatory thicket that imposes tremendous inefficiency on U.S. healthand health financing, part of the additional spending would occur simply because U.S. citizens have more to spendand want to spend it on health care that preserves life and improves its quality.
To provide context for U.S. health spending, consider U.S. spending on education, also shown in Table 5. Partlydue to wealth and partly due to waste, U.S. spending on education is higher than anywhere else in the world. It fol-lows that those who cite high U.S. health spending as evidence that the U.S. spends too much on health care shouldalso cite high U.S. spending on education as evidence that the U.S. also spends too much on education.
14
$0$200$400$600$800
$1,000$1,200$1,400$1,600$1,800$2,000
1970 1980 1990 2000 2004
billi
ons
of d
olla
rs
Nominal dollars 1982-84 dollars
FIGURE 2 NATIONAL HEALTH EXPENDITURES, NOMINAL AND INFLATION-ADJUSTED

HIGHER AMERICAN SPENDING PRODUCES BETTER HEALTH CARE
The major difference between U.S. spending on health and U.S. spending on education is that a majority ofhealth spending still takes place in the private sector. Educational spending, even at universities, is largely controlledby government. The extent of government control matters. High spending on primary and secondary education pro-duces 15-year-old Americans that consistently rank in the bottom third on international achievement tests. In con-trast, high spending on U.S. health care produces significant benefits for American patients.
Private control makes it more likely that funds will be channeled to areas important to consumers. When thespending is on health, the money flows to patient care. In privately-controlled systems, infrastructures end updesigned to cure maladies, promote full recoveries, and shorten treatment times. People willingly pay for promptcare, diagnostic tests to lower their risk, on drugs and devices that ease compliance with medical regimes, and forresearch into treatment modalities likely to cure disease and dysfunction.
15
TABLE 4 INFLATION-ADJUSTED PER CAPITA GROWTH IN HEALTH EXPENDITURES, OECD 1970-2001PRIVATE SPENDING AS A PERCENTAGE OF TOTAL SPENDING, AND
OUT-OF-POCKET PAYMENTS (OOP) AS PERCENT OF TOTAL HOUSEHOLD CONSUMPTION
1990 2000 1990 20001970-1980 1980-1990 1990-2001 % private % private OOP % OOP %
OECD average* 6.0 3.0 3.4 26 28 2.4 2.8
Australia 5.2 2.6 3.8 33 31 2.2 2.7
Austria 7.4 1.4 2.6 27 31 NA 2.7
Belgium 8.1 3.4 3.5 NA 28 NA NA
Canada 3.2 4.0 2.3 26 29 2.4 2.7
Denmark 2.9 0.8 1.9 3 9 2.8 2.8
Finland 4.6 4.8 0.5 16 25 2.5 2.9
France NA NA 2.5 23 24 1.8 1.8
Germany 6.2 1.8 2.0 24 25 1.8 2.0
Ireland 8.5 0.1 6.7 28 27 1.8 1.9
Italy NA NA 1.9 21 27 2.1 3.1
Japan 7.1 2.6 3.8 22 22 NA 2.3
Korea NA NA 7.4 63 56 4.9 4.3
Netherlands NA 2.3 3.1 33 37 NA 1.6
New Zealand 2.1 2.9 3.0 18 22 1.7 2.1
Norway 9.1 3.1 3.2 17 15 2.4 2.7
Spain 6.9 4.7 3.4 21 28 2.2 (’91) 3.0
Sweden 4.4 1.1 2.1 10 15 NA NA
Switzerland 4.1 2.7 2.4 48 44 5.5 6.1
United Kingdom 4.1 3.2 4.2 16 19 1.1 NA
United States 4.5 5.5 3.2 60 56 3.6 2.9
Source: Manfred Huber and Eva Orosz. Fall 2003. "Health Expenditure Trends in OECD Countries, 1990-2001." HealthCare Financing Review, 25, 1. *1970-90 averages exclude 11 countries, later average excludes 2. Highest is shown.

In politically-controlled systems, money flows to issues of concern to politicians. At any one time, less than 5%of the population in most industrialized countries needs sophisticated medical care. In terms of votes, the concernsof the sick are inevitably outnumbered by the concerns of the well.
The private U.S. health sector has rapidly adopted new therapies and continuously upgraded its facilities. Withthe possible exception of those dependent on government payment, patients have ready access to new and more effec-tive treatments. La Veccihia, et al. compared survival rates from childhood cancers in North America, westernEurope, Japan, Australia, and New Zealand. Given that the incidence of childhood cancers has not changed over thelast thirty years, they concluded that any reduction in mortality would be a result of a country’s advances in medicalcare and could serve as one measure of health system effectiveness in developed countries.”45
As Table 6 shows, adults with cancer also have abetter prognosis in the United States. In 2000, Gatta etal. reported relative survival rates using data on twelvecancers from cancer registries in seventeen countriesafter correcting for competing causes of mortality.
The aggressive treatment used in the U.S. may alsobe of benefit. Recent data suggest that the aggressivetreatment offered U.S. cardiac patients improves boththeir survival and their functioning relative to the lesscostly treatments that are standard in Canada.
Heart attack patients enrolled in GUSTO (GlobalUtilization of Streptokinase and Tissue PlasminogenActivator for Occluded Coronary Arteries) were fol-lowed for five years. The differential procedure ratesindicate the large differences in patient care prevailing inthe U.S. and Canada. At one year, the “rates of cardiaccatheterization were 78.8% among U.S. patients and
42.0% among Canadian patients,” “angioplasty rates were 36.5% in the United States and 16.5% in Canada,” and“bypass surgery rates were 19.5% in the United States and 9.3% in Canada.” Canada had a slightly higher mortality rateat one year. By the end of five years, the U.S. mortality rate was 19.6% . The Canadian mortality rate was 21.4%.46
The U.S. also enjoys better population blood pressure control than nations with socialized care, perhaps becauseit spends more on drugs, physician visits, and specialists. In Europe, researchers measured “a steeper increase in[blood pressure] with advancing age”47 and a 60% higher prevalence of hypertension.”48
16
TABLE 6 COMPARATIVE CANCER SURVIVAL RATES
5 year survival rates
Europe U.S.
Prostate 56% 81%
Skin melanoma 76% 86%
Colon 47% 60%
Rectum 43% 57%
Breast 73% 82%
Uterine 73% 83%
Source: Gatta et al. August 15, 2000. “Toward a compari-son of survival in American and European Cancer Patients,Cancer, 89, 4.
TABLE 5
Health Spending, 2003 Education Spending, 2005
Per capita As % Per capita Average As % Per Student Per StudentGDP, 2003 GDP GrowthRate GDP(US$, PPP) 2003 2003, US$ 1998-2003 2005 College, US$ Primary,US$
United States 37,624 15.0 5,635 4.6% 7.3 22,234 7,560
Canada* 30,475 9.9 3,003 4.2% 6.1 *** ***
United Kingdom 29,931 7.7 2,231 5.7% 5.5 10,753 4,415
Germany 27,565 11.1 2,996 1.8% 5.3 10,504 4,237
France 28,200 10.1 2,903 3.5% 6.0 8,837 4,777
Japan* 28,016 7.9 2,139 3.0% 4.6 11,164 5,771
Sweden** 28,987 9.2 2,594 5.4% 6.5 15,188 6,295
Source: Organization for Economic Cooperation and Development. *estimates. **2002 for health care measures, 2003 for education.

High U.S. spending also purchases the world’s lowest infant mortality rates. For years, commentators have rou-tinely argued that the poor U.S. performance in OECD comparisons of infant mortality rates shows that the U.S.health care system produces substandard results at great expense. A closer examination of the data showed that theOECD numbers were biased against the U.S.
Higher U.S. spending may also make chronically ill Americans better off. After twenty years of living with spinalcord injuries, there were “fewer health and disability related problems” among an American sample of spinal cordinjury patients than among comparable samples from Canada and Britain.49
Private control may also make hospitals a safer place. In a 2004 paper in the Canadian Medical AssociationJournal (CMAJ), Canadian researchers reported on the results of the adverse event studies in various countries.Adverse events are defined as “an unintended injury or complication resulting in death, disability or prolonged hos-pital stay caused by health care management.” Their results are reported in Table 7 and suggest, subject to samplelimitations and the tentative nature of the studies, that higher U.S. spending also buys significantly safer hospitals.This conclusion is buttressed by reports of appalling hospital conditions in the British and Canadian press.
Waiting Lists Kill and Do Not Appear Susceptible to Known Management Techniques
Also important for better care, better survival rates, and lower rates of disability, is the fact that U.S. residentshave virtually immediate access to sophisticated medical care. In Canada, patients must see a general practitioner forreferral to a specialist. Because the government sets prices and budgets for physician visits, physicians see patientsuntil they exhaust their budgets.
The Canadian physician shortage is such that an estimated 4 million people, out of a population of 32 million, can-not find a primary physician willing to treat them. They access the system through over-crowded emergency rooms.50
Those who do have physicians wait weeks or months for their specialist appointment, weeks or months for the diag-nostic tests ordered by the specialist, and then weeks or months for recommended treatment. In some cases, even entryby emergency room is closed. On June 20, 2002, Claude Dufresne died of a heart attack when a Shawinigan, Quebec,emergency department said it closed at midnight and refused to admit him even though a physician was present. Hisambulance was directed to another hospital about 30 minutes away. Mr. Dufresne died en route.51
In 1999, the Vancouver-based Fraser Institute reported that 121 patients waiting for bypass surgery in Ontariohad been removed from the waiting list because their disease had progressed while they were waiting, and they were
17
TABLE 7: INTERNATIONAL COMPARISONS OF ADVERSE EVENTS IN HOSPITAL PATIENTS
Author, Location, Year Percent of patients with Adverse Events Number of hospitals(patient observations)
Baker, Canada, 2000 7.5 20(n=3,745)
Thomas, Utah Colorado, 1992 2.9 28(n=14,700)
Wilson, Australia, 1992 16.6* 28(n=14,179)
Brennan, New York City, 1984 3.7 51(n=30,195)
Vincent, London, 1999-2000 10.8 2(n=1,014)
Davis, New Zealand, 1998 12.9* 13(6,579)
Source: Baker et al. May 25, 2004. “The Canadian Adverse Events Study: the Incidence of Adverse Events Among HospitalPatients in Canada,” CMAJ, 170, 11, 1678-1686.
*Looser definition of causation could include more events. When Thomas et al. harmonized the U.S. and Australianinclusion data the revised estimates produced Australian adverse event rates of 10.6 percent.

now judged to be too ill to withstand surgery. The risk of death increases significantly with waiting time, rising by11% for every month spent in the queue.52
Table 8 shows that national waiting lists have been growing despite government programs to reduce them. Carefulstudy of the matter suggests that the lists will not be eliminated simply by allocating more money to health care. When
governments set prices and budgets for various health careservices, they inevitably create systemic resource allocationproblems at local levels. These errors are invisible to systemplanners. In private systems, resources are allocated as localactors see fit. In public ones, physicians and patients mustwait for the bureaucracy to command information, compileit, study it, and make decisions. By the time the bureaucrat-ic process finishes its cycle, much relevant information hasbeen lost and events may have rendered the offered solutionobsolete or unworkable.
A 2002 paper by Feachem, Sekhri, and White vividlyillustrates the differences in care that result when manage-ment is private rather than governmental. The authors com-pared costs and quality for California’s Kaiser Permanenteand Britain’s National Health Service (NHS). After careful-ly adjusting for differences in benefits, special activities,populations and the cost environment, the authors conclud-ed that although the per capita costs incurred by the twoorganizations were within 10% of one another, the “Kaisermembers experience more comprehensive and convenientprimary care services and much more rapid access to spe-
cialist services and hospital admissions.” They also concluded that the “widely held beliefs that the NHS is efficientand that poor performance in certain areas is largely explained by underinvestment are not supported by this analy-sis. Kaiser achieved better performance at roughly the same cost as the NHS. . . .”53 Kaiser simply managed itsresources better, allocating hospital beds more efficiently, making better use of highly trained specialists, and pro-viding well-equipped physicians who could do what was needed in a single visit.
Government-run health systems also incur largely invisible deadweight losses from the high taxes required topay for them. When these losses are accounted for, the costs of administration rise considerably. Patricia Danzon’srough estimate for the Canadian health system in 1992 suggested that when all costs were considered, public insur-ance in Canada had overhead costs greater than 45%. U.S. private insurers had net costs of about 8%.
HEALTH POLICY EXPERTS EMBRACE CENTRALIZED CONTROL IN AN EFFORT TO CONTROL COSTS
As the RAND Health Insurance Experiment ended in 1982 and health care costs were rising more rapidly thanexpected, the federal government began trying to control its costs. Rather than increase the consumer role inMedicaid and Medicare spending by imitating successful federal programs like Food Stamps, it opted for price con-trols and managed care—central planning by another name. It rearranged the legal environment to remove morehealth care decisions from individual control. The theory was that the U.S. medical system was fraught with waste,and that deploying legions of utilization review experts would bring down costs by rationalizing the system.
Initial efforts to promote central planning were driven by the idea that physicians were prescribing unnecessarytests, and that patients were too demanding in their desire to be treated at their convenience with the latest medicaltechnology. In the 1970s, the federal government passed legislation giving states the right to impose certificate ofneed laws (CON) which gave states the power to veto both private hospital construction and the private acquisitionof new and expensive medical equipment, primarily CAT scanners and MRIs. Little attention was paid to the fact thatadvanced diagnostic devices reduced the need for exploratory surgery or that steady technological progress wouldultimately reduce costs.
18
TABLE 8 PERCENTAGE OF PATIENTS WAITING
MORE THAN 4 MONTHS FOR
ELECTIVE SURGERY
1998 2001
Australia 17 23
Canada 12 27
New Zealand 22 26
United Kingdom 33 38
United States 1 5
Source: R.J. Blendon et al. 2002. “Inequities in HealthCare, A Five Country Survey,” Health Affairs, 21,3, 182-191 as cited in Jeremy Hurst and Luigi Siciliani. July 7,2003. Tackling Excessive Waiting Times for ElectiveSurgery: A Comparison of Policies in Twelve OECDCountries, Health Working Paper No. 6, Organizationfor Economic Co-operation and Development, Paris,France. p. 12.

Economists who specialized in regulation generally agreed that certificate of need laws would increase the costof new capital equipment by diverting resources to firms that generated the volumes of paperwork needed to con-vince distant bureaucrats that what people working in the industry said they needed was actually needed. They alsoraised prices by creating protected markets. Because the first group to place a CAT scanner in a new market had nocompetition, it could charge premium prices for the use of its machine. It was worth its while to pay significantamounts to protect its monopoly positions, usually by arguing that any additional machine was unnecessary andwould add to costs.
The 1970s belief that more capacity increases prices is still current in Wisconsin health policy circles. A 2005Milwaukee Journal Sentinel article on the value of competition in health care said that Concerned Business forResponsible Health Care coalition members were against building a new hospital because “Aurora’s proposed hos-pital would drive up costs by duplicating existing services.”54
If it were true that every new facility simply increases costs, the 2004 closure of the for-profit, privately-ownedHeart Hospital of Milwaukee after a year of operation would not have happened. As in other sectors of the economy,producers in health care cannot simply raise prices to cover excess capacity. This, along with more than a decade ofeconomics research suggests that certificate of need laws probably increase overall costs by impeding price adjust-ments and by adding a layer of regulatory interference. In response, most states have repealed their certificate of needlaws.
Regulations Favor Utilization Controls, Health Maintenance Organizations
Along with certificate of need laws, the federal government embraced managed care as a cost control measure,tilting federal health policy towards Health Maintenance Organizations (HMOs) with the passage of Senator EdwardKennedy’s (D-Mass) 1973 HMO Act. Federal agencies were formed to aid in the development of HMOs. To artifi-cially create a market for services that few people at the time wanted, businesses with more than 25 employees wererequired to offer an HMO option under their health insurance plans. According to John C. Goodman and Gerald L.Musgrave, HMO premiums accounted for just 2% of all health insurance premiums in 1962. Federal insistence onadopting the HMO model of care delivery resulted in rapid growth in HMO membership rising from 5% in 1980 to46% by 1996, of the total insured population under age 65.55
Health Maintenance Organizations differ from standard indemnity insurance and from preferred provider orga-nizations (PPOs) because they combine the physician and the insurer in a single organization. Patients pay a flat feefor their health care, a capitated payment, and the HMO promises to provide all of the health care an individual needs.A conflict of interest is built into HMO structure: HMO physicians work for the insurer, not for the patient.
While PPOs may levy a financial penalty for going out of the networks, most still offer some financial coverageif people decide to visit unapproved physicians or contract for medical care at prices that exceed reasonable and cus-tomary charges. HMOs do not. People who contract with HMOs are effectively uninsured if they seek medical carethat their HMO cannot or will not provide.
HMOs were said to be preferable to traditional indemnity insurance arrangements because the capitated paymentgave them an incentive to keep their members healthy, and because their utilization controls would reduce the unnec-essary medical care that everyone assumed was rampant. Early studies suggested that this hypothesis might be true,though most were unable to adjust for the possibility that healthier people tended to prefer HMOs or that HMOs con-sciously marketed their services to healthier people. More recent statistical work has tried to adjust for possible dif-ferences in group health status. Its results suggest that policies promoting the stringent utilization control common toHMOs may be problematic for sicker people.
Medicare Turns to Price Controls
In 1983, Medicare imposed de facto price controls on medical care by adopting a prospective payment system.Prospective payment meant that hospitals would be paid a flat fee determined by Medicare for each patient based onwhich of 467 diagnosis-related groups (DRG) his case fit into. The government paid the DRG rate regardless of theactual amount of medical care consumed by a particular individual required. DRGs were billed as a market-based
19

means for making hospitals more efficient. As many people at the time realized, they were nothing of the sort.Contemporary analysts predicted that they would lower quality, divert substantial resources to gaming the price sys-tem, and politicize the health care system by creating incentives for an endless parade of special interests to lobbyfor special treatment.56
With its fixed price for any case with a given diagnosis, the prospective payment system instantly turned patientswho cost more, generally those who were older, sicker, and frailer, into financial liabilities. Hospitals dischargedpatients “quicker but sicker,” shifting much of the burden of care and rehabilitation to nursing homes unconstrainedby the new payments system. As providers learned to game the system, diagnoses with higher reimbursementsincreased, corrupting medical records. Intense lobbying efforts occurred to create DRGs that reflected costs in vari-ous specialties and treatments for various diseases. As of 2004, the number of DRGs had expanded to 526.57
As a result of prospective payments, Fitzgerald, Moore, and Dittus found that between 1981 and 1986 the meanlength of hospitalization for elderly patients with hip fracture decreased from 21.9 to 12.6 days and the maximal dis-tance walked before discharge fell from 93 to 38 feet. The proportion of patients discharged to nursing homes rosefrom 38% to 60%, and the proportion of patients who were still in a nursing home one year after their hip fracturealso rose, from 9% to 33%.58
Sicker but quicker discharges appear to have been the norm for patients with other conditions as well. In 1990,Kosecoff et al. developed measures of discharge impairment for five conditions before and after the imposition ofprospective payments. They found that before prospective payments, 10% of patients discharged to their homes wereunstable. After prospective payments, 15% of patients discharged to their homes were unstable. In general, unstabledischarge was associated with a higher mortality rate; death in 16% of cases versus death in 10% of cases.59
Although prospective payment undoubtedly reduced hospital use, it may well have done so at the expense ofincreasing overall costs. Unstable patients often have to be readmitted to hospitals, increasing the cost per case evenas the number of days of hospitalization per admission falls. Writing in 1990, Keeler et al. looked at the U.S. systembefore and after prospective payments, finding that patients admitted to the hospital were much sicker after prospec-tive payments than before. Captivated by what planners said should be happening, the authors figuratively scratchedtheir heads, saying that the reasons for this were “not clear,” because under the new system hospitals should beencouraged to take healthier people.60 They did not consider the possibility that the sicker patient population was anartifact of multiple readmissions.
As one would expect, studies looking at elderly mortality after the institution of prospective payments found itgenerally unchanged. In part, this may have reflected the fact that more care was shifted to nursing homes, whichwere still paid for services rendered. People did not die; they just suffered from more disability. Despite the earlyfindings about prospective payments, they were extended to physicians in 1992-1996 as part of the Clinton adminis-tration drive to recreate the U.S. health care system in the image of European ones. Prospective payment has sincebeen extended to skilled nursing facilities, inpatient rehabilitation facilities, and home health care providers withoutany plan for monitoring its systemic effects.
The results have been predictable. Frymark and Mullen looked at the effect of prospective payment on in-patienttherapy for patients who had cognitive problems and problems communicating and swallowing. They found thatprospective payment increased the number of people discharged with less than adequate functional skills.61
As the government strives to keep up with the dislocations created by price controls and their compounding inef-ficiencies, Medicare’s increasingly Byzantine arrangements are made workable by continuous tinkering with itsmind-numbingly complex annual adjustments. In 2006, Medicare introduced All Patient Refined Diagnosis RelatedGroups (APR-DRGs) to adjust for severity of illness. This has promoted rounds of discussions over such importantpatient care issues as whether patients who are in the hospital with severe sepsis and have become sick enough to beon a ventilator are or are not in a DRG that reflects the costs of using a ventilator.
The level of annual effort devoted the health systems coding and pricing problems is reminiscent of the army ofcentral planners fielded by the Soviet Union. The 2005 Medicare hospital inpatient prospective payment final rule dis-cusses changes in DRG groups themselves, relative weights, wage data, labor-related shares of the wage index, geo-graphic area designations used to calculate the wage index, changes in threshold criteria for approving new medical andtechnological inclusions in coverage and add-on services, changes in policies governing post-acute care transfers,changes in payments to hospitals for the costs of graduate medical education, changes in payments for disproportionateshare rural hospitals, changes in payments to critical access hospitals, and, last but not least, changes in the hospital con-ditions of participation for discharge planning and fire safety requirements for certain health care facilities.62
20

With the exception of the very wealthy who can travel abroad for care or pay cash to physicians and hospitalsthat have opted out of Medicare, the U.S. government exercises almost complete control over all aspects of healthcare for U.S. citizens over 65. After two decades of grafting clumsy cost controls onto an already faltering system ofreimbursement that dates back to the 1930s, Medicare now consists of a disconnected set of price controls on eachsmall piece of the process used to treat a particular malady.
There is no mechanism to consider whether Medicare’s regulatory oversight produces a sensible whole for a par-ticular patient. There is no mechanism for determining that in Patient A’s case more acute care spending would savemoney by stabilizing him to the point where he could skip a nursing home, with its chance of infection, and gostraight home. No one knows whether separate prospective payments for physicians, acute care, skilled nursing, andhome care makes sense or merely increases total costs by encouraging providers to play a game of hot potato withsick patients that pose a threat to their financial viability.
THE SEARCH FOR QUALITY MEASURES TO REPLACE CONSUMERS
Consumers faced with buying goods that they aren’t particularly knowledgeable about, whether higher educa-tion, legal services, car repair, computer programming, or home repairs, often hire an expert to help get the best valuefor their money. In medicine this has historically been a private physician who works for a patient. Local physiciansknew local hospitals. They also knew specialists in their area and could make informed judgments about them.Patients who felt they were getting bad advice were free to make appointments with other physicians to get other out-looks. Hospitals served as a check on physicians, denying privileges to doctors who did not meet their standards.Professional societies determined consensus standards of clinical treatment. Patients unhappy with one physicianwere free to hire another. The system was not without its flaws, as professionals tend to protect one another, but his-tory has shown that it did ensure a minimum level of quality in ways that bureaucratic commissions, like the BritishNational Institute for Health and Clinical Excellence (NICE), do not.
In the 1990s, the health policy establishment began treating physicians almost as an adversary of the patient, gen-erally claiming that they padded their income by recommending unnecessary tests and procedures. Its antidote forthe physician menace was managed care, an arrangement in which physician decisions had to be approved by thirdparty payers. Insurers controlled physician choice, the treatments used by a physician after a diagnosis was made,and the hospitals and specialists that could provide care. Clinical pathways were designed specifying rigid systemsof proper treatment for each known disease, and financial penalties and legal or disciplinary actions threatenedproviders who violated them. The role of the physician in quality control diminished.
Financial penalties were also assessed on patients who disagreed with insurer judgments and chose to go out ofthe network of hospitals and physicians who agreed to abide by an insurers care pathways. Private third party payersadopted prospective payment systems of their own, though they paid higher rates than Medicare or Medicaid, andbuilt networks of physicians and hospitals based on price. As both private insurers and government migrated to morecentralized control of medical decisions, it became increasingly difficult to tell whether a given physician was work-ing for a patient or his insurer. This undermined the traditional system of quality assurance.
Like the push for utilization controls, the push to create measures that tied financial reimbursement to actualmedical practice was aided by policy activists. A strategically released Institute of Medicine (IOM) book, To Err IsHuman, was published in 2000 to make the case for a vast expansion in statistical quality measures. The IOM reportclaimed that “medical injuries account for between 48,000 and 98,000 deaths per year in the United States . . . aheadof breast cancer, AIDS, or motor vehicle accidents” and repeatedly claimed that nationally verifiable quality of caremeasurements were needed to protect patients.
That the IOM study was activism at its best was confirmed by when expert review determined that the resultsfrom the two studies of medical care errors that were the basis of the IOM report were misrepresented. Cox andWoloshin reviewed the IOM documentation backing its estimates and concluded that they “could not confirm theInstitute of Medicine’s reported number of deaths due to medical errors.”63 Troyan A. Brennan of Boston’s Brighamand Women’s Hospital, the author of one of the studies used to make the estimates, wrote that “neither study citedby the IOM as the source of data on the incidence of injuries due to medical care involved judgments by the physi-cians reviewing medical records about whether the injuries were caused by errors. Indeed, there is no evidence thatsuch judgments can be made reliably.”64 He also characterized the IOM recommendations as “giv[ing] the impres-
21

sion that doctors and hospitals are doing very little about the problem of injuries caused by medical care . . . yet theevidence suggests that safety has improved, not deteriorated.”
In an article in JAMA, McDonald et al. noted that the IOM figure of 98,000 deaths was extrapolated from theHarvard Medical Practice study.65 Unfortunately, the original publicity accompanying the release of the IOM studypermanently implanted the idea of enormous error rates in the public mind. The furor was such that few questionedthe new fad for the quality measures that were rapidly rolled out of foundations, government, and think tanks com-mitted to the regulatory project. The result has been the rapid institutionalization of a number of poorly tested qual-ity measures—many of which are as reliable as the IOM report—that promise to make their nonprofit sponsors agreat deal of money, and have at best a dubious relationship to outcomes of primary concern to patients.
A classic example of the mischief caused by inappropriate quality measures is Medicare’s decision to use resi-dent falls as an indicator of the quality of care in nursing homes. In response, many nursing homes have aggressive-ly moved to prevent falls. Residents are not allowed to get up and move around without supervision. Alarms go offif they try to get up. As a result of an arbitrary quality measure, people are discouraged from moving around, a mea-sure as likely to harm their health as protect it.
Quality measures also include the forcible imposition of a variety of computerized data entry and control sys-tems in hospitals and physician offices. In Pittsburgh, the implementation of a computerized physician order entrysystem was associated with an increase in mortality from 2.8% to 6.8% among pediatric cases transported to an aca-demic tertiary care hospital.66 There is also large accompanying literature documenting the role of computerizedorder entry systems in facilitating medication errors.67
Quality Measures That Kill
On close examination, most of the clinical guidelines, pay for performance measures, and other reportingrequirements used to measure quality have one distressing characteristic in common: no one knows if they are relat-ed to health outcomes that matter in any given individual. Added to this uncertainty is the fact that the data underly-ing many quality measures are of dubious quality and the fact that the measures themselves are so numerous that itis generally impossible to combine them in any meaningful way. When Boyd et al. tried to apply current clinical prac-tice guidelines for various diseases to a hypothetical 75-year-old woman with five common problems, they conclud-ed that existing quality recommendations were virtually unworkable in real patients.68
What public quality measure proponents leave out is the fact that later studies have shown that the mortalitygains from the report cards may have come from refusing to treat sicker patients. As Turi put it in 2005, “individualphysicians and hospitals as a whole appear to be declining to provide aggressive, potentially life-saving care for somehigher-risk patients” in order to look good in the ratings.” “[I]n addition to the medical-legal risk shouldered byphysicians and institutions when managing high-risk patients (lawsuits predicated on bad outcomes, not necessarilybad management), now each patient also represents a public relations and economic risk as well.”69
Over half of New York cardiac surgeons in one survey reported refusing to perform surgery on at least onepatient due to public reporting. In the eight years before public reporting, patients referred to the Cleveland Clinicfrom New York State were comparable to those from other states. Immediately after public reporting began in NewYork, the population of cardiac patients referred to the Clinic from New York grew and began to contain significantlysicker people.70 In 2005, Moscucci et al. compared age-adjusted in-hospital mortality rates following cardiac surgeryin New York state and Michigan, which has no reporting requirements. They found that Michigan patients were fourtimes more likely to receive angioplasty when having a severe heart attack. They were also more likely to be oper-ated on when they had cardiogenic shock, congestive heart failure, and extracardiac vascular disease. Although thedeath rate was much lower in New York, the difference was due to the fact that patients in Michigan were sicker.71
In view of this, it is perhaps no accident that New Yorkers are more likely to die of heart attacks than people fromother states.
As expenditures have continued to spiral upwards despite 25 years of utilization review, managed care con-straints, and prospective payments, some people rationalize denying care to “high cost” patients in the name of reduc-ing cost growth. The problem is that this has already been tried in Europe. It has done nothing to control governmentexpenditure on health care.
22

Does Central Planning Reduce Cost?
Despite utilization controls, price controls, and an increasing propensity for government to run the U.S. healthcare system, rising health care expenses continue to subject both business and government budgets to unprecedent-ed stress. In 2004, Medicare expenditures of $308.9 billion represented about 2.6% of the U.S. GDP. Without reform,they are expected to rise to 6.7% of GDP by 2030 and to 9.2% of GDP by 2050. For comparison, the entire 2004 fed-eral budget consumed about 20% of GDP. Of that, spending on national defense was almost 4% of GDP. The pro-jected increase in Medicare expenses for people already born is equivalent to a doubling of the defense budget.72
Medicaid is now a more expensive program than Medicare.
Although the effect of the prospective payments system is generally unknown, past experience with Medicareprogram growth does not provide much hope for the future. With the exception of the late 1990s, when Medicarecosts actually fell after the changes embodied in the 1997 Balanced Budget Act, it has continued to grow robustlydue to increases in the number of disabled beneficiaries, increased participation rate, average payments per service,and higher enrollment. Medicaid expenses are propelled by medical cost increases, program expansions, fraud, andan increase in long-term care.
THE PROMISE OF CONSUMER-DIRECTED CARE
Consumer-driven health care offers the most promise for improving quality and controlling costs. The conceptwas reinvented in the early 1980s when a number of pioneering health care policy experts began researching the fea-sibility of promoting individual self-insurance for relatively small medical bills and creating lifetime savings to dealwith the health problems of old age.
The idea was to promote health insurance policies with large deductibles, policies that had substantially lowerpremiums and acted more like insurance than prepaid health care, and were directly owned by individuals rather thanprovided by employers. Policies like this were unavailable in many states because state regulations and mandates lim-ited the size of deductibles.
In the U.S., the private health insurance market has traditionally been divided between federal and state regulatedentities. The regulation of the business of health insurance has been the province of the states since 1945, and compa-nies that offer nationwide health insurance must file with state authorities in every state in which they do business. Stateshave traditionally taxed insurance companies operating within their borders, approved the plans that they market, setreserve requirements, and audited compliance.
Since 1974, larger employers have operated self-insured health plans under the federal Employee RetirementIncome Security Act (ERISA). This frees them from state laws covering plan design and allows them to avoid the taxeslevied on standard insurance companies. While many ERISA-plan businesses hire health insurance companies toadminister their health plans and purchase reinsurance to cover big claims, very small employers find compliance toocostly. Those that still offer group health insurance typically buy their health insurance policies from the health insur-ers allowed to do business in their states in what is known as the small group market. Individuals purchase health insur-ance policies in the individual market, one that states have traditionally treated separate from the small group market.
In the late 1980s and early 1990s ambitious private foundations like the Robert Wood Johnson Foundation beganpromising state officials cash grants in exchange for enacting model legislation designed to force employers to insureemployees for virtually every medical expense. Governors were told that bad health occurred because people lackedaccess to health care. Better health care via insurance mandates would lower overall spending by correcting the lackof access, preventing disease, and lowering state public health bills. Correcting lack of access required removingfinancial barriers.
In practice these policies meant pushing legislative reforms that increased benefits by requiring extensive cov-erage for routine matters and lowered deductibles for the insured, reforms that eliminated any significant charge forcare at the time of service either by providing free care or funding Medicaid expansions to those who were uninsured,uninsurable, and who had incomes at or below median income.
When made into law, the model plans turned health insurance into prepaid health care. By forcing consumers tobuy health plans that pay for childhood vaccines, for example, legislators increased both the cost of health insurance
23

and the cost of childhood immunizations. Health insurance premiums must be high enough to pay for expectedclaims, operating costs, and profits. To pay for a vaccine costing $50 in the physician’s office, a consumer might haveto pay $60 in health insurance premiums. As premiums rose to reflect the rich array of benefits and low deductiblesthat were stuffed into the mandated policies, health insurance became a poor value. Healthy people began joining theranks of the uninsured.
This strategy made sense thanks to various pieces of federal legislation that had already made having healthinsurance less important. As incomes rose, financial arrangements like home equity lines of credit gave ordinary fam-ilies access to large amounts of emergency cash: people could and did pay cash for routine health care. FederallyQualified Health Centers, an outgrowth of the Community Health Centers established in the 1970s, provided free andlow cost care to all and expanded to cover most of the country. The 1986 Emergency Medical Treatment and ActiveLabor Act (EMTALA) ensured that anyone presenting at a hospital emergency room would be treated. Under EMTA-LA, all Medicare-participating hospitals were required to screen and treat anyone walking into an emergency roomregardless of their ability to pay. With utilization controls increasing the wait for physician appointments in both pub-lic and private health programs, emergency rooms also provided a convenient way to see a doctor without having towait weeks. Between 1993 and 2003, emergency room visits increased by an estimated 26%.73
With so much free care available, any model health insurance legislation that increased the cost of insurance wasdestined to produce dismal results. And because ERISA employers were exempt, the costs of the state health insur-ance experiments fell primarily upon employees of small businesses. Under the community rating schemes designedto reduce state spending by ensuring that sick people could get private health insurance, healthy young employeespaid high premiums to subsidize the costs for older, less healthy, ones. Since guaranteed issue let people defer buy-ing health insurance until they actually had a serious illness, claims exceeded premiums and stayed that way. Healthinsurers left the small group market in droves. Regulation was so inept that states like New Jersey, Tennessee, andNew York managed to make small group coverage unavailable in their states. Regulation of the individual insurancemarket was less intrusive, but insurers cowed by losses in the group market effectively stopped issuing individualpolicies to anyone with any history of even minor health problems.
By 1996, the disarray in state insurance markets was noticeable. It contributed to the passage of federal legisla-tion allowing a pilot program authorizing the sale of 750,000 medical savings account (MSA) policies. The restric-tions on who could buy them were so severe that just a tenth of that number was sold, and no large health insurersfelt that the market was large enough to justify committing resources to developing products for it. Proponents ofgovernment controlled health care systems declared victory, claiming that the MSA experiment proved that con-sumers did not want policies with large deductibles. Other experts persisted in consumer-directed health reformefforts. In December 2002 Congress passed legislation creating tax free Health Savings Accounts.
Basically IRAs for medical care, Health Savings Accounts (HSA) are tax free savings accounts that can be usedfor any expense that the IRS deems health-related. They differ from flexible spending accounts (FSAs) and HealthReimbursement Accounts (HRAs) in that the holder of the account actually owns it and the money in it. The otherbenefit of an HSA is that IRS definitions of allowable health care spending are typically far more expansive thanthose of standard health policies. People can use HSA accounts for dental care, orthodontics, and other therapies notcovered by their health insurance policy. They can also use it to save for long-term care in old age.
In order to have a health savings account, a person must be insured by a qualified high-deductible health plan(HDHP). Although HDHPs provide some first dollar coverage for preventive care and state-mandated services, theirmain feature is higher deductibles, with current minimums of $1,000 for an individual and $2,000 for a family. Totalcosts to an insured must be capped at $5,100 for an individual and $10,200 for a family, including both deductiblesand copays. In return for the risk of accepting a higher deductible, people covered by HDHPs may deposit pre-taxdollars into their HSA. The annual deposit cannot exceed the amount of the deductible and is adjusted each year.Currently the maximum allowed amount is $2,700 for single coverage and $5,450 for family coverage.74
24

Why HSAs Work
There are two theoretical reasons why widespread use of HSAs and HDHP health insurance can be expected tolower costs without degrading the quality of care. The first is administrative. In any given year, a very small fractionof the population has substantial medical expenses. This means that most households can afford to use cash to paytheir medical bills, potentially eliminating the overhead cost implicit in processing multiple claims for routine careand low-dollar office visits. Many physicians currently give discounts of 20% to 30% to patients who pay cash, andcash-only physician practices, which forgo the back office expenses associated with tracking and collecting insur-ance claims, typically have fees substantially below those who participate in insurance networks.
Because higher deductible policies mean that insurers get involved only in more severe illnesses, they reduceclaims expense. And if people make regular deposits to the savings account while they are young and healthy, theamount of cash available as they age can be significant. Suppose a family with a $5,200 deductible and health expens-es of $2,100 in an average year regularly deposits $5,200 in its health savings account, spends $2,100 and has $2,100remaining at the end of each year. At a tax free interest rate of 3%, that family would have a balance of almost$100,000 at the end of 30 years, enough to fund long-term care insurance and buy insurance to handle most medicalemergencies. If they spent $4,000 a year, the balance would still be $22,000. Even if the family saved nothingbecause its expenses were equal to the deductible every single year, it could still be better off due to the fact thatHDHP policies tend to have lower premiums than comparable standard policies and offer a wider choice of treatmentoptions.
The second reason consumer-directed health plans are likely to save money is that people spending their ownmoney tend to spend more carefully. They have more information about their situation than any third party, and theyuse it in actively looking for ways to save. Current real world experiments suggest that human nature has not changedsince the RAND Health Insurance Experiment, and that even people who are chronically ill can cut costs if they havethe freedom and incentive to do so.
In 2002, the State of Colorado began a pilot program that provided consumer-directed attendant support forabout 146 severely disabled Medicaid patients. Under normal Medicaid rules, they were provided with home healthaides supplied by agencies that billed Medicaid directly. The people being taken care of never saw the bills, there wasno error checking, and patients had no control over the personnel being sent into their homes. The Colorado programturned the traditional logic on its head. Patients who participated were given a budget for home health care and thepower to hire and fire their own aides. Average monthly spending for aides dropped by 21%, from $3,925 to $3,131.Care was better. Instances of abandonment dropped as did the number of thefts by caregivers. Patients split the sav-ings 50/50 with the state, allowing them to buy needed equipment like voice-activated telephones. Colorado has sinceexpended the program to the disabled elderly receiving care at home.
Early business experience with consumer-directed health insurance is promising. In a survey released in January2006, the Deliotte Center for Health Solutions reported that costs for consumer-driven health plans, either health sav-ings accounts or health reimbursement arrangements, increased by 2.8% in 2005. HMOs had increases of 8%, point-of-service plans had increases of 8.5%, and preferred provider organizations had increases of 7.2%. Similar costincreases were projected for 2006.75
An earlier experiment with a limited consumer-directed plan occurred in early 2001 when Humana Inc. respond-ed to a projected 19.2% increase in claims costs by developing and testing a limited consumer-driven health plan on4,800 employees in Louisville, Kentucky. As in the RAND experiment, a choice of plans was offered ranging froman HMO to an account that gave them a fixed amount to spend with a high deductible. Funds could only be spent onin-network providers for covered services and were not owned by the employee. The HMO policy cost employees$36.36 per month, the $5,000 deductible CoverageFirst plan cost $10 a month.
As expected, healthier, higher income employees were early adopters of the high deductible plan. In the first year,the actual claims increase was 4.2% rather than the predicted 19.2%, an estimated $2.1 million in savings. The sav-ings came from three sources: additional employees moving into the high deductible plan, changes in benefits, and thefact that employees modified their behavior in response to plan incentives. In the first year, plan inpatient admissionsfell by 14.4% while the broader Louisville market saw a 2% increase. Outpatient services were unchanged while themarket saw an 8.2% increase. Employees had more physician office visits than the trend, 16.9 compared to 13.3 in theoverall market, and used more prescription medications. Despite this, the company saved $2.1 million in the first year.Employee out-of-pocket costs increased slightly, from 20.2% before the plan to 21.9% after.
25

Aetna has examined the short-term behavior of 49,000 employees enrolled in its health reimbursement accountproduct. Costs increased at half the rate of those prevailing in traditional managed care plans. People enrolled in theAetna HRA reduced emergency room visits, primary care provider office visits, and inpatient admissions. Theyincreased specialist visits, an interesting fact given that proponents of cost control by utilization management havetried to limit specialist visits for decades. Enrollees with chronic conditions spent the same amount on maintenancemedications or tests, had almost a 16% reduction in emergency room visits, and unchanged health status. In both theAetna and Humana cases, insured individuals were more meticulous about using prescribed drugs.
A January 2006 census by America’s Health Insurance Plans (AHIP) reported that about 3.2 million people werecovered by HDHPs, triple the number a year earlier. Employer provided coverage went from 397,000 people inMarch 2005 to 1.4 million in January 2006. Buyers tend to be older, and roughly 30% were previously uninsured.Average annual family premiums for the best-selling HDHP policies in the large group market were $6,385 with anaverage annual deductible of $3,494 and an average annual out-of-pocket limit of $6,385. Their premiums were con-siderably below the $10,880 that the Kaiser Family Foundation Employer Health Benefits Survey quoted for tradi-tional employer-sponsored family policies in 2005. In the market for individual HDHPs premiums were somewhatlower as one would expect given the medical underwriting that takes place, and deductibles were somewhat higher.Average annual deductibles for the best-selling product were $4,760 with out-of-pocket limits of $6,837. Averageannual premiums for family policies aged 55 to 64 were $5,690.76
With the market for consumer-driven plans in its infancy, there is no reason to believe that either the current reg-ulatory structures, or current plan offerings are automatically the best alternatives for reducing costs. In 1993, JohnGoodman and Discovery Health launched a consumer driven health plan in South Africa. It was based on the MedicalSavings Account model. Competitors quickly copied the idea and today consumer-directed plans command abouttwo-thirds of the private insurance markets. The most popular South African plans would not be allowed in the U.S.market. Under the assumption that patients typically have little control over inpatient care, there are no deductiblesfor it. Deductibles for outpatient care, over which patients typically exercise a great deal of discretion, are high.77
Private arrangements abroad suggest that the structure of U.S. health insurance and even hospital health carewould change substantially if consumers and producers were given more freedom to design their own health carearrangements. In Britain, for example, private hospitals routinely quote package prices on standard medical proce-dures that include consultant costs, drugs, devices, and any necessary treatment for unexpected complications.Patients with more involved conditions receive written offers, good for 30 days.
SUMMARY
Though a large fraction of health spending remains in private hands, the U.S. health care system has long beenperhaps the most intensively regulated part of the U.S. economy, mostly with costly measures that have been loadedon since reformers began trying to remake the system in the 1970s. Christopher Conover of Duke University listsnearly fifty kinds of federal and state health services regulations including “regulation of health facilities, health pro-fessionals, health insurance, pharmaceuticals and medical devices and the medical tort system.”78
In 2002 the cost of health care regulation was roughly $340 billion, about 20% of total health spending of $1,560billion. The calculated benefits from that regulation were $212 billion, leaving a net cost of $128 billion. If Conoveris correct, merely repealing selected regulations, including those controlling hospital construction and ownership,those that limit experimentation in the form, content, and underwriting of health insurance, those that impose bloatededucational requirements on health professionals, and those that limit innovation in drugs, devices, and new modali-ties of patient care has the potential to lower national health costs by roughly 10%.
As these experiments show, selective dismantling of the regulatory project offers great hope for the future. TheColorado experiment suggests that changes that make Medicare and Medicaid more like the food stamp program inreplacing provider payments with cash accounts offer hope of significant cost savings and better care for patients. Italso would allow responsible people on public assistance to purchase health care services in the same medical mar-ket that everyone else uses.
When coupled with health savings accounts, the switch to consumer-directed high deductible health policiesfrom first dollar employer coverage may decrease current expenditures by 10% to 20%. It will also produce signifi-cant savings for old age costs at a time when the financial sustainability of the U.S. Medicare program is in doubt.
26

Because high deductible consumer policies are far less expensive, there is some evidence that they are being pur-chased by people without health insurance in the relatively lightly-sregulated states that have healthy markets forindividual health insurance.
Two clear choices face those who would shape future U.S. health care policy. Continuing to follow old habits oflayered regulation, third party payment, and increasing government control will continue the current cost spiral andthe recent deterioration in patient care. To protect a bankrupt Medicare program, government involvement will beextended into every nook and cranny of U.S. medical care. The regulatory overload will end private medicine andencourage those who can afford it to purchase their health care abroad.
The other choice is to deregulate, returning insurance to its traditional role as protecting against bankruptcy andpromoting saving to pay for the higher health expenses that generally accompany old age. Let consumers spend theirown money on health care, free of interference from professors with statistical studies and bureaucrats with specificnotions of how people ought to behave. This is the choice that has the potential to stop the cost spiral, lower costs,and provide better health care for all Americans.
27

NOTES
1. Paul Starr. 1982. The Social Transformation of American Medicine. New York: Basic Books, p. 258. Quoted in GregScandlen, 2003. 100 Years of Market Distortions, p. 3.
2. Roy Porter. 1998. The Greatest Benefit To Mankind: A Medical History of Humanity. New York: W.W. Norton &Company, p. 372.
3. Encyclopedia Britannica. 1995. “Medicine,” Chicago: Encyclopedia Britannica. Inc, 15th edition, vol. 23, p. 786.
4. James H. Madison. 1989. “Manufacturing Pharmaceuticals: Eli Lilly and Company, 1876-1948,” Business andEconomic History, vol. 18, Second Series, 72-78. Online version, http://www.h-net.org/~business/bhcweb/publications/BEHprint/v018/p0072-p0078.pdf (accessed November 20, 2005).Madison cites that origin of the quote as Michael Bliss and John Swann. 1986. “Insulin: A Case Study in the Emergenceof Collaborative Pharmacomedical Research: Part II,” Pharmacy in History, 28, p. 73.
5. Louis Rosenfeld. 2002. “Insulin: Discovery and Controversy,” Clinical Chemistry, 48, 2270-2288. Online edition(accessed November 10, 2005) http://www.clinchem.org/cgi/content/full/48/12/2270.
6. Joseph H. Ross. 2002. “The Committee on the Costs of Medical Care and the History of Health Insurance in the UnitedStates,” Einstein Quarterly, 19, p. 130.
7. Melissa Thomasson. April 18, 2003. “Health Insurance in the United States,” EH.Net Encyclopedia, Robert Whaples, ed.http://eh.net/encyclopedia/article/thomasson.insurance.health.us (accessed November 9, 2005). As is the case today,these charges do not include additional bills from physicians who treated patients in the hospital.
8. Joseph H. Ross. 2002. “The Committee on the Costs of Medical Care and the History of Health Insurance in the UnitedStates,” Einstein Quarterly, 19, p. 130. Ross cites M. Davis. 1934. “The American Approach to Health Insurance.Milbank Memorial Fund Quarterly, vol. 12, pp. 211-215 as the source of these data.
9. Bureau of Labor Statistics. 2002. Consumer Expenditure Survey. Table 4, Size of Consumer unit: Average annual expen-ditures and characteristics. Online edition, http://www.bls.gov/cex/csxann02.pdf (accessed November 9, 2005). Thisdoes not include any employer payments for health insurance.
10. Steven R. Machlin and Marc W. Zodet. January 2005. Family Health Care Expenses, by Income Level, 2002. Center forFinancing, Access, and Cost Trends, AHRQ, Household Component of the Medical Expenditure Panel Survey. Thoughthis publication does not define the categories of poor, near poor, low income, middle income, and high income used inits analysis, other MEPS publications specify that poor is at or under the Federal Poverty Level (FPL), near poor isgreater than the FPL but less than or equal to 125% of FPL, low income is >125% FPL but ≤ 200% of FPL, middleincome is >200% FPL but ≤ FPL, and high income is >400% FPL.
11. Institute of Medicine. 1993. Employment and Health Benefits: A Connection at Risk, p. 58. Online editionhttp://www.nap.edu/books/0309048273/html/58.html (accessed November 10, 2005).
12. Joseph H. Ross. 2002. “The Committee on the Costs of Medical Care and the History of Health Insurance in the UnitedStates,” Einstein Quarterly, 19, p. 130.
13. Paul Starr. 1982. The Social Transformation of American Medicine. New York: Basic Books, pp. 261-62. Quoted inGreg Scandlen, 2003. 100 Years of Market Distortions.
14. Joseph H. Ross. 2002. “The Committee on the Costs of Medical Care and the History of Health Insurance in the UnitedStates,” Einstein Quarterly, 19, p. 132.
15. Cited by Joseph H. Ross. 2002. “The Committee on the Costs of Medical Care and the History of Health Insurance inthe United States,” Einstein Quarterly, 19, p. 132.
16. Paul Starr. 1982. The Social Transformation of American Medicine. New York: Basic Books. Quoted in Jon A. Stewart.2004. “The Origins of Prepaid Group Practice in the United States,” in Toward a 21st Century Health System: TheContributions and Promise of Prepaid Group Practice, A. Enthoven and L. Tollen (eds.). San Francisco: Jossey Bass.Online edition, (accessed November 9, 2005), p. 8.
17. U.S. Bureau of the Census. 1975. Historical Statistics of the United States, Colonial Times to 1970, BicentennialEdition, Part 2, Series B 275-290, Physicians, Dentists, and Nurses, p. 76.
18. Jon A. Stewart. 2004. “The Origins of Prepaid Group Practice in the United States,” in Toward a 21st Century HealthSystem: The Contributions and Promise of Prepaid Group Practice, A. Enthoven and L. Tollen (eds.). San Francisco:Jossey Bass. Online edition, (accessed November 9, 2005), p. 1.
19. David T. Beito. July 27, 2000. From Mutual Aid to Welfare States: How Fraternal Societies Fought Poverty and TaughtCharacter, Backgrounder 677, Heritage Foundation, Washington, D.C. Online edition (accessed November 12, 2005),http://www.heritage.org/Research/PoliticalPhilosophy/hl677.cfm.
28
20. Herb Emery. August 15, 2001. “Fraternal Sickness Insurance.” EH.Net Encyclopedia, Robert Whaples, ed .RobertWhaples, ed. Online edition, http://eh.net/encyclopedia/article/emery.insurance.fraternal, (Accessed November 12,2005).
21. American Foundation. 1937. American Medicine, Volume II. New York: The American Foundation, p. 1023. Cited inMelissa Thomasson. April 18, 2003. “Health Insurance in the United States,” EH.Net Encyclopedia, Robert Whaples, ed.http://eh.net/encyclopedia/article/thomasson.insurance.health.us, (accessed November 9, 2005).
22. Paul Starr. 1982. The Social Transformation of American Medicine. New York: Basic Books, p. 295-6. Quoted in GregScandlen, 2003. 100 Years of Market Distortions, p. 4.
23. Michael M. Davis and C. Rufus Rorem. 1932. The Crisis in Hospital Finance and Other Studies in Hospital Economics.Chicago: University of Chicago Press, p. 5. Cited in Melissa Thomasson. April 18, 2003. “Health Insurance in theUnited States,” EH.Net Encyclopedia, Robert Whaples, ed.http://eh.net/encyclopedia/article/tomasson.insurance.health.us (accessed November 9, 2005).
24. Melissa Thomasson. April 18, 2003. “Health Insurance in the United States,” EH.Net Encyclopedia, Robert Whaples, ed.http://eh.net/encyclopedia/article/thomasson.insurance.health.us (accessed November 9, 2005) the author quotes Louis S.Reed.1947. Blue Cross and Medical Service Plans. Washington, DC: U.S. Public Health Service, p. 14.
25. Melissa Thomasson. April 18, 2003. “Health Insurance in the United States,” EH.Net Encyclopedia, Robert Whaples, ed.http://eh.net/encyclopedia/article/thomasson.insurance.health.us (accessed November 9, 2005).
26. Melissa Thomasson. April 18, 2003. “Health Insurance in the United States,” EH.Net Encyclopedia, Robert Whaples, ed.http://eh.net/encyclopedia/article/thomasson.insurance.health.us, (accessed November 9, 2005).
27. John C. Goodman. 1992. Patient Power. Washington, DC: Cato Institute. pp. 160.
28. Historical Statistics of the United States and author’s calculations.
29. John C. Goodman. 1992. Patient Power. Washington, DC: Cato Institute. pp. 181.
30. John C. Goodman. 1992. Patient Power. Washington, DC: Cato Institute. pp. 166.
31. Melissa A. Thomasson. February 2000. The Importance of Group Coverage: How Tax Policy Shaped U.S. HealthInsurance, Working Paper 7543, National Bureau of Economic Research, Cambridge, Massachusetts.
32. Laura A. Scofea. March 1994. “The Development and Growth of Employer-Provided Health Insurance,” Monthly LaborReview, Bureau of Labor Statistics, U.S. Department of Labor, Washington, D.C. p. 6.
33. Kevin G. Kinsella. 1992. “Changes in Life Expectancy 1900-1990,” American Journal of Clinical Nutrition, 55, p.1197s. http://www.ajcn.org/cgi/reprint/55/6/1196S, as of July 10, 2006.
34. Sue A. Blevins. 2001. Medicare’s Midlife Crisis. Cato Institute, Washington, D.C. pp. 47-49.
35. Some health policy experts have claimed that this is not accurate. The source for this claim is Sue A. Blevins, op cit.Her source for this, as described in footnote 33, page 11, is a Congressional Research Service report from 1989 thatquotes the Social Security Administration’s Operations Manual. It says that “Individuals entitled to monthly [SocialSecurity] benefits, which confer eligibility for HI [Hospital Insurance] may not waive HI entitlement. The only way toavoid HI entitlement is through withdrawal of the monthly benefit application. Withdrawal requires repayment of allRSDI [Retirement, Survivors and Disability Insurance] and HI benefit payments made.” To any reasonable person thissuggests that withdrawal is impossible without losing Social Security. If that impression is inaccurate, it serves as yetanother example of the needless and incomprehensible complexity of the Medicare program. As it stands, it is an uncon-scionable, devious, and underhanded confiscation of promised benefits from people who would rather make their ownhealth care arrangements.
36. Amy Finkelstein and Robin McKnight. September 2005. What Did Medicare Do (And Was it Worth It)? Working PaperNo. 11609, National Bureau of Economic Research, Cambridge, Massachusetts.
37. Amy Finkelstein and Robin McKnight. September 2005. What Did Medicare Do (And Was it Worth It)? Working PaperNo. 11609, National Bureau of Economic Research, Cambridge, Massachusetts, p. 15.
38. Burton A. Weisbrod. June 1991. “The Health Care Quadrilemma: An Essay on Technological Change, Insurance,Quality of Care, and Cost Containment,” Journal of Economic Literature, 29, 2, p. 527.
39. Joseph P. Newhouse. 1996. “Free For All? Lessons from the RAND Health Insurance Experiment,” Cambridge,Massachusetts, Harvard University Press, p.4.
40. Brian K. Bruen and Joshua M. Weiner. March 2002. Recent Changes in Health Policy for Low-Income People inWisconsin. State Update No. 25, Assessing the New Federalism, The Urban Institute, p. 9.
41. Joseph P. Newhouse. 1996. “Free For All? Lessons from the RAND Health Insurance Experiment,” Cambridge,Massachusetts, Harvard University Press, p. 243.
29
42. Joseph P. Newhouse. 1996. “Free For All? Lessons from the RAND Health Insurance Experiment,” Cambridge,Massachusetts, Harvard University Press, p. 351.
43. Burton A. Weisbrod. June 1991. “The Health Care Quadrilemma: An Essay on Technological Change, Insurance,Quality of Care, and Cost Containment,” Journal of Economic Literature, 29, 2, p. 526 and p. 523.
44. By 2004, OECD health expenditure data for the major industrialized countries was reportedly compatible. Comparativedata prior to the late-1990s needs to be interpreted with care and typically is not in empirical studies comparing nationalexpenditures growth. For Denmark, which excludes long-term nursing care from its statistics on health spending, stan-dardized SHA national health expenditures were 125% of the expenditures reported by the Danish system of nationalincome accounts. Japan’s estimates under SHA were 127% of the health expenditures recorded in its national accounts.Japan excludes spending on services not covered by public health insurance and services financed by long-term careinsurance from its health expenditure accounting. Germany excludes expenditures on R&D and education for health per-sonal from its estimates of national health spending. Both of these are significant costs that are included in U.S. nationalhealth expenditure accounts. In Canadian calculations of health expenditures, spending on services provided by the Restof the World “is partially excluded.” Anecdotal reports suggest that Canadian citizens spend large amounts of moneybuying health care in the United States. If this is the case, Canadian national expenditure data underestimate actualCanadian health spending.
45. C. La Vecchia et al. November 15, 1998. “Trends in childhood cancer mortality as indicators of the quality of medicalcare in the developed world,” Cancer, 83,10, 2223-7.
46. Padma Kaul et al. September 20, 2004. “Long-Term Mortality of Patients With Acute Myocardial Infarction in theUnited States and Canada: Comparison of Patients Enrolled in Global Utilization of Streptokinase and t-PA forOccluded Coronary Arteries (GUSTO)-I,” Circulation, 110, 1754-1760. Online edition,http://circ.ahajournals.org/cgi/content/full/110/13/1754 accessed January 27, 2006.
47. Jan A Staessen, Tatiana Kuznetsova, and Katarzyna Stolarz. May 14, 2003. “Hypertension Prevalence and StrokeMortality Across Populations,” JAMA, 289, 18, 2420-2422. Online edition, accessed March 10, 2006.
48. K. Wolf-Maier et al. May 14, 2003. “Hypertension prevalence and blood pressure levels in 6 European countries,Canada and the United States,” JAMA, 289,18, 2420-2.
49. MA McColl, S. Charlifue, C. Glass, G. Savic, and M. Meehan. March 2002. “International differences in ageing andspinal cord injury,” Spinal Cord, 20, 3, 128-36.
50. The College of Family Physicians of Canada. “The Family Physician Shortage,” C Health, http://chealth.canoe.ca/chan-nel_section_details.asp?text_id=2994&channel_id=8&relation_id=3623 as of October 10, 2005.
51. Brenda Branswell. July 22, 2003. “Suit launched over death following ER closure in Quebec,” CMAJ, 169, 2, onlineedition.
52. H. Rexiux, G Bandrup-Wognsen, A. Oden, and A. Jeppsson. March 2004. “Mortality on the Waiting List for CoronaryArtery Bypass Grafting: Incidence and Risk Factors,” Annuals of Thoracic Surgery, 77,3, p. 774-75.
53. Richard G. Feachem, Neelam K. Sekhri, and Karen L. White. January 19, 2002. “Getting More for Their Dollar: AComparison of the NHS with California’s Kaiser Permanente,” BMJ, 324, p.135.
54. Guy Boulton. May 1, 2005. “A tonic for rising health costs?; In hospital fight, value of ‘competition’ is hotly debated,”Milwaukee Journal Sentinel, p. D1.
55. Estimates from the Medical Expenditure Panel Survey.
56. For an example see Stuart M. Butler. January/February 1998. “Medicare Price Controls: The Wrong Prescription,”Health Affairs, 17,1,72-74.
57. M. DoBias and C. Becker. October 10, 2005. “Reshuffling the DRG deck. New cardiac DRGs praised for more equi-table reimbursement while post-acute-transfer changes are generating some worries,” Modern Healthcare, 35,41, 6-7.The number of original procedures is from John C. Goodman, 1993. Patient Power, Cato Institute, Washington, D.C. fn24, p. 302.
58. J.F. Fitzgerald, P.S. Moore, and R.S. Dittus. November 24, 1988. “The Care of Elderly Patients with Hip Fracture.Changes Since implementation of the Prospective Payment System.” New England Journal of Medicine, 320, 13, pp.871-2.
59. J. Kosecoff et al. October 17, 1990. “Prospective payment system and impairment at discharge. The ‘quicker-and-sicker’story revisited.” JAMA, 264, 15, 1995-6.
60. Emmett B. Keeler et al. October 17, 1990. “Changes in sickness at admission following the introduction of the prospec-tive payment system,” JAMA 264, 15, p. 1962.
30
61. T.B. Frymark and R.C. Mullen. January 2005. “Influence of the Prospective Payment System on Speech-LanguagePathology Services,” American Journal of Physical Medicine and Rehabilitation, 84, 1, 12-21.
62. Centers for Medicare and Medicaid Services. August 11, 2004. “Medicare program; changes to the hospital inpatientprospective payment systems and fiscal year 2005 rates. Final rule.” Federal Register, 69. 154, 48915-9268. Abstract,cited in Medline, PMID 15305422.
63. H.C. Cox, Jr. and S. Woloshin. Nov-Dec 2000. “How many deaths are due to medical error? Getting the number right,”Effective Clinical Practice, 3,6, 277-83.
64. Troyan A. Brennan. April 13, 2000. “The Institute of Medicine Report on Medical Errors—Could it Do Harm?, NewEngland Journal of Medicine, 342, 15, 1123-5.
65. Clement J. McDonald, Michael Weiner, and Siu L. Hui. July 5, 2000. “Deaths Due to Medical Errors Are Exaggeratedin Institute of Medicine Report,” JAMA, 284, 1, 93-95.
66. Y.Y. Han et al. February 2006. “Unexpected increased mortality after implementation of a commercially sold computer-ized physician order entry system,” Pediatrics, 11, 2, 594.
67. Ross Koppel et al. March 9, 2005. “Role of Computerized Physician Order Entry Systems in Facilitation MedicationErrors,” JAMA, 293, 10, 1197-1203.
68. The variability of individual patients can make the application of group statistical measures a dicey proposition. Forbrief discussion of some of the difficulties of “evidence-based” drug substitution based on the creation of looselydefined therapeutic classes see Elliott M. Antman, and James J. Ferguson. 2003. “Should Evidence-Based Proof ofEfficacy as Defined for a Specific Therapeutic Agent be Extrapolated to Encompass a Therapeutic Class of Agents?,”Circulation, 108, 2604-2607. On the problems with statistical and clinical evidence generally see Earl P. Steinberg andBryan R. Luce. January/February 2005. “Evidence Based? Caveat Emptor!,” Health Affairs, 21,1,80-92. For a descrip-tion of the problems inherent in translating clinical practice guidelines in actual practice see Boyd et al. 2005. “ClinicalPractice Guidelines and Quality of Care for Older Patients With Multiple Comorbid Diseases,” JAMA, 294, 716-724.
69. Zoltan G. Turi. 2005. “The Big Chill: The Deleterious Effects of Public Reporting on Access to Health Care for theSickest Patients,” Journal of the American College of Cardiology, 45, 11, p. 1766.
70. N.A. Omoigui et al. 1996. “Outmigration for coronary bypass surgery in an era of public dissemination of clinical out-comes,” Circulation, 93, 27-33.
71. M. Moscucci et al. June 7, 2005. “Public reporting and case selection for percataneous coronary interventions: an analy-sis from two large multicenter percutaneous coronary intervention databases,” Journal of the American College ofCardiology, 45, 11, 1759-65.
72. Medicare Trustee’s Report, 2005. Tables III.A1 and III.A4.
73. Daniel Yi. March 29, 2006. “Most ER Patients are Insured, Study Says,” Los Angeles Times, online edition.
74. More information on Health Savings Accounts is available from the United States government Treasury Department website, the Council for Affordable Health Insurance web site, and the HSAInsider web site.
75. Deloitte Services LP. January 24, 2006. Survey: Consumer-Driven Health Plan Cost Growth Significantly Slower thanOther Plans, press release,http://www.deloitte.com/dtt/press_release/0,1014,sid%253D2283%2526cid%253D107407,00.html.
76. America’s Health Insurance Plans Center for Policy and Research. 2006. January 2006 Census Shows 3.2 MillionPeople Covered By HSA plans, www.ahipResearch.org.
77. National Center for Policy Analysis. Undated. A Brief History of Health Savings Accounts. NCPA Brief Analysis #481,http://cdhc.ncpa.org/about/brief-history-of-health-savings-accounts.
78. Christopher J. Conover. May 13, 2004. Testimony before the Joint Economic Committee, United States Congress.
31

REPORT FROM THE SENIOR FELLOW:
Every opinion poll shows Wisconsin citizens areworried about the cost of health care. It is affectingthe security of every family and the bottom line ofevery business. We have come to expect soaringhealth care costs each year and we feel almost help-less to do anything about it. How did it get this way?
That is the question we asked Linda Gorman,Ph.D. to research for us. As the Director of the HealthCare Policy Center for the Independence Institute,Dr. Gorman is well qualified to answer the question.Her report points out critical flaws in the Americanhealth care system that date back to the GreatDepression.
It was during the Depression that hospitals band-ed together to offer prepaid coverage to citizens.Prepaid hospital coverage was a way for hospitals toavoid the financial failure that befell the bankingindustry. The approach worked so well that doctorsfollowed suit a few years later and Blue Cross BlueShield organizations were born. Little did anyoneknow that the seeds for runaway costs eighty yearslater had been planted.
Prepaid, employer-provided insurance quicklydominated the health care landscape. Subsequentaction by the federal government in the 1950s to pro-vide a tax deduction for health insurance premiumshelped solidify the approach. To set the system inconcrete, in the 1960s the federal government creat-ed Medicare and Medicaid, two programs patternedclosely after the Blue Cross model.
While the resulting American health care modelproved a clever way to ensure that the money wouldroll in from patients, employers, and government, itcontained a flaw that is proving fatal. The flaw is thathealth care consumers have been removed from par-ticipating in decisions regarding their care. Ourapproach to health insurance ignores the importantrole consumers play in controlling costs and enhanc-ing quality. Dr. Gorman found that people who payfor their own care cut utilization by 10% to 30% withno discernable effect on health. Saving even 10% ofWisconsin’s 2002-2003 health care spending wouldhave saved $260 million.
Fortunately a movement has begun to put con-sumers in the central role where they belong. In asubsequent study Dr. Gorman will examine how con-sumer-driven health care can serve to control costsand improve the quality of our health care.
George Lightbourn
BOARD OF DIRECTORSRobert Buchanan, Chairman
David BaumgartenCatherine C. DellinThomas J. Howatt
James KlauserDavid J. LubarMaureen OsterRobert O’TooleTimothy Sheehy
Edward ZoreJames Miller, President
WISCONSIN POLICYRESEARCH INSTITUTE, INC.
P.O. Box 487 • Thiensville, WI 53092(262) 242-6409 • Fax: (262) 242-6459
E-mail: [email protected] • Internet: www.wpri.org
PAGE
EXECUTIVE SUMMARY 1INTRODUCTION 3LEGISLATING A MESS: GOVERNMENT INTERVENTION
AND THE EARLY HISTORY OF THE HEALTH CARE
PAYMENTS SYSTEM 3HEALTH INSURANCE REPLACES SICKNESS PAYMENTS 6THE MEDICARE AND MEDICAID ENTITLEMENT:
UNINTENDED CONSEQUENCES STRUCTURED BY
POLITICIANS FOR POLITICIANS 10RAND HEALTH EXPERIMENT: EXPANDING OUT-OF-
POCKET PAYMENTS REDUCES EXPENDITURES WITH
NO MEASURABLE EFFECT ON AVERAGE HEALTH 11SPENDING TAKES OFF; OUT-OF-POCKET COSTS DECLINE 12SPENDING GROWTH IN OTHER INDUSTRIALIZED COUNTRIES
OUTPACES THAT IN U.S. 14HIGHER AMERICAN SPENDING PRODUCES BETTER
HEALTH CARE 15HEALTH POLICY EXPERTS EMBRACE CENTRALIZED
CONTROL IN AN EFFORT TO CONTROL COSTS 18THE SEARCH FOR QUALITY MEASURES TO
REPLACE CONSUMERS 21THE PROMISE OF CONSUMER-DIRECTED CARE 23SUMMARY 26NOTES 28
THE HISTORY OF HEALTHCARE COSTS AND HEALTH
INSURANCEA Wisconsin Primer
LINDA GORMAN, PH.D.

The Wisconsin Policy Research Institute is a not-for-profit institute established tostudy public-policy issues affecting the state of Wisconsin.
Under the new federalism, government policy increasingly is made at the state and locallevels. These public-policy decisions affect the life of every citizen in the state. Our goal is toprovide nonpartisan research on key issues affecting Wisconsinites, so that their elected repre-sentatives can make informed decisions to improve the quality of life and future of the state.
Our major priority is to increase the accountability of Wisconsin's government. Stateand local governments must be responsive to the citizenry, both in terms of the programs theydevise and the tax money they spend. Accountability should apply in every area to which thestate devotes the public's funds.
The Institute's agenda encompasses the following issues: education, welfare and socialservices, criminal justice, taxes and spending, and economic development.
We believe that the views of the citizens of Wisconsin should guide the decisions ofgovernment officials. To help accomplish this, we also conduct regular public-opinion pollsthat are designed to inform public officials about how the citizenry views major statewideissues. These polls are disseminated through the media and are made available to the generalpublic and the legislative and executive branches of state government. It is essential that elect-ed officials remember that all of the programs they create and all of the money they spendcomes from the citizens of Wisconsin and is made available through their taxes. Public policyshould reflect the real needs and concerns of all of the citizens of the state and not those of spe-cific special-interest groups.
ABOUT THE INSTITUTE