the household distribution of dengue epidemictextroad.com/pdf/jbasr/j. basic. appl. sci. res.,...
TRANSCRIPT

J. Basic. Appl. Sci. Res., 3(7)56-65, 2013
© 2013, TextRoad Publication
ISSN 2090-4304 Journal of Basic and Applied
Scientific Research www.textroad.com
*Corresponding Author: Puntani Pongsumpun, Department of Mathematics, Faculty of Science, King Mongkut’s Institute of Technology Ladkrabang, Chalongkrung road, Ladkrabang, Bangkok 10520, Thailand. [email protected]
The Household Distribution of Dengue Epidemic
Puntani Pongsumpun*
Department of Mathematics, Faculty of Science, King Mongkut’s Institute of Technology Ladkrabang, Chalongkrung road, Ladkrabang, Bangkok 10520, Thailand.
ABSTRACT Dengue disease is usually found in the tropics, especially in Southeast Asia. This disease can transmit between human through biting of infected female Aedes mosquitoes. Many Aedes mosquitoes are usually found in urban areas, especially in a crowded place. Because the commutations of people and the flying of mosquitoes are always happen, therefore these factors are considered. In this paper, we study the transmission of dengue disease considering the above factors by constructing the dynamical network model. The behaviors of solutions to our dynamical model are shown for the different set of parameters. The results of this study should introduce the parameters which effect to the transmission of this disease KEYWORDS: Aedes mosquito, commutation, dengue disease, dynamical model, epidemic, network, transmission.
INTRODUCTION
Dengue disease was first reported throughout the nineteenth and early twentieth century’s in the America, southern
Europe, North Africa, the eastern Mediterranean, Asia, Australia, and on various islands in the Indian Ocean, the south, central Pacific and the Caribbean. Dengue disease is classified into three types: Dengue Fever(DF), Dengue Hemorrhagic Fever(DHF) and Dengue Shock Syndrome(DSS). DF is an acute fever presented with headache, myalgias, arthralgia as, rashes and leucopenia. Although DF is not dangerous fever, it may be an incapacitating disease with severe muscle and joint pain (break-bone fever), especially in adults and occasionally with unusual hemorrhage. DHF causes high fever, hemorrhagic phenomena, hepatomegaly and circulatory failure. Although DHF occurs mostly in children who have experienced secondary dengue infection, it can result from a primary infection [1]. DSS may happen to patients who progress to shock and suddenly deteriorates after a fever of 2-7 days. Symptoms of patients with circulatory failure, the skin becomes cool, blotchy and congested and the pulse becomes rapid [2]. About 1% of cases, people with DF can develop to be DHF. DF and DHF were occurred over the past 40 years. The first recorded outbreak of dengue disease compatible with DHF occurred in Australia in 1897. A similar hemorrhagic disease was recorded in 1928 during an epidemic in Greece and again in Taiwan in 1931. The first confirmed epidemic of DHF was recorded in the Philippines in 1953-1954. Since then, major outbreaks of DHF with significant mortality have occurred in most countries of the South-East Asia Region, including India, Indonesia, Maldives, Myanmar, Sri Lanka, and Thailand, as well as in Singapore, Cambodia, China, Laos, Malaysia, New Caledonia, Palau, Philippines, Tahiti and Vietnam in the Western Pacific Region [3]. Dengue virus is separated into four serotypes such as DEN-1, DEN-2, DEN-3 and DEN-4. Aedes aegypti and Aedes albopictus are vectors for this disease. Mosquitoes carrying dengue typically bite during the daytime, particularly two to three hours after dawn and during the early evening. They breed in standing water and are often found in urban areas. Aedes aegypti mosquito will travel about 30-400 metres. Aedes aegypti is quite different to other mosquitoes. It has adapted to live and breed in urban areas in close proximity to humans. The mosquito breeds in artificial containers (e.g. old tyres, pot plant trays) that collect water and feeds almost exclusively on humans for blood. DHF was first reported in Thailand in mid’1950s. About 50 to 100 patients were diagnosed in the beginning. The first large outbreak was reported in 1958 when 2,158 patients and 300 deaths were reported. Since then, the cases have been gradually increasing. In the first few outbreaks, the disease was mainly found in Bangkok and its surrounding areas, and the majority of cases were children aged between 2 and 6 years. Since 1965, the disease has been reported from all regions of the country [4]. The yearly and age distributions of dengue disease in Thailand are shown in fig.1 and fig.2, respectively [5]. There are the different distributions of Thai dengue cases for all four serotypes as shown in fig.3 [5].
56

Pongsumpun, 2013
Fig.1 Incidence rate per 100,000 population of dengue disease in Thailand; 1992-2011 [5].
Fig.2 Average Incidence rate per 100,000 population of Thai dengue cases classified by age structure of human; 2002-2011 [5]
0
50
100
150
200
250
Inci
denc
e ra
te p
er
100,
000
popu
latio
n
Year
0
5
10
15
20
25
30
Inci
denc
e ra
te p
er 1
00,0
00 p
opul
atio
n
57
J. Basic. Appl. Sci. Res., 3(7)56-65, 2013
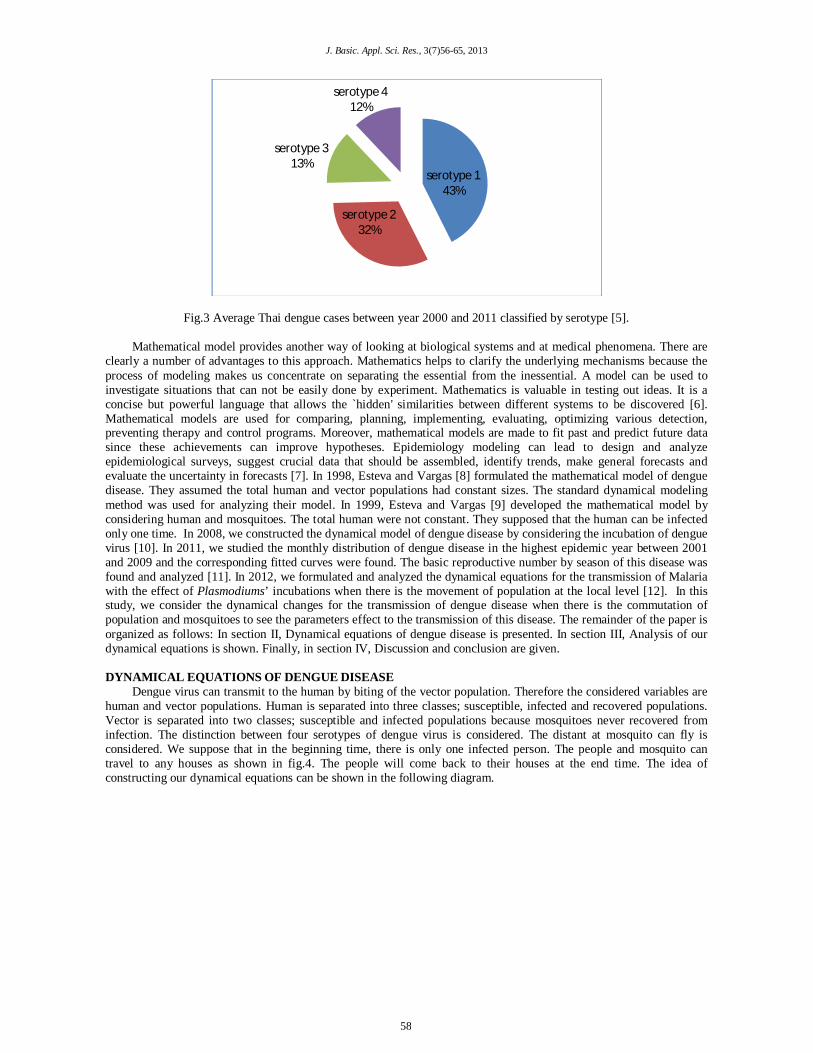
Fig.3 Average Thai dengue cases between year 2000 and 2011 classified by serotype [5]. Mathematical model provides another way of looking at biological systems and at medical phenomena. There are
clearly a number of advantages to this approach. Mathematics helps to clarify the underlying mechanisms because the process of modeling makes us concentrate on separating the essential from the inessential. A model can be used to investigate situations that can not be easily done by experiment. Mathematics is valuable in testing out ideas. It is a concise but powerful language that allows the `hidden' similarities between different systems to be discovered [6]. Mathematical models are used for comparing, planning, implementing, evaluating, optimizing various detection, preventing therapy and control programs. Moreover, mathematical models are made to fit past and predict future data since these achievements can improve hypotheses. Epidemiology modeling can lead to design and analyze epidemiological surveys, suggest crucial data that should be assembled, identify trends, make general forecasts and evaluate the uncertainty in forecasts [7]. In 1998, Esteva and Vargas [8] formulated the mathematical model of dengue disease. They assumed the total human and vector populations had constant sizes. The standard dynamical modeling method was used for analyzing their model. In 1999, Esteva and Vargas [9] developed the mathematical model by considering human and mosquitoes. The total human were not constant. They supposed that the human can be infected only one time. In 2008, we constructed the dynamical model of dengue disease by considering the incubation of dengue virus [10]. In 2011, we studied the monthly distribution of dengue disease in the highest epidemic year between 2001 and 2009 and the corresponding fitted curves were found. The basic reproductive number by season of this disease was found and analyzed [11]. In 2012, we formulated and analyzed the dynamical equations for the transmission of Malaria with the effect of Plasmodiums’ incubations when there is the movement of population at the local level [12]. In this study, we consider the dynamical changes for the transmission of dengue disease when there is the commutation of population and mosquitoes to see the parameters effect to the transmission of this disease. The remainder of the paper is organized as follows: In section II, Dynamical equations of dengue disease is presented. In section III, Analysis of our dynamical equations is shown. Finally, in section IV, Discussion and conclusion are given. DYNAMICAL EQUATIONS OF DENGUE DISEASE
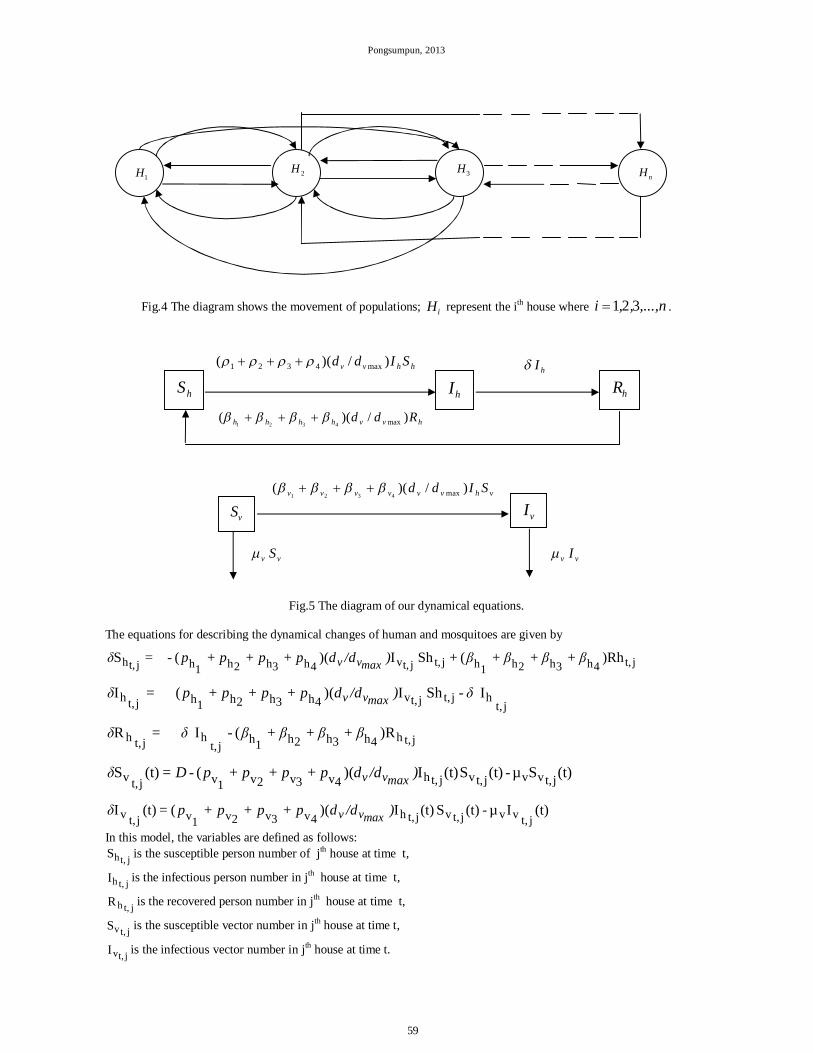
Dengue virus can transmit to the human by biting of the vector population. Therefore the considered variables are human and vector populations. Human is separated into three classes; susceptible, infected and recovered populations. Vector is separated into two classes; susceptible and infected populations because mosquitoes never recovered from infection. The distinction between four serotypes of dengue virus is considered. The distant at mosquito can fly is considered. We suppose that in the beginning time, there is only one infected person. The people and mosquito can travel to any houses as shown in fig.4. The people will come back to their houses at the end time. The idea of constructing our dynamical equations can be shown in the following diagram.
serotype 1 43%
serotype 232%
serotype 313%
serotype 412%
58
Pongsumpun, 2013
Fig.4 The diagram shows the movement of populations; iH represent the ith house where ,...,n,,i 321 .
Fig.5 The diagram of our dynamical equations.
The equations for describing the dynamical changes of human and mosquitoes are given by
)Rh+++(+Sh I)(+++(-=S jt,4h3h2h1hjt,jt,v4h3h2h1hjt,h ββββ)/ddppppδ maxvv
jt,hjt,jt,v4h3h2h1hjt,h I-Sh I)(+++( =I δ)/ddppppδ maxvv
)R+++(-I =R jt,h4h3h2h1hjt,hjt,h ββββδδ
(t)Sµ-(t)S (t)I)(+++(-=(t)S jt,vvjt,vjt,h4v3v2v1vjt,v )/ddppppDδ maxvv
(t)Iµ-(t)S (t)I)(+++(=(t)Ijt,vvjt,vjt,h4v3v2v1vjt,v )/ddppppδ maxvv
In this model, the variables are defined as follows:
jt,hS is the susceptible person number of jth house at time t,
jt,hI is the infectious person number in jth house at time t,
jt,hR is the recovered person number in jth house at time t,
jt,vS is the susceptible vector number in jth house at time t,
jt,vI is the infectious vector number in jth house at time t.
hS
hI
hR
vS vI
hhvv SIdd )/)(( max4321 hI
vhvvvvvv SIdd )/)(( max4321
vv I vv S
hvvhhhh Rdd )/)(( max4321
1H 2H
nH3H
59

J. Basic. Appl. Sci. Res., 3(7)56-65, 2013
Parameters Definition
1hp Transmission probability of dengue virus serotype D1 from mosquito to human
2hp Transmission probability of dengue virus serotype D2 from mosquito to human
3hp Transmission probability of dengue virus serotype D3 from mosquito to human
4hp Transmission probability of dengue virus serotype D4 from mosquito to human
1vp Transmission probability of dengue virus serotype D1 from human to mosquito
2vp Transmission probability of dengue virus serotype D2 from human to Mosquito
3vp Transmission probability of dengue virus serotype D3 from human to Mosquito
4vp Transmission probability of dengue virus serotype D4 from human to Mosquito
1hβ Rate at which the recovered person can be susceptible human to dengue virus serotype D1
2hβ Rate at which the recovered person can be susceptible human to dengue virus serotype D2
3hβ Rate at which the recovered person can be susceptible human to dengue virus serotype D3
4hβ Rate at which the recovered person can be susceptible human to dengue virus serotype D4
δ Recovery rate of dengue cases
D Constant recruitment rate of mosquitoes
v Death rate of mosquitoes
hN The total population
L The number of house
vd The distance at which mosquitoes can fly
maxvd The maximum distance at which mosquitoes can fly
E The ending time
Table 1. Definition of parameters in our dynamical equations.
ANALYSIS OF OUR DYNAMICAL EQUATIONS We simulate our dynamical equations by considering the different situations as follows:
Fig.6 Numerical simulations of infectious number for our dynamical equations.
05
1015202530354045
1 20 39 58 77 96 115 134 153 172 191
Infe
ctio
us h
uman
Time(day)
1000 pop.
2000 pop.
3000 pop.
4000 pop.
60

Pongsumpun, 2013
The different total human population is analyzed. The parameters are 1hp = 0.08,
2hp = 0.07, 3hp = 0.06,
4hp
= 0.05, 1vp = 0.08,
2vp = 0.07, 3vp = 0.06,
4vp = 0.05, 1hβ = 1/30,
2hβ = 1/40, 3hβ = 1/50,
4hβ = 1/60,
δ = 1/7, D = 100, v = 1/35, L = 50, vd = 100, maxvd = 400.
Fig.7 Numerical simulations of infectious number for our dynamical equations.
The different number of houses is analyzed. The parameters are 1hp = 0.08,
2hp = 0.07, 3hp = 0.06,
4hp =
0.05, 1vp = 0.08,
2vp = 0.07, 3vp = 0.06,
4vp = 0.05, 1hβ = 1/30,
2hβ = 1/40, 3hβ = 1/50,
4hβ = 1/60, δ
= 1/7, D = 100, v = 1/35, hN = 1,000, vd = 100, maxvd = 400.
Fig.8 Numerical simulations of infectious number for our dynamical equations.
0
5
10
15
20
25
30
35
40
1 20 39 58 77 96 115 134 153 172 191
Infe
ctio
us h
uman
Time(day)
50 houses
100 houses
150 houses
200 houses
0
5
10
15
20
1 20 39 58 77 96 115 134 153 172 191
Infe
ctio
us h
uman
Time(day)
dv = 100
dv = 200
dv = 300
dv = 400
61

J. Basic. Appl. Sci. Res., 3(7)56-65, 2013
The different distant at which the mosquito can fly is analyzed. The parameters are 1hp = 0.08,
2hp = 0.07, 3hp
= 0.06, 4hp = 0.05,
1vp = 0.08, 2vp = 0.07,
3vp = 0.06, 4vp = 0.05,
1hβ = 1/30, 2hβ = 1/40,
3hβ = 1/50,
4hβ = 1/60, δ = 1/7, D = 100, v = 1/35, hN = 1,000, L = 50, maxvd = 400.
Fig.9 Numerical simulations of infectious number for our dynamical equations.
The different recovery rate of dengue cases is analyzed. The parameters are 1hp = 0.08,
2hp = 0.07, 3hp = 0.06,
4hp = 0.05, 1vp = 0.08,
2vp = 0.07, 3vp = 0.06,
4vp = 0.05, 1hβ = 1/30,
2hβ = 1/40, 3hβ = 1/50,
4hβ =
1/60, D = 100, v = 1/35, hN = 1,000, L = 50, vd = 100, maxvd = 400.
Fig.10 Numerical simulations of infectious number for our dynamical equations.
0
5
10
15
20
1 20 39 58 77 96 115 134 153 172 191
Infe
ctio
us h
uman
Time(day)
delta = 1/4
delta = 1/5
delta = 1/6
delta = 1/7
0
5
10
15
20
1 50 99 148 197 246 295
Infe
ctio
us h
uman
Time(day)
ph1=0.01,ph2=0.02,ph3=0.03,ph4=0.04ph1=0.02,ph2=0.03,ph3=0.04,ph4=0.05ph1=0.03,ph2=0.04,ph3=0.05,ph4=0.06ph1=0.04,ph2=0.05,ph3=0.06,ph4=0.07
62

Pongsumpun, 2013
The different transmission probability for each dengue serotype is considered. The parameters are 1hβ = 1/30,
2hβ
= 1/40, 3hβ = 1/50,
4hβ = 1/60, D = 100, v = 1/35, hN = 1,000, L = 50, vd = 100, maxvd = 400.
Fig.11 Numerical simulations of infectious number for our dynamical equations.
The distribution of dengue cases by serotype is considered. The parameters are same as fig.7.
Fig.12 Numerical simulations of infectious number for our dynamical equations.
The different constant recruitment rate of vector is considered. The parameters are 1hp = 0.08,
2hp = 0.07, 3hp =
0.06, 4hp = 0.05,
1vp = 0.08, 2vp = 0.07,
3vp = 0.06, 4vp = 0.05,
1hβ = 1/30, 2hβ = 1/40,
3hβ = 1/50,
4hβ = 1/60, v = 1/35, hN = 1,000, L = 50, vd = 100, maxvd = 400.
0
5
10
15
1 50 99 148 197 246 295
Infe
ctio
us h
uman
Time(day)
D1D2D3D4
63

J. Basic. Appl. Sci. Res., 3(7)56-65, 2013
Fig.13 Numerical simulations of infectious number for our dynamical equations.
The different number of village in each district is considered. The parameters are 1hp = 0.08,
2hp = 0.07, 3hp =
0.06, 4hp = 0.05,
1vp = 0.08, 2vp = 0.07,
3vp = 0.06, 4vp = 0.05,
1hβ = 1/30, 2hβ = 1/40,
3hβ = 1/50,
4hβ = 1/60, v = 1/35, hN = 1,000, L = 50, vd = 100, maxvd = 400.
Moreover, we include the effect of age structure into our dynamical equations. The numerical solutions can be shown in the following figure:
Fig.14 Numerical simulations of infectious number for our dynamical equations. The age structure of human is considered.
0
1
2
3
4
5
6
7
8
9
1 11 21 31 41 51 61 71 81 91
Infe
ctio
us h
uman
Time(day)
0-4 years old
5-9 years old
10-14 years old
15-24 years old
64

Pongsumpun, 2013
DISCUSSION AND CONCLUSION The numerical solutions of our dynamical equations are considered for the different situations as shown in fig.6-10
and fig.12. The different total population, total number of houses, the distant at the vector can fly, the recovery rates, the transmission probabilities of dengue virus and the constant recruitment rate of vector are considered. The highest dengue incidence number of dengue cases is increasing when there are the greater number of total population, the greater number of houses, the higher distant at the vector can fly, the higher recovery rate, the higher transmission probability of dengue virus, the higher constant recruitment rate of vector. The outburst of epidemic is longer when there are the smaller number of total population, the smaller number of houses, the smaller distant at the vector can fly, the shorter recovery rate, the smaller transmission probability of dengue virus, the smaller constant recruitment rate of vector. Fig.11 shows the simulation of dengue cases by serotype. We can see that the dengue cases due to dengue serotype 1 is higher than serotype 2, serotype 3 and serotype 4 corresponding to fig.5. Furthermore, we consider the distribution of dengue cases in one district as shown in fig.12. We found that the epidemic size will be higher when there is the smaller number of villages. The outburst of epidemic is longer when there is the higher number of villages. Fig.14 shows the distribution of dengue cases when the age structure is included. We can see that epidemic size of dengue is occurred in the person 15-24 years old, 10-14 years old, 5-9 years old, 25-34 years old, >= 35 years old and 0-4 years old, respectively. The result corresponds to fig.2. This study analyzes the distribution of dengue cases for the different situation when there is the travel of population and mosquito. The results should suggest the method for reducing the outbreak of this disease.
ACKNOWLEDGMENT
This work is supported by Faculty of Science, King Mongkut’s Institute of Technology Ladkrabang, Thailand.
REFERENCES
[1] Prevention and Control of Dengue and Dengue Haemorrhagic Fever : Comprehensive Guidelines, WHO Regional Publication, SEARO,No.29.
[2] Bailey N.T.J. The Mathematical theory of infectious disease.2nd ed. Hafner, New York; 1975.
[3] http://w3.whosea.org/denguebulletin21/review2.htm
[4] Rojanapithayakorn W. Dengue haemorrhagic fever in Thailand. Dengue Bulletin.1998; Available from http://w3. whosea. org/ DengueBulletin22 /ch11.htm.
[5] Annual Epidemiological Surveillance Report, 1958-2011, Division of Epidemiology, Ministry of Public Health, Royal Thai Government.
[6] http://www.maths.mq.edu.au/texdev/MathSymp/McElwain/node2.html
[7] Hethcote H.W. The Mathematics of infectious diseases. Siam Rev 2000; 42: 599-653.
[8] Esteva L. and Vargas C.,“Analysis of a dengue disease transmission model”, Mathematical Biosciences, vol.150, pp.132-151, 1998.
[9] Esteva L. and Vargas C., “A model for dengue disease with variable human population” Journal of Mathematical Biology, vol.38, pp.220-240, 1999.
[10] P.Pongsumpun and I.M.Tang, “Effect of the seasonal variation in the extrinsic incubation period on the long term behaviour of the dengue hemorrhagic fever epidemic”, International Journal of Biological and Medical Sciences, vol.3(3), pp.208-214, 2008.
[11] P.Pongsumpun, Seasonal Transmission Model of Dengue Virus Infection in Thailand, Journal of Basic and Applied Scientific Research 2011, 1(10); pp.1372-1379.
[12] P.Pongsumpun, Studying the dynamical network of Malaria at the local level with the effect of Plasmodiums’ incubations, Journal of Basic and Applied Scientific Research 2012, 2(11) ;11935 -11926 .
65