the human factor in data protection - ponemon institute · the human factor in data protection ......
TRANSCRIPT

The Human Factor in Data Protection
Ponemon Institute© Research Report
Sponsored by Trend Micro Independently conducted by Ponemon Institute LLC Publication Date: January 2012

Ponemon Institute© Research Report Page 1
The Human Factor in Data Protection Ponemon Institute, January 2012
Part 1. Introduction Ponemon Institute is pleased to present the results of The Human Factor in Data Protection. Sponsored by Trend Micro, this research focuses on how employees and other insiders can put sensitive and confidential information at risk and what organizations are doing to reduce this risk. We believe the threats posed by insiders are becoming more prevalent because of the mobility of the workforce, proliferation of mobile data-bearing devices, consumerization of IT and use of social media in the workplace. The study surveyed 709 IT and IT security practitioners (hereafter referred to as IT practitioners) in the United States. On average, respondents have more than 10 years of relevant experience. Only IT practitioners who have some level of responsibility for data protection in the organization participated in this study. Forty-five percent of respondents are at the manager level or higher in the organization. Seventy-eight percent are in organizations with a headcount between 100 and 5,000. We also examine if there are any differences with respect to the human factor risk between organizations that are larger (those with a headcount of more than 100) and smaller organizations (referred to as a small-to-medium sized business or SMB). According to 78 percent of respondents, their organizations have experienced a data breach as a result of negligent or malicious employees or other insiders. Employees losing laptops or other mobile devices, mishandling of data at rest and in motion and malicious employees or other insiders are the root causes of many of these data breaches in organizations. To manage the human factor risk, organizations are turning to such enabling technologies as access governance, endpoint security management, SIEM and security intelligence among others. Unfortunately, it seems that even when employees make unintentional mistakes most of these breaches are only discovered accidentally. Rarely do employees self-report the incident. While technologies are important in data protection, so is it critical for organizations to reduce the risk of employee negligence or maliciousness through policies, training, monitoring and enforcement. The following are 10 risky practices employees routinely engage in, according to the findings of the study: 1. Connecting computers to the Internet through an insecure wireless network. 2. Not deleting information on their computer when no longer necessary. 3. Sharing passwords with others. 4. Reusing the same password and username on different websites. 5. Using generic USB drives not encrypted or safeguarded by other means. 6. Leaving computers unattended when outside the workplace. 7. Losing a USB drive possibly containing confidential data and not immediately notifying their
organization. 8. Working on a laptop when traveling and not using a privacy screen. 9. Carrying unnecessary sensitive information on a laptop when traveling. 10. Using personally owned mobile devices that connect to their organization’s network. The next section reports the key findings of our independently conducted survey research. The results provide guidance on how organizations can best address the human factor in data protection and reduce the likelihood of a data breach.

Ponemon Institute© Research Report Page 2
Part 2. Key findings Employee negligence or maliciousness is the root cause of many data breaches. According to Pie Chart 1, over 78 percent of respondents say negligent or malicious employees or other insiders have been responsible for at least one data breach within their organizations over the past two years. Pie Chart 2 shows most respondents say their organization’s sensitive or confidential business information is protected fully (24 percent) or partially (43 percent) by data protection technologies such as encryption and data loss prevention (DLP). Pie Chart 1: Has your organization ever experienced a data breach as a result of negligent or malicious employees or other insiders?
Pie Chart 2: In general, is your organization’s sensitive or confidential business information protected by encrypted or other data protection technologies?
78%
9%
13%
Yes No Unsure
24%
43%
29%
4%
Fully protected Partially protected
Not protected Unsure

Ponemon Institute© Research Report Page 3
As shown in Bar Chart 1, the top three root causes of these breaches are employees’ loss of a laptop or other mobile data-bearing devices, third party mishaps or flubs and system glitches. Despite growing concerns about cyber crime, only 8 percent report an external attack as the primary root cause of a data breach experienced by their organizations. Bar Chart 1: What were the root causes of data breach incidents experienced by your organization over the past 12 to 24 months? Only two choices permitted
8%
22%
23%
27%
29%
32%
35%
0% 5% 10% 15% 20% 25% 30% 35% 40%
External cyber attack
Malicious employees or other insiders
Mishandling of data in motion
Mishandling of data at rest
System glitches
Third party mishaps or flubs
Loss of laptops or other mobile devices

Ponemon Institute© Research Report Page 4
If employees are reluctant to self-report a data breach, organizations need better technologies to know when a breach has occurred so that an incident response plan can be quickly put in motion. Bar Chart 2 reveals that detection or discovery of these data breaches is most often accidental, according to 56 percent of respondents. Unfortunately, only 19 percent of respondents say that employees self-reported the data breach making it difficult to promptly resolve the breach. Thirty-seven percent say that an audit or assessment revealed the incident and 36 percent say that data protection technologies revealed the breach. Bar Chart 2: How were the data breaches detected or discovered by your organization? More than one choice permitted
5%
9%
19%
28%
36%
37%
56%
0% 10% 20% 30% 40% 50% 60%
Legal or consumer advocate
Government regulator
Self-reported by employee
Customer or consumer report
Data protection technologies
Audit or assessment
Accidental discovery

Ponemon Institute© Research Report Page 5
Certain data security technologies and governance practices are considered very important in preventing a data breach. Bar Chart 3 shows that access governance, endpoint security management, security intelligence, encryption of data at rest and data loss prevention are the top security technologies considered most important in reducing data loss or theft. Bar Chart 3: What are the most important data security technologies deployed by your organization to protect sensitive or confidential business information. Very important and important combined
48%
49%
49%
57%
57%
60%
60%
61%
63%
64%
65%
67%
76%
0% 10% 20% 30% 40% 50% 60% 70% 80%
Content aware firewalls
Policy management
Database scanning
Virtual private network
Anti-virus/anti-malware
Intrusion detection
Intrusion prevention
Encryption of data in motion
Data loss prevention
Encryption of data at rest
Security intelligence
Endpoint security management
Access governance

Ponemon Institute© Research Report Page 6
The governance practices that are most important, according to Bar Chart 4, are establishing a data protection team, obtaining sufficient resources for implementing data protection activities and appointing a leader in-charge of data protection across the entire organization. Bar Chart 4: What are the most important governance practices deployed by your organization to protect sensitive or confidential business information. Very important and important response
39%
42%
46%
52%
55%
63%
64%
68%
70%
74%
0% 10% 20% 30% 40% 50% 60% 70% 80%
Establish data classification scheme
Conduct data inventories
Define policies, procedures and guidelines
Establish governance council
Provide training & awareness
Obtain high level support
Conduct compliance monitoring
Appoint leader with enterprise responsibility
Obtain sufficient resources
Establish a data protection team

Ponemon Institute© Research Report Page 7
To address the human factor in data protection, specific security and governance procedures are preferred. Table 1 lists the data protection and security measures employed by many organizations in terms of importance. Accordingly, the most important security measure is to manage and monitor end-user privileges and entitlements followed by criminal background checks before granting privileged access and the consistent application of security governance practices. Table 1: Data protection and security measures
High importance
Manage and monitor end-user privileges and entitlements 80% Conduct criminal background checks before granting privileged access 57% Ensure security governance practices are consistently applied 52% Attract and retain high quality IT security personnel 48% Train employees about IT security policies and procedures 47% Enforce security and data protection policies 45% Obtain intelligence about probable attacks or advance threats 36% Ensure security administration is consistently managed 35% Conform with leading IT security frameworks 35% Ensure encryption keys or tokens are adequately secured 35% Ensure that third parties are properly vetted before data sharing 31% Manage and monitor end-user access to Internet apps 31% Control all live data used in systems development activities 30% Perform timely security patches and updates 29% Limit physical access to servers and data storage devices 29% Prevent or curtail hacking attempts, including penetration testing 29% Provide security status updates to executive management 28% Manage off-line data-bearing devices including their safe disposal 27% Manage the efficiency of IT operations 25% Ensure compliance requirements for data protection are met 22% Prevent or curtail denial of service attacks 22% Prevent or curtail viruses, botnets and malware infections 22% Minimize downtime or disruptions to data center operations 22% Ensure that all data entrusted to third parties are secure 20% Create and update security and data protection policies 16% Manage the procurement of IT assets across the entire organization 16% Audit applications, networks and enterprise systems 15%

Ponemon Institute© Research Report Page 8
IT practitioners’ perceptions about security activities, infrastructure, priorities and strategies provide insight into the vulnerabilities organizations must address. Bar Chart 5 shows that the majority of respondents (67 percent) believe that their organizations’ security activities are not enough to stop a targeted attack (or Advanced Persistent Threat) or a hacker. Sixty percent of respondents do not agree that their organizations’ data security activities thoroughly protect information assets from negligent or malicious insiders. Bar Chart 5: Attributions about organizations’ security activities Strongly agree and agree response
With respect to the security infrastructure, Bar Chart 6 shows 64 percent of respondents agree that their organization needs to re-architect their security infrastructure because someone (hacker or malicious insider) is trying to steal data and 62 percent say the infrastructure needs to focus on data-centric (inside-out) security with sensitive or confidential data being the main element. Bar Chart 6: Attributions about security infrastructure Strongly agree and agree response
32%
38%
40%
67%
0% 10% 20% 30% 40% 50% 60% 70% 80%
Data security activities in my organization do not interfere with operations and business activities.
Moving data to the cloud only happens if it is fully secured first by our organization.
Data security activities in my organization thoroughly protect information assets from
negligent or malicious insiders.
My organization’s current security activities are not enough to stop a targeted attack (or
Advanced Persistent Threat).
62%
64%
0% 10% 20% 30% 40% 50% 60% 70%
My organization’s security infrastructure needs to focus on data-centric (inside-out) security with
sensitive or confidential data being the main element.
My organization needs to re-architect our security infrastructure because someone (hacker
or malicious insider) is trying to steal data.

Ponemon Institute© Research Report Page 9
Respondents’ ranking of security priorities is shown in Bar Chart 7. A high data protection priority in organizations is data intelligence that identifies the “who, what, when and how” data is accessed. Another priority is not to trust anyone internally and definitely not anyone externally. Bar Chart 7: Attributions about security priorities Strongly agree and agree response
As reported in Bar Chart 8, security strategies cannot be viewed as a hindrance to business operations and practices, according to 81 percent of respondents. Strategies also need to focus on consumerization of IT and insecure mobile devices accessing corporate applications and data assets. Bar Chart 8: Attributions about security strategies Strongly agree and agree response
38%
41%
54%
58%
60%
0% 10% 20% 30% 40% 50% 60% 70%
The encryption of sensitive or confidential information is a top data protection priority.
Data protection is a top priority.
Threat Intelligence that identifies attacks early in their lifecycle is a high data protection priority.
My organization’s security philosophy is one of zero trust.
Data Intelligence that identifies the “who, what, when and how” data is accessed is a high data
protection priority.
60%
67%
81%
0% 10% 20% 30% 40% 50% 60% 70% 80% 90%
To be effective, our security strategy needs to have a strong layered defense coupled with a
strong data protection solution.
To be effective, our security strategy needs to focus on consumerization of IT and insecure
mobile devices accessing corporate applications and data assets.
To be effective, our security strategy cannot be viewed as a hindrance to business operations
and practices.

Ponemon Institute© Research Report Page 10
Employees’ lack of attention to data protection combined with an increase in sensitive data on mobile devices is putting sensitive and confidential information at risk. Bar Chart 9 shows employees very frequently (19 percent) or frequently (37 percent) store sensitive data on their laptops, smartphones, tablets and other mobile devices. Bar Chart 9: How frequently do employees carry sensitive data on their laptops, smartphones, tablets or other mobile devices?
According to Bar Chart 10, 56 percent of respondents say employees spend no time on data protection activities and 25 percent say it is an insignificant amount of time. Bar Chart 10: What statement best describes the amount of time employees spend on data protection activities each day?
19%
37%
10%
15% 19%
0%
5%
10%
15%
20%
25%
30%
35%
40%
Very frequently Frequently Not frequently Rarely Never
9% 10%
25%
56%
0%
10%
20%
30%
40%
50%
60%
Significant amount of time
Cannot determine Insignificant amount of time
No time

Ponemon Institute© Research Report Page 11
Employees are often in non-compliance with organizations’ data protection policies. Bar Chart 11 shows that while respondents cite the majority of employees do not turn off or disengage security settings and understand and proactively comply with their organization’s data protection policy, other risky behaviors are proving to be barriers to safeguarding data in the workplace. As mentioned in the introduction, there are risky behaviors that can lead to the loss or theft of sensitive and confidential information. Specifically, it is rare for employees to notify their organization after losing a USB drive containing data is lost. It is also rare for employees to shred paper documents containing confidential or sensitive information. Bar Chart 11: Human factor security mishaps Already happened or very likely to happen response (high prevalence)1
1The survey questions pertaining to human factor risk were framed in the positive – that is, what employees do that decrease human factor security mishaps. The percentages presented in Bar Chart 11 are framed in the negative – that is, what employees do that increase the likelihood of a security mishap. Accordingly, the percentages shown in this chart is simply 1 – the original percentage value.
40% 41%
43% 44% 46% 47% 48% 48% 49% 51% 51% 52% 52% 54% 55%
59% 60% 61% 62% 63% 64% 65% 66% 68% 70% 71% 72% 74% 76%
87%
0% 20% 40% 60% 80% 100%
Disengage security settings Do not understand data protection policies
Open attachments or web-links in spam Download unapproved apps
Visit websites that are considered off limits Use web-based personal email at work
Use cloud services without obtaining permission Set the browser’s security setting at a low level
Do not routinely back-up data Divulge business issues in social networks
Do not turn-off wireless connections Do not keep AV/AM software current
Do not notify quickly when computer is missing Use social media for personal reasons at work
Send confidential emails that are not encrypted Connect through insecure wireless networks Do not delete extraneous data on computer
Do not properly shut down computer Use insecure USB drives to store/transfer data
Share passwords with other employees Do not mask computer screen in public venues
Leave computer unattended Use personal device to connect to the network
Do not shred paper documents Carry confidential business data when traveling
Do not use complex passwords or smart keys Hibernate computer when it is not in use
Reuse the same passwords and usernames Do not change passwords frequently
Do not notify anyone when a USB drive is lost

Ponemon Institute© Research Report Page 12
Part 3. Differences between smaller and larger-sized businesses Are smaller-sized companies (a.k.a. SMB) at a greater risk than larger-sized companies (a.k.a. enterprise) due to the human factor? To find out, we conducted a separate analysis of this group of respondents who self-report that they work in organizations with less than 100 employees. In total, 161 individuals or 23 percent of the overall sample are employed by SMBs. The remaining 548 respondents are employed by enterprise-sized organizations. As a result, the percentages in Bar Chart 11, which represent the entire sample, will differ than those in Bar Chart 12. In general, we find that human factor risks are more prevalent in SMBs than enterprise entities. Bar Chart 12 shows the 10 human factor risk categories with the widest gaps between small and large organizations. In every case, we see the SMB subsample reporting a higher percentage response than the enterprise subsample. Specifically, we see the largest difference (19 percent) on “employees open attachments or web-links in spam.” The second largest gap (15 percent) concerns “employees leave computer unattended,” and a 14 percent gap for “employees do not change passwords frequently.” There is a gap of 12 percent for “employees who visit websites that are considered off limits.” Bar Chart 12: Human factor differences between SMB and Enterprise organizations Already happened or very likely to happen response (high prevalence)
43%
46%
49%
39%
51%
58%
63%
62%
73%
73%
55%
57%
57%
58%
62%
68%
71%
77%
80%
87%
0% 10% 20% 30% 40% 50% 60% 70% 80% 90% 100%
Visit websites that are considered off limits
Do not routinely back-up data
Divulge business issues in social networks
Open attachments or web-links in spam
Use social media for personal reasons at work
Do not delete extraneous data on computer
Do not mask computer screen in public venues
Leave computer unattended
Reuse the same passwords and usernames
Do not change passwords frequently
SMB (less than 100 employees) Enterprise (equal or greater than 100 employees)
Ponemon Institute© Research Report Page 13
Other salient differences between these two groups are as follows: § Smaller organizations have a slightly higher rate of data breaches (81 percent vs. 78 percent)
due to negligent or malicious employees or other insiders. § The main causes of breaches, according to respondents in smaller organizations, are system
glitches and employees’ mishandling of data in motion. In contrast, respondents in larger organizations say it is the loss of a laptop or other mobile data-bearing device followed by third party mishaps or flubs.
§ The majority of organizations say that data breaches are discovered or detected by accident.
However, smaller organizations are more likely to have customers or consumers report the incident. Larger organizations are more likely to discover the incident through an audit or compliance assessment followed by data protection technologies.
§ The majority (65 percent) of smaller organizations say that in general their organizations’
sensitive or confidential business information is not encrypted or safeguarded by data loss protection technologies. Further, employees are less likely in smaller organizations to spend time on data protection activities.

Ponemon Institute© Research Report Page 14
Part 4. Methods A random sampling frame of 22,593 adult-aged individuals who reside within the United States was used to recruit and select participants to this survey. Our randomly selected sampling frame was built from proprietary lists of highly experienced IT and IT security practitioners with bona fide credentials. As shown in Table 2, 891 respondents completed the survey. Of the returned instruments, 69 surveys failed reliability checks. A total of 822 surveys were available before screening. Three screening questions were used to remove respondents who did not have relevant experience or knowledge to rate their organizations’ data protection activities. This resulted in a final sample of 709 individuals. Table 2. Sample response Freq. Pct% Sampling frame 22593 100.0% Total returns 891 3.9% Rejected surveys 69 0.3% Total sample before screening 822 3.6% Final sample 709 3.1%
Table 3 reports the respondent’s organizational level within participating organizations. By design, 62 percent of respondents are at or above the supervisory levels. On average, respondents had 10.5 years of overall experience in the IT or IT security fields. Table 3. Respondents’ position level Pct% Senior Executive 3% Vice President 1% Director 18% Manager 23% Supervisor 17% Associate/Staff 33% Other (please describe) 5% Total 100%
Table 4 shows that the most frequently cited reporting channels among respondents are the CIO (48 percent), CEO/president (11 percent) and business owner (11 percent). Table 4. Respondents’ primary reporting channel Pct% Business owner 8% CEO/President 11% Chief Financial Officer 11% Chief Information Officer 48% Compliance Officer 4% Chief Privacy Officer 0% Director of Internal Audit 2% General Counsel 0% Chief Technology Officer 6% Human Resources VP 2% Chief Security Officer 1% Chief Risk Officer 6% Other (please describe) 1% Total 100%
Ponemon Institute© Research Report Page 15
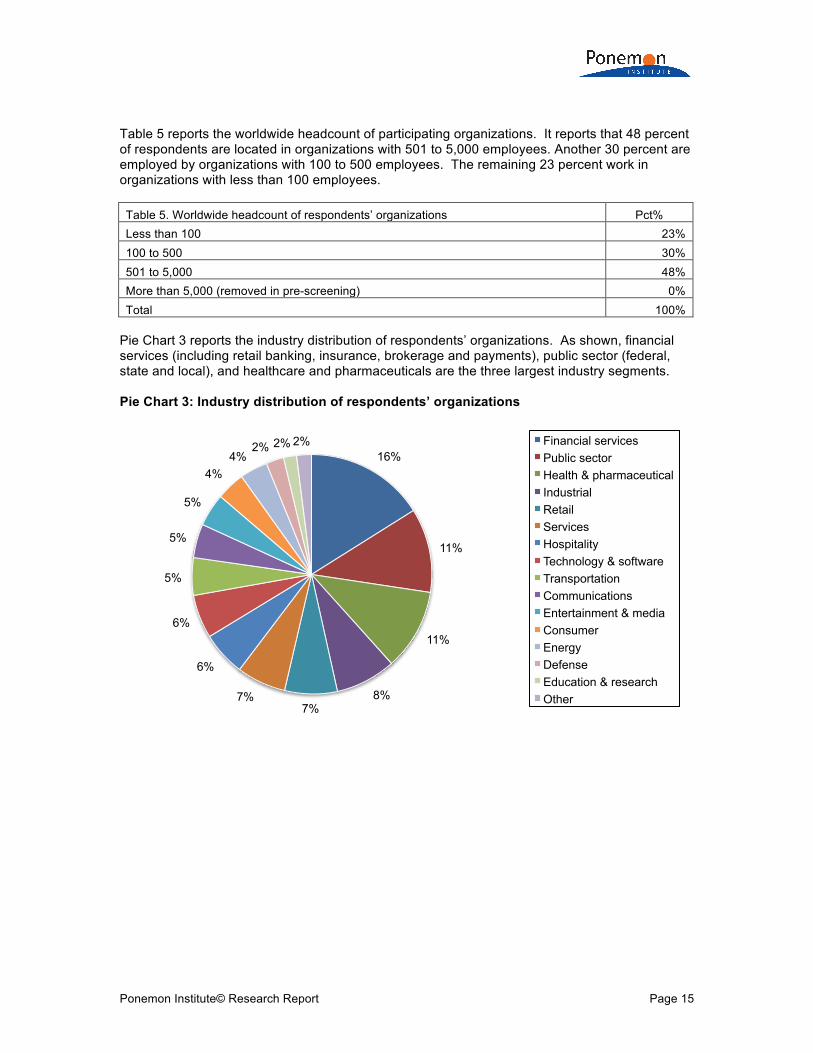
Table 5 reports the worldwide headcount of participating organizations. It reports that 48 percent of respondents are located in organizations with 501 to 5,000 employees. Another 30 percent are employed by organizations with 100 to 500 employees. The remaining 23 percent work in organizations with less than 100 employees. Table 5. Worldwide headcount of respondents’ organizations Pct% Less than 100 23% 100 to 500 30% 501 to 5,000 48% More than 5,000 (removed in pre-screening) 0% Total 100%
Pie Chart 3 reports the industry distribution of respondents’ organizations. As shown, financial services (including retail banking, insurance, brokerage and payments), public sector (federal, state and local), and healthcare and pharmaceuticals are the three largest industry segments. Pie Chart 3: Industry distribution of respondents’ organizations
16%
11%
11%
8% 7%
7%
6%
6%
5%
5%
5%
4% 4%
2% 2% 2% Financial services Public sector Health & pharmaceutical Industrial Retail Services Hospitality Technology & software Transportation Communications Entertainment & media Consumer Energy Defense Education & research Other

Ponemon Institute© Research Report Page 16
Part 5. Conclusion Based on the findings, it is recommended that organizations take the following steps: § Create awareness among employees and other insiders about the need to spend more time
and effort on data protection activities. § Ensure data protection policies address areas where an organization is most vulnerable to a
data breach. § Investigate governance and technology solutions that are both efficient and cost effective. § Make sure those who are given privileged user status are knowledgeable about the risks. § Require immediate notification if a mobile device containing sensitive and confidential
information is lost or stolen. § Create policies for the use of social media in the workplace.
The human factor risk, from both internal and external sources, poses a very real threat to an organization’s sensitive and confidential information. The risk of data breach, as shown in this study, is especially great due to employees’ loss of a laptop or other mobile data-bearing devices. Given the potential for a costly data breach and loss of reputation due to the exposure of confidential information, we believe it is critical for companies to expand the focus of their data security initiatives to ensuring employees and other insiders understand the importance of data protection. Caveats There are inherent limitations to survey research that need to be carefully considered before drawing inferences from findings. The following items are specific limitations that are germane to most web-based surveys. § Non-response bias: The current findings are based on a sample of survey returns. We sent
surveys to a representative sample of individuals in IT and IT security located in the United States, resulting in a large number of usable returned responses. Despite non-response tests, it is always possible that individuals who did not participate are substantially different in terms of underlying beliefs or perceptions about data protection activities from those who completed the instrument.
§ Sampling-frame bias: The accuracy is based on contact information and the degree to which the sample is representative of individuals in the IT and IT security fields. We also acknowledge that the results may be biased by external events.
We also acknowledge bias caused by compensating respondents to complete this research within a holdout period. Finally, because we used a web-based collection method, it is possible that non-web responses by mailed survey or telephone call would result in a different pattern of findings.
§ Self-reported results: The quality of survey research is based on the integrity of confidential responses received from subjects. While certain checks and balances can be incorporated into the survey process, there is always the possibility that certain respondents did not provide accurate responses.

Ponemon Institute© Research Report Page 17
Appendix: Detailed Survey Results
The following tables provide the frequency or percentage frequency of responses to all survey questions contained in this study. All survey responses were captured over a four-week period ending in November 2011. Sample response Freq. Pct% Sampling frame 22593 100.0% Total returns 891 3.9% Rejected surveys 69 0.3% Total sample before screening 822 3.6% Final sample 709 3.1% Part 1. Screening S1. What best describes your direct reporting channel within the IT organization. Freq. Pct% I report directly through the IT organization 436 53% I have dual reports, one of which includes the IT organization 172 21% I work in a small business that does not have an IT organization 191 23% I do not report through the IT organization (stop) 23 3% Total 822 100% S1. Does your job involve the protection of sensitive or confidential business information? Freq. Pct% Yes 748 94% No (stop) 51 6% Total 799 100% S3. What best defines your job function? Freq. Pct% I am responsible for ensuring the protection of data in my organization 144 19% I am fully committed to data protection activities within my organization 329 44% I am partially committed to data protection activities within my organization 236 32% I am not committed to data protection activities within my organization (stop) 39 5% Total 748 100%

Ponemon Institute© Research Report Page 18
Part 2. Experience Q1. Has your organization ever experienced a data breach as a result of negligent or malicious employees or other insiders? Freq. Pct% Yes 552 78% No (Go to Part 3) 62 9% Unsure (Go to Part 3) 95 13% Total 709 100% Q2. How many data breaches involving sensitive or confidential business information has your organization experienced in the past 12 to 24 months. Pct% None 9% Only 1 24% 2 to 3 32% 4 to 5 13% More than five 9% Unsure 13% Total 100% Q3. What were the root causes of data breach incidents experienced by your organization over the past 12 to 24 months? Please check the top two choices only. Pct% Employees’ loss of a laptop or other mobile data-bearing devices 35% Employees’ mishandling of data at rest 27% Employees’ mishandling of data in motion (transit) 23% Malicious employees or other insiders 22% System glitches 29% External cyber attack 8% Third party mishaps or flubs 32% Unsure 11% Other (please specify) 2% Total 189% Q4. How were the data breaches detected or discovered by your organization? Please select all that apply. Pct% Accidental discovery 56% Employees self-reported the incident 19% Customers or consumers reported the incident 28% Data protection technologies revealed the breach 36% Audit or compliance assessment revealed the incident 37% Privacy or consumer advocates revealed the incident 5% Government regulator revealed the incident 9% Total 190% Q5. In general, is your organization’s sensitive or confidential business information protected by encryption or other data protection technologies? Pct% Yes, the data is fully protected 24% Yes, the data is partially protected 43% No 29% Unsure 4% Total 100%

Ponemon Institute© Research Report Page 19
Q6. Following is a list of 15 data security technologies that your organization may deploy to protect sensitive or confidential business information. Please rate the importance of each technology at reducing data loss or theft using the following scale: 1 = very important, 2 = important, 3 = not important, 4 = irrelevant
Very important Important Combined
Access governance 33% 43% 76% Endpoint security management 31% 36% 67% SIEM, & log management 35% 29% 65% Encryption of data at rest 33% 31% 64% Data loss prevention 27% 36% 63% Protection of data in motion (i.e., email encryption) 29% 32% 61% Intrusion prevention 30% 30% 60% Intrusion detection 31% 29% 60% Anti-virus/anti-malware 26% 32% 57% Virtual private network (VPN) 27% 31% 57% Network & traffic intelligence 19% 31% 50% Database scanning 22% 27% 49% Automated policy management 16% 33% 49% Content aware firewalls 21% 27% 48% Sample subgroups by employee headcount < 501 > 500 If your company has less than 501 employees please skip to Q8. 369 340 Q7. Following is a list of 10 information governance and control activities for larger-sized organizations. Please rate the importance of each activity at reducing data loss or theft using the following scale: 1 = very important, 2 = important, 3 = not important, 4 = irrelevant
Very important Important Combined
Establish a data protection team 36% 38% 74% Obtain sufficient resources for implementing data protection activities 41% 28% 70% Appoint leader in-charge of data protection across the entire organization 34% 34% 68% Conduct on-going monitoring to ensure employees are complying with polices 29% 35% 64% Obtain high level support and sponsorship, preferably from the president or CEO 29% 34% 63% Provide a training and awareness program to raise employee accountability 24% 31% 55% Organize a high-level data protection governance council representing different constituencies 26% 26% 52% Establish clearly defined policies, procedures and guidelines for data protection 21% 25% 46% Conduct a data inventory to determine where information assets are located 18% 24% 42% Establish a data classification process that defines the most confidential or highest value data assets 16% 23% 39% Q8. What statement best describes the amount of time employees spend on data protection activities each day? Pct% Employees spend a significant amount of time on data protection activities 9% Employees spend an insignificant amount of time on data protection activities 25% Employees spend no time on data protection activities. 56% Cannot determine 10% Total 100%

Ponemon Institute© Research Report Page 20
Q9. How frequently do employees carry sensitive data on their laptops, smartphones, tablets or other mobile devices? Pct% Very frequently 19% Frequently 37% Not frequently 10% Rarely 15% Never 19% Total 100% Q10. Typically, how is information communicated or shared with auditors and outside contractors? Pct% Files are encrypted before sharing 23% Files in clear text are shared 45% Auditors or consultants are given access to files and data stores in production systems 18% Other (please specify) 3% Unsure 11% Total 100% Q11. Typically, how is source code and other proprietary information stored and shared? Pct% Information is encrypted at rest and in motion 18% Information is encrypted at rest but not in motion 23% Information is encrypted in motion but not at rest 22% Information is not encrypted 29% Other (please specify) 5% Unsure 3% Total 100% Q12a. In your opinion, does your organization have ample enabling technologies for protecting data assets? Pct% Yes 46% No 54% Total 100% Q12b. If no, why not? Please select all that apply. Pct% Technologies are too expensive 59% Technologies are too complex 48% Technologies are not necessary 26% Technologies are not a priority 37% Other (please specify) 5% Total 175%
Ponemon Institute© Research Report Page 21
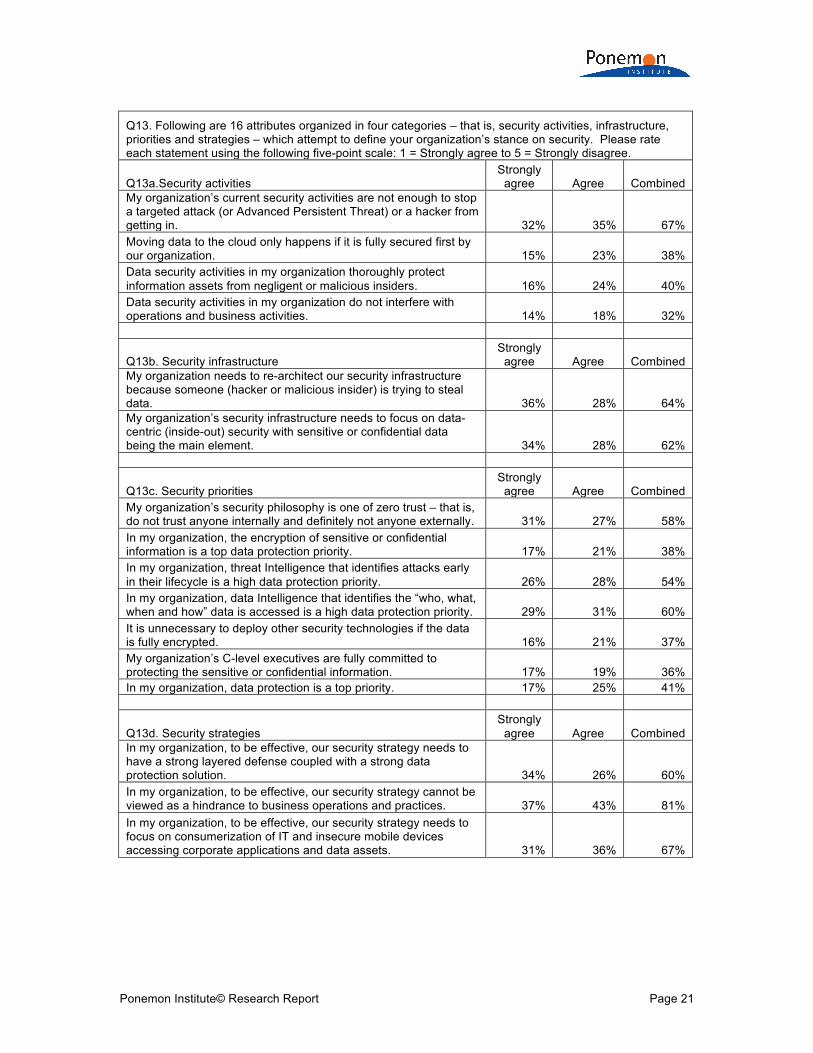
Q13. Following are 16 attributes organized in four categories – that is, security activities, infrastructure, priorities and strategies – which attempt to define your organization’s stance on security. Please rate each statement using the following five-point scale: 1 = Strongly agree to 5 = Strongly disagree.
Q13a.Security activities Strongly
agree Agree Combined My organization’s current security activities are not enough to stop a targeted attack (or Advanced Persistent Threat) or a hacker from getting in. 32% 35% 67% Moving data to the cloud only happens if it is fully secured first by our organization. 15% 23% 38% Data security activities in my organization thoroughly protect information assets from negligent or malicious insiders. 16% 24% 40% Data security activities in my organization do not interfere with operations and business activities. 14% 18% 32%
Q13b. Security infrastructure Strongly
agree Agree Combined My organization needs to re-architect our security infrastructure because someone (hacker or malicious insider) is trying to steal data. 36% 28% 64% My organization’s security infrastructure needs to focus on data-centric (inside-out) security with sensitive or confidential data being the main element. 34% 28% 62%
Q13c. Security priorities Strongly
agree Agree Combined My organization’s security philosophy is one of zero trust – that is, do not trust anyone internally and definitely not anyone externally. 31% 27% 58% In my organization, the encryption of sensitive or confidential information is a top data protection priority. 17% 21% 38% In my organization, threat Intelligence that identifies attacks early in their lifecycle is a high data protection priority. 26% 28% 54% In my organization, data Intelligence that identifies the “who, what, when and how” data is accessed is a high data protection priority. 29% 31% 60% It is unnecessary to deploy other security technologies if the data is fully encrypted. 16% 21% 37% My organization’s C-level executives are fully committed to protecting the sensitive or confidential information. 17% 19% 36% In my organization, data protection is a top priority. 17% 25% 41%
Q13d. Security strategies Strongly
agree Agree Combined In my organization, to be effective, our security strategy needs to have a strong layered defense coupled with a strong data protection solution. 34% 26% 60% In my organization, to be effective, our security strategy cannot be viewed as a hindrance to business operations and practices. 37% 43% 81% In my organization, to be effective, our security strategy needs to focus on consumerization of IT and insecure mobile devices accessing corporate applications and data assets. 31% 36% 67%

Ponemon Institute© Research Report Page 22
Part 3. Human factors in data protection Q14. Following are 33 data protection practices that employees are encouraged to comply with in many organizations. Please rate each data protection practice using the five-point scale. 1 = Always happens to 5 = Never happens.
Always happens
Frequently happens Combined
Employees do not turn off or disengage security settings. 27% 33% 60% Employees understand and proactively comply with our organization’s data protection policy. 26% 33% 59% Employees do not open attachments or web-links in emails labeled spam. 21% 35% 57% Employees do not download unapproved apps onto their computer. 30% 26% 56% Employees do not visit websites that are considered “off limits” by our organization 29% 25% 54% Employees do not use their web-based personal email for work-related purposes. 25% 28% 53% Employees are not permitted to use a cloud service without obtaining advanced permission. 23% 29% 52% Employees set their browser’s security and privacy at a high level. 19% 33% 52% Employees routinely back-up information contained on their computer 28% 23% 51% Employees do not use a data recovery service that is not approved by our organization 22% 28% 50% Employees do not divulge business issues when using social networks or Internet chat rooms. 24% 25% 49% Employees turn-off wireless connection when Internet access is not in use. 18% 31% 49% Employees keep anti-virus and anti-malware software current. 21% 27% 48% Employees immediately notify their organization when a computer is lost or stolen. 24% 24% 48% Employees do not use social media for personal reasons during the workday. 22% 24% 46% Employees do not send or receive confidential email messages that are not encrypted. 18% 27% 45% Employees do not connect their computer to the Internet through an insecure wireless network. 22% 19% 41% Employees remove or delete information contained on the computer when no longer necessary. 17% 23% 40% Employees set their computer to shut down if not used after a very short period of time. 19% 20% 39% Employees do not use generic USB drives if not encrypted or safeguarded by other means. 21% 17% 38% Employees never share their password with anyone else. 16% 21% 37% Employees who travel use a privacy shield that masks the screen. 12% 24% 36% Employees do not leave their computers unattended when outside the workplace. 10% 25% 35% Employees do not use personally owned mobile devices that connect to our networks. 19% 15% 34% Employees shred paper documents when they are no longer necessary. 12% 20% 32% Employees do not carry unnecessary information on their computer when traveling or working off-site. 11% 19% 30% Employees protect their computing devices with passwords or smart key. 11% 17% 29% Employees turn off (rather than hibernate) their computer when it is not in use. 9% 19% 28%

Ponemon Institute© Research Report Page 23
Employees avoid reusing the same password and username on different websites. 10% 15% 26% Employees change their passwords frequently. 8% 16% 24% Employees never use the same password twice. 6% 11% 17% Employees immediately notify their organization when a USB drive containing data is lost. 4% 10% 13% Employees use complex passwords or biometrics to prevent unauthorized access. 4% 8% 12% Average 18% 23% 41%

Ponemon Institute© Research Report Page 24
Part 4. Security effectiveness Q15. The following table lists 27 data protection and security measures deployed by many organizations. Please rate each measure using the following: low importance (L), moderate importance (M) and high importance (H) in terms of meeting your organization’s data protection mission or objectives. L M H Manage and monitor end-user privileges and entitlements 5% 15% 80% Manage and monitor end-user access to Internet apps 9% 60% 31% Ensure that third party partners, contractors, and consultants are properly vetted 21% 48% 31% Ensure criminal background checks are performed before granting privileged access 4% 39% 57% Ensure that all data entrusted to third parties (including cloud services) are secure 20% 59% 20% Prevent or curtail hacking attempts, including penetration testing 5% 67% 29% Obtain intelligence about probable attacks or advance threats 10% 54% 36% Limit physical access to servers and data storage devices 17% 54% 29% Manage the procurement of IT assets across the entire organization 39% 46% 16% Manage off-line data-bearing devices including their safe disposal 16% 57% 27% Perform timely security patches and updates 22% 49% 29% Manage the efficiency of IT operations 47% 28% 25% Minimize downtime or disruptions to data center operations 54% 24% 22% Ensure compliance with legal and regulatory requirements for data protection 43% 35% 22% Conform with leading IT security frameworks 22% 42% 35% Prevent or curtail viruses, botnets and malware infections 35% 43% 22% Control all live data used in systems development activities 10% 60% 30% Create and update security and data protection policies 25% 58% 16% Enforce security and data protection policies 21% 34% 45% Attract and retain high quality IT security personnel 18% 34% 48% Train and educate system users about IT security policies and procedures 6% 47% 47% Conduct audits of applications, networks and enterprise systems 46% 38% 15% Ensure security administration is consistently managed across the organization 26% 38% 35% Prevent or curtail denial of service attacks 47% 31% 22% Ensure encryption keys (or tokens) are adequately secured 19% 46% 35% Ensure security governance practices are consistently applied 13% 35% 52% Provide security status updates to executive management 56% 17% 28% Average 24% 43% 33%

Ponemon Institute© Research Report Page 25
Part 5. Organization characteristics and respondent demographics D1. What organizational level best describes your current position? Pct% Senior Executive 3% Vice President 1% Director 18% Manager 23% Supervisor 17% Associate/Staff 33% Other (please describe) 5% Total 100% D2. Check the Primary Person you or your supervisor reports to within your organization. Pct% Business owner 8% CEO/President 11% Chief Financial Officer 11% Chief Information Officer 48% Compliance Officer 4% Chief Privacy Officer 0% Director of Internal Audit 2% General Counsel 0% Chief Technology Officer 6% Human Resources VP 2% Chief Security Officer 1% Chief Risk Officer 6% Other (please describe) 1% Total 100% D3. Regions Pct% Northeast 19% Mid-Atlantic 18% Midwest 17% Southeast 13% Southwest 13% Pacific-West 19% Total 100% D4. Experience Mean Median D4a. Total years of business experience 10.46 11.00 D4b. Total years in IT or data security fields 8.49 8.50 D4c. Total years in current position 4.31 4.25 D5. Educational and career background: Pct% Compliance (auditing, accountant, legal) 12% IT (systems, software, computer science) 56% Security (law enforcement, military, intelligence) 5% Other non-technical field 18% Other technical field 9% Total 100%

Ponemon Institute© Research Report Page 26
D7. What industry best describes your organization’s industry concentration or focus? Pct% Agriculture 1% Communications 5% Consumer 4% Defense 2% Education & research 2% Energy 4% Entertainment & media 5% Financial services 16% Health & pharmaceutical 11% Hospitality 6% Industrial 8% Public sector 11% Retail 7% Services 7% Technology & software 6% Transportation 5% Other 1% Total 100% D8. What best describes your role in managing privacy and data protection risks within your organization? Check all that apply. Pct% Setting priorities 56% Managing budgets 51% Selecting vendors and contractors 46% Determining privacy and data protection strategy 34% Evaluating program performance 43% Average 46% D9. What is the worldwide headcount of your organization? Pct% Less than 100 23% 100 to 500 30% 501 to 5,000 48% More than 5,000 (removed in pre-screening) 0% Total 100%
Ponemon Institute© Research Report Page 27
Ponemon Institute
Advancing Responsible Information Management Ponemon Institute is dedicated to independent research and education that advances responsible information and privacy management practices within business and government. Our mission is to conduct high quality, empirical studies on critical issues affecting the management and security of sensitive information about people and organizations. As a member of the Council of American Survey Research Organizations (CASRO),we uphold strict data confidentiality, privacy and ethical research standards. We do not collect any personally identifiable information from individuals (or company identifiable information in our business research). Furthermore, we have strict quality standards to ensure that subjects are not asked extraneous, irrelevant or improper questions.