the icelandic model
TRANSCRIPT

© I C S R A 2 0 1 7
The Icelandic Model
Implementation and adaptation
J ON S IG FUSSON
ICELAND IC CENTRE FOR SOCIAL RESEARCH AND ANALYSIS
ICSRA / D P CC
Development of the Model
The pillars of success in practice
International work processes and coordination
How to get started
Opportunities and outcomes
The To-DO list
2

About ICSRA
3

Our main projects
Youth in Iceland from 1992
Youth in Europe from 2006
4

Youth in Iceland database 1992 - 2017
5
One of the most comprehensive databases on youth
world wide.
Creates the knowledge behind the models.

School participation
All primary schools participate (150) 10-16 year old
Response rate around 85%
All high schools participate (30) 16-20 year old
Response rate +70%
6

Over 500 thousand questionnaires
One of the most comprehensive databases about adolescents worldwide
7
Youth in Iceland – The “Lab“

Practical use of findings Cooperation in municipalities with 85% of total population
Guidance programs – long term
Local reports with status + risk/protective factors
Follow up after each data collection in local meetings
Support local prevention work with evidence
8
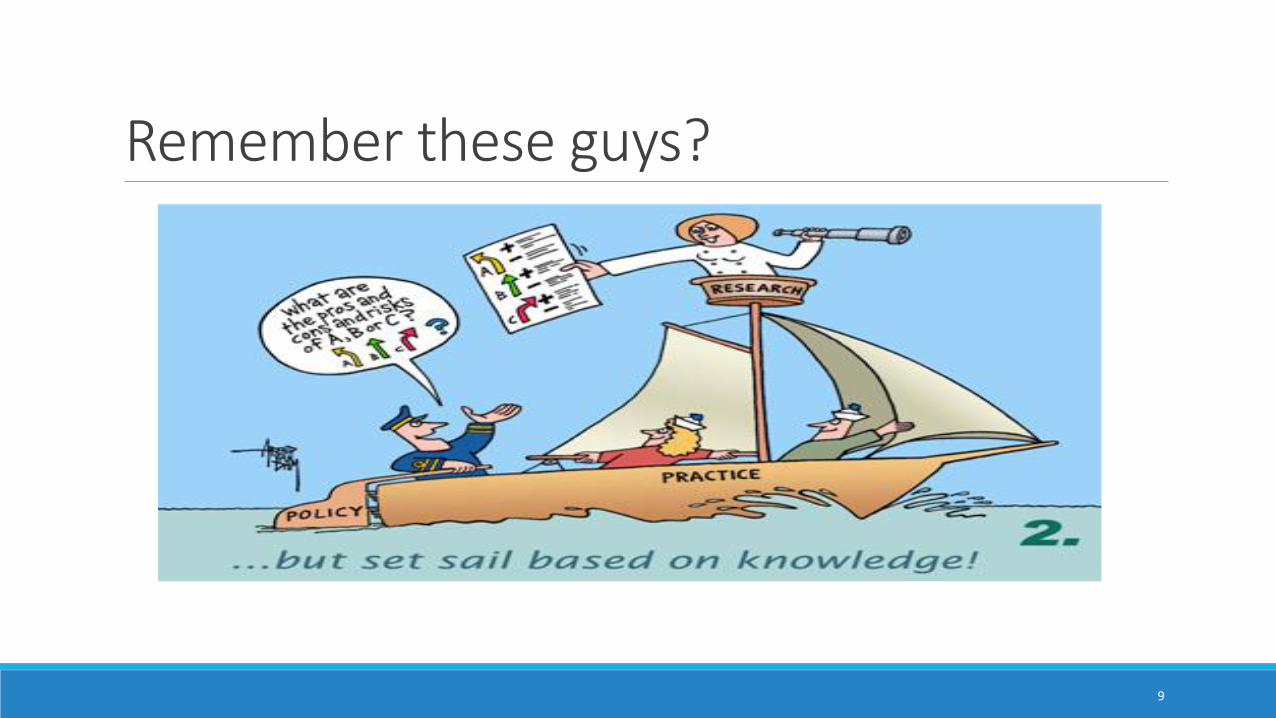
Remember these guys?
9

International development of the Model
10

Youth in Europe – A Drug Prevention Program initiated in 2006
11
42
35
32 33
26 28
26
22 23
19
16 15 14 14 12
11
17
15
12 11 12 13
9 9
0
5
10
15
20
25
30
35
40
45
50
%
From 1998 to 2005 substance
use had gone down by 50% in 8
years in Iceland amongst 15-16
year adolescents.
We were asked: WHY?
Participation in 2006
• 8 municipalities / communities • 6 countries

What is the commitment?

Participation until 2017
14
35 communities / municipalities 18 countries 140 thousand questionnaires (YiE) Over 9 million questions answered

Cities in 18 countries in Europe
15
Portugal, Spain, France, Malta, Italy, Greece, Turkey, Slovakia, Romania,
Moldova, Bulgaria, Lithuania, Latvia, Estonia, Russia, Sweden, Norway,
Faroe Islands

What is the commitment?

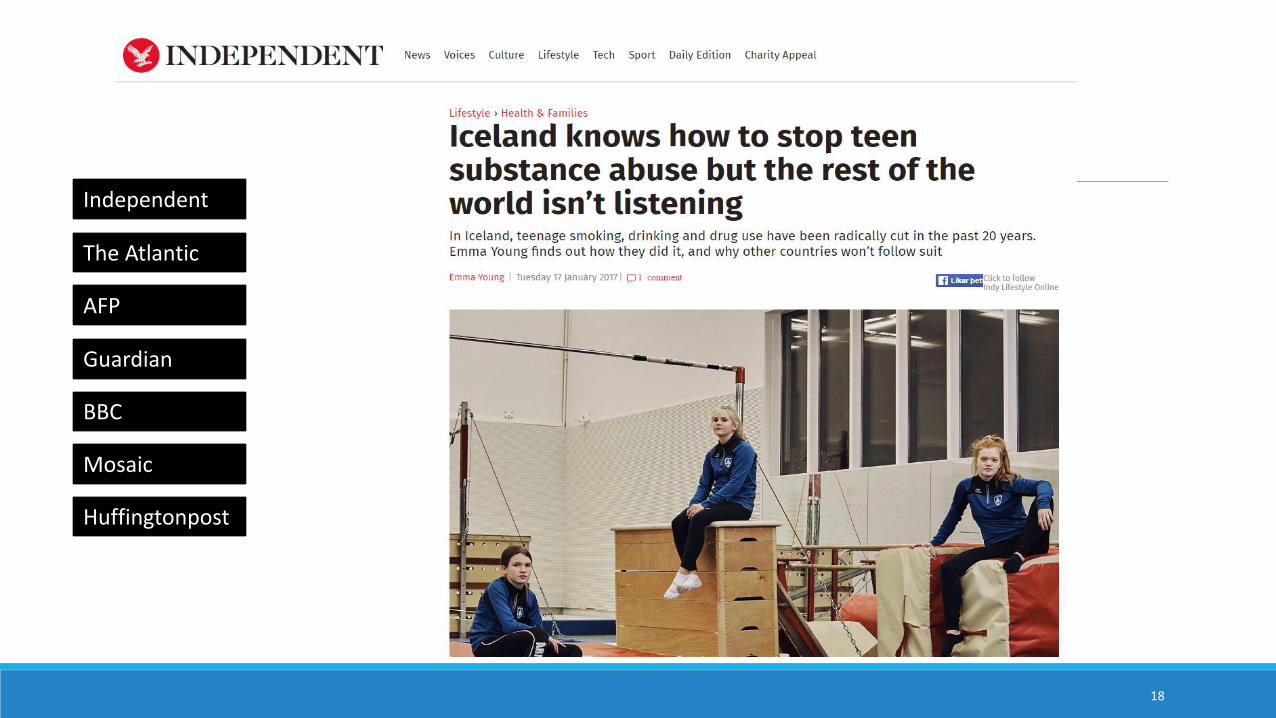
17
The Atlantic
AFP
Guardian
BBC
Mosaic
Independent
Huffingtonpost
18
The Atlantic
AFP
Guardian
BBC
Mosaic
Independent
Huffingtonpost

Requests for cooperation / information
Argentina, Australia, Brazil, Canada, Chile, Colombia, Costa Rica, Croatia,
Ecuador, England, Guinea Bissau, Hungary, India, Ireland, Israel, Kenya, Mexico, Netherlands, New Zealand, Peru, Philippines, Scotland, Serbia,
Ukraine, USA, Venezuela, Wales 19
The pillars of success in practice – Key factors
20
The three “logical” pillars of success
Evidence
Community
Dialogue

Immediate local feedback
Practical information out immediately after data collection
Not 3-4 years later but almost immediately
Every school, every parent, every prevention worker should have access to current situation in their close community
22

Comments from the YiE cities… “Data from research is now used as a basis for desicion making“ “Information from data is already having impact on policymaking“ “YiE method is a successful step in drug prevention“ “Empirical data is of vital support in our work today“

Cultural differences?
24
Questionnaires
Theoretically based core questions that must be asked
Questionnaires adapted to the various cultural areas
25

Taboo´s
Questions that are not allowed to ask?
26

Difference in risk and protective factors?
Not really
27

International work processes and coordination
28

30

Data Processing and Coordination Center (DPCC)

Coordinated work processes Youth in Iceland: All the work entierly in our hands. We held all the threads.
Youth in Europe: Data collected by different institutions in many countries.
Precise information for every step of the way.
32

Why coordinated processes
Quality standards
Best possible data
Comparable between communities
Maximizing response rates
Crucial for scientific papers

Cross cultural Co-ordination
Local training, Translation methods,
Questionnaires, Sampling, Printing, Layout,
Implementation, School approach, Optical
scanning, Delivery of data to Data processing and
coordination center (DPCC), Quality control,
Reports and data, and more
Twenty five step coordination

Guidance
35
Hands on cooperation for five years for best results.
Year 1 Year 2 Year 3 Year 4 Year 5
1st 2nd 3rd 1st 2nd 3rd 1st 2nd 3rd 1st 2nd 3rd 1st 2nd 3rd

Chronological order of work processes COMMUNITY / MUNICIPALITY
Appointing of contact person
Appointing of local work team
Translation of questionnaire / Back translation
Drawing of a sample (where needed)
School contact and preparation of questionnaire implementation
ICSRA / DATA PROCESSING CENTER
Local training on methodology and coordination
Joint questionnaire preparation
Coordinated questionnaire layout in all languages / setup
Guidelines for school approach
Guidelines for questionnaire printing
36

Cont.
COMMUNITY / MUNICIPALITY
Printing of questionnaire and confidentialy envelopes
Delivery of questionnaires to schools
Scanning of questionnaires to PDF/TIFF
Delivery of files to cloud
Technical report
ICSRA / DATA PROCESSING CENTER
Optical data capturing
Verifying of data / quality control
Data cleaning / data processing
Delivery of full report / descriptive
Delivery of dataset
Follow-up seminar / Conference
37
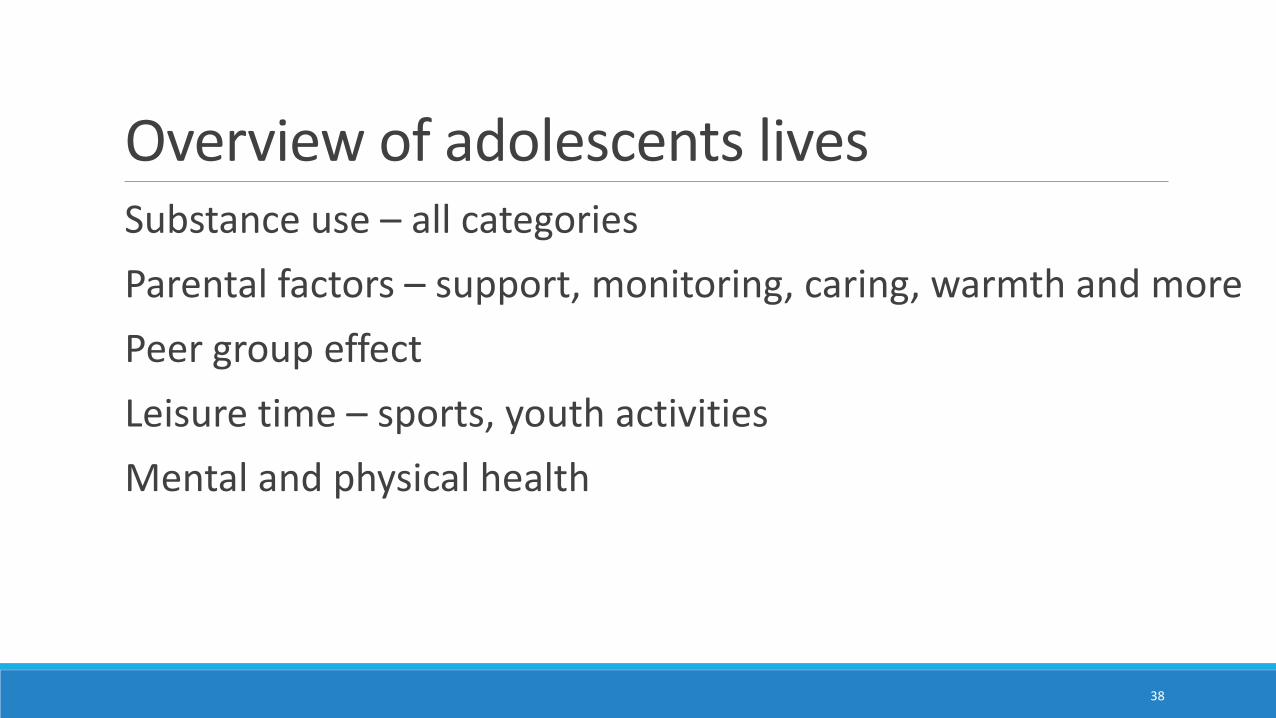
Overview of adolescents lives Substance use – all categories
Parental factors – support, monitoring, caring, warmth and more
Peer group effect
Leisure time – sports, youth activities
Mental and physical health
38
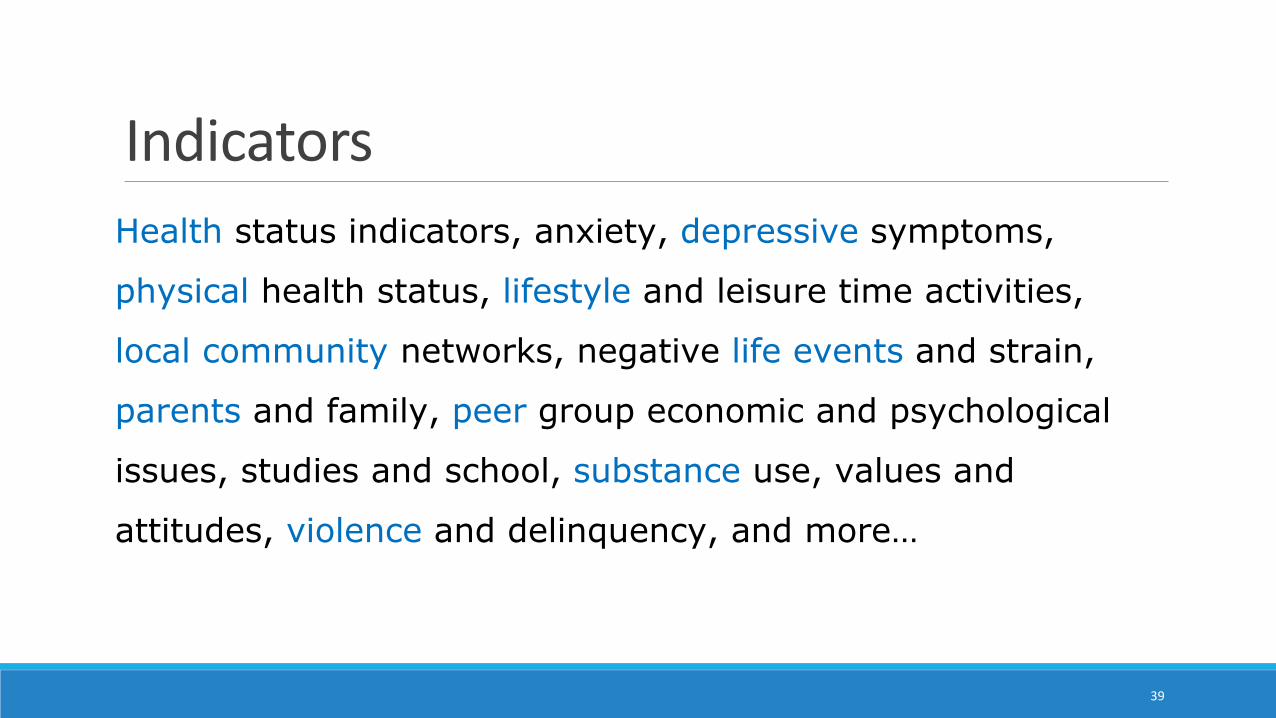
Indicators
Health status indicators, anxiety, depressive symptoms,
physical health status, lifestyle and leisure time activities,
local community networks, negative life events and strain,
parents and family, peer group economic and psychological
issues, studies and school, substance use, values and
attitudes, violence and delinquency, and more…
39

“First time we see the actual status of youth in the community“.
40

Cross tabulations
41
33 33
26 24 23 21 18 18
0
10
20
30
40
50
60
70
80
90
100
Your city All cities
%
Students that have become drunk during the past 30 days
Caring and warmth from parents
Very difficult
Rather difficult
Rather easy
Very easy

Substance use / Alcohol drunk last 30 days
42
24,3 22,2 17,1 17,6
20,5 19,8
0
10
20
30
40
50
60
70
80
90
100
Your city All cities
%
Drunk - Once or more during the past 30 days
Boys Girls Total

Blind comparison for benchmarking
43
4 7
8 8 10 10 11
12 14 15 16 16 16 16 17 17 17
19 20 20 21 22
27 28 29 30 30 31 32
34
44
0
5
10
15
20
25
30
35
40
45
50
FS
%

Sport participation
44
56
14
8 6 4
12
50
11 9 10 9 11
0
10
20
30
40
50
60
70
80
90
100
Almost never Once a week Twice a week 3 times a week 4-6 times a week Almost every day
%
Engagement in sports
Your city All cities

Parental factors
10
21
10
14 12
23
15 16
0
5
10
15
20
25
30
35
40
45
50
Caring and warmth Discussions about personalaffairs
Advice about the studies Advice about other issues
%
To receive the following from parents
Your city All cities

How to get started
46
The first step is always to do the mapping in the relevant community / municipality
Nothing happens without the local information, status and risk/protective factors
47

First step in the work in a community
Evidence about the situation amongst youth
An overview of childrens and adolescents lives
Who are the risk and protective factors?
After that the work can begin – based on evidence
48

Indicators
Health status indicators, anxiety, depressive symptoms,
physical health status, lifestyle and leisure time activities,
local community networks, negative life events and strain,
parents and family, peer group economic and psychological
issues, studies and school, substance use, values and
attitudes, violence and delinquency, and more…
49

Municipalities become members
Fees for the full guidance program for 5 years?
Seven to ten thousand Euros pr. annum average
For the full program, guidance and support
Opportunities and outcomes
51

Use a proven methodology to reduce childrens substance use
Create a tool to work with on a local and national level
Strengthen collaboration using fresh and interesting data
Bring together people working in different fields
Change the living environment of children for the better
Improve health and well-being of children
52

The To-Do list
53
The To-Do list Map the situation in the local conditions
From the data find the local risk and protective factors
Address these factors through local community work
Form local networks from all institutions of the municipality
Give immediate, practical information out quickly
Measure regularly
54

Thank you!