the ideal evaluation of a risk prediction model: a ... · the ideal evaluation of a risk prediction...
TRANSCRIPT

The Ideal Evaluation of a Risk PredictionModel: A Randomized Clinical Trial
Holly JanesFred Hutchinson Cancer Research Center
1/25

Context
Often a risk prediction model is developed to identify high risksubjects who can benefit from preventative therapy
E.g. Framingham risk model to identify subjects to treatwith statins for CVD preventionE.g. Gail risk model to identify women to treat withtamoxifen for the prevention of breast cancer
2/25

Concept
The assumption is that the cost vs. benefit of treatment isfavorable only for subjects at high risk.
In CVD prevention, the mantra has become “match the intensityof treatment to the risk of the event"(American College of Cardiology/American Heart Association Guideline onthe Assessment of Cardiovascular Risk)
3/25

Implicit Assumption
Implicit is that the net benefit of treatment varies as a functionof risk of the event
Net benefit = Benefit - Cost of treatment,
Cost = side effects/toxicity, burden, and/or monetary costBenefit = reduction in event rate
Otherwise, a uniform treatment strategy would be optimal.
4/25

More precisely (Gail JNCI, 2009),
T = 1 indicates treatment, T = 0 no treatment
D = 1 indicates an event, D = 0 no event
X = marker(s)
Risk(X ) = P(D = 1|T = 0,X )
RR = P(D=1|T=1)P(D=1|T=0) , assumed constant
Cost = cost of treatment vs. no treatment, assumed constant
Benefit = benefit of treatment vs. no treatment
= P(D = 1|T = 0,X )− P(D = 1|T = 1,X )
= Risk(X )(1− RR)
NB(X ) = Benefit− Cost = Risk(X )(1− RR)− Cost
5/25

More precisely (Gail JNCI, 2009),
T = 1 indicates treatment, T = 0 no treatment
D = 1 indicates an event, D = 0 no event
X = marker(s)
Risk(X ) = P(D = 1|T = 0,X )
RR = P(D=1|T=1)P(D=1|T=0) , assumed constant
Cost = cost of treatment vs. no treatment, assumed constant
Benefit = benefit of treatment vs. no treatment
= P(D = 1|T = 0,X )− P(D = 1|T = 1,X )
= Risk(X )(1− RR)
NB(X ) = Benefit− Cost = Risk(X )(1− RR)− Cost5/25
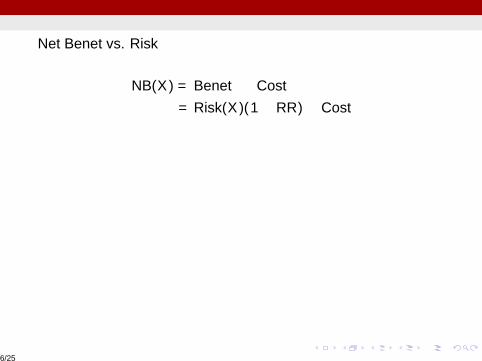
Net Benefit vs. Risk
NB(X ) = Benefit− Cost= Risk(X )(1− RR)− Cost
N
B(X
)
Risk(X)
0.00 0.25 0.50 0.75 1.00
−0.10
−0.05
0.00
0.05
0.10
0.15
6/25

Optimal treatment rule is:treat if NB(X ) = Risk(X )(1− RR)− Cost > 0,
i.e. Risk(X ) > Cost/1− RR
N
B(X
)
Risk(X)
0.00 0.25 0.50 0.75 1.00
−0.10
−0.05
0.00
0.05
0.10
0.15
0.40
Well-known decision-theoretic result, for special casewhere Benefit = Risk(X )(1− RR) (Pauker and Kassirer, 1975)
7/25

Optimal treatment rule is:treat if NB(X ) = Risk(X )(1− RR)− Cost > 0,
i.e. Risk(X ) > Cost/1− RR
N
B(X
)
Risk(X)
0.00 0.25 0.50 0.75 1.00
−0.10
−0.05
0.00
0.05
0.10
0.15
0.40
Well-known decision-theoretic result, for special casewhere Benefit = Risk(X )(1− RR) (Pauker and Kassirer, 1975)
7/25

The Value of the Risk Model
Value = reduction in event rate, less the cost of treatment
Estimated usingData for cohort of untreated subjects (T = 0), to estimatedistribution of Risk(X )
RCT estimates of RR and Cost of treatment
8/25
Example
Gail (JNCI, 2009) assessed the value of the Gail model* foridentifying healthy older white women at high risk of developingbreast cancer over the next year, who can be recommendedtamoxifen for breast cancer prevention.
*Gail model predicts risk of breast cancer given age at menarche,age at first live birth, number of previous breast biopsy examinations,total number of first-degree relatives with breast cancer
9/25

Cost of tamoxifen = change in risk of “secondary events"– hipfracture, endometrial cancer, stroke, and pulmonary embolism–due to tamoxifen, based on RCT data
Benefit of tamoxifen = reduction in risk of breast cancer =Risk(X )(1− RR),
where Risk(X ) = Gail risk, distribution based on NHIS dataRR = 0.51 based on RCT data
Value of Gail model is a very modest 0.2% reduction in thecomposite event rate.
10/25

Assumptions
All events– breast cancers and others– are of equalimportance and mutually exclusiveTamoxifen can cause other events but not breast cancerRR and Cost of tamoxifen are constant in XE.g. Cost does not vary with age
If these assumptions are incorrect, the optimal treatment ruleand its value are incorrect.
11/25

Ideal Evaluation of a Risk Model
To avoid Cost/Benefit assumptions, assess value of risk modelin a randomized trial comparing T = 0 to T = 1.
Requires baseline Risk(X ) values for all or a random sample ofparticipants*
Measured prospectively, at trial initiationOr retrospectively, given baseline data/samples
*Risk(X ) function might come from another study, or be estimated using RCTdata.
12/25

Specifically, given RCT data:
Fit models for Benefit and Cost
Benefit(X ) = P (D = 1|T = 0,Risk(X ))− P (D = 1|T = 1,Risk(X ))
Cost(X ) = a constant, or a function of X
Evaluate the net benefit of treatment
NB(X ) = Benefit− Cost= P (D = 1|T = 0,Risk(X ))− P (D = 1|T = 1,Risk(X ))− Cost(X )
Identify the optimal treatment ruleTreat if NB(X ) > 0, i.e.P (D = 1|T = 0,Risk(X ))− P (D = 1|T = 1,Risk(X )) > Cost(X )
13/25

Is net benefit really linear in Risk(X )?
NB(X ) = Benefit− Cost= P (D = 1|T = 0,Risk(X ))− P (D = 1|T = 1,Risk(X ))− Cost(X )
Net benefit may be non-linear if
RR due to treatment is not constant in XE.g. different treatment effects by race/ethnicity, BMI, ...
Cost of treatment is not constant in XE.g. Cost increases with age
14/25
Example
Cost increases with X = age, so net benefit is < 0 for highestrisk
N
B(X
)
Risk(X)
0.00 0.25 0.50 0.75 1.00
−0.115
−0.064
−0.014
0.037
15/25

Does the risk model have population value?
Value of the model is affected byBenefit and Cost of treatmentIts predictive capacity: proportions of cases (D = 1) andcontrols (D = 0) designated “high risk" and recommendedtreatment
Most risk models have limited predictive capacity and thereforemodest value.
16/25
Even a perfectly predictive risk model has limits as to its value–markers that predict treatment effect have greater potentialvalue
In Gail example, perfect model would reduce compositeevent rate by 20%Less than if treatment effect varied widely with markervalue, i.e. P(D = 1|T = 0,X )− P(D = 1|T = 1,X ) varied inX
17/25

Practical difficulties with RCT evaluation
Requires RCT with marker(s) measured at baseline on trialparticipants
Large sample size required to evaluate treatment effect asa function of risk, vs. trial sized only to estimate overalltreatment effect
Except for very strong markers/risk models
18/25

But such evaluation has been performed
Oncotype DX recurrence score evaluated in two RCTs ofadjuvant chemotherapy for breast cancer treatment (Paik etal. J Clin Onc 2006; Albain et al. Lancet Onc 2010)
Framingham risk model evaluated in JUPITER trial ofrosuvastatin for CVD prevention (Dorresteijn et al. BMJ 2011)
Lung cancer death risk model evaluated in NLST oflow-dose CT screening for lung cancer (Kovalchik et al. NEJM2013)
19/25

Summary and Discussion
Risk prediction models are often developed to guide the use oftreatment.
Evaluating such usage given only cohort data requires makingstrong assumptions about the consequences of high riskdesignation:
Cost of treatment, and whether/how this variesBenefit of treatment, and whether/how this varies.
The validity of the treatment rule and its value depend on theseassumptions.
20/25

Summary and Discussion, cont’d.
Model evaluation in an RCT avoids these assumptionsCost and Benefit assessed as a function of RiskOptimal treatment rule identified and evaluated
Ideal confirmatory study is a “biomarker strategy" trial(Mandrekar et al. 2005; Sargent et al. 2005)
Randomize subjects to marker-based treatment orstandard of careContrast event rate and Cost across arms to measureeffectiveness of marker-based treatment strategy– takinginto account imperfect adherence
21/25

References
Gail M. Value of Adding Single-Nucleotide Polymorphism Genotypesto a Breast Cancer Risk Model. JNCI 2009; 101: 95-63.
Janes H, Pepe MS, Huang Y. A Framework for Evaluating MarkersUsed to Select Patient Treatment. Med Decis Making 2014; 34:159-67.
22/25

Extra Slides
23/25

Merits of Biomarker Strategy Design
Measures the “effectiveness" of marker-based treatmentpolicy, allowing for non-adherence
But requires committing to the marker-based treatmentrule in advance of the study – therefore best-suited toconfirmatory studies of marker
24/25

Examples of Biomarker Strategy Designs
UK trial of tumor-chemosensitivity-assay-directed chemo totreat recurrent platinum-resistant ovarian cancer (Cree et al.2007)
PREDICT-1 study of HLA-B*5701 screening forhypersensitivity to abacavir to treat HIV (Mallal et al. NEJM2008)
EU-PACT study of genotype-guided dosing of warfarin totreat thromboembolism (Pirmohamed et al. NEJM 2013)
25/25