the illinois culture of corruption and ......within each state, comparing elazar’s classification...
TRANSCRIPT

THE ILLINOIS CULTURE OF CORRUPTION
AND COMPARISONS WITH INDIANA
By: Raymond Scheele
Joe Losco
Steven Hall
Ball State University
September 2012
Paper Originally Presented at the
Ethics and Reform Symposium on Illinois Government
September 27-28, 2012 - Union League Club, Chicago, Illinois
Sponsored by the Paul Simon Public Policy Institute, SIUC, the Joyce Foundation, and the Union
League Club of Chicago

2
Abstract
The recent indictment and conviction of the sitting Illinois governor has renewed academic
interest in political corruption in the states. Research has focused on the extent of corruption
as well as the causes and consequences of such wrongdoing. This paper reviews the state of
academic research into corruption in the states and examines attempts to measure its relative
strength in the neighboring states of Illinois and Indiana. Indiana shares many cultural
characteristics with Illinois, including strong political parties and governmental practices that
have been viewed by many as visibly troubling. We discuss the various problems associated
with measuring public corruption and we also attempt to identify the factors that contribute to
differential levels of corruption in these states. Finally, we propose a structural equation model
(SEM) that that may prove applicable more widely.

3
The Illinois Culture of Corruption and Comparisions with Indiana
By: Raymond Scheele, Joe Losco, and Steven Hall
Political corruption in America always has attracted the attention of journalists and
academics alike, perhaps because wrongdoing always makes for a good story or research topic.
The literature is replete throughout the last century of stories of crime and corruption in American
cities and states. These studies were largely anecdotal, biographical, or tending toward the
sensational and much of this literature focused on Chicago and Illinois. (Banfield and Wilson,
1966; Barnhart and Schlickman, 1999; Brackett, 2009; Campbell, 2005; Dobyns, 1932; Hartley,
1999; Johnson and Sautter, 1998; Kenney, 1990; Laski, 2008; Merriam, 1929; Merriner 2004;
Nash, 1985; Ross, 1988; Royko, 1971; Schmidt, 1989; Simpson, 2001; Tarr, 1971; Walker,
2007; Wendt and Kogan, 1967; 2005). The neighboring state of Indiana also has been on the
receiving end of several corruption-related stories and studies (Indiana Writers’ Project, 1961;
Leibowitz, 1964; McNeill, 1966; Niblick, 1973; Nye, 1959; White, 1962; Scheele, 1983; 1994).
In this section, we consider the possibility that corruption is an outgrowth of political
culture and consider the application of this argument to Indiana and Illinois. Over forty years ago
Daniel Elazar’s work broke new ground for an understanding of the connections between political
culture and political corruption (Elazer, 1972). He formulated three major categories of political
culture in the states: Individualistic, Moralistic, and Traditionalistic. Each of these was an
outgrowth primarily of migration patterns into the various states and the religious affiliations of
the residents.
The Individualistic political culture, “emphasizes the conception of the democratic order as
a marketplace” where government is created “for strictly utilitarian reasons, to handle those
functions demanded by the people it is created to serve” (94). Consequently, the persons in this

4
culture base politics “on a system of mutual obligations rooted in personal relationships” (95).
Elazar contends that “a fair amount of corruption is expected in the normal course of things,” and
there is “relatively little popular excitement when any is found unless it is of an extraordinary
character” (95).
The Moralistic political culture, “emphasizes the commonwealth conception” and
considers politics to be, “one of the great activities of man in his search for the good society….”
(96). Politics, then, should be the concern of everyone, not just those who are professionally
committed to political careers and political parties are useful political devices but are not valued
for their own sake (98).
The Traditionalistic political culture, “reflects an older, pre-commercial attitude that
accepts a substantially hierarchical society as part of the ordered nature of things, authorizing
and expecting those at the top of the social structure to take a special and dominant role in
government” (99). The Traditionalistic political culture shares one particular attribute with the
Individualistic culture when it comes to corruption, “those active in politics are expected to benefit
personally from their activity though not necessarily by direct pecuniary gain” (99).
Elazar categorized the two Midwestern states of Illinois and Indiana as Individualistic
political cultures, although strong strains of the Traditionalistic culture were to be found in the
southern parts of both states. Likewise, particularly in the far northern parts of both states there
are traces of the Moralistic culture (106-7, 112).
Historians have an extensive literature on the concept of “place” in American history,
including life in the Midwest. Andrew Cayton (2001) points out that in terms of definition
…the Midwest is a mushy place; experts cannot even agree on where it begins and ends. Is it the drainage area of the Great Lakes, or the upper Mississippi? What do northern Wisconsin and southeastern Ohio have in common with each other, or
5
Cook County and southern Illinois, for that matter, where are the shared events in the Midwest’s past and present? (149).
6
Indeed, the “Middle West” label “…did not even enter the language until the first decades
of the twentieth century” (149). These facts pertain to the overall geography that now are
accepted as the “Midwest,” but the individual states of Illinois and Indiana show many distinctive
cultural patterns due to settlement of different groups of people as well as transportation
networks and business and commercial placements. These two states, particularly the northern
portions of both, share many similarities in these areas.
Elazar’s work built upon the research of Almond and Verba (1963) and inspired several
scholars to operationalize the concept of political culture. Research moved in the direction of
using political culture as the underlayment for a host of public activities, such as the state
adoption of public policies, the types of political attitudes and ideology, voting participation and
voting behavior, as well as political corruption (Erickson, et. al. (1987); Dran, et. al. (1991);
Johnson (1976); Nice (1986).
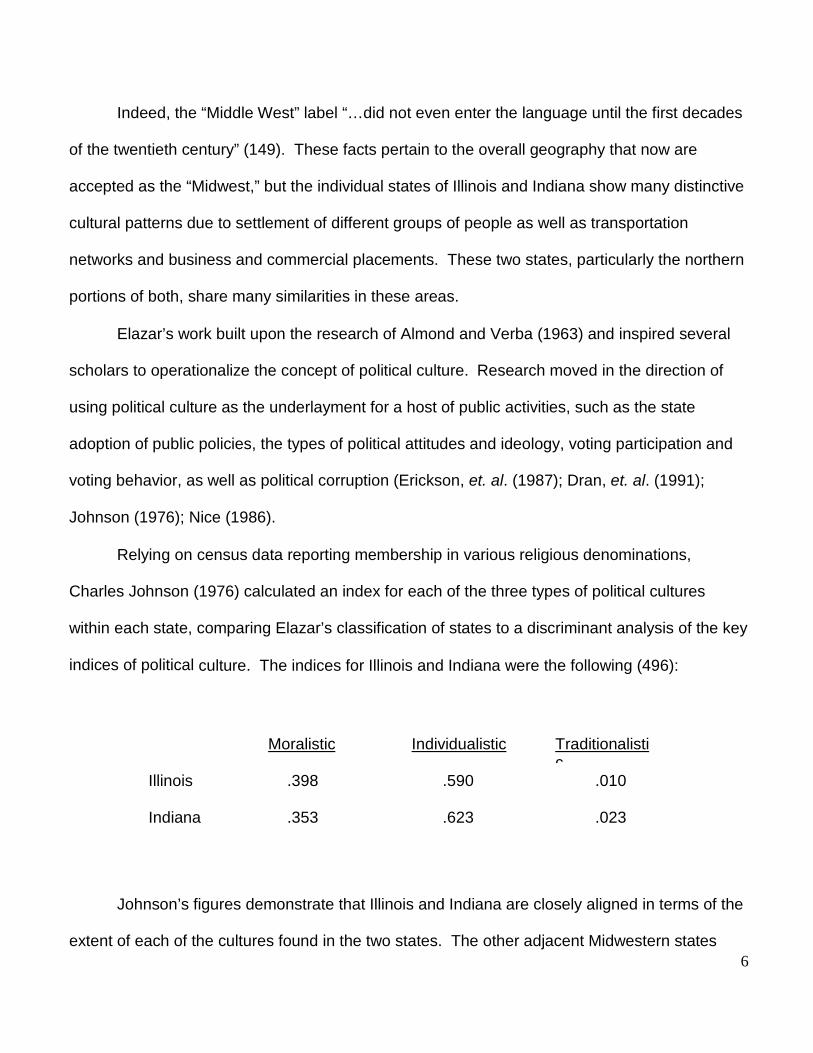
Relying on census data reporting membership in various religious denominations,
Charles Johnson (1976) calculated an index for each of the three types of political cultures
within each state, comparing Elazar’s classification of states to a discriminant analysis of the key
indices of political culture. The indices for Illinois and Indiana were the following (496):
Moralistic Individualistic Traditionalistic
Illinois
.398
.590
.010
Indiana
.353
.623
.023
Johnson’s figures demonstrate that Illinois and Indiana are closely aligned in terms of the
extent of each of the cultures found in the two states. The other adjacent Midwestern states
7
(Michigan, Ohio and Wisconsin) also showed similar figures and Johnson categorized the five
Midwestern states as predominately Individualistic political cultures.
Johnson’s research also reinforces Elazar’s findings that the Individualistic political
culture is associated with government activities promoting social welfare programs and
economic development, along with centralized decision-making, a sense of the importance of
political parties, and strong interparty competition (505).
Another study by Robert S. Erikson and his co-authors investigated the connection
between political culture and public opinion (Erikson, et.al, 1987) and concluded that, “variance
in state-level partisanship and ideology is due to state-level differences in political culture rather
than the demographic characteristics of residents of different states” (812). This finding
corroborates the connection between political culture and political attitudes in the states.
Michael Johnston’s work zeroes in directly on the connection between political culture
and corruption (1983). Johnston agrees with Elazar’s assertion that Individualistic cultures are
more tolerant of political corruption because politics in the Individualistic cultures are viewed as,
“a marketplace in which self-interest comes first,” and that “corruption in individualistic areas
produces relatively little public outcry ” (30).
However, Johnston’s research diverged from Elazar’s categorization of Illinois and
Indiana as having predominately Individualistic political cultures. Bringing the analysis down to
the lowest level-- the eighty-five federal judicial districts in the United States—where actual
indictments and convictions for political corruption take place, Johnston identified the prevailing
political culture in each, using religious affiliation as the predominant indicator. His method
provided scores for the prevailing political culture based on the percentage of the total
population rather than the percentage of total persons adhering to selected religious
8
denominations. This analysis moved the Central and Southern Illinois judicial districts into the
Moralistic political culture.
Similarly, the two judicial districts in Indiana (Northern and Southern) also moved from the
Individualistic to the Moralistic culture.1Johnston’s research highlights the major problem in
using political culture as the explanatory variable for political corruption. Meier and Holbrook
(1992) describe the problem this way:
Most cultural explanations of corruption rely on case studies so that the rich detail of culture can be examined. Quantitative studies…must of necessity rely on explanations that are measurable across jurisdictions.
We do not use Elazar’s (1972) political culture measure for two reasons. First,
culture as a variable is often described in terms of participation, political corruption, and a wide variety of other factors. As a result it is unclear if political culture is conceptually distinct from political corruption. Second, our reading of Elazar suggests that individualist cultures should have the most political corruption. Johnston (1983), however, presents evidence that moralistic cultures are most corrupt. Any hypothesis concerning culture and corruption, as a result, lacks precision (139, n.5; 140; n. 8).
9
Beyond Political Culture: Measuring Political Corruption
As slippery as the concept of political culture is to capture, measuring differences in levels
of corruption between states presents even greater challenges. Measuring corruption is
inherently difficult given the obvious incentive of those engaging in such activities to conceal their
behavior. In this section, we explore the literature on these approaches and consider how
Indiana and Illinois compare along three alternative measures. Because of the measurement
problems and lack of consistency across studies, we propose a measurement model of
corruption that combines indicators.
Initially, we note that there is conceptual ambiguity in what actually constitutes corrupt
behavior. These problems are explored in Robert Dalton’s chapter, “Governors and Ethics,”
where first-hand observations from sitting governors pinpoint some of the ethical demands they
face (Beyle and
Muchmore, 67-76). Dalton opens his chapter as follows:
In 1973, Otto Kerner, U.S. circuit court judge and former two-term governor of Illinois,was
convicted and imprisoned on charges of mail fraud and tax evasion committed while governor….
(67). Dalton proceeds to cite other convicted former or sitting governors including men such as
Spiro T. Agnew (MD—tax evasion) , David Hall (OK--bribery), Marvin Mandel (MD—mail fraud
and racketeering), Edwin Edwards (LA--bribery) and Ray Blanton (TN—conspiracy, extortion
and mail fraud). Dalton documents that governors readily admit that there is a “moral ambiguity”
in their jobs, regardless of the laws, regulations and perceptions that pervade the political office
of the governor (69). Several examples are cited by governors of the “ambiguity” that surrounds
the notion of acceptable behavior in public office.
1 The Northern District of Illinois was not included in Johnston’s analysis because of missing conviction data from thePublic Integrity Section of
the Criminal Division of the Department of Justice over the three-year period, 1976-78 (Johnston, 22-33)

10
One governor acknowledged that, “people might differ with him on what is right and what
is wrong,” and another chief executive cited the example of depositing the state’s money in a
certain bank that might lead some people to, “wonder if a deal was made between the governor
and the bank” (69). Overall, the perception of the state’s citizens emerges as a key ingredient in
the governors’ assessment of ethics in government.
A comparison of governors of Illinois and Indiana reveal the huge lead of Illinois in corrupt
practices in the governor’s office. Indiana has not sent a governor to the federal penitentiary
since 1924, when Republican governor Warren McCray was convicted of mail fraud. Currently,
of course, two former Illinois governors are in jail and five of the last eleven Illinois governors
have been accused of crimes, although in two occasions the charges were for actions after
gubernatorial service.
While these cases certainly constitute corruption and create major headlines, they do not
give clear insight into how pervasive corrupt behavior is in public life across the states. Moving
away from more qualitative approaches associated with studies of political culture, recent
research into public corruption adopts quantitative designs to assess the impact of a number of
potential explanatory variables on state-to-state variation in corruption. The most common
measurement of corruption in these studies is the number of federal convictions.
11
Convictions
A number of studies across the states have used the number of criminal convictions for
corruption as the main measure (Adsera, et.al; Cordis; Glaeser and Saks; Maxwell and Winters;
Meier and Holbrook). Meier and Holbrook (1992) pursued the quantitative modeling approach,
measuring corruption as the number of convictions from 1977 to 1987 by the Department of
Justice’s Public Integrity Section. They rejected the political culture concept for a quantitative
model with variables that were “measurable across jurisdictions,” and found that corruption is
associated with,“historical/cultural forces (especially turnout and party competition), and
bureaucratic forces e.g., government size and policies that increase bribe opportunities” (135).
Somewhat surprisingly, in this 1992 study, structural factors, including campaign finance
reporting requirements, were unrelated to the incidence of corruption.
Maxwell and Winters (2011) measured corruption by dividing the number of convictions in
their time period by the number of elected officials. In order to deal with a skewed distribution
and toaccount for differences in populations, they used the log of convictions per 1,000 elected
officials. They proposed a model focusing on seven indicators of four fundamental traits in the
states, with the level of corruption denoted by the corruption convictions from the Department of
Justice. The traits are: 1) the number of “corruptible governmental bodies” in the states,
meaning that prosecutions should vary negatively with the number of elected officials; 2) the
larger the population of a state, the more the corruption; 3) high levels of demographic diversity
in a state will have correspondingly high levels of corruption; and 4) civic-minded, well-informed
political cultures will have lower rates of corruption.
12
Each of these traits was specified with indicators. The authors concluded that more “corruptible
constituencies lead to lower corruption rates, but at a diminishing rate” (1). States with well-
informed and highly-participant political cultures have lower rates of corruption and the greater
the state’s population, the greater the corruption. High socio-ethnic diversity also positively
affects corruption rates (1). The traits used by the authors showed Illinois to be at the, “upper
end of the distribution of[elected] officials, averaging about 42,000 officials per annum over the
1977-00 period” (9, emphasis in original). Indiana, having approximately 30 percent of the
elected officials as Illinois, would be expected to have fewer prosecutions. Neither Illinois nor
Indiana ranked in the five most corrupt states on this measure, with Florida, Virginia, Maryland,
Louisiana and South Carolina in the lead (9).
Two other recent studies have examined other aspects of political corruption in the states,
such as the “watchdog role” of newspapers in covering political corruption and, similarly, whether
the isolation of the capital city in a state has a bearing on the amount of corruption in that state.
Puglisi and Snyder, in their article titled, “Newspaper Coverage of Political Scandals,”
(2010), focused on the newspaper coverage of political scandals and found, “a strong correlation
between the partisan-leaning of newspapers as measured by their endorsement behavior and
the partisan bias in their coverage of political scandals” (16). In short, Democratic newspapers
gave substantially more news coverage to Republican scandals and Republican newspapers
reacted in the opposite manner.
Campante and Do (2012) explored the idea that, “having a capital city that is
geographically isolated from the main centers of population is conducive to higher corruption, as
the distance would lead to less accountability”(1). Also using the average number of federal
convictions for corruption as reported by the US Department of Justice for the years between
13
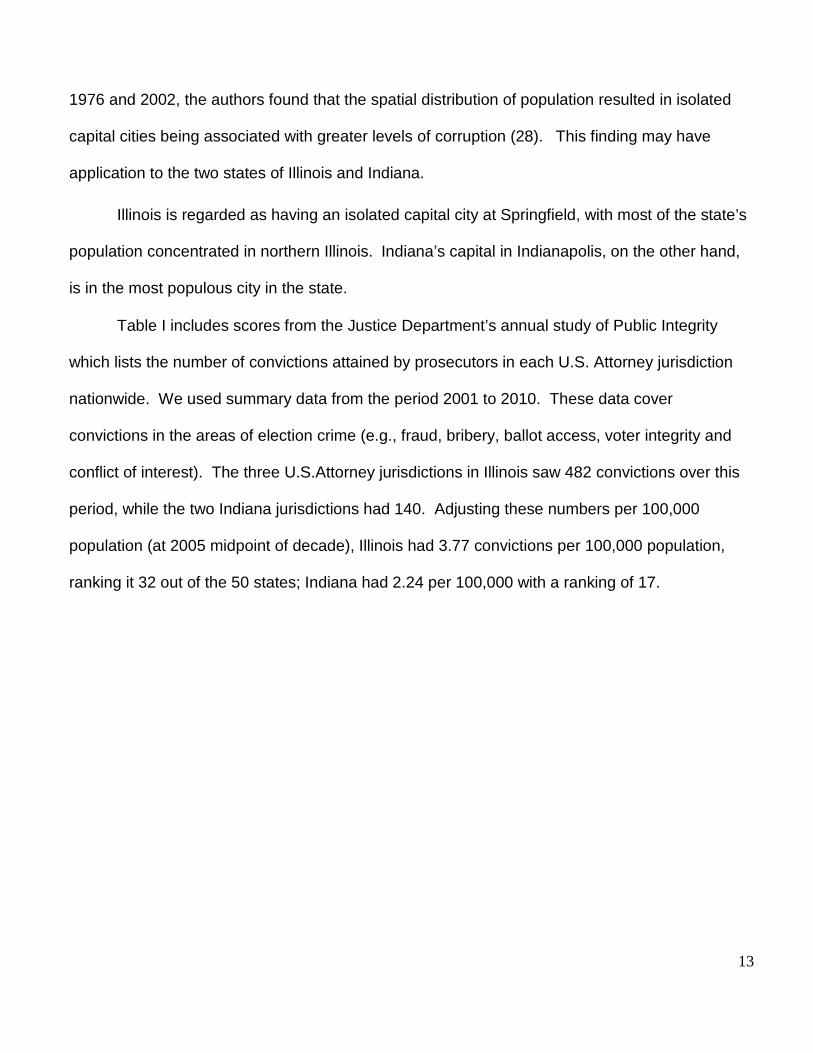
1976 and 2002, the authors found that the spatial distribution of population resulted in isolated
capital cities being associated with greater levels of corruption (28). This finding may have
application to the two states of Illinois and Indiana.
Illinois is regarded as having an isolated capital city at Springfield, with most of the state’s
population concentrated in northern Illinois. Indiana’s capital in Indianapolis, on the other hand,
is in the most populous city in the state.
Table I includes scores from the Justice Department’s annual study of Public Integrity
which lists the number of convictions attained by prosecutors in each U.S. Attorney jurisdiction
nationwide. We used summary data from the period 2001 to 2010. These data cover
convictions in the areas of election crime (e.g., fraud, bribery, ballot access, voter integrity and
conflict of interest). The three U.S.Attorney jurisdictions in Illinois saw 482 convictions over this
period, while the two Indiana jurisdictions had 140. Adjusting these numbers per 100,000
population (at 2005 midpoint of decade), Illinois had 3.77 convictions per 100,000 population,
ranking it 32 out of the 50 states; Indiana had 2.24 per 100,000 with a ranking of 17.

14
TABLE I
Corruption Ranking of States by Various Criteria with 1 = Least Corrupt
Boylan/Long BGA State Integrity Convictions per 100,000
AL 41 47 17 42
AK 7 23 32 46
AZ 22 20 30 23
AR 20 31 28 27
CA 33 5 4 12
CO 3 16 33 13
CT 36 13 2 22
DE 44 38 22 41
FL 43 18 18 33
GA 35 26 50 50
HI 29 4 13 30
ID 15 42 41 10
IL 45 41 11 32
IN 27 34 23 17
IA 4 43 7 11
KS 26 21 10 4
KY 37 3 19 45
LA 42 46 15 48
ME 6 24 46 21
MD 38 10 40 34
MA NA 15 12 29
MI 16 32 44 20

15
MN 9 17 25 5

16
MS 39 33 6 43
MO 31 35 16 28
MT 17 45 31 44
NE 21 6 5 8
NV 14 30 42 7
NH NA 36 35 2
NJ NA 12 1 39
NM 47 48 39 18
NY 24 29 37 25
NC 23 22 21 15
ND 5 39 43 49
OH 40 14 34 36
OK 32 25 38 31
OR 8 19 14 1
PA 34 40 20 38
RI 46 2 9 16
SC 11 7 45 3
SD 1 50 49 47
TN 10 44 8 37
TX 19 9 27 24
UT 25 27 36 9
VT 2 49 26 19
VA 12 28 47 40
WA 28 11 3 6
WV 30 8 29 35
WI 13 1 24 14
WY 18 37 48 26
17
Perceptions
Studies on cross-national differences in corruption often rely on expert surveys of the
business community and its perceptions of corruption levels. Boylan and Long (2003) adapt this
approach to the states using survey responses that measured the perceptions of statehouse
reporters. Insufficient returns from Massachusetts, New Hampshire and New Jersey left these
states out of the rankings. Their findings point out that federal indictments and convictions for
public corruption may vary by the level of effort that U.S. attorneys place on investigating such
incidents and this may compromise the indictment and conviction statistics as a true indicator of
public corruption in the states. Their 1999 survey instrument contained eight questions, with the
first asking about news coverage of corruption and the second asking about, “how high a priority
corruption investigation is for federal prosecutors” in their state (425). The remaining six
questions zeroed in on specific types of corruption such as the extent of fraudulent expense
reports by public officials, private sector favors due to campaign contributions; and estimates as
to the percentage of public officials engaged in corrupt activities. Their analysis added one
additional objective measure: the number of stories published on public corruption in the last
three months. The responses allowed for a rank-ordering of the states with number 1 being the
“least corrupt.” The state rankings provided by Boylan and Long, along with other research that
ranks states, are provided in Table I. Indiana ranks 27th with Illinois at number 45 among the 47
states receiving scores. As a result, reporters who closely follow government and politics in each
of these two states, for the period surveyed, attribute more corruption to Illinois than Indiana.
18
Legal Frameworks
Two recent studies look to the quality of ethics legislation and regulation to determine
state rankings on integrity. In a report released by the Corporate Crime Reporter, a state ranking
of political corruption by the Better Government Association of Chicago (BGA) was reported.
The BGA ranking relies on, “the relative strength of laws that protect against corruption and
promote integrity in the operations of state government” (8). The laws that were evaluated
included freedom of information, whistleblower protection, campaign finance, open meetings
laws, and conflict of interest disclosure (9). The researchers believe these laws contribute to
ethical practices by encouraging transparency, accountability and limits on government abuse.
The BGA ranking is reported in Table I, with Illinois 41 and Indiana 34, indicating that Indiana had
stronger laws promoting integrity in state government than Illinois.
The researchers for the Corporate Crime Reporter devised their own state ranking, using
the Department of Justice report on convictions for public corruption. They calculated the
“corruption rate,” as being “…the total number of public corruption convictions from 1993 to 2002
per 100,000 residents” (5). In this ranking, Illinois was clearly found to be one of the most corrupt
states, ranking number 5, with Mississippi, North Dakota, Louisiana and Alaska being the top 4.
Indiana ranked 34th, just behind Kansas and ahead of Michigan. In comparing the ranking by
the Corporate Crime Reporter to the BGA ranking, the Crime Reporter researcher concluded,
“…that there is apparently little correlation between strong laws and integrity—if a public official
wants to violate his or her trust, the laws don’t stand in the way” (9). The example of Kentucky is
cited, which ranked third best in the BGA study based on laws, but 43rd in the convictions study
(9-10). Table I does not include the Corporate Crime Reporter rankings because of the older
time period used in calculating the convictions.

19
A recent study by the Center for Public Integrity uses a methodology similar to that
employed in the BGA study and the Center’s rankings are included in Table I, labeled as “State
Integrity.” The rankings are a product of evaluating the legal environment in each state, using a
scale of 14 items: public access to information, executive accountability, judicial accountability,
state civil service management, internal auditing, state pension fund management, state
insurance commission management, political fundraising, legislative accountability, state
budgeting, procurement, lobbying disclosure, ethics enforcement, and redistricting. The Center
for Public Integrity study ranks Illinois 11th in public integrity with a letter grade of C while Indiana
comes in 23rd with a grade of C-. There is substantial overlap between the Public Integrity and
BGA studies in the areas of public access to information, fundraising, ethics enforcement, and
conflict of interests; although each study differs in the ways points are assigned to the various
aspects of the legal dimensions of each category. The Public Integrity study attributes the
relatively high standing of Illinois to reforms made in the wake of earlier scandals in the areas of
campaign finance, state procurement, and budgeting.
Our tour of these various rankings indicates that Illinois is perceived by professional
statehouse observers as being more corrupt than Indiana and the number of federal convictions
relative to population bears this out. When it comes to the legal landscape, the protections
against corruption in Indiana are seen by the Center for Public Integrity as more lax and less
friendly to public watchdogs than those of Illinois while the BGA study finds the reverse to be the
case. This finding may be driven by the stronger laws passed in recent years in Illinois in the
wake of some of its more visible political prosecutions, but subsequent to the BGA study.

20
Nevertheless, in examining these laws, we find Indiana’s statutes to be far more extensive
than those in Illinois. The Indiana laws bring more possible charges under the criminal code
than do Illinois’ laws. The most serious criminal charge, bribery, carries a larger fine but a
shorter sentence in Illinois than in Indiana. Overall, Indiana’s statutes specify several more
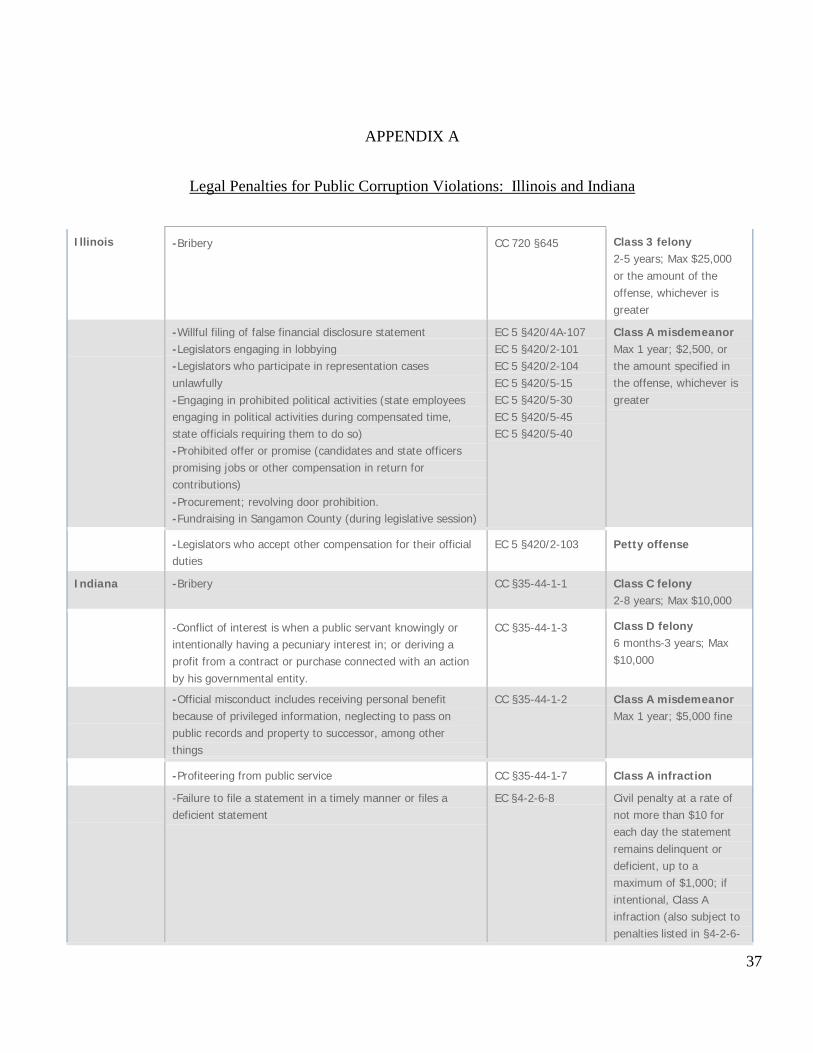
violations than do the Illinois statutes. Appendix A provides a summary of the laws in the two
states, taken from the National Conference of State Legislatures.
Problems of Measurement
The various quantitative research models have clearly expanded our understanding of the
factors associated with public corruption by identifying many of key traits that are associated with
levels of public corruption. Yet, none of the measures we have examined is unproblematic on its
own. In the case of conviction data, four problems complicate its use as an indicator. First, and
most fundamentally, corrupt public officials do not wish to be discovered and convictions may not
accurately capture the extent of such behavior if the ability to evade detection differs across
states. Second, the choice of the actual conviction data used can create complications.
Because anti-corruption campaigns have lumpy results, criminal convictions for public corruption
can vary greatly from year to year and while this suggests averaging the figures over a number
of years, that approach risks creating endogeneity problems within the data. Third, this requires
choosing a time interval over which to measure and Goel and Nelson (2011) find that alternating
between five-year and thirty year averages leads to different conclusions about the factors that
cause corruption. Fourth, as Boylan and Long (2003) contend, these measures capture not only
activity but the level of effort in detection and prosecution.

21
As for the institutional approach, neither the BGA nor Center for Public Integrity (CPI)
studies measure actual acts of corruption. Potentially, they could be measures of the level of
effort undertaken to stop corruption. However, as North (1990) argues, patterns of corruption
can persist well beyond the introduction of new formal institutions designed to combat such
behavior. Moreover, the mere presence of laws need not mean that active enforcement is
undertaken by government officials. Alt and Lessen’s research (2008) shows that the partisan
political context plays an important role in determining the
extent to which such efforts are made.
Kim Quayle Hill considers anti-corruption laws as an independent variable explaining the
incidence of public corruption (2003). Using four different measures that are collapsed into two
dimensions of anti-corruption statutes, the author tested different models and found that,
“neither of the two measures of anticorruption laws is a significant predictor of levels of
corruption.” In fact, it was transparency and public scrutiny of governing procedures that “arise
out of democracy and party competition that are more important for reducing corruption than are
regulatory initiatives….” (626).
In short, it appears that a longer list of anti-corruption state statutes do not significantly
lead to a lower level of public corruption. Perhaps this finding is best illustrated by the answer a
former Indiana U.S. Attorney provided when asked, “What do these officials say when the FBI
informs them they are under arrest for public corruption?” His response: “They say one of two
things. Either, ‘You finally caught me,’ or, ‘I haven’t done anything wrong’” (author interview with
former U.S. Attorney for the Northern District of Indiana).

22
The perceptions-based measure provided by Boylan and Long faces three common
criticisms. First, the problem of subjectivity potentially makes the comparison of survey results
for reporters across many different states somewhat difficult. Second, there may be great
variation in the extent to which media outlets are unbiased and devote resources to the
coverage of corruption issues; the findings of Puglisi and Snyder (2010) discussed above
underscore this point. Third, the Boylan and Long data suffered from low response rates and
missing data; also, it only captures perceptions based on one year when such reactions might
be strongly conditioned by idiosyncratic, high-profile events.
With the difficulties involved in measuring an activity that its practitioners work very hard
to conceal, the question arises to what extent these imperfect approaches even capture the
same behavior. In Table II we present a matrix of the correlations between the measures, using
the raw index data for each approach. The table highlights the difficulties in measuring
corruption; none of the putative measures is highly correlated with the others.
Table II. Correlation Matrix for Corruption Measures Boylan and
Long 2001-2010 convictions per 100,000
BGA Index Center for Public Integrity
Boylan and Long
1
.174
.220
.220
2001-2010 convictions per 100,000
.174
1
-.261*
-.120
BGA Index .220
-261*
1
.461***
Center for Public Integrity
.223
-.120
.461***
1
*** significant at .01 level, ** significant at .05 level, * significant at .10 level
23
The institutional measures (the BGA Index and the CPI) are, in fact, negatively correlated
with one measure of corruption, logged convictions per 100,000 of population. The institutional
measures are based on the presence of anti-corruption laws and appear to be consistent with
the interpretation that statutes are enacted in response to perceived corruption.
The choice of measurement is a non-trivial issue in empirical research on the
determinants of corruption. Goel and Nelson (2011) show that using different measurements
yields different results on determinants of corruption. They report that some findings are stable
across these indicators (e.g., educational attainment, judicial employment, and Southern states),
while other findings cited elsewhere in the literature were not robust (e.g., the effects of
urbanization, population, prosperity, population size, media, government spending, and
enforcement).
An alternative method to assess the measurement of corruption is to use confirmatory
factor analysis to identify common factors for latent variables. In Figure I, we present a
measurement model for corruption with the four indicators: the 2008 BGA index, the 2011 CPI
index, the Boylan and Long scores, and the number of federal corruption convictions per
100,000 residents from 2001-2010 (we follow Maxwell and Winters and log transform this
number). The conviction data are obtained from annual reports to Congress by the Public
Integrity Section of the Department of Justice.

24
SEE FIGURE 1
A generally accepted rule for factor loadings is that factors load highly with scores of .6 or
higher but do not with scores of .4 or worse. As Figure I shows, with the loading for convictions
set to one (at least one factor loading must be set to one to identify the model), the indicators do
not appear to be valid for the latent construct. Rather, they appear to indicate that the BGA and
the CPI data, in particular, are indicators of a separate concept altogether, one we will refer to as
the “legal framework.” We propose to measure corruption, then, as a latent variable with the
Boylan and Long scores and conviction data as its indicators.
Political Corruption and Social Capital
If political corruption is a type of dysfunction or civic malaise, then is civic health the
opposite? If corruption signifies civic breakdown, are the elements that contribute to civic health
the cure?
Social capital, the reciprocity and trust that bind social relations, has been identified as an
important component of well-functioning societies and a key component of civic health. Robert
Putnam (2000) and others have presented reams of data tying trust to social goods including,
“democracy, education, prosperity, safety, health, and even happiness” (Warren 2004; 1). A
number of transnational studies have tied social capital to lower levels of corruption. These
studies, “…find that in societies where the level of generalized trust and civic engagement is
high, people are more willing to deal with people who are different from them, encouraging
cooperation toward those outside one’s narrow social network. As a result, trusting societies are
more likely to have efficient governments, higher levels of
25
economic development, and, thus, less corruption” (Harris, 2). (See also Bjornskov, 2004; La
Porta et. al., 1997, Ulsaner, 2001; 2004; Zak and Knack, 2001). Social capital constitutes a
crucial component of civic health and contributes to positive aspects of civic engagement like
volunteering and voting.
Social capital is generated through activities like exchanging favors with neighbors, eating
dinner with family, holding political discussions with family and friends, and joining community
organizations. Putnam and others have posited that the greater the incidence of these activities,
the higher the level of social trust and the more likely one is to engage in activities like voting and
volunteering that signal civic health. It should be noted, however, that social capital also has
been associated with dysfunctional activities. This occurs when individuals bond exclusively with
others deemed similar to themselves and display hostile attitudes toward others not included
within one’s own group. Thus, social capital can also contribute to “social bads” including
terrorism, organized crime, clientelism, certain economic inefficiencies, rigid communities…ethnic
rivalries and unjust distribution of resources” (Warren, 1). In short, inclusive social capital
contributes to civic health and efficiency; exclusive social capital contributes to social
dysfunctions such as corruption.
Ulsaner (forthcoming) finds that generalized levels of trust are correlated with lower levels of
perceived corruption but rejects the idea that civic engagement has much of a direct impact on
quality of government. In fact, political participation may increase polarization. Instead, he finds
that, “It is trust in other people that matters for good government, not membership in civic groups
or other participation (with one exception [making a political speech])–and not trust in
government. So it is essential that we separate out the component parts of social capital” (9-10,
emphasis in original). Knack (2002) examined several components of social capital and found

26
only a weak relationship with government effectiveness. Nevertheless, Ulsaner relies heavily on
the Boylan and Long reputational model as his measure of corruption and Knack measures only
a few select aspects of civic engagement. These approaches hardly exhaust the ways of
accounting for either civic health or corruption.
Social capital is a difficult concept to capture; indicators measuring the concept range
from Robert Putnam’s observation of groups like bowling leagues to Alt and Lessen’s use of the
percentage of a state’s population with Scandinavian heritage. As with corruption, we contend
this is exactly the sort of concept that should be captured with a measurement model. We
employed data collected by the National Conference on Citizenship (NCoC) from a variety of
national surveys and census data presumed to measure civic health. Sources include the
GSS, NES, DDB Life Style Survey, and the CPS. The most recent year for which the data
have been collected and arrayed by results for each state is 2009. (For a full list of sources
utilized by the NCoC, see their reports at www.ncoc.net). As indicators we include measures of
activities commonly recognized as indicative of social capital. From surveys, the measures
include the percentage of respondents in each state who report engaging in the following
behaviors: voter turnout, volunteering, belonging to at least one group, exchanging favors with
neighbors, discussing politics with friends and family, and participation in non-electoral political
activities.

27
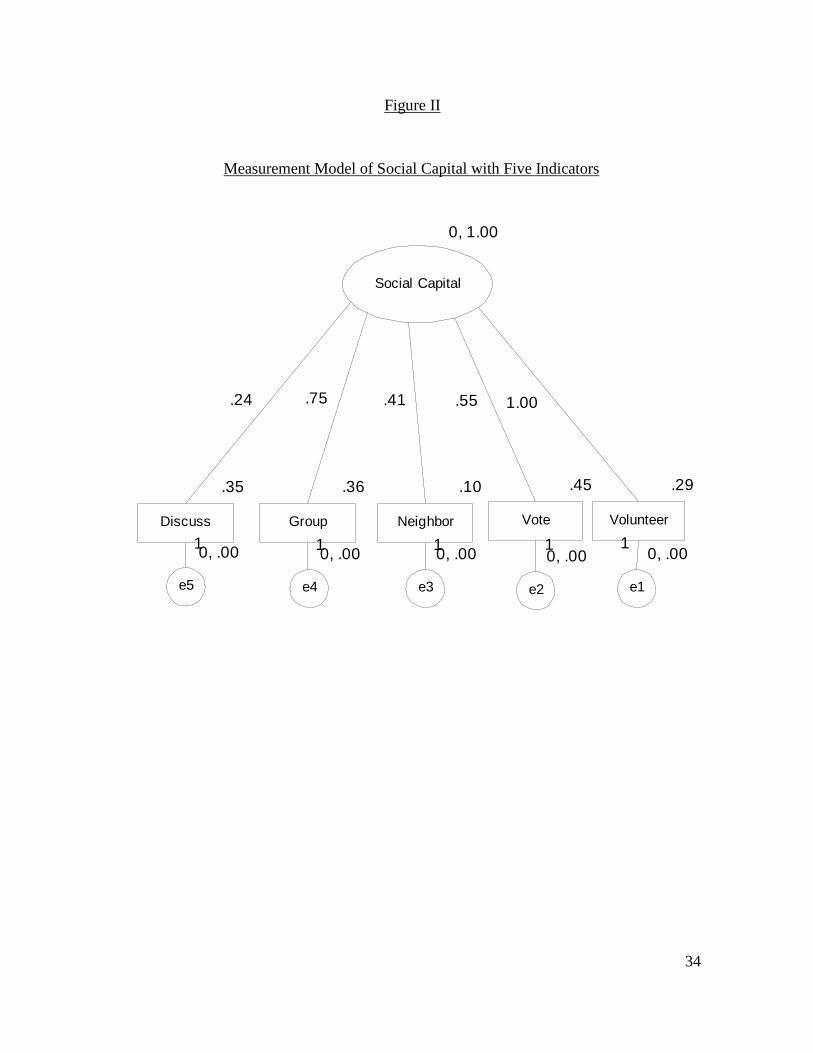
SEE FIGURE II
In Figure II, we present the results of an estimation of the measurement model of social
capital. Following the rule of thumb established above, the factor loadings suggest that four of
the five indicators are capturing the same underlying concept. Of the five, only discussion of
politics appears to underperform as an indicator of social capital.
Modeling Social Capital and Corruption
To assess the relationship between latent variables such as social capital and
corruption, we must employ a structural equation model (SEM). SEM allows us to
simultaneously specify measurement models and the causal relationship between latent
variables. This allows us to bridge the problems of measurement that previous research has
identified when it comes to state-level corruption and social capital in particular. We can then
specify structural relationships among the three latent variables (corruption, social capital, and
legal framework) while also controlling for observed variables identified as robustly affecting
state-level corruption. In addition to the latent variables of social capital and legal framework,
we also control for the level of population, the percentage of residents with college degrees, the
level of judicial employment, and whether the state is in the South. The sources and details of
measurement for these variables are presented in Appendix B.
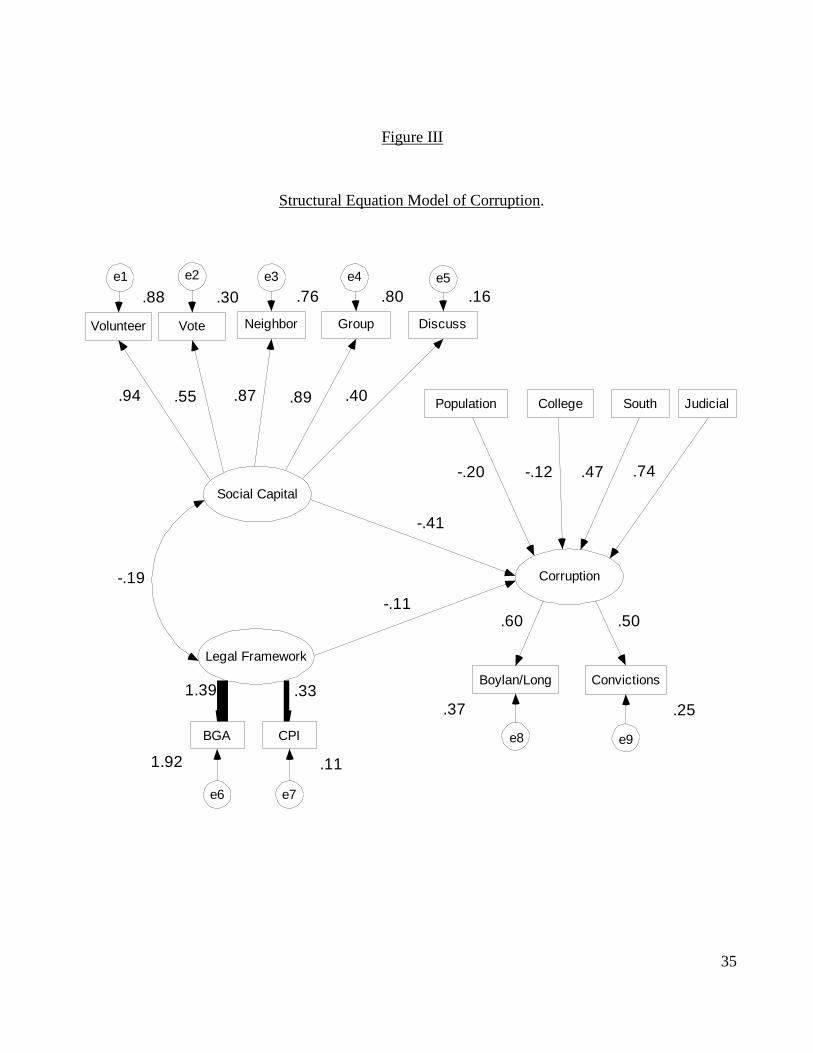
SEE FIGURE III
28
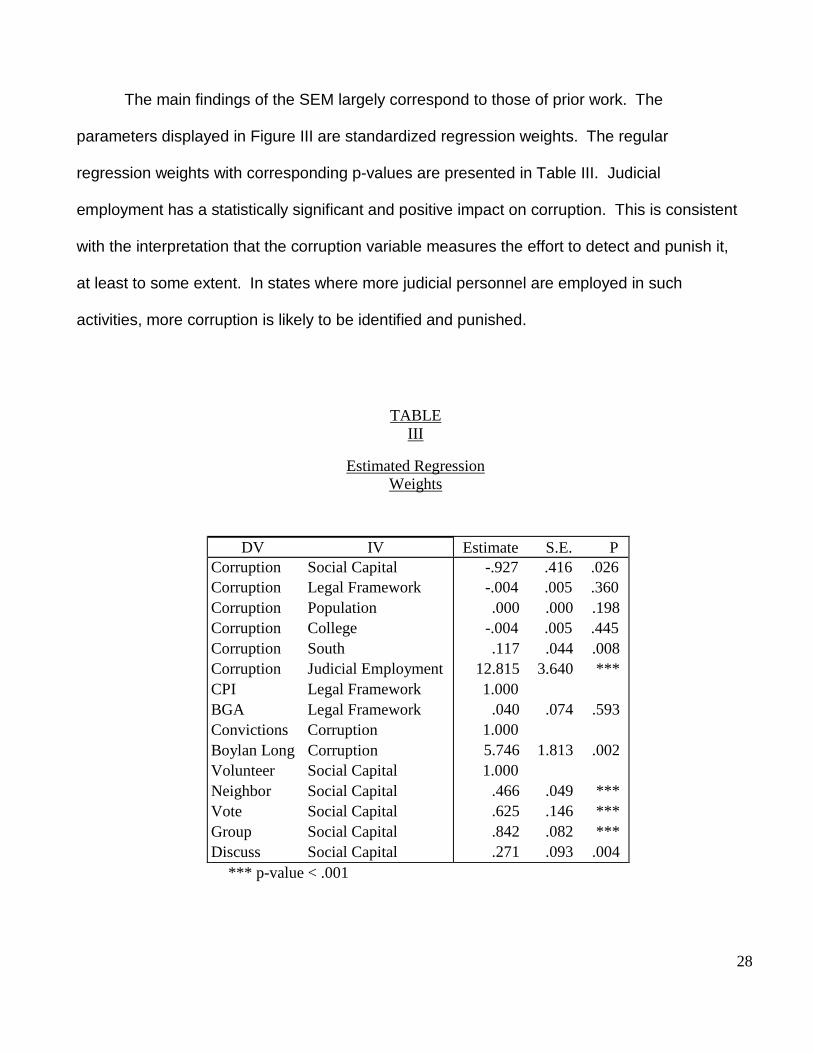
The main findings of the SEM largely correspond to those of prior work. The
parameters displayed in Figure III are standardized regression weights. The regular
regression weights with corresponding p-values are presented in Table III. Judicial
employment has a statistically significant and positive impact on corruption. This is consistent
with the interpretation that the corruption variable measures the effort to detect and punish it,
at least to some extent. In states where more judicial personnel are employed in such
activities, more corruption is likely to be identified and punished.
TABLE
III
Estimated Regression Weights
DV IV Estimate S.E. P Corruption Social Capital Corruption Legal Framework Corruption Population Corruption College Corruption South Corruption Judicial Employment CPI Legal Framework BGA Legal Framework Convictions Corruption Boylan Long Corruption Volunteer Social Capital Neighbor Social Capital Vote Social Capital Group Social Capital Discuss Social Capital
-.927 .416 .026 -.004 .005 .360 .000 .000 .198
-.004 .005 .445 .117 .044 .008
12.815 3.640 *** 1.000
.040 .074 .593 1.000 5.746 1.813 .002 1.000
.466 .049 ***
.625 .146 ***
.842 .082 ***
.271 .093 .004 *** p-value < .001

29
Southern states, previously identified as more corrupt, are indeed positively associated
with corruption though that effect is not statistically significant. Education, indicated by the
percentage of state residents who have college degrees, has a negative regression weight but
that effect is not statistically significant. Consistent with Hill (2003), the legal framework appears
to have no significant influence on the level of corruption.
While the contours of formal institutional structure of a state do not affect corruption, the
informal institutions within the state appear to be very important. The impact of social capital on
corruption is statistically significant and, as expected, negative. States with higher levels of
social capital appear to have less corruption. This is consistent with the interpretation that social
capital effectively checks corrupt activity.
While the findings of the SEM model are broadly in accord with prior work, one broad
caveat bears mention. There are temporal issues in the data structure that may complicate the
analysis. The Boylan and Long data were collected prior to 2003 while the corruption data are
from the years 2001 to 2010. Meanwhile, the dates that the independent variables were
collected range widely. While data constraints necessitate this, some of the information that
may be gleaned from a panel analysis may be lost in this cross-sectional approach.
Summary
What can we conclude about the differences between Illinois and Indiana? The literature
on public corruption reveals the difficulties of measuring an activity whose participants
assiduously avoid detection. Although assessments of the levels of corruption in the two states
vary according the indicators used, the two indicators we adopt in our SEM suggest that Illinois
has considerably more such activity than Indiana (roughly one standard deviation more
30
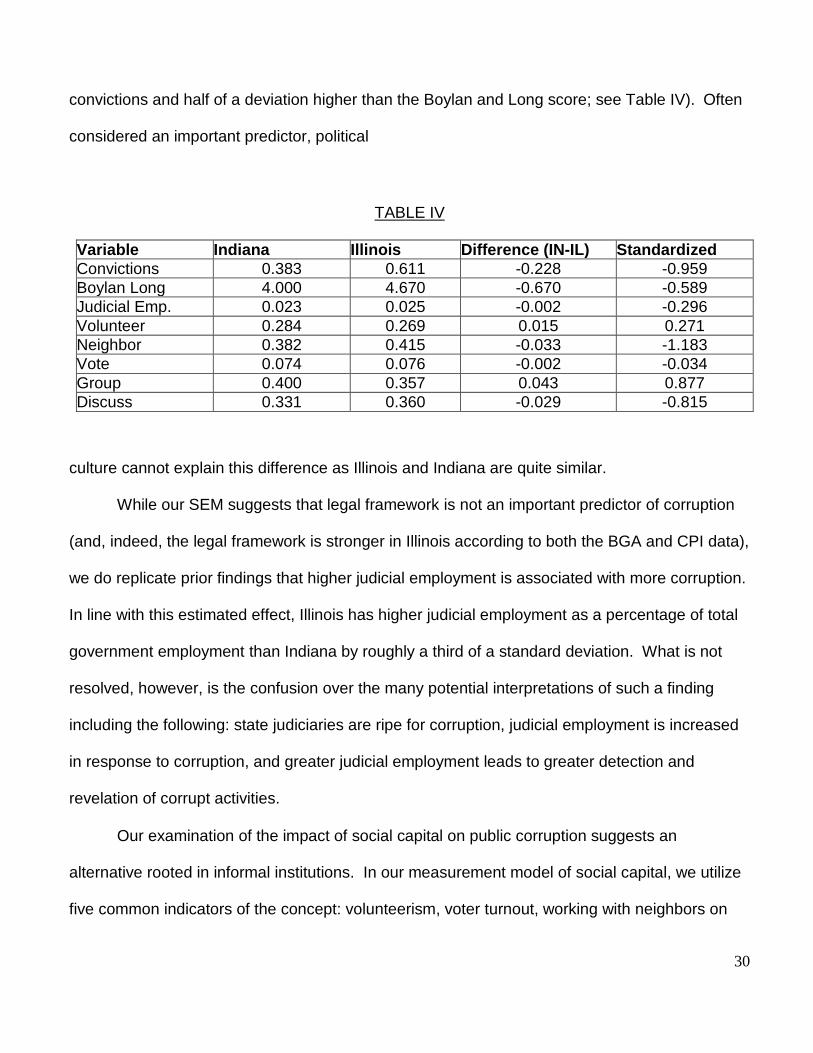
convictions and half of a deviation higher than the Boylan and Long score; see Table IV). Often
considered an important predictor, political
TABLE IV
Variable Indiana Illinois Difference (IN-IL) Standardized Convictions 0.383 0.611 -0.228 -0.959 Boylan Long 4.000 4.670 -0.670 -0.589 Judicial Emp. 0.023 0.025 -0.002 -0.296 Volunteer 0.284 0.269 0.015 0.271 Neighbor 0.382 0.415 -0.033 -1.183 Vote 0.074 0.076 -0.002 -0.034 Group 0.400 0.357 0.043 0.877 Discuss 0.331 0.360 -0.029 -0.815
culture cannot explain this difference as Illinois and Indiana are quite similar.
While our SEM suggests that legal framework is not an important predictor of corruption
(and, indeed, the legal framework is stronger in Illinois according to both the BGA and CPI data),
we do replicate prior findings that higher judicial employment is associated with more corruption.
In line with this estimated effect, Illinois has higher judicial employment as a percentage of total
government employment than Indiana by roughly a third of a standard deviation. What is not
resolved, however, is the confusion over the many potential interpretations of such a finding
including the following: state judiciaries are ripe for corruption, judicial employment is increased
in response to corruption, and greater judicial employment leads to greater detection and
revelation of corrupt activities.
Our examination of the impact of social capital on public corruption suggests an
alternative rooted in informal institutions. In our measurement model of social capital, we utilize
five common indicators of the concept: volunteerism, voter turnout, working with neighbors on
31
community problems, discussions of politics, and group membership. Table IV shows
standardized differences between Indiana and Illinois on these measures. On the two most
important indicators of social capital (volunteerism and group memberships) identified by the
SEM, Indiana scores substantially higher than Illinois. However, on the indicators that speak to
overtly political activity (holding political discussions frequently and voting), Illinois outscores
Indiana. On the final indicator (working with neighbors on community problems), the difference
between the two states is negligible. To the extent then that generalized measures of
interconnection and trust within the community are more important determinants of public
corruption, these data helps explain the difference in outcomes between the two states.
Such a finding, while supported by the data, nonetheless must be treated with skepticism.
Social capital is a difficult concept to measure and faces a number of detractors (Navarro, 2002;
Durlauf, 1999; Schuller et al., 2000). Nevertheless, even those skeptical of the role of social
capital like Ulsaner accept that generalized trust may impact the level of corruption. Our data
indicate that the kinds of interpersonal engagement that Putnam (2000) believes build trust may
indeed explain state-level variation in public corruption.

32
33
Figure I
Measurement Model of Corruption with Four Indicators
0, 1.00
Corruption
-.01 -.17
.10 1.00
.51 68.47 3.48 .52
BGA
1 0, .01
CPI 1 0, 72.86
Boylan.Long 1
0, 1.27
Convictions 1 0, -.94
e1 e2 e3 e4
34
Figure II
Measurement Model of Social Capital with Five Indicators
0, 1.00
Social Capital
.24 .75 .41 .55 1.00
.35 .36 .10 .45 .29
Discuss 1 0, .00
e5
Group
1 0, .00
e4
Neighbor
1 0, .00
e3
Vote
1 0, .00
e2
Volunteer
1 0, .00
e1
35
Figure III
Structural Equation Model of Corruption.
e1 .88
e2
.30 e3
.76 e4
.80 e5
.16 Volunteer
Vote
Neighbor
Group
Discuss
.94 .55 .87 .89 .40 Population
College South Judicial
Social Capital -.20 -.12 .47 .74
-.41
-.19 -.11
.60
Corruption .50
Legal Framework
Boylan/Long
Convictions
1.92
1.39
BGA
.33 CPI
.11
.37
e8
.25
e9
e6 e7

36
37
APPENDIX A
Legal Penalties for Public Corruption Violations: Illinois and Indiana
Illinois
-Bribery
CC 720 §645 Class 3 felony 2-5 years; Max $25,000 or the amount of the offense, whichever is greater
-Willful filing of false financial disclosure statement -Legislators engaging in lobbying -Legislators who participate in representation cases unlawfully -Engaging in prohibited political activities (state employees engaging in political activities during compensated time, state officials requiring them to do so) -Prohibited offer or promise (candidates and state officers promising jobs or other compensation in return for contributions) -Procurement; revolving door prohibition. -Fundraising in Sangamon County (during legislative session)
EC 5 §420/4A-107 EC 5 §420/2-101 EC 5 §420/2-104 EC 5 §420/5-15 EC 5 §420/5-30 EC 5 §420/5-45 EC 5 §420/5-40
Class A misdemeanor Max 1 year; $2,500, or the amount specified in the offense, whichever is greater
-Legislators who accept other compensation for their official duties
EC 5 §420/2-103
Petty offense
Indiana -Bribery CC §35-44-1-1 Class C felony 2-8 years; Max $10,000
-Conflict of interest is when a public servant knowingly or intentionally having a pecuniary interest in; or deriving a profit from a contract or purchase connected with an action by his governmental entity.
CC §35-44-1-3
Class D felony 6 months-3 years; Max $10,000
-Official misconduct includes receiving personal benefit because of privileged information, neglecting to pass on public records and property to successor, among other things
CC §35-44-1-2 Class A misdemeanor Max 1 year; $5,000 fine
-Profiteering from public service
CC §35-44-1-7
Class A infraction
-Failure to file a statement in a timely manner or files a deficient statement
EC §4-2-6-8 Civil penalty at a rate of not more than $10 for each day the statement remains delinquent or deficient, up to a maximum of $1,000; if intentional, Class A infraction (also subject to penalties listed in §4-2-6-
38
12)
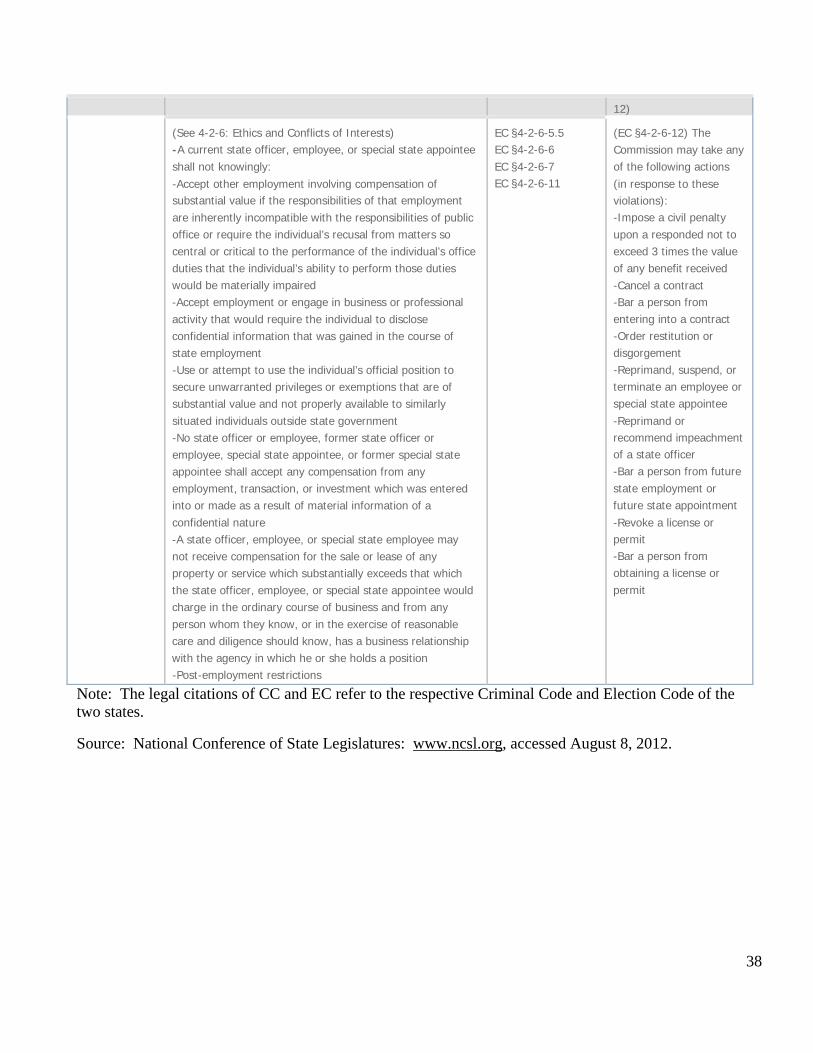
(See 4-2-6: Ethics and Conflicts of Interests) -A current state officer, employee, or special state appointee shall not knowingly: -Accept other employment involving compensation of substantial value if the responsibilities of that employment are inherently incompatible with the responsibilities of public office or require the individual’s recusal from matters so central or critical to the performance of the individual’s office duties that the individual’s ability to perform those duties would be materially impaired -Accept employment or engage in business or professional activity that would require the individual to disclose confidential information that was gained in the course of state employment -Use or attempt to use the individual’s official position to secure unwarranted privileges or exemptions that are of substantial value and not properly available to similarly situated individuals outside state government -No state officer or employee, former state officer or employee, special state appointee, or former special state appointee shall accept any compensation from any employment, transaction, or investment which was entered into or made as a result of material information of a confidential nature -A state officer, employee, or special state employee may not receive compensation for the sale or lease of any property or service which substantially exceeds that which the state officer, employee, or special state appointee would charge in the ordinary course of business and from any person whom they know, or in the exercise of reasonable care and diligence should know, has a business relationship with the agency in which he or she holds a position -Post-employment restrictions
EC §4-2-6-5.5 EC §4-2-6-6 EC §4-2-6-7 EC §4-2-6-11
(EC §4-2-6-12) The Commission may take any of the following actions (in response to these violations): -Impose a civil penalty upon a responded not to exceed 3 times the value of any benefit received -Cancel a contract -Bar a person from entering into a contract -Order restitution or disgorgement -Reprimand, suspend, or terminate an employee or special state appointee -Reprimand or recommend impeachment of a state officer -Bar a person from future state employment or future state appointment -Revoke a license or permit -Bar a person from obtaining a license or permit
Note: The legal citations of CC and EC refer to the respective Criminal Code and Election Code of the two states.
Source: National Conference of State Legislatures: www.ncsl.org, accessed August 8, 2012.
39
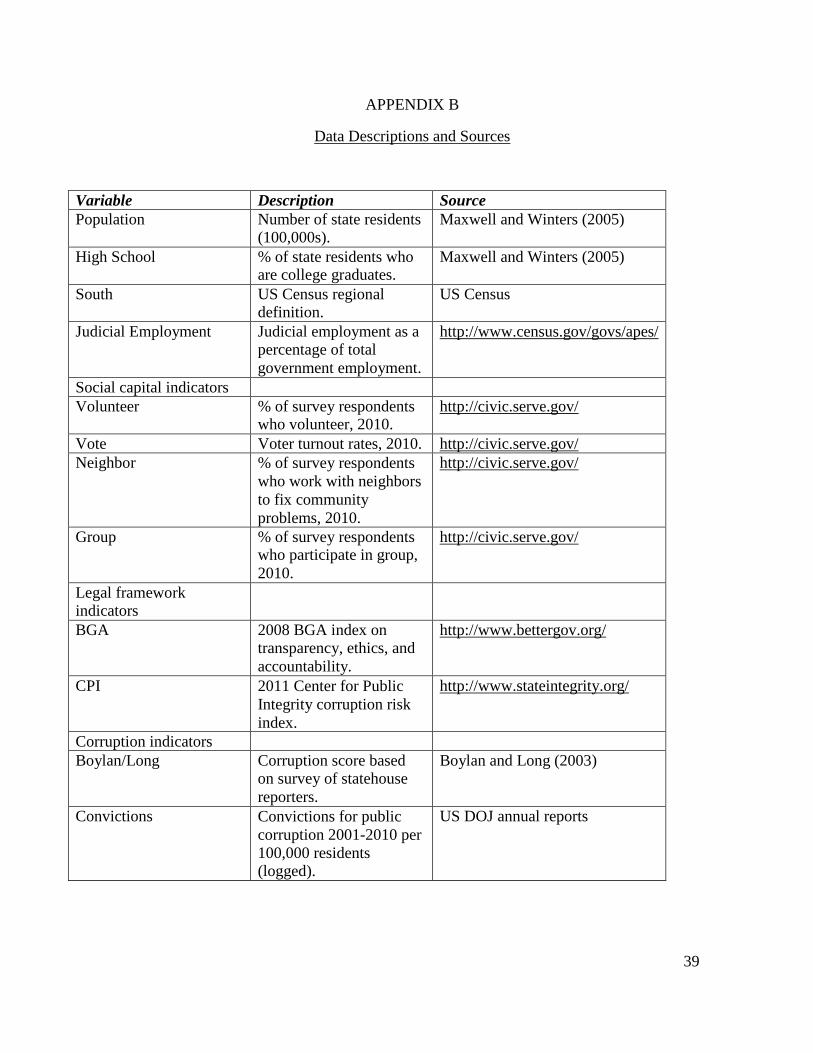
APPENDIX B
Data Descriptions and Sources
Variable Description Source Population Number of state residents
(100,000s). Maxwell and Winters (2005)
High School % of state residents who are college graduates.
Maxwell and Winters (2005)
South US Census regional definition.
US Census
Judicial Employment Judicial employment as a percentage of total government employment.
http://www.census.gov/govs/apes/
Social capital indicators Volunteer % of survey respondents
who volunteer, 2010. http://civic.serve.gov/
Vote Voter turnout rates, 2010. http://civic.serve.gov/ Neighbor % of survey respondents
who work with neighbors to fix community problems, 2010.
http://civic.serve.gov/
Group % of survey respondents who participate in group, 2010.
http://civic.serve.gov/
Legal framework indicators
BGA 2008 BGA index on transparency, ethics, and accountability.
http://www.bettergov.org/
CPI 2011 Center for Public Integrity corruption risk index.
http://www.stateintegrity.org/
Corruption indicators Boylan/Long Corruption score based
on survey of statehouse reporters.
Boylan and Long (2003)
Convictions Convictions for public corruption 2001-2010 per 100,000 residents (logged).
US DOJ annual reports

40
References Adsera, A. and C. Boix and M. Payne. 2003. “Are you being served? Political accountability and quality of government.” Journal of Laws Economics & Organization, 19, 445-490.
Almond, Gabriel A. and Sidney Verba. 1963. The Civic Culture. Princeton, NJ: Princeton University Press.
Alt, J.E. and D.D. Lassen. 2008. “Political and Judicial Checks on Corruption: Evidence from American State Governments.” Economics & Politics, 20, 33-61.
Banfield, Edward C. and James Q. Wilson. 1966. City Politics. Random House Vintage Press.
Barnhart, Bill and Gene Schlickman. 1999. Kerner: The Conflict of Intangible Rights. Urbana: University of Illinois Press.
Berg, Larry L., Harlan Hahn and John R. Schmidhauser. 1976. Corruption in the American Political System. Morristown, NJ: General Learning Press.
Bigham, Darrell E., ed. 2001. The Indiana Territory, 1800-2000: A Bicentennial Perspective. Indianapolis: Indiana Historical Society.
Biles, Roger. 1984. Big City Boss in Depression and War: Mayor Edward J. Kelly of Chicago. DeKalb: University of Northern Illinois Press.
. 2002. Crusading Liberal: Paul H. Douglas of Illinois. DeKalb: Northern Illlinois University
Press. . 1995. Richard J. Daley: Politics, Race, and the Governing of Chicago. DeKalb: Northern
Illinois University Press.
Bjornskov, C. 2004. “How does Social Trust Affect Economic Growth?” Working Paper 06-02, Department of Economics, Aahus School of Business.
Bodenhamer, David J. and Robert G. Barrows, eds. 1994. Encyclopedia of Indianapolis. Bloomington: Indiana University Press.
Bowen, Otis R., with William Du Bois, Jr. Doc: Memories from a Life in Public Service. Bloomington: Indiana University Press.
Boylan, Richard T. and Cheryl X. Long, “Measuring Public Corruption in the American States: A Survey of State House Reporters.” State Politics and Policy Quarterly, Vol. 3, No. 4 (Winter 2003), 420-438.
Brackett, Elizabeth. 2009. Pay to Play. Chicago: Ivan R. Dee Publisher.
Bukowski, Douglas. 1998. Big Bill Thompson, Chicago, and the Politics of Image. Urbana: University of Illinois Press.
41
Byrne, Jane. 2003, 2nd Edition. My Chicago. Foreword by Paul Simon. Evanston: Northwestern University Press.
Campante, Filipe R. and Quoc-Anh Do, “Isolated Capital Cities, Accountability and Corruption: Evidence from US States.” Faculty Research Working Paper Series, Harvard Kennedy School, John F. Kennedy School of Government.
Campbell, Tracy. 2005. Deliver the Vote: A History of Election Fraud, and American Political Tradition, 1742-2004. New York: Carroll & Graf Publishers
Carmony, Donald F., ed. 1966. Indiana: A Self-Appraisal. Bloomington: Indiana University Press.
Cayton, Andrew R.L. and Susan E. Gray, eds. 2001. The American Midwest: Essays on Regional History. Bloomington: Indiana University Press.
Church, Charles A. 1912. History of the Republican Party in Illinois, 1854-1912. Rockford, IL: Wilson Brothers Company.
Clavel, Pierre and Wim Wiewel, eds. 1991. Harold Washington and the Neighborhoods: Progressive City Government in Chicago, 1983-1987. New Brunswick, NJ: Rutgers University Press.
Cordis, A. S. 2009. “Judicial Checks on Corruption in the United States. Economics of Governance. 10, 375-401.
Coronel, Sheila, “Corruption and the Watchdog Role of the News Media,” Chapter 5 in World Bank Report, accessed July 9, 2012 at http://www.hks.harvard.edu/fs/pnorris/Acrobat/WorldBankReport/Chapter%205%20Coronel.pdf
Dailey, J. Roberts, with Floyd Creech. 1988. Mr. Speaker: Inside six sessions of the Indiana House of Representatives. Muncie, IN: Fox Ridge Publications.
Dalton, Robert. 1983. “Governors and Ethics,” in Thad L. Beyle and Lynn R. Muchmore, eds. 1983. Being Governor: The View from the Office. Durham: Duke University Press, 67-76.
Daniels, Mitch. 2011. Keeping the Republic. New York: Penguin Group.
Despres, Leon. 2005. Challenging the Daley Machine: A Chicago Alderman’s Memoir. With Kenan Heise. Foreword by Mike Royko. Evanston: Northwestern University Press.
DeVise, Pierre. 1967. Chicago’s Widening Color Gap. Inter-University Social Research Committee, Report Number 2.
Dobyns, Fletcher. 1932. The Underworld of American Politics. New York: Published by author.
Douglas, Paul H. 1932. The Coming of a New Party. Foreword by John Dewey. New York: Whittlesey House, McGraw-Hill.
Dran, Ellen M., Robert B. Albritton and Mikel Wyckoff. 1991. “Surrogate versus Direct Measures of Political Culture: Explaining Participation and Policy Attitudes in Illinois.” Publius. 21:2, 15-30.
42
Durlauf, S. 1999. “The Case ‘against’ Social Capital.” Focus: Newsletter for the Institute for Research on Poverty. Vol. 20:3, 1-5.
Elazar, Daniel J. 1972. American Federalism: A View from the States. 2nd Ed. New York: Thomas Y. Crowell Company.
Erikson, Robert S., John P. McIver and Gerald C. Wright, Jr. 1987. “State Political Culture and Public Opinion.” American Political Science Review, 81:3, 797-814.
Felknor, Bruce L. 1966. Dirty Politics. New York: W.W. Norton.
Fenton, John H. 1966. Midwest Politics. New York: Holt, Rinehart and Winston. Fehrenbacher, Don E. 1957. Chicago Giant: A Biography of ‘Long John’ Wentworth. Madison, WI: The American History Research Center, Inc.
Fleming, Charles Francis. 1966. The White Hat: Henry Frederick Schricker: A Political Biography. Preface by Matthew E. Welsh and Nelson G. Grills. N.P.
Glaeser, E.L. and R.E. Saks. 2006. “Corruption in America.” Journal of Public Economics, 90, 1053- 1072.
Goel, R. and M. Nelson. 2011. “Measures of Corruption and Ceterminants of US corruption. Economics of Governance, 12, 155-176.
Goodall, Hurley C. 1995. Inside the House: My Years in the Indiana Legislature, 1978-1992. Foreword by Raymond H. Scheele. Muncie: Ball State University Press.
Gosnell, Harold F., 2nd ed. 1968. Machine Politics: Chicago Model. Chicago: University of Chicago Press, Phoenix Books.
Gove, Samuel, and Louis H. Masotti. 1982. After Daley: Chicago Politics in Transition. Urbana: University of Illinois Press.
Granger, Bill and Lori Granger. 1987. Lords of the Last Machine: The Story of Politics in Chicago. New York: Random House.
Green, Paul M. and Melvin G. Holli. 1987. The Mayors: The Chicago Political Tradition. Carbondale: Southern Illinois University Press.
Lyceum Books, Inc.
. 1991. Restoration 1989: Chicago Elects a New Daley. Chicago:
Grimshaw William J. 1992. Bitter Fruit: Black Politics and the Chicago Machine, 1931-1991. Chicago: University of Chicago Press.
Grossman, James R., Ann Durkin Keating and Janice L Reiff, eds. 2004. The Encyclopedia of Chicago. Chicago: University of Chicago Press.
Gugin, Linda C. and James E. St. Clair, eds. 2006. The Governors of Indiana. Indianapolis: Indiana Historical Society Press.
43
Guterbock, Thomas M. 1980. Machine Politics in Transition: Party and Community in Chicago. Chicago: University of Chicago Press.
Harpster, Jack. 2009. The Railroad Tycoon Who Built Chicago: A Biography of William B. Ogden. Carbondale: Southern Illinois University Press.
Harris, Donna. “Bonding Social Capital and Corruption: A Cross-National Analysis,” Environmental Economy and Policy Research Discussion Paper, University of Cambridge. Available at www.landecon.cam.ac.uk/RePEc/pdf/200727.pdf. Accessed August 16, 2012.
Hartley, Robert E. 1999. Paul Powell of Illinois: A Lifelong Democrat. Carbondale: Southern Illinois University Press.
. 2009. Paul Simon: The Political Journey of an Illinois Original. Carbondale: Southern
Illinois University Press. Heise, Kenan. 1990. The Chicagoization of America, 1893-1917. Forward by Bill Granger. Evanston: Chicago Historical Bookworks.
Hill, Kim Quaile. 2003. “Democratization and Corruption: Systematic Evidence from the American States.” American Politics Research. 31:6, 613-631.
Holli, Melvin G. and Paul M. Green. 1989. Bashing Chicago Traditions: Harold Washington’s Last Campaign. Grand Rapids, Michigan: William B. Eerdmans Publishing.
Indiana Writers’ Project. 1961, 5th Printing. Indiana: A Guide to the Hoosier State. New York: Oxford University Press.
Johnson, Charles A. 1976. “Political Culture in American States: Elazar’s Formulation Examined.” American Journal of Political Science. 20:3, 491-509.
Johnson, Curt, with R. Craig Sautter. 1998. The Wicked City: Chicago from Kenna to Capone. Introduction by Roger Ebert. Highland Park, IL: Da Capo Press.
Johnston, Michael. 1983. “Corruption and Political Culture in America: An Empirical Perspective.” Publius. 13:1, 19-39.
Kenney, David. 1990. A Political Passage: The Career of Stratton of Illinois. Carbondale: Southern Illinois University Press.
, and Robert E. Hartley. 2003. An Uncertain Tradition: U.S. Senators from Illinois.
Carbondale: Southern Illinois University Press. Killian, Michael, Connie Fletcher and F. Richard Ciccone. 1979. Who Runs Chicago? New York: St. Martin’s Press.
Knack, Stephen. 2002. “Social Capital and the Quality of Government: Evidence from the States,” American Journal of Political Science 46 (October), 772-87.
La Porta, R., Lopez-Silanes, F., Schleifer, A., and Vishney, R.W. 1997, “Trust in Large Organizations.” American Economic Review Papers and Proceedings Vol. 87, 333-38.

Leibowitz, Irving. 1964. My Indiana. Englewood Cliffs, NJ: Prentice-Hall. Lieski, Joel. 2010. “The Changing Regional Subcultures of the American States and the Utility of a New Cultural Measure.” Political Research Quarterly. 63:3, 538-552.
Kleppner, Paul. 1985. Chicago Divided: The Making of a Black Mayor. DeKalb: Northern Illinois University Press.
Laski, James J. 2008. My Fall from Grace: City Hall to Prison Walls. Bloomington, IN: Author House.
Madison, James H. 1982. Indiana Through Tradition and Change: A History of the Hoosier State and Its People, 1920-1945. Indianapolis: Indiana Historical Society.
Masters, Charles F. 2007. Governor Henry Horner, Chicago Politics and the Great Depression. Carbondale: Southern Illinois University Press.
Mathewson, Joe. 1974. Up Against Daley. LaSalle, IL: Open Court.
Maxwell, Amanda E. and Richard F. Winters. 2005. “A Quarter Century of Data on Political Corruption.” Paper delivered at the Midwest Political Science Association Meeting, Chicago, IL.
, and Richard F. Winters. 2011. “Political Corruption in America.” Accessed February 2,
2012 at www.dartmouth.edu/~govt/docs/Winters.pdf. Meier, Kenneth J. and Thomas M. Holbrook. 1992. “I seen my opportunities and I took ‘em:’ Political Corruption in the American States.” Journal of Politics 54, 135-155.
Merriner, James L. 2004. Grafters and Goo Goos: Corruption and Reform in Chicago, 1833-2003. Carbondale: Southern Illinois University Press.
. 1999. Mr. Chairman: Power in Dan Rostenkowski’s America. Carbondale: Southern
Illinois University Press. McNeill, Robert J. 1966. Democratic Campaign Financing in Indiana, 1964. Bloomington: Institute of Public Administration, Indiana University; Citizens’ Research Foundation.
Merriam, Charles Edward. 1929. Chicago: A More Intimate View of Urban Politics. New York: MacMillan.
Mitchell, Stephen A. 1959. Elm Street Politics. New York: Oceana Publications, Inc.
Murray, David. 1968. Charles Percy of Illinois. New York: Harper & Row.
Nash, Jay Roberts. 1985. Makers & Breakers of Chicago: From Long John Wentworth to Richard J. Daley. Chicago: Academy Chicago Publishers.
National Conference on Citizenship. 2010. Illinois Civic Health Index. Washington, DC: McCormick Foundation and National Conference on Citizenship.
45
Navarro, Vicente. 2002. “A Critique of Social Capital.” International Journal of Health Services. Vol. 32:3, 423-432.
Niblick, John L. 1973. The Life and Times of a Hoosier Judge. Indianapolis: Hawthorne Publishing.
Nice, David C. 1986. “The Policy Consequences of Political Corruption.” Political Behavior, 8:3, 287- 295.
North, D.C. 1990. Institutions, Institutional Change, and Economic Performance. Cambridge: Cambridge University Press.
Nye, Russel B. 1959. Midwestern Progressive Politics: A Historical Study of its Origins and Development, 1970-1958. New York: Harper Torchbooks, Harper & Row.
O’Connor, Len. 1975. Clout: Mayor Daley and His City. New York: Avon Books.
. 1977. Requiem: The Decline and Demise of Mayor Daley and His Era. Chicago: Contemporary Books, Inc.
Pensonean, Taylor. 2006. Powerhouse: Arrington from Illinois. Baltimore: Heritage Special Edition, American Literary Press.
Puglisi, Riccardo and James M. Snyder, Jr. 2010. “Newspaper Coverage of Political Scandals,” accessed July 9, 2012, at http://scholar.harvard.edu/jsnyder/files/political_scandals_22_complete_0_0.pdf
Putnam, Robert. 2001. Bowling Alone: The Collapse and Revival of American Community. New York: Simon and Schuster.
Rakove, Milton. 1975. Don’t Make No Waves, Don’t Back No Losers. Bloomington: Indiana University Press.
. 1979. We Don’t Want Nobody Nobody Sent. Bloomington: Indiana University Press.
Richter, William L., Frances Burke and Jameson W. Doig. 1990. Combating Corruption, Encouraging Ethics: A Sourcebook for Pubic Service Ethics. Washington, DC: American Society for Public Administration.
Rose-Ackerman, Susan. 1999. Corruption and Government: Causes, Consequences, and Reform. New York/Cambridge: Cambridge University Press.
Ross, Shelley. 1988. Fall From Grace: Sex, Scandal, and Corruption in American Politics from 1702 to the Present. New York: Ballantine Books.
Royko, Mike. 1971. Boss: Richard J. Daley of Chicago. New York: Signet Publishers.
Sak, P., and S. Knack. 2001. “Trust and Growth.” The Economic Journal. Vol. 111, 295-321.
Scheele, Raymond H. 1983. “Political Parties in Indiana,” in Hojnacki, William P., ed. Politics and Public Policy in Indiana: Prospects for Change in State and Local Government. Dubuque, Iowa: Kendall/Hunt, 15-29.
46
. 1994. “Rip in Middletown.” Texas Journal of Political Studies, Vol. 16:2, (Spring-Summer). Schmidt, John R. 1989. The Mayor Who Cleaned Up Chicago: A Political Biography of William E. Dever. DeKalb: Northern Illinois Press.
Schuller, T., and S. Baron and J. Field. 2000. “Social Capital: A Review and Critique,” in S. Baron, J. Field and T. Schuller, eds., Social Capital: Critical Perspectives. Oxford: Oxford University Press. 1- 38.
Simpson, Dick. 2001. Rogues, Rebels, and Rubber Stamps: the Politics of the Chicago City Council from 1963 to the Present. Boulder, CO: Westview Press.
Spears, Timothy B. Chicago Dreaming: Midwesterners and the City, 1871-1919. Chicago: University of Chicago Press.
Steiner, Gilbert Y. and Samuel K. Gove. 1960. Legislative Politics in Illinois. Urbana: University of Illinois Press.
Sterrett, David, Melissa Mouritsen Zmuda, Thomas J. Gradel and Dick Simpson. 2012. Green Grass and Graft: Corruption in the Suburbs. Anti-Corruption Report Number 6, June 25, 2012. Department of Political Science, University of Illinois at Chicago.
Sullivan, Frank. 1989. Legend: the Only Inside Story About Richard J. Daley. Chicago: Bonus Books, Inc.
Suphachol Suphachalasai, 2005. "Bureaucratic Corruption and Mass Media," Environmental Economy and Policy Research Working Papers 05.2005, University of Cambridge, Department of Land Economics, revised 2005. Accessed July 9, 2012 at http://ideas.repec.org/p/wpa/wuwppe/0502014.html.
Tarr, Arthur Joel. 1971. A Study in Boss Politics: William Lorimer of Chicago. Urbana: University of Illinois Press.
Travis, Dempsey J. 1989, Harold: The People’s Mayor. Chicago: Urban Research Press, Inc.
Uslaner, E. M. Forthcoming. “The Civil State: Trust, Polarization, and the Quality of State Government,” in Jeffrey Cohen, ed., Public Opinion in State Politics. Stanford, CA: Stanford University Press.
, 2004. “Trust and Corruption,” in Lambsdorf, J.G., M. Traube, and M. Schramm, eds.,
Corruption and the New Institutional Economics. London: Routledge.
, 2001. “Trust and Corruption,” Paper presented at the Conference on Political Scandals: Past and Present, at University of Salford, June, 2001.
Walker, Dan. 2007. The Maverick and the Machine: Governor Dan Walker Tells His Story. Carbondale: Southern Illinois University Press.
Warren, Mark E. 2004. “Social Capital and Corruption,” Democracy and Society. Spring, 2004.
Watt, William J. 1981. Bowen: The Years as Governor. Indianapolis: Bierce Associates, Inc.
47
Wendt, Lloyd, and H. Kogan. 1967. Bosses in Lusty Chicago. Chicago: Bobbs-Merrill.
. 2005. Big Bill of Chicago. Evanston: Northwestern University Press. Originally published in 1953 by Bobbs Merrill, Inc.
White, Theodore. 1962. The Making of the President, 1960. New York: Atheneum
Publishers. Zak, Paul J. and Stephen Knack. 2001. “Trust and Growth.” Economic
Journal, 111:470.