the impact of beam broadening on the quality of radar
TRANSCRIPT
The Impact of Beam Broadening on the Quality of Radar Polarimetric Data
ALEXANDER V. RYZHKOV
Cooperative Institute for Mesoscale Meteorological Studies, University of Oklahoma, and NOAA/OAR/National Severe StormsLaboratory, Norman, Oklahoma
(Manuscript received 19 January 2006, in final form 17 August 2006)
ABSTRACT
The impact of beam broadening on the quality of radar polarimetric data in the presence of nonuniformbeam filling (NBF) is examined both theoretically and experimentally. Cross-beam gradients of radarreflectivity Z, differential reflectivity ZDR, and differential phase �DP within the radar resolution volumemay produce significant biases of ZDR, �DP, and the cross-correlation coefficient �hv. These biases increasewith range as a result of progressive broadening of the radar beam. They are also larger at shorter radarwavelengths and wider antenna beams.
Simple analytical formulas are suggested for estimating the NBF-induced biases from the measuredvertical and horizontal gradients of Z, ZDR, and �DP. Analysis of polarimetric data collected by the KOUNWeather Surveillance Radar-1988 Doppler (WSR-88D) demonstrates that frequently observed perturba-tions of the radial �DP profiles and radially oriented “valleys” of �hv depression can be qualitatively andquantitatively explained using the suggested NBF model.
1. Introduction
The Joint Polarization Experiment (JPOLE) andother validation studies demonstrate superior perfor-mance of dual-polarization radar for rainfall estimationand radar echo classification (e.g., Ryzhkov et al.2005a). These polarimetric products, however, havebeen validated at relatively close distances from theradar. To our knowledge, the maximal distance atwhich polarimetric analysis and/or classification wasever verified using in situ measurements is 120 km(Loney et al. 2002). In most studies, the largest range towhich polarimetric rainfall estimation was tested withrain gauges does not exceed 100 km (e.g., Brandes et al.2001, 2002; May et al. 1999; Le Bouar et al. 2001; Ryzh-kov et al. 2005b). On the other hand, Giangrande andRyzhkov (2003) and Ryzhkov et al. (2005a) show thatalthough the polarimetric method for rain measure-ments still outperforms the conventional one beyond100 km from the radar, the degree of improvementdecreases with distance.
Progressive beam broadening and stronger impact ofnonuniform beam filling (NBF) is one of the reasons
why the quality of polarimetric information deterio-rates with range. Beam broadening is a common prob-lem for both polarimetric and conventional (nonpola-rimetric) radar. The issue of the vertical profile ofreflectivity (VPR) correction for precipitation measure-ments with conventional radar is addressed in extendedliterature (see, e.g., the overview in Meischner 2004).Much less effort has been made to assess similar prob-lems regarding polarimetic variables such as the differ-ential reflectivity ZDR, the differential phase �DP, thespecific differential phase KDP, the depolarization ratioLDR, and the cross-correlation coefficient �hv.
Adverse effects of NBF on polarimetric measure-ments are further exacerbated if the antenna patternsfor horizontal and vertical polarizations are not identi-cal. Theoretical formulas for the ZDR, LDR, and �hv
biases caused by the antenna pattern mismatch are pre-sented in the book by Bringi and Chandrasekar (2001).The errors in ZDR due to mismatched copolar patternstogether with intrinsic reflectivity gradients across thebeam can be quite high at the periphery of strong stormcores (Herzegh and Carbone 1984; Pointin et al. 1988).
NBF may also cause significant perturbations of theradial profile of the differential phase (Ryzhkov andZrnic 1998; Gosset 2004). Such perturbations of �DP
result in spurious values of its radial derivative KDP andstrong biases in the KDP-based estimates of the rain
Corresponding author address: Alexander V. Ryzhkov,CIMMS/NSSL, 120 David L. Boren Blvd., Norman, OK 73072.E-mail: [email protected]
VOLUME 24 J O U R N A L O F A T M O S P H E R I C A N D O C E A N I C T E C H N O L O G Y MAY 2007
DOI: 10.1175/JTECH2003.1
© 2007 American Meteorological Society 729
JTECH2003
Unauthenticated | Downloaded 12/23/21 11:02 AM UTC

rate. These adverse effects are commonly manifested asthe appearance of negative KDP in the regions ofstrongly nonuniform precipitation and become morepronounced as the physical size of the radar resolutionvolume increases at longer distances.
The magnitude of the cross-correlation coefficient�hv is closely related to the distribution of the differen-tial phase within the radar resolution volume. Largecross-beam gradients of �DP may cause noticeable de-crease of �hv, which is, in its turn, accompanied byhigher statistical errors in the measurements of all po-larimetric variables (Ryzhkov 2005).
Strong vertical gradients of radar variables are com-monly observed in the presence of the bright band instartiform rain. Beam broadening causes notablesmearing of the brightband polarimetric signatures atthe distances as close as 40–50 km from the radar (Gi-angrande et al. 2005). Such a smearing makes polari-metric classification of the melting layer more difficult,and estimation of rainfall becomes a challenge.
In this paper, we attempt to quantify the effects ofbeam broadening on polarimetric measurements usinga simple model of NBF. We assume that the antennapatterns at the two orthogonal polarizations are per-fectly matched and the biases of the measured ZDR,�DP, and �hv are solely due to linear cross-beam gradi-ents of different radar variables. In section 2, closed-form analytical solutions for the biases are obtainedusing this simplified model of gradients and the Gauss-ian antenna pattern. Section 3 contains analysis of thecross-beam gradients and the corresponding biases es-timated from real data collected with the polarimetricprototype of the S-band Weather Surveillance Radar-1988 Doppler (WSR-88D) in Oklahoma. In section 4,we simulate the smearing effect of beam broadening onthe polarimetric signatures of the melting layer for dif-ferent antenna beamwidths and compare results ofsimulations with observational data. Finally, in section5 we discuss practical implications of the observed ef-fects.
2. Theoretical analysis
In the case of weather scatterers, the voltage vectorsof the transmitted (Vt) and received (V) waves are re-lated as
�Vh
Vv�� C1�Thh 0
0 Tvv��Shh Shv
Shv Svv��Thh 0
0 Tvv��Vh
t
Vvt �,
�1�
where matrix elements Shh, Svv, and Shv represent back-scattering coefficients of hydrometeors in the radar
resolution volume and Thh and Tvv describe phase shiftsand attenuations for H and V waves along the propa-gation path:
Thh � exp��j�h � �h�, �2�
Tvv � exp��j�v � �v�, �3�
where �h,v is the phase shift and �h,v is the attenuation.The differential phase �DP is defined as
�DP � 2��h � �v�. �4�
The coefficient C1 is a constant depending on radarparameters and range from the scatterers (see the ap-pendix). If both H and V waves are transmitted simul-taneously [i.e., V t � (Vt, Vt)], then
Vh � C1�Thh2 Shh � ThhTvvShv�Vt, �5�
Vv � C1�Tvv2 Svv � ThhTvvShv�Vt. �6�
In our analysis we will neglect the cross-coupling termsproportional to Shv in (5)–(6), which is reasonable as-sumption for rain and aggregated snow (Doviak et al.2000).
Using (5) and (6), we introduce effective radar re-flectivity factors Z(e)
h,v at orthogonal polarizations as
Zh�e� � C2|Vh|2 � Zhe�4�h �7�
and
Zv�e� � C2|Vv|2 � Zve�4�v, �8�
the effective differential reflectivity
Zdr�e� �
Zh�e�
Zv�e�
� Zdre�4��h � �v�, �9�
and the covariance
Rhv � C2V*hVv � Zhvej��DP, �10�
where
Zhv � �ZhZv�1�2|�hv|e�2��h��v� and��DP � �DP � arg��hv�. �11�
In (7)–(11), intrinsic values of the radar reflectivitiesZh,v, the differential reflectivity Zdr, and the cross-correlation coefficient �hv are defined from the secondmoments of the scattering matrix S:
Zh � C�|Shh|2, Zv � C�|Svv|2, Zdr �|Shh|2
|Svv|2,
�hv �S*hhSvv
|Shh|2 1�2|Svv|2 1�2 . �12�
730 J O U R N A L O F A T M O S P H E R I C A N D O C E A N I C T E C H N O L O G Y VOLUME 24
Unauthenticated | Downloaded 12/23/21 11:02 AM UTC
Overbars in (7), (8), and (10) mean expected values andbrackets in (12) stand for ensemble averaging. The fac-tors C2 and C� are constants defined in the appendix. Inthe absence of propagation effects and cross coupling,the effective reflectivity factors are equal to their in-trinsic values.
The radar-measured reflectivities Z(m)h,v and the co-
variance R(m)hv are weighted by the radar antenna pat-
tern I(r, r0) as follows (see the appendix for details):
Zh,v�m��r0� � �Z h,v
�e� �r�I�r, r0� dr, �13�
Rhv�m��r0� � �Rhv �r�I�r, r0� dr. �14�
In (13) and (14), it is assumed that antenna patterns areidentical at the two orthogonal polarizations. The mea-sured differential phase �(m)
DP and cross-correlation co-efficient �(m)
hv are
�DP�m� � arg�Rhv
�m��
�hv�m� �
Rhv�m�
�Zh�m�Zv
�m��1�2 . �15�
The values of �DP(m) and �hv
(m) depend on the distributionsof Z(e)
h,v and Rhv within the radar resolution volume andon the shape of antenna pattern. In this study, we as-sume that a two-way antenna power pattern is axisym-metric and Gaussian (Doviak and Zrnic 1993):
I��, �� �1
2�2 exp���2 � �2
22 �, �16�
where � and are elevation and azimuth, respectively,and � � �/4(ln2)1/2 (� is a one-way 3-dB antenna pat-tern width).
Next we assume that reflectivity factors Z(e)h,v and Zhv
expressed in logarithmic scale vary linearly in bothcross-beam directions, � and :
10 log�Zh,v�e� ��, ��� � ZH,V
�e� �0, 0� �dZH,V
�e�
d�� �
dZH,V�e�
d��,
�17�
10 log�Zhv��, ��� � ZHV�0, 0� �dZHV
d�� �
dZHV
d��.
�18�
Similar assumption is made for differential phase ��DP:
��DP��, �� � ��DP�0, 0� �d��DP
d�� �
d��DP
d��.
�19�
Note that, throughout the paper, an uppercase sub-script is attributed to radar reflectivity and differentialreflectivity in logarithmic scale, whereas lowercase sub-script signifies the corresponding variables expressed inthe linear scale. Arguments (0, 0) in Eqs. (17)–(19) cor-respond to the center of the antenna beam.
As a result,
Zh,v�m� � Zh,v
�e� �0, 0�Jh,v��� Jh,v
���, �20�
Rhv�m� � Zhv�0, 0�e j��DP�0,0�J ���J ���, �21�
where
Jh,v��� �
1
�2�� exp�0.23
dZH,V�e�
d�� �
�2
22� d�
� exp��0.23�2
22�dZH,V
�e�
d� �2�, �22�
Jh,v��� �
1
�2�� exp�0.23
dZH,V�e�
d�� �
�2
22� d�
� exp��0.23�2
22�dZH,V
�e�
d� �2�, �23�
J��� �1
�2�� exp�j
d��DP
d�� � 0.23
dZHV
d�� �
�2
22� d�
� exp�2
2 �jd��DP
d�� 0.23
dZHV
d� �2�, �24�
J��� �1
�2�� exp�j
d��DP
d�� � 0.23
dZHV
d�� �
�2
22�d�
� exp�2
2 �jd��DP
d�� 0.23
dZHV
d� �2�. �25�
The measured differential reflectivity is expressed as
Zdr�m� � Zdr
�e��0, 0�Jh
���Jh���
Jv���Jv
���� Zdr
�e��0, 0� exp��0.23�2
22��dZH
�e�
d��2
� �dZV�e�
d��2
� �dZH�e�
d��2
� �dZV�e�
d��2��. �26�
MAY 2007 R Y Z H K O V 731
Unauthenticated | Downloaded 12/23/21 11:02 AM UTC

Since
ZH�e� � ZV
�e� � ZDR�e� and 2
dZH�e�
d�k
dZDR�e�
d�, 2
dZH�e�
d�k
dZDR�e�
d�,
�27�
we can further simplify
Zdr�m� � Zdr
�e� exp��0.23�22�dZH�e�
d�
dZDR�e�
d��
dZH�e�
d�
dZDR�e�
d���.
�28�
Or, equivalently,
ZDR�m� � ZDR
�e� � 0.232�dZH�e�
d�
dZDR�e�
d��
dZH�e�
d�
dZDR�e�
d��.
�29�
The measured differential phase can be written as
�DP�m� � arg�Rhv
�m�� � ��DP�0, 0� � �DP, �30�
where
�DP � 0.232�d��DP
d�
dZHV
d��
d��DP
d�
dZHV
d� �.
�31�
Similarly, the magnitude of the measured cross-correlation coefficient is expressed as
|�hv�m�| �
Zhv�0, 0�
�Zh�e��0, 0�Zv
�e��0, 0��1�2
|J���J���|
�Jh���Jv
���Jh���Jv
����1�2
� |�hv�0, 0�|�1�2, �32�
where
�1 � exp� �2
2 ��d��DP
d��2
� �d��DP
d��2��
�33�
�2 � exp��0.23�2
22��dZHV
d��2
� �dZHV
d��2
�12 ��dZH
�e�
d��2
� �dZH�e�
d��2
� �dZV�e�
d��2
� �dZV�e�
d��2���.
�34�
If |�hv| � 1, then
�2 � exp� ��0.23�2
82��dZDR
�e�
d��2
� �dZDR�e�
d��2��.
�35�
The coefficient �2 is usually very close to 1, hence wewill ignore this term in our further considerations.
Expressing the parameter � via the antenna beam-width �, we finally arrive at the following approximate
formulas for the biases of ZDR, �DP, and �hv that will beused in the subsequent analysis in the paper:
ZDR � 0.02�2�dZH�e�
d�
dZDR�e�
d��
dZH�e�
d�
dZDR�e�
d��, �36�
�DP � 0.02�2�d��DP
d�
dZHV�e�
d��
d��DP
d�
dZHV�e�
d��,
�37�
|�hv�m�|
|�hv| � �1 � exp� � 1.37 � 10�5�2��d��DP
d� �2
� �d��DP
d� �2��. �38�
In Eqs. (36)–(38), ��DP, ��DP, �, �, and are expressed indegrees, whereas ZH, ZHV, �ZDR, and ZDR are in decibels.
Similar formulas can be obtained for the NBF-related bias of the radar reflectivity factor at horizontalpolarization:
ZH�dB� � 0.01�2��dZH�e�
d��2
� �dZH�e�
d��2�.
�39�
As expected, the NBF-induced bias of Z is alwayspositive if reflectivity varies linearly in both orthogonaldirections within the radar resolution volume. It fol-lows from Eq. (39) that for a 1° beam the correspond-ing Z bias exceeds 1 dB if the gradient of Z is higherthan 10 dB deg�1 in any of the two transverse di-rections. We will not address �ZH anymore in the pa-per since the focus of this study is on the impact ofbeam broadening on the quality of polarimetric vari-ables.
732 J O U R N A L O F A T M O S P H E R I C A N D O C E A N I C T E C H N O L O G Y VOLUME 24
Unauthenticated | Downloaded 12/23/21 11:02 AM UTC
3. NBF effects in the case of the mesoscaleconvective system
The gradients of ZH, ZHV, ZDR, and �DP in Eqs.(36)–(38) can be approximately estimated from realdata by comparing the corresponding variables at adja-cent radials. We perform such estimation in the case ofa mesoscale convective system (MCS) that was ob-served with the polarimetric prototype of the S-bandWSR-88D radar (hereafter KOUN) in central Oklaho-ma on 2 June 2004. The analysis was conducted usingthe data from two lowest plan position indicators (PPIs)at elevations of 0.44° and 1.45°. Horizontal gradientswere computed from the data collected at the lowestelevation, whereas vertical gradients were estimated us-ing the data at both elevations.
Strictly speaking, such a procedure underestimatesthe magnitude of intrinsic gradients because the dataare smeared with the antenna beam. Indeed, the trans-verse dimension of the radar resolution volume exceeds3 km at 200 km from the radar if the antenna beam-width is 1°. Hence, smaller-scale cross-beam nonunifor-mities of the precipitation field are not resolved. Nev-ertheless, as will be shown later, these approximate es-timates of gradients prove to be very useful forevaluating the quality of polarimetric data.
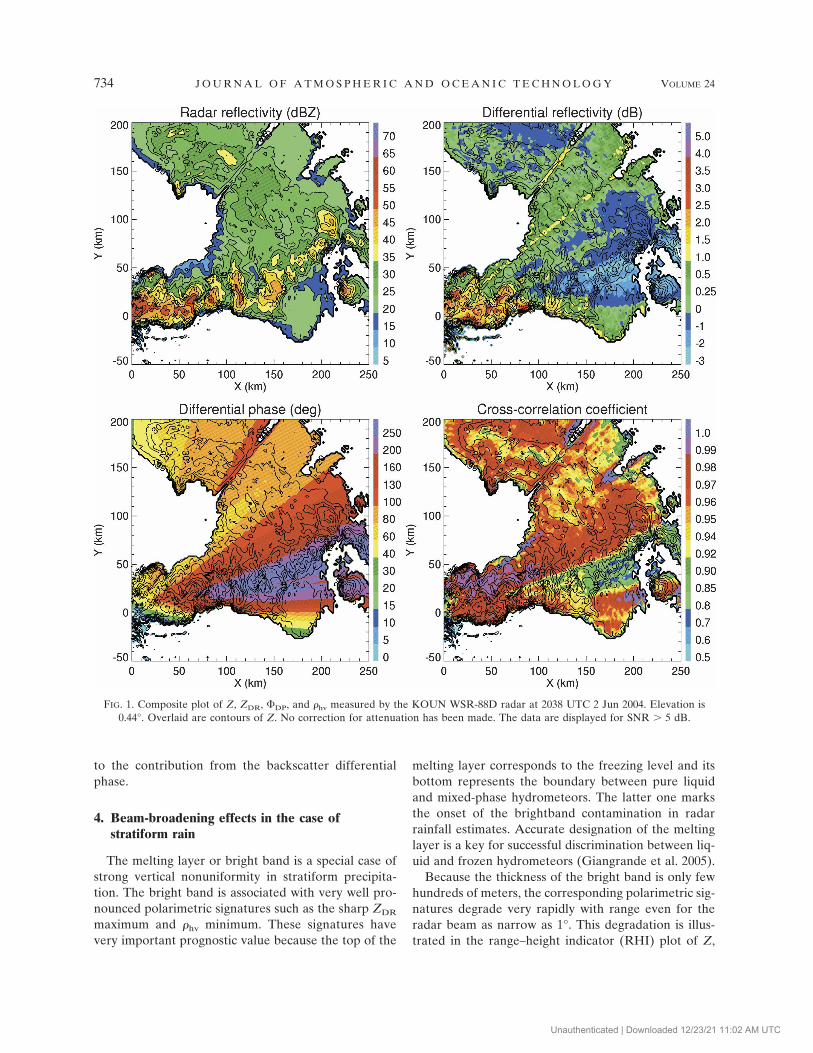
A composite plot of ZH, ZDR, �DP, and �hv at eleva-tion 0.44° (Fig. 1) corresponds to the time when anextensive squall line passes over the radar and producestremendous attenuation and differential attenuationthat are clearly visible in the eastern sector. The radarreflectivity factor and differential reflectivity are delib-erately not corrected for attenuation in order to esti-mate the gradients of Z(e)
H , ZHV, and Z(e)DR, which are
affected by attenuation according to their definition in(7)–(11). High values of �DP in the eastern sector areaccompanied by negatively biased Z and ZDR and apronounced drop in the cross-correlation coefficient�hv. While the drop in ZDR well below �2 dB is causedby differential attenuation, the decrease in �hv is a resultof NBF.
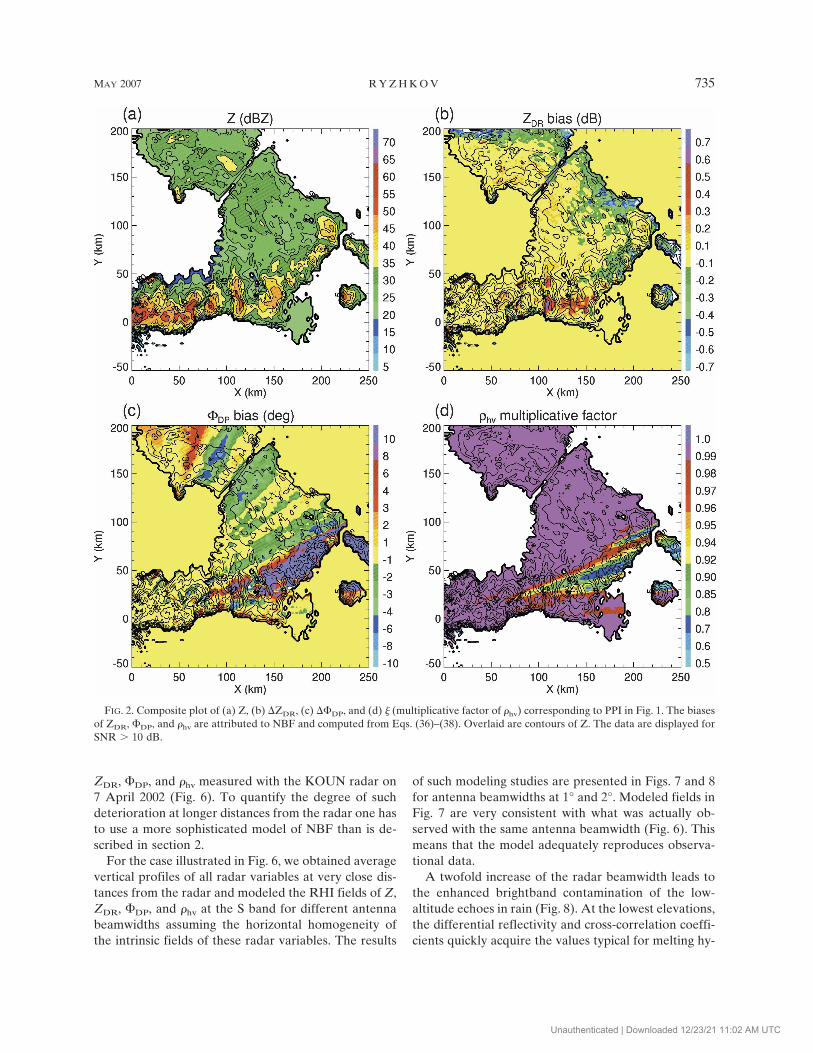
This is confirmed by Fig. 2 where the fields of theparameters �ZDR, ��DP, and � computed from Eqs.(36)–(38) are displayed together with ZH. The �hv de-pression in Fig. 2d is very well correlated with the ob-served decrease of the measured �hv in Fig. 1. The mag-nitude of the negative �hv bias exceeds 0.2. Such astrong bias adversely affects the quality of the polari-metric classification of radar echoes and induces largestatistical errors in the estimates of all polarimetric vari-ables. Similar radial features or “valleys” of lower �hv
are frequently observed in the KOUN polarimetricdata. Their primary cause is large vertical gradient of
�DP. The ray at a higher elevation overshoots precipi-tation at closer distances from the radar than the ray atlower tilt. Therefore, the differential phase at higher tiltstops increasing earlier (i.e., at closer slant ranges) thanthe one at lower tilt. While both higher and lower raysare still in rain, the differential phases at the two raysgrow proportionally and the difference between them isnot high. However, once the higher ray intercepts thefreezing level, the corresponding �DP stops increasing,whereas �DP at the lower ray continues its growth. Thisexplains a radial character of the observed artifacts andtheir severity, which progresses with range.
According to (38), large gradients of �DP are respon-sible for the decrease in �hv. In contrast, perturbationsof �DP are determined by both the gradients of thedifferential phase and the reflectivity factor. As a result,��DP exhibits more complex and nonmonotonic be-havior along the radial than the factor �. If the reflec-tivity field is relatively uniform as in the stratiform re-gion of the MCS north-northeast of the squall line, thenthe gradients of �DP dominate and apparent radial fea-tures are evident in the field of ��DP.
The NBF-related bias in differential reflectivity canalso be significant and may exceed several tenths of adecibel as Fig. 2b shows. Positive biases of ZDR arecommon in convective areas of the storm not far awayfrom the radar, whereas negative biases are prevalentat longer distances in convective and stratiform parts ofthe MCS. The latter feature is explained by the generaldecrease of ZDR with height. The ZDR biases, as well asthe biases in �DP and �hv, tend to increase with range asa result of beam broadening.
A similar analysis was performed on the data col-lected for the same storm but 2 h after the squall linepassed over the radar and was viewed at a differentangle (Figs. 3 and 4). At that moment, attenuation ef-fects were much weaker and the differential phase wassignificantly lower. Again, the area of �hv depression iswell predicted from the analysis of gradients. The per-turbations of the �DP radial profiles are also in goodagreement with their estimates from the gradients inaccordance with Eq. (37).
In Fig. 5, measured range dependencies of �DP (thincurves) are compared with radial profiles of ��DP cal-culated from (37) (thick curves) for six successive azi-muths belonging to the sector indicated in Fig. 4d. De-spite many simplified assumptions made in the evalua-tion of ��DP, the correlation between the �DP and��DP profiles is surprisingly high. The most pro-nounced excursions of the �DP curves, such as spikesand depressions, are well reproduced in the modeled��DP. Thus, they are primarily attributed to NBFrather than pure statistical errors in �DP estimation or
MAY 2007 R Y Z H K O V 733
Unauthenticated | Downloaded 12/23/21 11:02 AM UTC
to the contribution from the backscatter differentialphase.
4. Beam-broadening effects in the case ofstratiform rain
The melting layer or bright band is a special case ofstrong vertical nonuniformity in stratiform precipita-tion. The bright band is associated with very well pro-nounced polarimetric signatures such as the sharp ZDR
maximum and �hv minimum. These signatures havevery important prognostic value because the top of the
melting layer corresponds to the freezing level and itsbottom represents the boundary between pure liquidand mixed-phase hydrometeors. The latter one marksthe onset of the brightband contamination in radarrainfall estimates. Accurate designation of the meltinglayer is a key for successful discrimination between liq-uid and frozen hydrometeors (Giangrande et al. 2005).
Because the thickness of the bright band is only fewhundreds of meters, the corresponding polarimetric sig-natures degrade very rapidly with range even for theradar beam as narrow as 1°. This degradation is illus-trated in the range–height indicator (RHI) plot of Z,
FIG. 1. Composite plot of Z, ZDR, �DP, and �hv measured by the KOUN WSR-88D radar at 2038 UTC 2 Jun 2004. Elevation is0.44°. Overlaid are contours of Z. No correction for attenuation has been made. The data are displayed for SNR � 5 dB.
734 J O U R N A L O F A T M O S P H E R I C A N D O C E A N I C T E C H N O L O G Y VOLUME 24
Fig 1 live 4/C
Unauthenticated | Downloaded 12/23/21 11:02 AM UTC
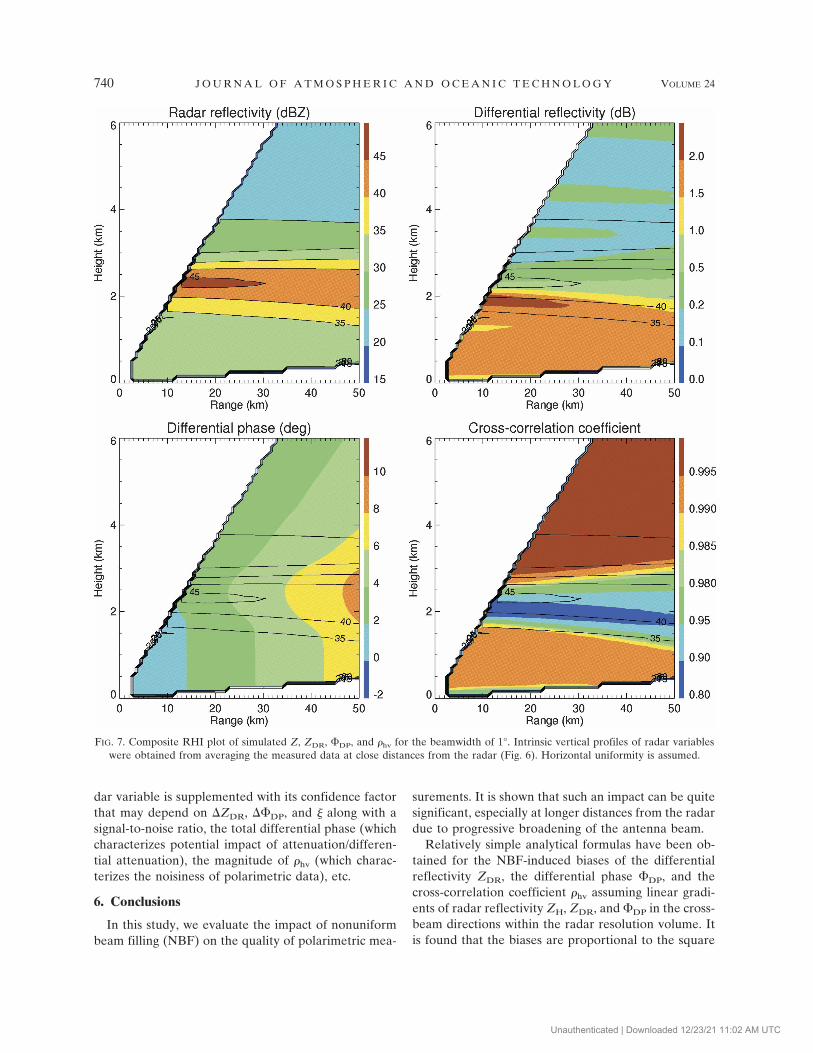
ZDR, �DP, and �hv measured with the KOUN radar on7 April 2002 (Fig. 6). To quantify the degree of suchdeterioration at longer distances from the radar one hasto use a more sophisticated model of NBF than is de-scribed in section 2.
For the case illustrated in Fig. 6, we obtained averagevertical profiles of all radar variables at very close dis-tances from the radar and modeled the RHI fields of Z,ZDR, �DP, and �hv at the S band for different antennabeamwidths assuming the horizontal homogeneity ofthe intrinsic fields of these radar variables. The results
of such modeling studies are presented in Figs. 7 and 8for antenna beamwidths at 1° and 2°. Modeled fields inFig. 7 are very consistent with what was actually ob-served with the same antenna beamwidth (Fig. 6). Thismeans that the model adequately reproduces observa-tional data.
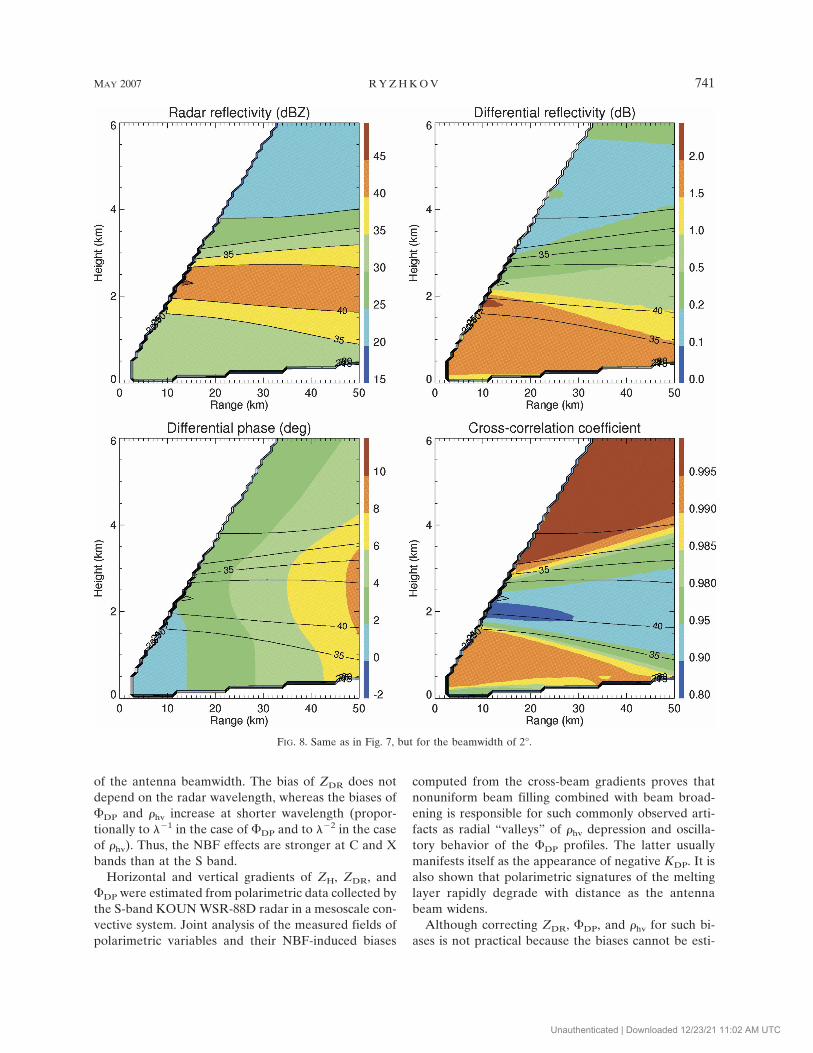
A twofold increase of the radar beamwidth leads tothe enhanced brightband contamination of the low-altitude echoes in rain (Fig. 8). At the lowest elevations,the differential reflectivity and cross-correlation coeffi-cients quickly acquire the values typical for melting hy-
FIG. 2. Composite plot of (a) Z, (b) �ZDR, (c) ��DP, and (d) � (multiplicative factor of �hv) corresponding to PPI in Fig. 1. The biasesof ZDR, �DP, and �hv are attributed to NBF and computed from Eqs. (36)–(38). Overlaid are contours of Z. The data are displayed forSNR � 10 dB.
MAY 2007 R Y Z H K O V 735
Fig 2 live 4/C
Unauthenticated | Downloaded 12/23/21 11:02 AM UTC

drometeors. As in the case of the MCS, vertical non-uniformity causes wavelike perturbation of the �DP
profile in the melting layer as was explained by Ryzh-kov and Zrnic (1998). Below the melting layer, themean value of �DP is less biased but differential phasebecomes more noisy due to lowering of �hv at the alti-tudes below the physical (i.e., intrinsic) bottom of thebright band.
5. Discussion
The findings in this study may have important prac-tical implications to all users of polarimetric radar data.
This is significant in view of the forthcoming polarimet-ric upgrade of the U.S. National Weather Service net-work of the WSR-88D radars. One should avoid usingpolarimetric variables in a quantitative manner in theareas where these variables are significantly affected byNBF. Such areas can be identified by computing hori-zontal and vertical gradients of the radar reflectivity,the differential reflectivity, and the differential phase aswell as estimating the biases of ZDR, �DP, and �hv ac-cording to Eqs. (36)–(38). The procedure for gradientestimation is simple and straightforward.
If the magnitudes of �ZDR, ��DP, and the difference
FIG. 3. Composite plot of Z, ZDR, �DP, and �hv measured by the KOUN WSR-88D radar at 2231 UTC 2 Jun 2004. Elevation is0.44°. Overlaid are contours of Z. No correction for attenuation has been made. The data are displayed for SNR � 5 dB.
736 J O U R N A L O F A T M O S P H E R I C A N D O C E A N I C T E C H N O L O G Y VOLUME 24
Fig 3 live 4/C
Unauthenticated | Downloaded 12/23/21 11:02 AM UTC

1 � � exceed certain thresholds, then the correspondingvariables (ZDR, KDP, and �hv) should not be used forestimating polarimetric products in these areas. Thechoice of such thresholds is dictated by tolerable errorsthat depend on particular applications. For example,the ZDR bias has to be less than 0.2 dB if ZDR is utilizedfor rainfall estimation. The biases of �DP within �2°are acceptable because the statistical fluctuations of the�DP estimate are between 1° and 2° for typical dwelltimes used for operational weather radars. The bias of0.02 in �hv may also be tolerable for classification pur-poses.
In addition to the negative impact on the quality ofpolarimetric classification, the decrease of �hv is detri-mental for statistical accuracy of the estimates of ZDR,�DP, and �hv itself. Indeed, the standard deviations ofthe estimates for all three variables are proportional to(1 � �2
hv)1/2 (Bringi and Chandrasekar 2001). Thismeans that if �hv drops from 0.99 to 0.90, the corre-sponding errors increase 3 times.
Perturbations of the �DP radial profile produce er-roneous estimates of KDP of both signs. Although nega-tive KDPs are easily identified (and sometimes takenout as unphysical), positively biased KDPs usually go
FIG. 4. Composite plot of (a) Z, (b) �ZDR, (c) ��DP, and (d) � (multiplicative factor of �hv) corresponding to PPI in Fig. 3. The biasesof ZDR, �DP, and �hv are attributed to NBF and computed from Eqs. (36)–(38). Overlaid are contours of Z. The data are displayed forSNR � 10 dB.
MAY 2007 R Y Z H K O V 737
Fig 4 live 4/C
Unauthenticated | Downloaded 12/23/21 11:02 AM UTC

undetected. Since KDP is a slope of the �DP radial pro-file, the bias in KDP is not necessarily zero if ��DP � 0.Thus, the data with ��DP � 0 in the vicinity of large|��DP| should be also scrutinized.
The magnitudes of �ZDR, ��DP, and 1 � � dependon the square of antenna beamwidth. Such a strongdependence may preclude the use of wide-beam anten-nas for polarimetric measurements. A twofold increaseof the beamwidth from 1° to 2° leads to 4-times-largerbiases and significant deterioration of the melting layerdesignation as Figs. 7 and 8 show.
The biases of �DP and �hv are wavelength dependentbecause the differential phase and its gradients are in-versely proportional to the radar wavelength �. Theimpact on ��DP is proportional to ��1, whereas the �hv
bias is approximately proportional to ��2. Enhancedattenuation and differential attenuation at shorterwavelengths may either increase or decrease the gradi-ents of Z and ZDR. In some situations, these changes inthe Z and ZDR gradients may offset the increase in thegradient of �DP and its greater impact on the NBF-related biases in �DP and �hv. However, cursory analy-
FIG. 5. Radial profiles of �DP (thin curves) and its bias (��DP, thick curves) caused by NBF at six adjacent azimuths within thesector shown in Fig. 4c. The antenna elevation is 0.44°.
738 J O U R N A L O F A T M O S P H E R I C A N D O C E A N I C T E C H N O L O G Y VOLUME 24
Unauthenticated | Downloaded 12/23/21 11:02 AM UTC

sis of the C- and X-band-simulated and observed pola-rimetric data reveals stronger NBF effects compared tothe S band (Ryzhkov and Zrnic 2005). Although rangecoverage of the shorter-wavelength radars is usuallysmaller than the one for S-band weather radars and theantenna beam is not as broad at closer distances, allmentioned problems should be taken seriously. In con-vective situations, both attenuation and beamwidth ef-fects may restrict the use of polarimetric methods onshort-wavelength radars (particularly with antennabeams wider than 1°).
We emphasize that Eqs. (36)–(38) cannot be used forcorrection of ZDR, �DP, and �hv because the bias esti-mates are very approximate due to many simplifyingassumptions made in derivation of these equations. In-stead, we recommend using �ZDR, ��DP, and � as qual-ity indexes for the corresponding radar variables. Suchan approach is used in the algorithms for hydrometeorclassification and rainfall estimation developed at theNational Severe Storms Laboratory (NSSL) for opera-tional utilization with the polarimetric prototype of theWSR-88D radar. According to this approach, each ra-
FIG. 6. Composite RHI plot of Z, ZDR, �DP, and �hv measured with the KOUN WSR-88D radar on 7 Apr 2002.
MAY 2007 R Y Z H K O V 739
Fig 6 live 4/C
Unauthenticated | Downloaded 12/23/21 11:02 AM UTC
dar variable is supplemented with its confidence factorthat may depend on �ZDR, ��DP, and � along with asignal-to-noise ratio, the total differential phase (whichcharacterizes potential impact of attenuation/differen-tial attenuation), the magnitude of �hv (which charac-terizes the noisiness of polarimetric data), etc.
6. Conclusions
In this study, we evaluate the impact of nonuniformbeam filling (NBF) on the quality of polarimetric mea-
surements. It is shown that such an impact can be quitesignificant, especially at longer distances from the radardue to progressive broadening of the antenna beam.
Relatively simple analytical formulas have been ob-tained for the NBF-induced biases of the differentialreflectivity ZDR, the differential phase �DP, and thecross-correlation coefficient �hv assuming linear gradi-ents of radar reflectivity ZH, ZDR, and �DP in the cross-beam directions within the radar resolution volume. Itis found that the biases are proportional to the square
FIG. 7. Composite RHI plot of simulated Z, ZDR, �DP, and �hv for the beamwidth of 1°. Intrinsic vertical profiles of radar variableswere obtained from averaging the measured data at close distances from the radar (Fig. 6). Horizontal uniformity is assumed.
740 J O U R N A L O F A T M O S P H E R I C A N D O C E A N I C T E C H N O L O G Y VOLUME 24
Fig 7 live 4/C
Unauthenticated | Downloaded 12/23/21 11:02 AM UTC
of the antenna beamwidth. The bias of ZDR does notdepend on the radar wavelength, whereas the biases of�DP and �hv increase at shorter wavelength (propor-tionally to ��1 in the case of �DP and to ��2 in the caseof �hv). Thus, the NBF effects are stronger at C and Xbands than at the S band.
Horizontal and vertical gradients of ZH, ZDR, and�DP were estimated from polarimetric data collected bythe S-band KOUN WSR-88D radar in a mesoscale con-vective system. Joint analysis of the measured fields ofpolarimetric variables and their NBF-induced biases
computed from the cross-beam gradients proves thatnonuniform beam filling combined with beam broad-ening is responsible for such commonly observed arti-facts as radial “valleys” of �hv depression and oscilla-tory behavior of the �DP profiles. The latter usuallymanifests itself as the appearance of negative KDP. It isalso shown that polarimetric signatures of the meltinglayer rapidly degrade with distance as the antennabeam widens.
Although correcting ZDR, �DP, and �hv for such bi-ases is not practical because the biases cannot be esti-
FIG. 8. Same as in Fig. 7, but for the beamwidth of 2°.
MAY 2007 R Y Z H K O V 741
Fig 8 live 4/C
Unauthenticated | Downloaded 12/23/21 11:02 AM UTC

mated with sufficient accuracy, their approximate esti-mates are important as “quality indexes” of the corre-sponding polarimetric variables. One should abstainfrom any quantitative use of the variable if the respec-tive NBF-caused bias exceeds the threshold of accept-ability.
These considerations should be taken into account inusing polarimetric data at different wavelengths andvarious angular resolutions and in developing robustalgorithms for polarimetric hydrometeor classificationand rainfall estimation.
Acknowledgments. Funding for this study was pro-vided by NOAA/Office of Oceanic and AtmosphericResearch under NOAA/University of Oklahoma Co-operative Agreement NA17RJ1227, the U.S. Depart-ment of Commerce, and from the U.S. NationalWeather Service, the Federal Aviation Administration(FAA), and the Air Force Weather Agency throughthe NEXRAD Products Improvement Program. I amgrateful to Dr. D. Zrnic for reading this manuscript andfor making useful comments. The support from theNSSL and the CIMMS, University of Oklahoma staffwho maintain and operate the KOUN WSR-88D pola-rimetric radar is also acknowledged.
APPENDIX
Equations for the Covariance Rhv
The voltage vectors of the transmitted (Vt) and re-ceived (V) waves in the case of individual scatterer arerelated as (Bringi and Chandrasekar 2001)
�Vh
Vv�� C1�Thh 0
0 Tvv��shh shv
shv svv��Thh 0
0 Tvv��Vh
t
Vvt �,
�A1�
where matrix elements shh, svv, and shv represent back-scattering coefficients of the scatterer, and Thh and Tvv
describe phase shifts and attenuations for H and Vwaves along propagation path:
Thh,vv � exp��j�h,v � �h,v�, �A2�
where �h,v is the phase shift, �h,v is the attenuation, and�DP � 2(�h � �v) is a differential phase. The coeffi-cient C1 is defined as
C1 �G f2
4�R2 . �A3�
In (A3), G is the antenna gain, � is the radar wave-length, R is the distance between the radar and scat-terer, and f 2 is the normalized one-way antenna powerpattern. It is assumed that the antenna patterns for or-thogonal polarizations are the same.
In the case of many scatterers filling the radar reso-lution volume, the basic Eq. (A1) can be rewritten as
Vh �Pt
1�2G
4� �i
hie�j2�h
�i�
Vv �Pt
1�2G
4� �i
vie�j2�v
�i�, �A4�
where Pt � |Vt|2 [Vt � (Vt, Vt)] and
hi � shh�i� e�2�h
�i�f i
2�Ri2
vi � svv�i� e�2�v
�i�f i
2�Ri2. �A5�
Index i in (A4) and (A5) stands for a number of scat-terer. In our derivation we neglect the cross-couplingterms proportional to s(i)
hv.The measured covariance R(m)
hv is defined as
Rhv�m� � C2V*hVv, �A6�
where
C2 �210 ln2 2R0
2
�3PtG2c��2|Kw|2
. �A7�
The overbar in (A6) means averaging in time. In (A7),R0 is the distance to the center of the radar resolutionvolume; c is the speed of light; � is the radar pulseduration; � is the one-way 3-dB antenna pattern width,Kw � (�w � 1) / (�w � 2), where �w is the dielectricconstant of water. Substituting (A4) into (A6), we ob-tain
Rhv�m� � C3��
i
h*i viej2��h
�i���v
�i�� � �m�n
h*mvne j2��h�m�
��v�n���� C3��
i
h*i viej2�DP
�i� �, �A8�
C3 � C2
PtG2 2
�4��2 �26 ln2 4R0
2
�5c��2|Kw|2. �A9�
The summation and time averaging in Eq. (A8) can bereplaced by integration over the radar resolution vol-ume:
742 J O U R N A L O F A T M O S P H E R I C A N D O C E A N I C T E C H N O L O G Y VOLUME 24
Unauthenticated | Downloaded 12/23/21 11:02 AM UTC
Rhv�m� � C3�n s*hhsvv
e�2��h � �v�
R4 ej�DPf4��, ��R2 sin� dr d� d�, �A10�
where brackets stand for ensemble averaging and n isthe concentration of scatterers.
According to the definition of the cross-correlationcoefficient �hv,
ns*hhsvv � n�hv|shh|21�2|svv|21�2 �A11�
and
n|shh,vv|2 ��4
4 4 |Kw|2Zh,v �Doviak and Zrnic 1993�.
�A12�
Hence,
Rhv�m� �
16 ln2R02
�c��2 � Zh1�2 Zv
1�2|�hv|e�2��h � �v�e j��DPf4��, ��
R2 sin� dr d� d�, �A13�
where ��DP � �DP � arg(�hv).If variables Zh,v, �h,v, �hv, and �DP are constant
within the radar resolution volume, then the measuredcovariance R(m)
hv is equal to its intrinsic value
Rhv � Zh1�2Zv
1�2|�hv|e��2�h��v�e j��DP, �A14�
because
� f4��, ��
R2 sin� dr d� d� ��c��2
16 ln2R02 �A15�
in the case of the Gaussian axisymmetric antenna pat-tern (Doviak and Zrnic 1993).
If the covariance Rhv varies within the radar resolu-tion volume but its variation along the radial directionis neglected due to much smaller radial dimension ofthe radar volume compared to its transverse dimen-sions at longer ranges from the radar, then the generalexpression (A13) can be simplified as follows:
Rhv�m� � �Rhv ��, ��I��, �� d� d�, �A16�
where
I��, �� �1
2�2 exp���2 � �2
22 � �A17�
and � � �/4(ln2)1/2.
REFERENCES
Brandes, E. A., A. V. Ryzhkov, and D. S. Zrnic, 2001: An evalu-ation of radar rainfall estimates from specific differentialphase. J. Atmos. Oceanic Technol., 18, 363–375.
——, G. Zhang, and J. Vivekanandan, 2002: Experiments in rain-fall estimation with a polarimetric radar in a subtropical en-vironment. J. Appl. Meteor., 41, 674–685.
Bringi, V. N., and V. Chandrasekar, 2001: Polarimetric DopplerWeather Radar: Principles and Applications. Cambridge Uni-versity Press, 636 pp.
Doviak, R. J., and D. S. Zrnic, 1993: Doppler Radar and WeatherObservations. 2d ed. Academic Press, 562 pp.
——, V. Bringi, A. V. Ryzhkov, A. Zahrai, and D. S. Zrnic, 2000:Considerations for polarimetric upgrades to operationalWSR-88D radars. J. Atmos. Oceanic Technol., 17, 257–278.
Giangrande, S. E., and A. V. Ryzhkov, 2003: The quality of rain-fall estimation with the polarimetric WSR-88D radar as afunction of range. Preprints, 31st Int. Conf. on Radar Meteo-rology, Seattle, WA, Amer. Meteor. Soc., 357–360.
——, ——, and J. Krause, 2005: Automatic detection of the melt-ing layer with a polarimetric prototype of the WSR-88D ra-dar. Preprints, 32d Conf. on Radar Meteorology, Albuquer-que, NM, Amer. Meteor. Soc., CD-ROM, 11R.2.
Gosset, M., 2004: Effect of nonuniform beam filling on the propa-gation of radar signals at X-band frequencies. Part II: Exami-nation of differential phase shift. J. Atmos. Oceanic Technol.,21, 358–367.
Herzegh, P. H., and R. E. Carbone, 1984: The influence of an-tenna illumination function characteristics on differential re-flectivity measurements. Preprints, 22d Conf. on Radar Me-teorology, Zurich, Switzerland, Amer. Meteor. Soc., 281–286.
Le Bouar, E., J. Testud, and T. D. Keenan, 2001: Validation of therain profiling algorithm “ZPHI” from the C-band polarimet-ric weather radar in Darwin. J. Atmos. Oceanic Technol., 18,1819–1837.
Loney, M., D. Zrnic, J. Straka, and A. Ryzhkov, 2002: Enhancedpolarimetric radar signatures above the melting level in asupercell storm. J. Appl. Meteor., 41, 1179–1194.
May, P., T. D. Keenan, D. Zrnic, L. Carey, and S. Rutledge, 1999:Polarimetric radar measurements of tropical rain at 5-cmwavelength. J. Appl. Meteor., 38, 750–765.
Meischner, P., Ed., 2004: Weather Radar: Principles and AdvancedApplications. Springer, 337 pp.
Pointin, Y. C., C. Ramond, and J. Fournet-Fayard, 1988: Radardifferential reflectivity: A real-case evaluation of errors in-duced by antenna characteristics. J. Atmos. Oceanic Technol.,5, 416–423.
MAY 2007 R Y Z H K O V 743
Unauthenticated | Downloaded 12/23/21 11:02 AM UTC

Ryzhkov, A. V., 2005: On the use of differential phase for polar-imetric rainfall measurements. A new approach to KDP esti-mation. Preprints, 32d Conf. on Radar Meteorology, Albu-querque, NM, Amer. Meteor. Soc., CD-ROM, P9R.8.
——, and D. Zrnic, 1998: Beamwidth effects on the differentialphase measurements of rain. J. Atmos. Oceanic Technol., 15,624–634.
——, and D. S. Zrnic, 2005: Radar polarimetry at S, C, and Xbands: Comparative analysis and operational implications.
Preprints, 32d Conf. on Radar Meteorology, Albuquerque,NM, Amer. Meteor. Soc., CD-ROM, 9R.3.
——, T. J. Schuur, D. W. Burgess, S. Giangrande, and D. S. Zrnic,2005a: The Joint Polarization Experiment: Polarimetric rain-fall measurements and hydrometeor classification. Bull.Amer. Meteor. Soc., 86, 809–824.
——, S. E. Giangrande, and T. J. Schuur, 2005b: Rainfall estima-tion with a polarimetric prototype of the WSR-88D radar. J.Appl. Meteor., 44, 502–515.
744 J O U R N A L O F A T M O S P H E R I C A N D O C E A N I C T E C H N O L O G Y VOLUME 24
Unauthenticated | Downloaded 12/23/21 11:02 AM UTC