the impact of campus facilities on the recruitment of
TRANSCRIPT

Western Kentucky UniversityTopSCHOLAR®
Dissertations Graduate School
Summer 2019
The Impact of Campus Facilities on theRecruitment of Students in Higher EducationLucinnda Sue McDonaldWestern Kentucky University, [email protected]
Follow this and additional works at: https://digitalcommons.wku.edu/diss
Part of the Business Administration, Management, and Operations Commons, EducationalLeadership Commons, Higher Education Commons, and the Higher Education AdministrationCommons
This Dissertation is brought to you for free and open access by TopSCHOLAR®. It has been accepted for inclusion in Dissertations by an authorizedadministrator of TopSCHOLAR®. For more information, please contact [email protected].
Recommended CitationMcDonald, Lucinnda Sue, "The Impact of Campus Facilities on the Recruitment of Students in Higher Education" (2019).Dissertations. Paper 170.https://digitalcommons.wku.edu/diss/170
THE IMPACT OF CAMPUS FACILITIES ON THE RECRUITMENT OF
STUDENTS IN HIGHER EDUCATION
A Dissertation
Presented to
The Faculty of the Educational Leadership Doctoral Program
Western Kentucky University
Bowling Green, Kentucky
In Partial Fulfillment
Of the Requirements for the Degree
Doctor of Education
By
Lucinda S. McDonald
August 2019
THE IMPACT OF CAMPUS FACILITIES ON THE RECRUITMENT OF
STUDENTS IN HIGHER EDUCATION

iii
ACKNOWLEDGMENTS
I would like to take this opportunity to thank all of the people at the various
institutions throughout Kentucky who helped me complete this project. A research
project such as this has several steps and, in this case, it meant contacting many people in
many different divisions of the universities. I appreciate all of those who took their time
to help me test my research process and get it under way. I had help and input from
many within the listed universities and want to say, “thank you, you helped me more than
you know.”
• Western Kentucky University
• University of Kentucky
• Morehead State University
• Georgetown College
• Eastern Kentucky University
• Centre College
• Northern Kentucky University
• Murray State University
• Midway University
• Bluegrass Community and Technical College

iv
TABLE OF CONTENTS
List of Figures .................................................................................................................. vii
List of Tables .................................................................................................................... ix
Abstract ................................................................................................................................x
CHAPTER I: INTRODUCTION AND OVERVIEW
Introduction ..............................................................................................................1
Generational Cohorts ...............................................................................................3
Considerations for Millennials .................................................................................7
Considerations for Generation Z ..............................................................................9
Generational Considerations for Higher Education ...............................................12
Statement of the Problem .......................................................................................16
Purpose of the Study ..............................................................................................17
CHAPTER II: REVIEW OF THE LITERATURE
Introduction ............................................................................................................18
College Recruitment Considerations .....................................................................18
Recruitment Strategies ...........................................................................................25
The Role of Physical Facilities in Recruitment .....................................................29
Specific Physical Facilities Considerations ...........................................................34
Classroom Design ..................................................................................................36
Library Facilities ....................................................................................................45
Residential Facilities ..............................................................................................47
Student Common Areas .........................................................................................51
Universal Design Facilities ....................................................................................51

v
Ambient Attributes of Facilities.............................................................................52
Planning Facilities for Recruitment .......................................................................54
The Economics of Planning ...................................................................................56
The Planning Process .............................................................................................58
Summary of the Literature .....................................................................................64
CHAPTER 3: METHODOLOGY
Introduction ............................................................................................................70
Research Questions ................................................................................................70
Study Design ..........................................................................................................71
Limitations and Delimitations ................................................................................73
Validity and Reliability ..........................................................................................74
CHAPTER 4: FINDINGS AND RESULTS
Introduction ............................................................................................................80
Data Analysis .........................................................................................................80
Results ....................................................................................................................80
RQ1: What are the top considerations students view as being most
influential in the college selection process? ..............................................81
RQ2: What campus facilities do students identify as being most important
in the college selection process? ...............................................................84
RQ3: What classroom features (i.e., windows, seating, colors) are most
important to students in the college selection process? ............................86
Windows .......................................................................................86
Color .............................................................................................88

vi
Furniture ........................................................................................90
RQ4: What common learning resources (i.e., computer availability,
internet availability, hard copy reference materials) are important to
students in the college selection process? .................................................93
RQ5: What technology features do students deem most important in the
college selection process? .........................................................................94
RQ6: What facilities’ element is the primary reason students reject a
college in the selection process? ...............................................................95
CHAPTER 5: DISCUSSION, CONCLUSIONS, AND RECOMMENDATION
Introduction ............................................................................................................97
Significant Facilities ..............................................................................................97
Enhancing Recruitment Through Facilities Offered .............................................99
Facilities Operations and Management .................................................................99
Administration and Cooperation .........................................................................104
REFERENCES ...............................................................................................................107
APPENDICES
Appendix A: Qualtrics Survey Questionnaire ...................................................127
Appendix B: Participation Request E-Mail .......................................................132
Appendix C: Data and Analysis of Survey Responses ......................................134
Appendix D: Important Facilities Factor Analysis ............................................147

vii
LIST OF FIGURES
1. Top five most influential factors for college selection ..................................................83
2. Survey illustration for preference related to classroom windows .................................87
3. Student preference related to the presence of windows in the classroom .....................87
4. Survey illustration for preference related to classroom wall color ................................89
5. Student preference related to classroom wall colors ......................................................89
6. Survey illustration for preference related to classroom seating styles ...........................92
7. Student preference related to classroom furniture ........................................................92
8. Student Preference related to learning resources ..........................................................94
9. Top five most important technology factors ..................................................................95
C1. Top 10 most influential factors for college selection based on birth year ...............135
C2. Top 10 most influential factors for college selection based on college type ...........136
C3. Summary of rating of facilities..................................................................................137
C4. Preference for windows in the classroom by birth year and college ........................138
C5. Preference for wall color in the classroom by the birth year ...................................139
C6. Preference for wall color in the classroom by college type .....................................140
C7. Preference for furniture in the classroom by birth year ...........................................141
C8. Preference for furniture in the classroom by college type .......................................142
C9. Preference for learning resources by birth year .......................................................143
C10. Preference for learning resources by college type .................................................144
C11. Preference for technology by birth year .................................................................145
C12. Preference for technology by college type .............................................................146
D1. Scree plot of factors affecting college selection ......................................................135

viii
D2. Structural equation model ........................................................................................136
D3. Structural equation model with analysis results ........................................................137
D4. Stata factor analysis results ......................................................................................138

ix
LIST OF TABLES
1. General Characteristics of the Generations .....................................................................2
2. Comparison of Generations Currently Enrolling ...........................................................66
3. Distribution of Responses to Survey..............................................................................73
4. Content Validity Index Results – Group 1 (4 experts) ..................................................75
5. Content Validity Index Results – Group 2 (6 experts) ..................................................76
6. Test-Retest Results.........................................................................................................78
7. Rank Order of Student Ratings of Facilities’ Importance .............................................85
8. Comparison of Causes of Rejection of an Institution ....................................................96
D1. Summary of Survey Statistics ..................................................................................149
D2. Factor Loadings.........................................................................................................151
D3. Rotated Factor Loadings (< 0.3 results eliminated) ..................................................152
D4. Summary of Factor Analysis.....................................................................................153
D5. Goodness of Fit Results ............................................................................................156

x
THE IMPACT OF CAMPUS FACILITIES ON THE RECRUITMENT OF
STUDENTS IN HIGHER EDUCATION
Lucinda S. McDonald August 2019 157 Pages
Directed by: Randy Capps, Joseph Cangemi, and Jace Lux
Educational Leadership Doctoral Program Western Kentucky University
The statement often has been made over the years that university recruitment
efforts are strongly impacted by campus facilities. The subject has been a topic of
research over the past several decades. This study indicates that as generations change
and times change, the significance of various aspects of the university to the prospective
student change as well.
This research effort is a mixed-methods study to provide insight on the facilities
current students deem most important when determining which college or university they
will attend. The research for this study was conducted through an online survey asking
students to:
• Choose which factors were most important in selecting a college.
• Select preferences related to various design elements (classroom color,
furniture, and windows).
• Provide preferences on technology and how it is used.
• Rank the importance of specific facilities.
Students from six universities and colleges in Kentucky responded to the survey and
provided data for evaluation.
The study found little significant change had occurred from research completed
by Reynolds and Valcik in 2007 on what students see as the most important factors for
selecting a college. The five most important factors were a strong major in the field of

xi
interest; location of institution—nearness to home; pleasant and attractive
campus/surroundings; location of institution—city, state, etc.; and preparation for a
career. The facilities most important to students included facilities for their major,
classrooms, libraries, residence halls, and dining facilities. Availability of technology
also was of prime importance.
Based on the findings of this research, recommendations are made on developing
campus-wide programs for improving communications and cooperation between
divisions. The study further recommends taking the information gathered from the
collaborative brainstorming sessions and student surveys to develop a continuous
improvement program and facility improvement plan in an effort to provide a fiscally-
responsible institution with a primary focus of providing affordable, high-quality
education to its students in appealing facilities.
1
CHAPTER I: INTRODUCTION AND OVERVIEW
Introduction
During the late 1970s, forecasters projected sharp declines in college enrollment
to occur by the turn of the next century (Chapman, 1981). With this forecast, sociologists
and higher education researchers began studying how to attract more students. Up to that
time most research had focused on how students made the decision on whether to attend
college, rather than on which one they should attend (Chapman, 1981). It was during this
time that higher education administrators began to understand they were dealing with a
new and different generation. It was no longer Baby Boomers (1946-1964) who were
starting college; it was Generation X (1965-1984), with a whole new set of ideas and
points of view. This was a time of transition from young adults who were idealistic,
team-oriented, and work-focused to those who were pragmatic, independent, and focused
on life-balance (Bump, 2014). Similarly, in this current era higher education is facing
changes as the generations known as Millennials and Generation Z are now college
students.
The current college students, Millennials typically delineated as those born
between 1985 and 2000, are characterized as an optimistic, independent, and
individualistic generation who place great emphasis on family and friends. They tend to
adapt easily to teams, as they have grown up with social media and its networking
features (Bump, 2014). Table 1 presents a comparison of the common characteristics
attributed to the various generations which colleges have experienced.

2
Table 1
General Characteristics of the Generations
Parameter
Silent
Generation Baby Boomers Generation X Millennials
Birth Years 1930 - 1946 1946 - 1964 1965 - 1984 1985 - 2000
Current Age 73 - 89 55 - 73 35 - 54 19 - 34
% of 2014
Population 11% 32% 28% 29%
Influences
Post-world war
Korean War
Parents are survivors of Great Depression
Economic prosperity
Low employment competition
Chance for advancement
Vietnam
Civil rights
Cold War
Watergate
Space race
Divorce
Sexual revolution
Woodstock
HIV/AIDS
MTV
Energy crisis
Global competition
Collapse of communism
Divorce
Dual income families
Latchkey kids
Job instability
Digital Media/ Internet
School shootings
Terrorism
Children of divorce
Sheltered as children
Economic expansion
Kept busy as kids
Children with schedules
Characteristics
Practical
Loyal/ Dedicated
Diligent
Compliant
Confident
Patriotic
Respectful
Strong work ethic
Independent
Challenge authority
Entitled
Team-oriented
Optimistic
Ambitious
Diligent
Live to work
Competitive
Insecure
Diverse
Cynicism
Work to live
Adaptable
Desire independence
Confident
Pragmatic
Self-starters
Narcissistic
Depressed
Anxious/ Sensitive/Limited self-control
Reject social norms
Less obligation to employer
Focus on money and power
Entitled
(continued)

3
Table 1. Generational Characteristics (continued)
Parameter
Silent
Generation Baby Boomers Generation X Millennials Characteristics (cont.)
Thrifty Materialistic
Good communicators
Idealistic
Loyal
Strong work ethic
Entitled
Skeptical of authority
At ease in teams
Attached to gadgets and parents
Family friendly
Structured lives
Global thinking
Innovative
Sociable
Optimistic
Parent advocacy
Techno-savvy
Patriotic Note. The information presented on generational birth range and characteristics is adapted from “Here is
when each generation begins and ends, according to facts,” by P. Bump, 2014, The Atlantic. And from
“Defining generations: Where Millennials end and post-Millennials begin,” by Pew Research Center, 2018.
Percentage of population statistics is adapted from “Comparing Millennials to other generations: Pew
Research Center Social & Demographic Trends,” by Pew Research Center, 2015. Additional information
regarding influences and characteristics was adapted from “Generational Differences Chart” by Workflow
Management Coalition, 2017.
Throughout their existence, colleges and universities have made efforts at each of
these junctures to change and adapt to attract the current generation of students. The
challenge for administrators, now as it was then, is to discern how campus facilities can
best meet the needs and expectations of each new generation.
Generational Cohorts
Generational cohort theory explains changes in values, attitudes, beliefs, and
inclinations across generations due to important historical events and social changes
(Moss, 2016). The events could be things like wars, the presence of heroic figures, or

4
experiences that impact a large portion of the population. They are particularly impactful
during an individual’s formative years, cause specific inclinations or styles, and persist
over time (Moss, 2016).
Students today develop as they have throughout time, maturing into adulthood
based on childhood experiences as they form relationships, develop skills, and determine
their path for the future. But today’s students also have experienced a world with a vast
potential for life experiences, technological sophistication, and pluralistic social models,
all of which have affected their attitudes, behaviors, and aspirations. The college students
of today are at the forefront of technological proficiency, generally well beyond their
parents, teachers, and potential bosses (Newton, 2000).
Being part of a particular generational cohort does not mean the generalizations
made are completely applicable to all who fall within the particular timeframe, nor does it
result in a specific type of college student. Newton (2000) noted that current students
“enter college having had greater exposure to, and more experimentation with, ‘grown-
up’ activity than any previous generation” (p. 9). This was the case for Millennials, as
they seemed to mature physically at a younger age and were spreading their wings
(experimenting and acting out) at an earlier age (i.e., middle school and high school)
(Newton, 2000). However, Generation Z is now entering college with a slightly different
perspective. They spent more time at home with their families, did not work during
school as much, and were watched more closely by their Generation X parents (Twenge,
2017).

5
Newton (2000) stated that current students have:
Received extensive and rapid exposure to a vast and ever-increasing level of
informational activity, which makes them the most informed generation to have
lived on the planet. However, even though students have more general
knowledge, they come to our campuses with less experience in exercising the
discipline and focus required to explore a subject in depth. (Newton, 2000, p. 9)
While the internet has made researching much easier, it is not infallible and students must
develop their ability to recognize sound academic information. “Educators are now
spending time teaching students how to determine what is credible for academia as
research shifts from peer-reviewed journals and books in a library to blogs and op-eds”
(Seemiller & Grace, 2016, p. 174).
While college students through the ages have “lived by the seat of their pants,” as
Newton (2000, p. 10) put it, this generation has more difficulty because of less hands-on
mentoring and training to learn proper behaviors and actions. Of course, as Seemiller and
Grace (2016) stated, “each generation has its own set of social norms and trends” (p. 57),
which may result in a rewriting of social etiquette rules as we know them. But this
difference between the cohorts has particularly become an issue as they look to advance
their lives and careers as “Social connection and intimacy are taking on different
patterns” (Newton, 2000, p. 10).
Twenge (2017) described Generation Zers as “spending more leisure time alone”
(p. 74) and on their devices, which has been linked to less happiness and increased
depression. He also noted that adult mental health tends to improve with in-person
interaction as he observed that college students’ mental health was deteriorating and

6
Millennials were reported to be happier than Generation Zers. The solitude and reduced
interpersonal interaction seen with the assimilation of social media have resulted in
students who are increasingly experiencing high levels of stress and anxiety (Newton,
2000).
Today’s generation of college students is caught in a complex and rapidly
changing society which has caused alienation and loss of purpose; life often has become
empty of meaning offering no standard ethos. This instability has created a need for
resolution and coherence in their lives (Newton, 2000). These objectives are reached
through establishing a worldview, developing a sense of manageability, and building a
sense of meaningfulness.
Moss (2016) also noted anxiety, depression, and narcissism have increased over
time. There also has been a trend from an internal locus of control to an external locus of
control, meaning the younger generations are more likely to place blame on others rather
than accept it themselves (Moss, 2016). They also are “especially sensitive to the support
of managers” (2016, p. 5). Moss noted two studies using the Minnesota Multiphasic
Personality Inventory (MMPI) (the most widely used and researched standardized
psychometric test of adult personality and psychopathology) found increases in
depression, hypomania paranoia psychopathic deviation, and other psychopathological
manifestations. Specifically, according to Moss the study found younger generations
exhibit inflated perceptions of themselves, limited self-control, rejection of societal
norms, instability, dissatisfaction, feelings of isolation and being misunderstood, and
undue sensitivity. Moss also reported loyalty and commitment to organizations have
waned over the generations. Where Baby Boomers tended to form emotional

7
attachments to their workplaces, younger generations see the work environment only as
the means to reach their professional and social goals. As a result, loyalty has diminished
and turnover has increased, while trust has become even less important (Moss, 2016).
The commitment and loyalty levels are considered in direct contrast to a more recent
study of Generation Z, specifically, by Seemiller and Grace (2016) that reported
significant differences from Millennials. They reported Generation Zers, having
experienced 9/11, a failing economy, unemployment, and a world at war, and are more
loyal and compassionate, less concerned about appearances, and risk averse. They tend
to have a strong work ethic similar to the Baby Boomers and have a sense of
responsibility and resiliency like Generation X (Seemiller & Grace, 2016). Plus, they are
even more technologically savvy than the Millennials.
Considerations for Millennials
In the book, Millennials Go to College, Muntz (2004) observed that (a) each new
generation breaks away from the current young-adult generation, (b) the new generation
corrects what it perceives as the excesses of the current midlife generation, and (c) the
new generation fills the roles of the vacating older generation. He noted Millennials are a
third larger than the Baby Boomer generation, with over 100 million members, and 70%
plan to attend college.
In an article by Giambatista, Hoover, and Tribble (2017), consideration was given
to the challenges associated with managing Millennials, particularly narcissistic
Millennials, since that is one of the characteristics often correlated with the group. The
authors suggested a predisposition of Millennials to what they described as complexity
avoidance and how intervention theory, in conjunction with classic principles of

8
managing organizational behavior, is applicable. Giambatista et al. (2007) noted
Millennials are viewed by society as relatively disloyal, job-hoppers, high maintenance,
entitled, and casual/informal. Millennials grew up with the internet and other
technological advances that produced instant gratification, so as a result they learned to
expect quick fixes and easy access to solutions. The result has been impatience and
discomfort with matters that require patience, reflection, or perseverance. According to
Giambatista et al., Millennials are more prone to narcissism than earlier generations.
They have an insatiable desire for positive feedback and approval from others; at the
same time, they are resistant to constructive criticism. Considering Millennials have been
characterized as inclined to being narcissistic and avoiding complexity, they tend to
minimize or distort information to serve their own purposes. They are very resistant to
organizational or individual change and lack the ability to see others’ perspectives or to
be empathetic. Collaborative work tends to be difficult for the Millennial when a
collective endeavor is undertaken. Feedback from group work may not provide the
confirmation needed and can result in aggressive and/or antisocial behavior. Giambatisa
et al. suggested rather than learning from their mistakes, they blame others for their
failure.
Of course, just because a person was born within the generational range does not
mean they must meet all the characteristics attributed to their cohort. Managers and
educators must be observant, watching for clues like high self-esteem, narcissism,
anxiety, depression, lower need for social approval, external locus of control, and more
agentic traits (Giambatista et al., 2017). Giambatista et al. (2017) also recommended
being aware of signs of complexity avoidance and patterns of superficiality in work.
9
Without these traits, management as a Millennial is not necessary, but the manager or
educator must still be aware of potential narcissistic traits (Giambatista et al., 2017).
Narcissism impacts the educator in determining how to provide the best education
for the Millennial, according to Giambatista et al. (2017). Millennials rely on quick,
simple solutions, as they have become dependent on technology and an external locus of
control. Educators should consider a less is more approach that focuses on learning,
change, and development rather than presenting large amounts of information for
memorization. Efforts should be directed toward building behavioral skills through
actions like role play; direct and vicarious observation; immediate peer and instructor
feedback; repetition; opportunities for personal reflection; and behavioral integration
laced with generous portions of positive feedback, communication, and encouragement.
Giambatista et al. said for the narcissistic Millennial, leadership takes additional effort to
stroke their ego in all communications, flattering their need for achievement and power.
In addition, leaders should remember the narcissistic Millennial’s lack of teamwork
ability and tendency toward social influence tactics could ripple over into other
Millennials in a group and undermine the teamwork. The recommendation is that
narcissistic Millennials not be assigned to teams or, if they must be, to group them with
others of similar traits.
Considerations for Generation Z
The ongoing question for researchers is determining where Millennials end and
Generation Z begins. Since these generational cohorts are not specifically defined or
delineated (as by the U.S. Census Bureau), the beginning birth year for Generation Z is
rather arbitrary (Bump, 2015). For the purpose of this study, the line of delineation was

10
drawn at the year 2000, meaning that Generation Z students are now entering colleges
and universities.
As Seemiller and Grace (2016) stated, “Context shapes the way people see the
world” (p. 25). The context for Generation Z is one of world wars, terrorism, violence,
and insecurity. As a result, Generation Zers have been over-protected by their parents’
zeal to always keep them safe (Twenge, 2017). They tend to be risk averse: partying less,
driving less, drinking less, and focusing more on financial security and careers (Seemiller
& Grace, 2016). This pragmatic generation does not want to let others down; they want
to be advocates for others who are less fortunate and to make a difference in the world.
In contrast to previous generations, Generation Zers tend to be more concerned with the
well-being of the whole rather than the one (Seemiller & Grace, 2017).
A quote in the report by Robyn Showers (2016) says:
Generation Z is the first truly global generation with limitless interests and
avenues for learning. They have been raised in a high-tech, hyper-connected, on-
demand, and impatient culture.… This self-directed, entrepreneurial-minded,
highly educated, and uber resourceful generation will stop at nothing to make
their mark on the world. (p. 3)
Generation Zers are accustomed to having all the information they need literally at their
fingertips, at the click of a button. The downside is that they have had an almost
continuous exposure to the violence and perils present in the world. These dangers have
made them very cognitive of online threats as well, like identity theft, cyberbullying, and
phishing, resulting in an appreciation of privacy, particularly related to technology
(Seemiller & Grace, 2017).

11
Generation Zers are responsible, loyal, compassionate, and career-minded.
Personally, they are looking for opportunities for advancement and rewards that will
improve their financial standing (Seemiller & Grace, 2016). They have been described as
a loyal group and, as such, are expected to change jobs less often than Millennials.
Seemiller and Grace (2016) also observed even though Generation Zers prefer face-to-
face communication, they tend to lack strong interpersonal skills because most of their
communication experience has been through technology. Twenge (2017) reported
Generation Zers tend to spend less time in group activities “building social skills,
negotiating relationships, and navigating emotions” (p. 72).
Generation Z students, like the generations before them, want to learn and acquire
the skills needed to advance their careers (Seemiller & Grace, 2017). They prefer
learning that is more “hands-on” and directly applicable to real life. They see education
as the key to success, as stated in five themes presented by Seemiller and Grace (2016):
• Education leads to future personal success.
• Education is an investment in America’s future.
• An educated society is a better society.
• America’s education system is declining.
• There is limited access to quality education.
For Generation Zers, the number one social concern is the cost of higher
education due to the negative impact it will have on their financial status in their adult
lives (Seemiller & Grace, 2016). They are looking for ways to avoid the excessive costs
associated with college and leaning toward a “limited college experience,” choosing only
those college offerings that are absolutely necessary to graduate (“college a la carte”)
12
(Seemiller & Grace, 2016, p. 100). According to Seemiller and Grace (2016), three
quarters of Generation Zers believe a degree is “essential to having a career” (p. 100).
They see jobs as necessary for survival, but hard to find. They feel everyone should have
the ability to be employed, but see going to college only as a means to meet their goals
(Seemiller & Grace, 2016). Interestingly, as Generation Z has seen layoffs and
unemployment during their young lives, they see entrepreneurship as their means to
financial success. The prediction is that self-employment will “grow at a rate of 6
percent for the next five years” (Seemiller & Grace, 2016, p. 103). With the desire for
self-employment comes the desire for related education. Colleges and universities have
the opportunity to provide education that encourages and supports the future
entrepreneurs (i.e., internships, business operations, and leadership).
Generational Considerations for Higher Education
Newton noted in 2000 the need for faculty and staff to recognize the traits and
needs of the new generation in order to offer suitable learning experiences that provide
deliberate classroom and out-of-class opportunities for student personal awareness and
exploration to take place. He suggested seminar groups, class discussion periods, and
Socratic teaching methods are time-honored class processes that are still appropriate.
As Oblinger (2003) pointed out, higher education administrators, faculty, and
staff generally are part of a much different generation from the student population and,
therefore, have quite different ideas/beliefs from current students. The traditional
students now entering colleges are part of the Millennial generation, or Generation Z.
But student bodies often are dominated by nontraditional students who can have
considerably different needs and desires (Oblinger, 2003).

13
Today’s students grew up with technology; they often find the use of technology
in schools to be disappointing and uninspiring (Oblinger, 2003). According to Oblinger,
“…there are many indications students actively compare programs, evaluate institutions
based on the characteristics they consider to be important, and make choices” (2003, p.
42). And conversely, the better the student does, the better the institution looks to future
students. Several recommendations are made for meeting the needs of today’s students:
• Eliminate delays by improving communication and response times for all
student services.
• Improve customer service by providing multiple avenues for information and
support, in a timely manner. Oblinger (2003) said, “For today’s learners,
customer service is an expectation, not an exception. Yet it is rare that
students and institutions have the same expectations for service” (p. 42).
• Provide experiential, interactive, and authentic learning through interactive
learning experiences that can be accessed anywhere, any time (Oblinger,
2003).
In a later study, Oblinger and Oblinger (2005) provided additional information for
consideration. They indicated older students are much more likely to be satisfied with
online classes than Millennials who want to be connected with people and to be social.
They reported younger students tend to put technology in perspective as they reported:
• Teachers are vital to the leaning process. Technology is good, but it is not a
perfect substitute.
• Computers can never replace humans.

14
• Learning is based on motivation, and without teachers, that motivation does
not exist.
• A major part of school is building social skills. Communicating strictly
through technology, and not in person, the way life is viewed changes
dramatically. (Oblinger & Oblinger, 2005, p. 2.3).
Given the differences between the cohorts, educators can expect to see variances
in how they learn. According to Seemiller and Grace (2016), Generation Z students most
frequently use logic-based approaches and experiential learning. Logic-based approaches
focus on how information is organized, while experiential learning provides hands-on
practice. Generation Zers expect learning to be more beneficial, particularly for getting a
job after graduation (Seemiller & Grace, 2016). Generation Z students prefer
intrapersonal learning; they would rather work alone at their own pace with collaboration
as an option as needed. Their preferred method of learning is to gather foundational
information individually, with face-to-face classes being more collaborative, hands-on,
and participatory, and teachers acting as facilitators (i.e., the flipped classroom or hybrid
classes) (Seemiller & Grace, 2016).
Seemiller and Grace (2017) provided recommendations for effectively engaging
with Generation Z students that may extend beyond the classroom setting:
• Utilize video-based learning,
• Incorporate intrapersonal learning,
• Offer community engagement opportunities, and
• Connect students to internship opportunities.

15
As Seemiller and Grace (2017) stated, “Higher education can either adopt philosophies
and practices that educate, mobilize, empower, and prepare Generation Z to solve our
world’s problems or miss the opportunity to influence significantly the great minds of our
next great generation” (p. 25).
Higher education institutions also have seen a recurring theme with the newer
generation, the desire for the college to be more like home. Twenge (2017) reported:
This focus on college as a “home,” some have noted, might be part of
iGen’s slow developmental track. As Yale faculty Douglas Stone and
May Schwab-Stone wrote in the New York Times, “Instead of promoting
the idea of college as a transition from the shelter of the family to adult
autonomy and responsibility, universities like Yale have given in to the
implicit notion that they should provide the equivalent of the “home
environment.” In other words, all of this focus on protection, safety,
comfort, and home is the downside of teens growing up more slowly; they
are unprepared to be independent and thus want college to be home. They
love the idea of adult freedom that college offers (no curfew!) but still
want to feel “safe” at all times. (p. 159)
Generation Z wants college administration, faculty, and staff to take on the role of the
authoritarian parent (Twenge, 2017).

16
Statement of the Problem
Ike, Baldwin, and Lathouras (2016) noted higher education has changed
dramatically as globalization has expanded, the needs of the business community have
come to the forefront, and access is no longer reserved strictly for the elite. But
universities are still in business to teach and research, so they must find ways to attract
and retain students through methods that speak to the current generations (Ike et al.,
2016). An online report by Jon Marcus in 2017 noted there are “2.4 million fewer
college students in the United States than there were just six years ago” (p. 4). The report
went on to explain that the birth rate has dropped, meaning fewer high school graduates
and nontraditional students, those over 24 years old, have returned to work as the
economy has improved. Marcus also noted an upswing in enrollment is not expected
until around 2023.
In light of current declining enrollment trends, colleges and universities are
challenged with evaluating existing recruiting methods and looking at all aspects of
operations for ways to improve. Vladeck noted as far back as 1979 that smaller
institutions were folding. He warned then that “excess physical capacity must lead, over
time, to a shake-out, to the failure of the least efficient firms and the absorption of some
others by the most successful competitors” (p. 40).
Administrators must make difficult decisions related to program offerings, student
relations, and facilities management given the ever-tightening budgets associated with
decreased enrollments. Decisions must be made through exhaustive evaluation based on
costs, efficiency, and effectiveness. One part of this evaluation involves an in-depth
analysis of current facilities, their condition, and their potential. This data can then be
17
compared to information related to student needs and desires for college facilities. This
comparison can provide a basis for establishing a strategic plan and insight into current
needs to better serve the needs of future generations by developing priorities and cost-
effective solutions.
Purpose of the Study
The intent of this study is to provide current, generalizable information that is
useful for college administrators in making decisions relative to institutional facilities
and, in turn, to positively impact recruitment efforts. The first step in the research
process was to gather data from first-year university students related to their reasons for
selecting, or not selecting, a particular institution. A survey instrument was constructed
with the goal of being a simplistic, easy-to-respond-to format that would allow for the
provision of some comparison to previous studies on the impact of facilities on
recruitment, and to provide context and continuity similar to that found in more
longitudinal studies. The premise is that the data gathered will help to provide insight as
to the desires and needs of the current generation of college students. Identifying and
prioritizing the facilities potential students most desire in a college will help the college
to decide the best use of available funding to attract the greatest number of new students.

18
CHAPTER II: REVIEW OF THE LITERATURE
Introduction
At the turn of the 20th century, college typically was an endeavor reserved for the
upper class. After World War II, with the introduction of assistance programs like the
Servicemen’s Readjustment Act of 1944 (more commonly referred to as the G.I. Bill) and
a vibrant economy, a broader segment of the population was able to attend (Hill, 2017).
At that point the higher education business also was booming and continued through the
1970s and the Baby Boomer generation. Of course, with the increased demand came a
need for more and bigger colleges. This situation did not last, and by the end of the
1980s college student numbers were decreasing. As Hill (2017) noted, the post-war
educational boom “created a large number of colleges and universities, each of which is
now competing in an open marketplace for an increasingly scant resource: students – and
student dollars” (p. 4).
College Recruitment Considerations
In 1982, Litten expanded further on Chapman’s (1981) model of student college
choice, which noted that over 50% of entering freshmen attended colleges within 50
miles of their home and approximately 92% were within 500 miles of home. The choice
of which college to attend was found to be affected first by the student’s and student’s
family’s socioeconomic characteristics. Second, the choice was affected by external
influences, including other significant persons, the fixed characteristics of the college,
and the college’s efforts to communicate with prospective students (Chapman, 1981).
It has been reported that many people play an important role in a student’s college
choice, but they are most influenced by their parents (“Parents”, 1986). The 1986

19
“Parents” article in Change reported students’ parents have the greatest influence on their
decision to attend, what qualities to look for in a college, and what was expected to be
gained from the institution. The majority of parents polled in the 1986 study wanted their
children to attend college to sustain and improve their child’s social position and to
enhance their quality of life, but both students and parents expected to obtain a better job
and achieve higher lifetime earnings from a college education (“Parents”, 1986). While
the expectation of finding a better job upon graduation is still applicable for the current
generations, peers’ opinions seem to be more important to students than in the past, while
their parents’ influence has diminished somewhat (Showers, 2016). Interestingly,
Generation Z is exhibiting some change in this scenario, as they tend to “like their
parents” and are “extremely close to them; they see them as trusted mentors or guides”
(Seemiller & Grace, 2016, p. 157). However, differences are being observed between
parents encountered now and those of recent years, according to Loveland (2017).
Millennials are offspring of the idealistic Baby Boomer generation who tended to be
trusting of institutions. But Generation Z students are born of Generation X parents who
tend to be more distrustful of institutions and more protective. Where questions used to
be more about things like parking and weekend activities, they have turned to those of
safety, student loan debt, and graduation rates (Loveland, 2017). This means colleges
will need to adjust their recruitment efforts to accommodate the new generation of
parents as well as students.
Litten (1982) further stated the selection process is composed of a “complex
series of activities” (p. 400) that may vary by group (i.e., race, gender, academic level,
parental academic level), although some decisions are common among all groups. For
20
instance, he noted “parental education has stronger effects on the conduct of the college
selection process than attributes such as race or gender, with the greatest effects on the
way information is obtained” (p. 400).
The college selection process has been studied from many different perspectives.
Litten (1982) noted that sociologists have examined the process in relation to social
mobility, occupation, and the decision-making process (i.e., Alexander & Eckland, 1976;
Sewell and Shah, 1967; Thomas, 1977; Trent, 1974). Economists have studied the
decision from the public policy point of view (i.e., Kohn, Manski, & Mandel, 1973;
Nolfi, Fuller, Corrazzini, Epstein, Freeman, Manski, Nelson, & Wise; 1978). In more
recent years, educational practitioners have taken on the research challenge in the hope of
gaining a better understanding of the process and improving the institution’s involvement
(Litten, 1982). Litten noted differences in college selection decision-making based on a
variety of socioeconomic characteristics; for this reason, different types of information
and methods of distribution have been recommended. He also identified the need for
evaluating a college’s specific market to properly identify the best recruitment methods.
Over a decade after Litten’s (1982) study, Choy, Ottinger, Carroll, and the
National Center for Education Statistics (1998) presented data showing 25% of all
beginning postsecondary students enrolled in four-year public institutions; 15% in
private, not-for-profit four-year institutions; and 46% in two-year public institutions. The
students at both the private, not-for-profit, and public four-year institutions most often
cited the college’s reputation as their most important reason for attending. However,
public institution students also cited location and price as important.

21
Litten’s (1982) closing statement sums up his information: “In view of the rapidly
changing environment for higher education… the ways in which student attributes affect
the college-selection process will need to be periodically monitored” (p. 401). Indeed,
times change, environments change, and generations of people change. Research is
necessary to continue that periodic monitoring in relation to programs, services, and
institutional facilities.
This monitoring process, including evaluation, planning, and implementation,
could be considered similar to the process term often associated with industrial
operations: continuous improvement. Continuous improvement is considered a basic part
of the philosophy known as Total Quality Management (TQM) and is applicable to the
many practices within the university. TQM is defined as “the management philosophy
that focuses on fulfilling customer expectations by providing quality services and
products as a result of continuous improvement to the organizational process” (Ehrenberg
& Stupak, 1994, p. 79). It was first presented by W. Edwards Deming in the 1950s. A
continuous improvement program results in small changes within a process or, at times,
even larger changes to an entire process which help to improve effectiveness and
efficiency. Since its development, TQM has been recognized as applicable to businesses
beyond just manufacturing (Meredith & Shafer, 2010), encouraging more focus on
meeting customers’ needs. Blocher, Stout, and Cokins (2010) presented five steps for
quality improvement:
1. Determine the strategic issues surrounding the problem.
2. Identify the alternative actions.
3. Obtain information and conduct analyses of the alternatives.

22
4. Based on strategy and analysis, choose and implement the desired alternative.
5. Provide an ongoing evaluation of the effectiveness of implementation in Step
4. (p. 749)
Regular inspection, evaluation, and analysis of all institutional operations,
including those related to recruitment, is necessary to provide insight for administrators
in their decision-making processes. This effort is particularly important regarding
physical facilities, given the time and effort involved in making improvements and
changes.
A study presented in the Building Design & Construction magazine in 2007
(Editor-in-Chief) provided a comparison of information gathered in 1986 to data from
2006. In 1986 the study asked 1,000 students what physical factor most influenced their
college choice. Sixty-two percent said the appearance of the buildings and grounds was
the crucial facilities-related factor (Editor-in-Chief, 2007). A study completed 20 years
later in 2014 by the Center for Facilities Research (CFaR) of APPA: Leadership in
Educational Facilities (APPA) noted that physical factors are extremely or very important
in college selection. The significant facilities included those related to their major (72%),
libraries (53%), sophisticated academic technology (51%), classroom buildings (50%),
and residence halls (42%). The study (Editor-in-Chief, 2007) also stated 64% of the
students agreed the condition of campus facilities was important in selecting a college.
More than a fourth of the students (26%) said inadequate facilities would cause them to
eliminate that college from their list, particularly residences, facilities in their major, and
classrooms. While students acknowledged true academic factors were most important,
they felt the quality and appearance of the facilities could be an indication of the quality

23
of the university (Editor-in-Chief, 2007). The author noted the discrepancy between
study findings and actual institutional activities:
In fact, only 32% of students surveyed said that recreation facilities were either
‘important’ or ‘very important’ in their decision to attend an institution. “It’s my
guess that elaborate recreation centers have a lot to do with the egos of rich
donors who want the family name on a sexy building. I mean, who wants to have
their moniker on the Classics Department building? But if the CFaR data is right,
prospective students don’t care as much about rec centers as the trustees think
they do. (Editor-in-Chief, 2007, p. 1)
According to David A. Cain of architectural firm Carter & Burgess (June, 2006):
“Buildings related to academics are the most important. Students really want to know
what type of facilities are in their major” (p. 1). Ultimately, as Cain is quoted, “Long-
range planning for new construction and the repair and replacement of existing facilities
and infrastructure must be a guiding principle within the context of the institution’s
strategic plans and overall academic mission” (June, 2006, p. 2).
In 2014 Lipman Hearne presented a study of 2,300 students across the US that
looked at what influenced students to choose a particular college:
• Students of color said college fairs and emails were important information
sources, while white students did not even rank them.
• Students from the South were more interested in “appealing college
traditions,” while New England students were more focused on
“international/global experiences.”

24
• Female students with high SATs and ACTs related all of their requirements to
academics.
• Male students with low SAT scores were looking for “appealing campus
traditions” and Division I athletics.
• The majority of students enrolled at their first choice. Reputation and “sense
of community” were important factors.
• Students not enrolling at their top choice based their selection more on
financial aid. (p. 1)
As reported by Hill (2017), Boston College surveys students annually to
determine what interests them in the college and what influences their decision. They
found through these surveys the location of the college and the attractiveness of the
campus were strong reasons for choosing the college (Hill, 2017). Realizing the
importance of attractiveness stimulated colleges to display images of the city and the
campus more prominently, particularly in their online presence. Since that time, they
have seen an increase in campus tours and on-campus interviews. Boston College has
used the data from their surveys as they plan for the future (Hill, 2017).
Falk (2010) emphasized the need for planning for the future due to changing
student populations, deteriorating economic conditions, and improving technologies.
College leaders should alter their thinking in relation to campus offerings, facilities,
operations, services, and pricing given the changes in student body characteristics
according to Falk. Falk’s supposition was that the strategies of the past may not be the
ones that make them successful in the future. This conclusion was based on themes
related to population demographics, increasing numbers of nontraditional students, and

25
the economics of higher education. He recommended academic leaders move from
traditional strategies to consider things like career-focused curricula, tele-courses, online
courses, credit-for-life courses, service learning experiences, off-site learning, differential
tuition pricing, and inter-institutional collaboratives (Falk, 2010).
Martinez and Wolverton (2009) also contributed to the planning discussion and
made the point that “strategic planning has fallen out of favor in many business
organizations,” (p. 23) but it remains widely used among colleges. They added that
strategic planning is a good tool but may not be the only one. They suggested Porter’s
(1980) five forces model for analysis may enhance the process by considering the five
forces that can influence an industry: (1) Threat of new entrants, (2) Intensity of rivalry,
(3) Threat of substitutes, (4) Bargaining power of buyers, and (5) Bargaining power of
suppliers. Martinez and Wolverton (2009) stated that decision makers must understand
the context in which their organizations operate, whether a program, department, college,
institution, or system. College is no longer the brick-and-mortar buildings with the
traditional 18- to 24-year-old, straight-out-of-high-school students. It is important to
consider the shifting economy; the advances of opportunistic providers; and the changing
demands, preferences, and needs of consumers. The competitive nature of the college
recruitment process has presented a point where the industry analysis complements the
traditional planning process and provides a more comprehensive strategy (Martinez &
Wolverton, 2009).
Recruitment Strategies
Kealy and Rockel (1987) explained that studies to determine a direct link between
recruitment strategies and college choice are misguided. They emphasize that a

26
recruitment strategy’s effectiveness cannot be measured by whether or not the student
chooses to attend a particular institution, but must be gauged on the student’s perceptions
of the college’s quality. Their comprehensive research study involved 1,424 college
applicants and evaluated the impact of observable influences on their perceptions through
a quantitative analysis of four latent variables: academic quality, social life atmosphere,
campus location, and athletic quality (Kealy & Rockel, 1987).
Letawsky, Schneider, Pedersen, and Palmer (2003) looked at recruitment from a
different aspect as they considered factors that influence student athletes in comparison to
non-athletes. The most influential factors for choosing a college for student athletes are
degree program options, head coaches, academic support services on campus, type of
community in which the college is located, and the school’s sports tradition. The least
important factors are college choice of high school friends, prospect of television
exposure, other non-athletic financial aid, school colors, and opinions of high school
teammates.
Letawsky et al. (2003) quoted F. B. Newton who, in 2000 labeled current college
students (Millennials) as ambitious, precocious, stressed, wayward, and indifferent, as
well as having been exposed to more “grown-up” activities and less experienced in
exercising discipline and decision-making. College admissions personnel must
understand the generational differences and be familiar with how these students select a
college (Letawsky et al., 2003). Kealy and Rockel’s (1987) study evaluated several
recruitment methods in relation to student perceptions including college catalogs,
supplemental written materials and photographs, campus visits, campus tours, on-campus
interviews, group admissions conferences, and opportunities for faculty interaction and

27
alumni communication. One significant finding was that faculty and current student
interaction provided a positive correlation with student perception of the college’s
quality. The most significant recruitment effort was the college visit, even though
activities commonly associated with the visits, like tours and interviews, were not
significant in influencing their perceptions of college quality. The authors suggested the
college visit is the best recruitment effort and should be paired with other positive
influences like faculty and current student interaction (Kealy & Rockel, 1987).
Thirty years later, the importance of the campus visit was confirmed in a report
from Ruffalo Noel Levitz entitled 2017 Marketing and Student Recruitment Report Of
Effective Practices. This report was a compilation of findings from a poll conducted of
“undergraduate officials from a broad cross-section of private and public U.S. colleges
and universities” (Ruffalo Noel Levitz, 2017, p. 3). The report stated:
• Campus open house events were ranked very effective or somewhat effective
by 98.3% of the respondents.
• Overnight visits for high school students were ranked very effective or
somewhat effective by 95.5% of the respondents.
• Campus visit days to high school students were ranked very effective or
somewhat effective by 93.4% of the respondents.
• Weekend visit days were ranked very effective or somewhat effective by
90.9% of the respondents.
• Campus visit events designed for high school counselors were ranked very
effective or somewhat effective by 80.5% of the respondents.

28
Hoover (2009) discussed the “crucial ritual” of the campus visit and how many of
them are bland and predictable in his article in The Chronicle of Higher Education. He
pointed out that colleges should clearly present what they are and are not; they should
market themselves as total experiences (Hoover, 2009). He went on to suggest student
ambassadors (tour guides) become storytellers to provide a more personalized experience
for visitors. The article quotes Ronald G. Ehrenberg, director of the Cornell Higher
Education Research Institute, as saying, “We know this generation is different from other
generations. Once they get to college, they think, ‘We’re entitled to positive experiences
because we’ve paid a lot of money to come here’” (Hoover, 2009, p. 5). Colleges and
their campuses often can be complicated and difficult to promote in a single afternoon
visit, making authenticity a rather nebulous goal. Eckert (2012) noted that when students
are making college choice decisions, if evidence of quality does not exist, they may make
decisions based on subjective evidence such as photos and word of mouth. From the
review of viewbooks from 38 Ohio universities, Eckert found an abundance of outdoor
physical campus pictures. Perception of the campus begins to form with these pictures
prior to the campus visit.
Most often in this age of internet sites and social media, the initial research done
by a student and their parents is online. Often this is their first step in the selection
process (Okerson, 2016). Once they have narrowed down their list of potential colleges,
the visit is the next important step. This step allows the student to see the campus up
close and personal, and to see how it feels. Students relate their “feelings” about the
campus to aesthetics and community based on observing and listening during campus
visits (Okerson, 2016). According to Secore (2018), the campus visit is “overwhelmingly

29
the single most influential source of information for students in their decision on college
choice” (p. 151). As he noted, the “high-touch” experience tends to be more influential
than other more “high tech” information. Every aspect of the campus visit is essential to
the student’s college choice.
In an article in The Chronicle of Higher Education in April 2010, Hoover
expressed the importance of the campus saying, “A good impression might not sway a
prospective student one way or the other. A bad one probably will” (p. 1). And
“distinctiveness is key for the many colleges that lack the shimmer of national
prestige…Still, there’s no way to measure the thoughts that students and parents carry
home from even the most carefully planned visits” (Hoover, 2010a, p. 5).
Knowing campus visits play an important part in student perceptions, this quote
from Alan Green, former president of the Cooper Union for Advancement of Science and
Art and former director of the Educational Facilities Laboratories in New York, is
significant: “Steady enrollments mean that, if anything, it’s more important than ever to
put attention and care into one’s physical plant. Ignoring physical facilities could well
jeopardize the fiscal health of an institution” (Williams, 1985, p. 16).
The Role of Physical Facilities in Recruitment
In 1985, Williams presented a historical description of academic facilities, from
the Baby Boomer era (1960s) when buildings were constructed quickly and cheaply to
keep up with enrollment, through the decline of the 1970s, and 1980s when
administrators began to realize the physical facilities had the potential to have a positive
effect on enrollment. The Baby Boomers began reaching college age in the 1960s, and
institutions saw a dramatic increase in enrollment from approximately 3.8 million to 8.6

30
million students. They were in such a hurry to accommodate the hordes of students, the
buildings went up fast and cheap. Many of these buildings still stand and, in a spirit of
historic preservation, have been restored, renovated, and expanded in an attempt to meet
the needs of today’s students.
One way architects have addressed the social aspect of a college education,
particularly with increases in the number of nontraditional students, was with the creation
of student centers. Again quoting Alan Green: “What do students want to see on the
campus tour? First a clean admissions office; but then, the dormitories and the student
center” (Williams, 1985, p. 53). The 1980s brought “consolidated humanities buildings;
arts centers; updated science laboratories; expanded business and computer science
facilities; [and] dormitories and student centers to colleges and universities”; and, as
Williams (1985) noted, a building can “succeed on a variety of levels” (p. 55).
Twenty years after Williams, the importance of physical facilities relative to
student recruitment continues to be a topic for higher education. In a conference for
higher education professionals in 2007 entitled “The Campus of the Future: A Meeting of
the Minds,” several ideas were noted:
• Facilities play a supporting role in attracting and retaining students.
• The campus and facilities are the face of the institution and if they don’t like
them, they will leave.
• 26-27% of students attend a school because they like the campus, not the
programs.
• Traditional students (age 18-22) today want more than in years past, they are
more discriminating and have higher expectations for comfort, campus-wide.

31
• Students compare colleges based on “the best technology, the best buildings,
and the best on-campus eateries” (Suttell, 2007, p. 1).
This move toward comfort and amenities has been argued to have been taken too far and
students are being sent the wrong message, thus allowing for misconceptions of the real
world outside of school (Suttell, 2007). The information provided in Suttell’s (2007)
article allows for some critical thinking regarding how facilities should be planned and
designed for the future.
Also, in 2007, Reynolds and Valcik published an extensive study of over 16,000
students at 46 different institutions to determine how physical assets on college campuses
influenced student recruitment and retention. Students were asked to identify what
aspects of the college were essential or very important in selecting and remaining at a
particular institution. The top five institutional characteristics were all academically
related: strong major in their field of interest, excellent teachers, preparation for a career,
accessible professors, and customizable education. They also found approximately two
thirds of the students believed the overall quality of the campus facilities was essential or
very important. The study went on to ask students about the importance of various
facilities and what they considered important to see during campus visits (Reynolds and
Valcik, 2007). The facilities they most wanted to see included facilities related to their
major, libraries, technology, classrooms, and residence halls. Further questioning led to
findings such as:
• Having adequate facilities for their major was of highest importance.
• Adequate residential facilities, open spaces, classrooms, and libraries also
were important factors.

32
• Poorly maintained facilities were cause for rejection of an institution,
particularly in residence halls, classrooms, open spaces, and student centers.
This study has provided helpful historical information for use in new research related to
the impact of facilities on student recruitment and retention. Rullman and Van Den
Kieboom also supported this information in 2012 when they noted that “when users are
faced with a contradiction between intended communication (e.g., a welcome sign) and
unintended communication (e.g., poorly lit or dirty space), users are more likely to
believe unintended communication” (p. 181). The importance of facilities management
in the overall educational process is further emphasized by this statement.
Following shortly after Reynolds and Valcik (2007), Barista (2008) confirmed the
competitive aspect of student recruitment among colleges as they try to outdo each other
with “bigger, badder facilities” (p. 1) for recreation facilities. “Indeed, universities large
and small are replacing their smelly, old physical education buildings with posh, high-end
facilities packed with amenities and activities that rival private health and wellness
clubs,” stated Barista (p. 1). Barista added that schools are competing for the best and
brightest and are looking for any edge they can get. He asserted “improving the quality
of life is a sure-fire way to stay competitive” (p. 1). In contrast to other researchers, he
posited that the college’s money is well spent on recreational facilities based on a
statement from architect Curtis J. Moody of the architectural firm Moody & Nolan in
Columbus, OH, who said, “We’ve had multiple clients change their entire recruitment
tour once their recreation center opened” (Barista, 2008, p. 2). The article also quoted
Moody as saying current students have higher expectations since many of them have
come from communities that have upscale health and fitness clubs and recreation centers.

33
Barista also noted recreation centers are the primary social spaces on campuses “where
you’re going to meet your friends, hang out, and even study” (p. 2). Barista’s article
further discussed the financing of these facilities and quoted Kimberly A. Martin of
Brailsford & Dunlavey in Washington, DC, as saying, “The vast majority of these
projects are funded by the students, through increased student activity fees” (2008). The
report noted students can pay anywhere from $50 to $150 more per semester to finance
construction and operation of recreational facilities. Barista also proposed other options
for funding, such as qualifying for state funds by incorporating academic areas into the
building, working through a public/private partnership for construction and operation, or
charging for use of the various facilities.
Several years later, Tierno (2013) studied the impact of college union facilities on
student retention. This study confirmed the findings of Reynolds and Valcik (2007), in
that even though college unions were an important part of the campus related to student
retention, they fell in line of importance behind academic buildings, dining centers,
performing arts spaces, residence halls, and libraries. The college union had a positive
impact on student satisfaction because of involvement opportunities, employment
experiences, and places to relax and hang out. This research again emphasized the
importance of student facilities that support the academic mission of the institution,
enhance communication of community values, provide a diverse space, serve as a
community center, celebrate traditions, and are welcoming.
In 2014, Steelcase Education Solutions presented a study corroborating this
information, stating that “classrooms have a larger influence over prospective students’
enrollment decisions than university-provided amenities such as dining and fitness
34
facilities” (p. 1). Steelcase reported 51% of students surveyed said classrooms were the
most important environment influencing their enrollment, as compared to 24% for dining
facilities and 23% for athletic facilities. Additionally, 72% of students said active
discussions and group work impacted their ability to learn and helped them feel “like part
of the community” (p. 1). The report further stated “it is the potential of in-the-classroom
engagement with peers and faculty that is most important to students during the college
search process” (p. 1).
An additional consideration that has accompanied the newest generation and the
times in which we live is the need for security. Generation Z students are coming to
college with an intense awareness of the violence in the world. Seemiller and Grace
(2016) pointed out the necessity of creating more “robust and transparent policies and
practices around campus safety” (p. 195). These would include things like safety
presentations for students and training for emergency situations, which is information that
may be of particular interest to students as they make college choices.
Specific Physical Facilities Considerations
The literature has presented concepts of how campus facilities have impacted
student perceptions and recruitment over the past several decades. The university’s
physical facilities play a significant role in a student’s decision to enroll. Several
different facility attributes have been linked to student enrollment, success, and
matriculation.
Boylan (2005) noted the importance of building design through a quote from
Winston Churchill: “We shape buildings. Thereafter they shape us” (p. 1). Those who
are involved in renovating or planning facilities must do so carefully, remembering that

35
spaces can impact people’s interactions, creativity, productivity, and capacity to learn.
Boylan made a series of recommendations to college administrators:
Do not assume the architects will know everything they need to know
about the particularities of the kinds of teaching and research done at the
present and planned for the future. Do not assume the faculty and staff
know what they need or what the options are. Do enough research so that
you know the questions to ask and how to maximize the likelihood that the
building or renovation will achieve its full potential. (p. 1)
Boylan’s (2005) suggestions for the steps to follow in the building design process
were as follows:
1. Involve faculty in the architect selection process.
2. Insist that the architects and the departments involved talk.
3. Support the involvement of a faculty-led leadership team.
4. Prepare the community for change and hardship.
5. Prepare the community for the move-in phase.
6. Take a vacation.
7. Dream about what is next. (p. 1)
Blanchette (2012) noted issues related to space often are cultural and can affect
how social groups arrange their lives and interact in their communities. Space may
impact how individuals respond to their environment by affecting their personal attitudes
and behaviors. She went on to say space allocations within a university may be
indicative of value within the organizational culture, institutional priorities, or power and
prestige and may even determine how a person works or learns. “The challenge of

36
making effective space management decisions must be addressed in order to align with
changes in pedagogy and research, maximize educational effectiveness, and promote
institutional mission fulfillment” (p. 64).
As part of the fulfillment of mission, Valenti (2015) suggested colleges create
flexible, multimodal, and authentic learning experiences that help to create the
collaborative and creative employees that employers desire. The digital natives of today
are forcing higher education leaders to meet their educational needs on their terms: their
style, their space, their schedule. Valenti reported their expectations often are very
different from the traditional methods of education. Rather than classroom lectures on set
schedules, students want to take classes in such a way as to gain skills that employers
desire. One such idea is the “flipped classroom” where assignments are done at home
and classroom time is for discussion and problem solving. With these types of changes
coming, colleges will need to consider how they will transform spaces to meet the needs
associated with the learning styles. Valenti proposed learning spaces should be flexible,
collaborative, team-based, and project-based with the capability of creating and making.
Students need broad access to technology as project teams become interdisciplinary and
transdisciplinary.
Classroom design. As past researchers (Reynolds & Valcik, 2007; Editor-in-
hief, 2007; Steelcase, 2014) have noted, classrooms are an important factor in selecting a
college or university. Therefore, the impact of classroom design and the impressions
made on prospective students are important considerations for recruitment. In 2006,
Veltri, Banning, and Davies studied students’ perspectives on classroom design, the
design’s impact on their learning, and their suggestions for future classroom designs.

37
Students noted the need for furnishings that allow for group interaction, absence of
distracting noises, well-lit rooms, and comfortable room temperature. Students also
noted positive impacts on learning from things like a tiered classroom, an instructor who
is well-versed in the audiovisual equipment, bright colors to keep them awake, and
adjustable lighting controls (Veltri et al., 2006). Veltri et al. reported that if classrooms
and their furnishings are uncomfortable or inadequate, student focus could be shifted
from the material being presented. They recommended classroom furnishings be non-
restrictive, fit the space, and allow students to comfortably organize their materials and
still be able to interact with others when necessary.
Herzog and Valcik (2007) also studied the impact of classroom features on
student success through a quantitative analysis of cohorts of freshman students over a
five-year period relative to their performance in mathematics and English. Herzog and
Valcik identified a variety of factors that are considered to have an impact on student
academic success, including class start time, presence of windows in the classroom, and
room size. The study noted a positive impact on success by simply having windows in
classrooms. On the other hand, the study also noted negative impacts on success from
extra-large classrooms and from classes held later in the day (Herzog & Valcik, 2007).
Lower GPAs (0.05 lower) were found in those students who took classes after 1:00 pm.
Similarly, larger rooms lowered the GPA by 0.01 for every additional 100 square feet of
room space. These items also negatively affected retention into the second year. Herzog
and Valcik quoted Jamieson’s 2003 article, Designing more effective on-campus teaching
and learning spaces: A role for academic developers, saying, “Recent attempts to create
new teaching and learning facilities on university campuses have often resulted in

38
celebrated architecture that has proved to be educationally problematic,” stressing that
“the design and development of new spaces, or the refurbishment of existing classrooms
and other formal and informal teaching and learning settings, are fundamentally
educational concerns impacting directly on the student learning experience” (p. 120).
This statement emphasizes the need for proactive planning for the institution and its
infrastructure on a continual basis, taking academic needs into consideration at all steps
first and foremost.
During this same time frame, Kent (2009) also noted the need for change in
classroom design and the fact that the traditional classroom with its straight rows and
chairs facing forward is not conducive to student interaction, teamwork, or developing
interpersonal skills. The author suggested workers of the information age will need to be
able to communicate well, think globally, and work collaboratively with a diverse group
of people. A classroom designed to encourage creativity, interdisciplinary interaction,
exposure to other viewpoints, and diversity of culture and thought was recommended.
According to a brief article presented by Cornell University’s College of Human
Ecology Design + Environmental Analysis, “traditional environments of students seated
at tables facing the front, that are difficult for group work and aren’t adaptable to
different learning styles throughout the course of an hour-long class, don’t align with the
learning goals that we aspire to have as a college” (D’Angelo, 2017, p. 40). According to
D’Angelo (2017), current research indicates more active learning and student
engagement improves information retention rates and understanding of education
material.

39
Kent (2009) agreed. His dissertation was a mixed-methods research project to
study the effect of spatial design of the classroom on student and faculty perceptions.
The concept was a coffeehouse style of classroom as an alternative to the traditional
lecture hall; a setting intended to be comfortable, inviting, and pleasurable. The
coffeehouse style of classroom has flexible furnishings to allow for a variety of faculty
and student working and learning arrangements. Flexibility meant offering a variety of
table heights, different seating options, and various size furniture groupings, as well as
adequate technology access. Kent’s (2009) study found the coffee house style classroom
had positive impacts on involvement (engagement and interaction), satisfaction, and
personalization. There also was positive feedback from faculty members who expressed
a high degree of satisfaction with the setting.
Overall, Kent (2009) recommended hybridizing college courses by offering half
of the classes in a traditional classroom and half in the coffeehouse classroom, stating it
“could be a beneficial delivery practice for the students and the faculty and help
contribute to the culture and image of the college and its stakeholders” (p. 67). This type
of collaborative classroom with media-rich presentation technology also was
recommended by Fabris (2012) and Park and Choi (2014).
Lei (2010) also studied how classroom design affects student engagement and
learning, as well as instructor ability and confidence. This study supported findings by
Herzog and Valcik (2007) relative to classroom size and the need for being well-lit. Lei’s
study also noted the impact of color on classroom design. Lei stated color can have a
psychological impact on students and can affect productivity, absenteeism, and morale.

40
McLaughlin and Faulkner (2012) further noted the need for reconsideration of
classroom design. As students and technology have changed, so have the ways of
studying and learning. Students are spending less time on campus and more time
interacting through technology. With this in mind, McLaughlin and Faulkner took on a
qualitative study to determine what types of learning facilities students wanted on
campus. They found students expected digitally-rich environments, looking for efficient
and fast networks, as well as having all classwork available digitally. Students also
expressed their dissatisfaction with traditional classroom lecture classes with chairs in
rows and no ability or encouragement to collaborate. Students desired a more
participatory, informal learning environment with relaxed, informal physical facilities
where they could meet, discuss, and learn from one another.
Likewise, Lei (2010) studied the effect of physical attributes which influence
students and instructors: classroom size, classroom shape, seating arrangement, furniture
arrangement, technology availability and location, lighting, thermal condition, and noise
level. Lei recommended several considerations in classroom design:
• Classroom size and shape should reduce the distance between the students and
instructor to increase eye contact.
• Wide, rather than deep, classrooms are preferred.
• Classrooms should be fully equipped with the necessary instructional
technology and instructors effectively trained in its use.
• Well-lit classrooms are conducive to active learning, but should be adaptable
for various visual presentations. (p, 128)

41
Lei (2010) also noted ambient conditions have the potential to affect emotional
states, task performance, and attention spans. Extreme temperatures can distract
students’ focus away from learning. And noise can be detrimental to learning because it
can reduce teaching time, force frequent repetition and pauses, and make communication
difficult. Poorly designed classrooms can result in poor student satisfaction ratings of
instructors, according to Lei. Consulting faculty and students during design of
classrooms can have a positive impact on design, learning, and satisfaction ratings (Lei,
2010).
Park and Choi (2014) echoed Lei’s (2010) findings in their quantitative study
which made a comparison of the traditional classroom design to an active learning
classroom (ALC). The traditional classroom was shown to have a golden zone (front,
center rows) and shadow zone (back rows) that results in discrimination in learning.
Students reported in the study that the golden zone provided good eye contact and
interaction with the instructor, a better environment for maintaining concentration and
motivation, and the best view of the screen and whiteboard. The shadow zone seats were
the least desirable for the opposite reasons, and the back of the room allowed for more
distractions for students overall.
The ALC was designed in an attempt to provide all of the positive characteristics
of the golden zone in the traditional classroom (Park & Choi, 2014). The ALC includes a
movable lectern for the instructor, round tables for the students, and additional screens
and LCD screens around the classroom that connect to docking stations at the tables. The
ALC in the study provided increased student interaction, increased interest in the subject
matter, increased communication with the instructor, enhanced class participation,

42
inspired feedback, and improved students’ willingness to ask questions in class (Park &
Choi, 2014). The ALC was shown to enhance students’ tendency to share knowledge and
promote the development of creative ideas. A downside to the ALC was the expense of
furnishing the classroom and the decreased revenue because of fewer seats for the size of
the room. The Park and Choi (2014) recommendations for classroom design included:
• Institutions should “pay more attention to the educational impact that
classroom design has on students, and make investment in healthy learning
spaces a priority” (p. 769).
• Teaching and learning methods should be tailored for the ALC environment.
In 2014 Weber-Bezich completed a mixed-methods study designed to investigate
the impact of classroom design on student engagement. The data revealed the
collaborative learning classroom design increases student engagement with faculty and
other students and contributes to the student’s ability to learn. Weber-Bezich’s study
presented nine key findings:
1. The design of learning studio classrooms contributed to increased student
engagement with faculty.
2. The design of learning studio classrooms contributed to increased student
engagement with fellow students.
3. Students credited the design of learning studio classrooms with having an
effect on their ability to learn.
4. Learning studio classrooms conveyed a strong message to faculty and students
that the institution valued student engagement.

43
5. The learning studio design feature of increased access to technology
contributed to increased student engagement with faculty and content
material.
6. The learning studio design feature of desks configured in pods/groups was the
greatest contributor to increased engagement with fellow students.
7. Learning studio classrooms supported an integrated instructional approach
that assimilated multiple teaching strategies and learning activities into a
single class period.
8. Learning studio classrooms promoted instructional versatility and efficiency.
9. Student views on the perceived effectiveness of the learning studio setting did
not differ by age or gender. (pp. 124-135)
Weber-Bezich’s (2014) study went on to recommend:
• The learning studio design element of desks configured in pods/groups should
be considered a best practice when designing or redesigning classroom spaces.
• The design or redesign of classroom spaces should provide students with
increased access to technology.
• Information technology personnel should be involved in the design or
redesign of classroom spaces from the onset of the planning process.
• Professional development and sharing opportunities regarding the use of
technology to support active and collaborative teaching strategies in a learning
studio classroom should be offered and provided to faculty on a continuous
basis. (pp. 137-139)
44
Through consultation with students and faculty, college administrators and facility
planners can gain an understanding of what students and instructors need now in order to
know how needs have changed from years past. Classroom design has been impacted by
newer pedagogical methods that have changed to become more interactive and group-
focused (Fabris, 2012). As Park and Choi (2014), Fabris (2012), and Weber-Bezich
(2014) agreed, to better suit today’s learner, ew classrooms should be furnished with
easily movable furniture and media-rich presentation technology. The new rooms require
updated electrical systems and more square footage, 25-40 square feet per person versus
17-18 square feet in the traditional classroom (Fabris, 2012).
According to Fabris (2012), to be most cost-effective, these new classrooms must
be utilized to their maximum, which means they must be shared by multiple departments.
This full utilization also requires the flexibility to quickly and easily reconfigure spaces
as needed. Collaboration can be promoted in current designs by locating different
disciplines within the same building with the expectation of gaining more effective
learning, higher-quality research, and greater innovations.
Park and Choi (2014) proposed three questions to be posed to institutions for
consideration:
1. What is the institution’s vision for education and is it willing to consider the
inclusion of effective classroom space?
2. Does the university, and its faculty and students, desire to implement newly-
designed classrooms?

45
3. Would the new space design fit within the budget, coexist with the concept of
providing enough classrooms, and blend naturally with the student population
and culture? (p. 769)
Each of these questions should be considered early in the planning and design process.
Library facilities. Like classrooms, libraries have been a facility of concern for
students during their college selection decision-making process, although current students
are looking at them differently than past generations. Fabris (2012) pointed out that, with
the digital age, large libraries full of printed material are vanishing. These areas are large
and are quickly becoming under-utilized space. They often are repurposed for things like
lounges, study rooms, and media rooms. Fabris’ watchwords for future university
construction projects–multi-purpose, multi-use, and reconfigurable. Mills (2012)
supported this stance by suggesting multiple facilities be fused into a single building to
save costs, eliminate redundant space, increase utilization, maximize technology usage,
increase space flexibility, provide new revenue sources, allow for more creative funding
options, and enhance recruitment and retention.
The need for and value of the traditional academic library has been questioned
since the 1990s and has prompted the discussion of the role of libraries in the future, as
what Closet-Crane and Pickering-Thomas referred to as “space and place” (2009, p. 1).
Their dissertation described the terms information commons and learning commons as
“evolutionary stages in the re-alignment of the library with the education mission and
changing needs of universities and colleges that are re-focusing their approach to higher
education on student-centered teaching and learning” (p. 158). Information commons is
the adaptation referring to the changing technology associated with the digital age, while

46
learning commons is a higher level of evolution of the library to be a space and place for
learning.
Massis reported in 2011 a concern among librarians about changes being made in
campus libraries. He noted libraries were working to balance their collections of printed
materials with the need for digitally-related media and equipment. At issue was how to
provide proper utilization of shelf space while still allowing for “serendipitous” browsing
(p. 1). One suggestion was to develop a “browsing collection” in a conspicuous,
comfortable, and quiet location where recently published books and magazines are
located and rotated out on a three to four-month basis. Massis also suggested moving
printed materials to off-site storage might prove effective, as it frees up and provides a
balance of materials in the premium corner of the campus.
Hunter and Cox (2014) proposed modern academic libraries be seen as
multifunctioning spaces to provide areas for individual study, technological connection
(including the need for inhabiting more than one virtual space at a time), counseling,
tutoring, and disability support, just to name a few. Often areas outside of libraries are
used for study, commons areas, cafés, and student unions, supporting the idea that
different learning styles require different spaces. Informal learning spaces provide areas
where students can gather and work together. Hunter and Cox suggested university
libraries consider providing open spaces where students could claim their own personal
space without distractions. Libraries should avoid creating soulless, institutionalized
academic spaces and aspire to make them warm, friendly, and homey.
Miller’s (2012) concern related to library facilities was that the value be properly
communicated to both students and parents, particularly emphasizing the library’s

47
contribution to the college’s strategic goals. Given that the library is one of the facilities
noted as having significant impact on a student’s college choice, as noted in other studies,
the quick glimpse of the library during the campus visit seems inadequate. Miller noted
the importance of educating enrollment managers, admissions staff, and tour guides about
the library and its offerings. Other tactics also were suggested: direct e-mail
correspondence from the library to new students, creating a library website specifically
for prospective students, librarian guest blogging on the admissions website, and
increased library involvement in admissions events. Miller’s recommendations for
increasing the visibility of campus libraries included: “(1) Get on the campus tour; (2)
Make sure facilities are clean, pleasing to the eye, and have clear signage; (3) Give good
information; (4) Connect with student tour guides and their advisors; (5) Give constant
updates to staff and tour guides; (6) Be available during tours; (7) Alert library staff of
tour schedules; (8) Share real stories about the library with prospective students; and (9)
Embrace the helicopter parent by working to educate them on how the library can help”
(p. 588).
A recent study of Generation Z students found that learning space and library
designs are important to them (Seemiller & Grace, 2016). They desire a designated zone
for learning away from distractions where they can focus, with access to necessary tools
like the internet and plenty of table space. Creating such a place can be accomplished
through providing a variety of sizes and types of spaces throughout the library area
(Seemiller & Grace, 2016).
Residential facilities. Interestingly, during the 1980s Williams (1985) noted that:

48
Student demand for residential services was rising, since on-campus living is
usually cheaper than renting apartments off campus, and with aid on the decline,
students are saving where they can.... And, most certainly, today’s students are
more likely to embrace administrative overtures directed toward improving their
social lives. (p. 50)
With that desire for on-campus housing, construction was again on the rise as universities
began to recognize the more competitive nature of student recruitment. Competition has
continued related to student housing, as students may base college selection on residential
facilities.
Ike et al. (2016) also noted the impact of campus housing on the decision process.
They recognized students utilizing campus housing often achieved better educational
outcomes and were more likely to graduate. Campus housing also provided some
attractiveness to students and their families with the perception of a greater sense of
safety and security. Despite the potential for improved academic performance, increased
social interaction, and proximity to activities, current students often cite privacy,
independence, and costs as reasons to select off-campus housing rather than the
residential facilities offered by the university (Wode, 2018).
Fabris (2014) summarized a study done by Little Diversified Architectural
Consulting that interviewed 62 college students in North Carolina to see what they
wanted in college living spaces. In their dormitory rooms they want:
• The ability to reconfigure the room
• Built-in furniture that defined the space
• Mobile beds with cushioned seating
49
• “Work surface” desks and comfortable chairs
• The ability to create a private zone with things like translucent dividers along
beds
• Storage
• A sink in the room
• Updated dorm furniture
• The option to paint a wall
• Non-neutral colors
• Murphy beds or loft beds rather than bunks. (p. 1)
For study spaces they want scattered, small, individual study nooks, particularly
near stairs/elevators; comfortable seating; well-lit areas (without glare and heat-gain) and
windows; flexible furniture options; and outdoor study space (Fabris, 2014; Seemiller &
Grace, 2016). Fabris (2014) also noted students desire common areas that promote a
sense of community for relatively small groups (16-32 students) and are near circulation
areas; could accommodate variety, learning and “chilling”; have laundry facilities near
the social spaces; have kitchenette areas to serve smaller groups; and had nearby outdoor
areas and green spaces for play or congregating.
Nugent (2012) also studied residential common spaces and their impact on
students. The desire for administrators is that campus housing should support academic
and developmental needs of students encouraging engaging communities that develop a
sense of belonging. In response to this desire, the Massachusetts State College Building
Authority (MSCBA) decided to study why some housing works and some does not.
They found three basic concepts appear to affect student needs:

50
• Learning happens in many ways—Academic pedagogy is changing: project-
based learning, social interaction, focus on transactions between people, group
work, and multiple learning styles.
• Learning happens in many places—Campuses are not compartmentalized:
eating in the library, seminars in the residence hall, and research anywhere
there is Wi-Fi.
• Learning is more than just academics—College is not only an academic
experience but a maturation and growth experience as the students become
adults (Nugent, 2012, p. 234).
Nugent’s (2012) study for the MSCBA found the most successful spaces share
some attributes:
• Common areas were open to, and visible from, the main entry and traffic.
• Large, multi-purpose areas attracted a variety of people and tended to promote
interaction between the various social groups.
• Common areas were sized to encourage interaction while still encompassing a
range of activities.
• Size and offerings within common areas were varied as they were distributed
throughout buildings to maximize opportunities for social connection at
various scales.
• The policies were such that students were allowed to personalize the residence
hall to make it their own.

51
• Spaces with natural light, inviting colors (avoiding excessive use), and
comfortable, easily moved furniture were attractive to students. A more
homelike environment seemed to inspire a sense of pride and ownership.
Nugent, Fabris (2014), and Williams (1985) appeared to find similar results on the needs
and desires of students as related to residential facilities.
Student common areas. Grummon (2009) stated surveys indicated space design
is usually determined by the people who manage the space, but would be more beneficial
if the actual users of the space were the key drivers. He found active engagement
increased the likelihood that the learner would retain and use the information later. He
also recommended institutions work to create facilities that encourage collaboration and
active participation.
When not in the typical classroom, students are multitasking on their computer,
on their phone, in their books, and talking with others, all informally and in a variety of
relaxed atmosphere spaces. Grummon (2009) recommended using various social media
platforms to evaluate and survey student preferences for learning spaces. According to
this study, flexibility is one of the most desirable characteristics in a space, such as
furniture that moves and acoustic and visual separations that allow collaboration.
Universal design facilities. Beyond the traditional university student of 18-22
years, university administrators and facilities planners also must consider
accommodations for disabled students, older learners, students with children, and all
types of nontraditional learners. Salmen (2011) presented a study of the idea of universal
design (UD). The intent for the application of UD was to take the nontraditional types of
students into account, taking accessibility beyond just what is necessary for compliance.

52
UD is intended to improve usability for the academic community while ensuring
compliance with all applicable regulations (Salmen, 2011).
The principles of UD include equitable use, flexibility in use, simplicity and
intuitiveness, perceptible information, tolerance for error, low physical effort, and size
and space for approach and use. Examples of UD on a college campus include features
like providing choices for how to enter buildings or options for sitting in classrooms,
together or separately (Salmen, 2011). Providing information in more than one sensed
modality also would be considered UD, like alarms and warnings being transmitted
visually and audibly. UD suggests five means for providing access: architecture,
personal assistance, procedures, equipment, and medical intervention (Salmen, 2011).
Colleges can look at several areas on their campuses:
• Grounds—create accessible paths with signage to direct students and visitors
to the most navigable routes.
• Buildings—multi-height/accessible tables, wide aisles, sensor-activated doors,
family restrooms, etc. (Salmen, 2011, p. 18)
Ambient attributes of facilities. As noted earlier, Lei (2010) found links
between student success and environmental factors such as color, lighting, noise, and
thermal conditions. He reported colors have an emotional impact and could improve
productivity, absenteeism, and morale. Learning productivity was found to increase by
5-10% because of color selections, according to Lei. The study noted several impacts of
color: (a) light colors had a calming effect, (b) bright colors had a gloomy effect, and (c)
multiple-color patterns facilitated pondering/thinking during class time. Colors can
transform a classroom into a pleasing and exciting room that encourages positive

53
feelings. Kurt and Osueke (2014) provided support for this theory by stating “the
ambiance of the interior space affects the users’ behavior and perception of that place by
influencing their emotional situation” (p. 1).
In 2003, Wang completed a study of 145 students who participated in assessments
utilizing the Wall Color Preference Test and the Myers-Briggs Type Indicator test.
Students’ wall color preferences were in the “cool color” palette, but no correlation was
found between color preference and personality type. Cool colors, blues and violets, are
perceived as receding, tranquil, and passive; warm colors, bright hues of red, orange, and
yellow, are perceived as advancing and tend to accelerate the pulse, increase body
temperature, and foster an extroverted emotional response. Warm colors tend to
stimulate brain activity and a feeling of warmth. Cool colors promote relaxation, passive
participation, and coldness. The most preferred wall colors in Wang’s study of students
were the cool colors of Dusky Lilac, Sailing Blue, and Viola.
Kurt and Osueke (2014) reported using color is an important element of designing
the appropriate circulation of public interiors. As part of their study, the psychological
properties related to various colors were presented, much like Lei (2010) and Wang
(2003). Kurt and Osueke quoted Mahnke in 1996 as saying the environment should
include colors in changing hue, saturation and brightness, and changing temperatures.
They recommended the use of warm and cool colors, with a complement of the dominant
color to a degree. Kurt and Osueke did not recommend the use of gray and black based
on the fact that their psychological properties could be negative; pure gray is considered
suppressive, black shows coldness and efficiency, and brown is a calmer version of black.
On the other hand, direct sunlight was said to give a warm and friendly atmosphere,

54
which complements Herzog and Valcik’s (2007) findings relative to having windows in
the classroom to improve student success. Lei’s (2010) conclusions supported these
findings as well, as he noted well-lit rooms are conducive to active learning.
More color has been shown to affect moderate arousal and to increase memory
retention, but the use of large areas of white was considered boring and uninteresting.
The study recommended balancing complexity and unity; avoiding large, one-color areas
(Kurt & Osueke, 2014). Other environmental conditions also were found to affect
emotional states, task performance, and attention spans (Lei, 2010). For instance,
extreme temperatures and noise can be distracting and can affect learning.
Planning Facilities for Recruitment
In an article presented by the Learning Spaces Collaboratory (2012) relative to
designing learning spaces, the first step must be to identify the institution’s mission and
be able to plan with the end in mind. Kahlenberg (2011) expressed the larger goals of
higher education as being: (a) To ensure every student, no matter the wealth of her
parents, has a chance to enjoy the American dream, (b) To educate leaders in our
democracy, (c) To advance learning and knowledge through faculty research and by
giving students the opportunity to broaden their minds even when learning does not seem
immediately relevant to their careers, (d) To teach students to interact with people
different than themselves, and (e) To help students find a passion—and even a purpose in
life.
An important question to ask during the planning and development stage is how
the space matters for learning and how the new spaces will contribute to “better learning
for all students” (Learning Spaces Collaboratory, 2012, p. 1). Both campus and

55
curriculum must be considered from the perspective of mission, strategic goals, and
priorities. During space planning, the creation of connections between departments and
disciplines is important, as well as the college and the community. “Considerations
should be given to the architectural and intellectual connections that foster community”
(Learning Spaces Collaboratory, 2012, p. 3). A Project Kaleidoscope study in 1998
noted that well-designed, attractive, and well-equipped contemporary learning spaces
create a new excitement which encourages innovation and conversation inside and
outside the campus. The faculty and administrators’ jobs then are to relay that
information to internal and external audiences (funding sources) before and after any
construction project begins. Project Kaleidoscope reported the key to a facility that
makes a difference is in the thoughtful definition of program goals well before the design
process ever begins. It must be a collaborative effort of all stakeholders of the college
community.
Haas concurred in 2015, noting strategic planning must be integrated planning,
including academics, finances, and facilities. He went on to state the integrated plan
must consider square feet of space required, where the program will be housed, whether
new buildings or old buildings will be used, the number of faculty and staff needed, the
number of students expected, the additional upkeep (maintenance) required, the source of
funding, and how all of the numbers will balance. The Project Kaleidoscope (1998)
study made the following planning recommendations for faculty and administrators:
• As the first step in planning improved spaces, set clear goals for student
learning; do not underestimate the importance of planning that links programs
and facilities.

56
• Document the total need for improving the physical infrastructure for
research, training, and instruction in mathematics and the various fields of
science.
• Determine how to fund the needs over the long-term, including the allocation
or reallocation of funds and the use of a variety of funding mechanisms.
• Identify ways that changes in the practice of science, emerging technologies,
and new understandings about the nature of learning are changing the
education environment.
• Plan buildings with basic systems that are adaptable, that will accommodate
new directions in science and approaches to learning in years to come.
• Use new spaces to enhance the learning community as they encourage
interaction and add to the architectural distinctiveness of the campus. (p. 3)
The economics of planning. In 1999, Agron noted colleges were trying to
improve their position in the recruitment competition by focusing on the prospective
student’s and parent’s first impression. They attempted to accomplish this goal by
allocating more money to improve the appearance and operations of facilities. Agron
stated colleges earmarked approximately 10% ($741.71/FTE student) of their budgets
toward maintenance and operations (M&O) in 1998-99, up from 9.7% in 1997-98 (based
on a study mailed to 1300 college physical plant directors). Spending of M&O funds was
divided between salaries/ benefits—52%, utilities—28%, supplies—10%, equipment
maintenance—6%, and equipment—4%. The allocations resulted in $3.62 per sq. ft. At
that time, according to Agron, institutions averaged 194 sq. ft. per full-time equivalent
(FTE) student. Agron stated that four-year colleges traditionally allocate much more

57
M&O funding per student than did two-year colleges. In 1998-99, 4-year colleges
annually allocated $1,559 per student and two-year colleges spent $536 per student. The
difference was attributed to educational mission and offerings, existence of specialized
buildings and courses, older physical plants, laboratory and health facilities, housing, and
24/7 year-round usage. Four-year colleges employed 4.0 M&O personnel per 100 FTE
students in 1998-99, and two-year colleges employed 1.61 per 100 FTE students. The
median for all colleges was 2.72 M&O personnel employed per 100 FTE students in
1998-99 (Agron, 1999).
American School & University continued this survey, as reported by Agron
(2009), on an annual basis for several years. In the final 2008-09 study, Agron (2009)
reported the existence of an economic downturn and tight budgets for M&O in colleges.
The median college allocation in 2008-09 was 10% ($1303.75/ FTE student) of the total
budget to M&O, resulting in an M&O budget of $5.49 per sq. ft. An additional fact
reported by the 2008-09 study was that approximately 13% of the colleges in the survey
were contracting out M&O services, and 56% were using a green cleaning program.
Agron (2009) also reported that, on average, custodians were maintaining 39,647 sq. ft.
per person, and maintenance workers were maintaining 79,293 sq. ft. per person.
In light of the economic situation in which colleges find themselves, Alexander
and Drumm (2016) recommended the use of calculating the return on investment (ROI)
in facilities planning processes to achieve maximum financial benefits. Their article was
a case study of the development of a long-range academic and facilities plan for Central
Piedmont Community College (CPCC) to identify projects that would enhance and
expand academic programs to serve students, citizens, and community employers. The

58
Academic and Facilities Plan considered departmental programs for academics,
enrollment growth, strategic growth (included a BYOPC model), talent acquisition,
infrastructure assessment, and land acquisition. As part of the North Carolina
Community College System (NCCCS), CPCC desired to meet the standard of 100
assignable sq. ft. (ASF) per FTE student. Alexander and Drumm noted projects
presented within the Academic and Facilities Plan were evaluated and prioritized based
on how well they achieved the ASF/FTE, justified cost of projects (formula funding), and
positively impacted accountability measures (performance funding); i.e., which projects
would provide the greatest achievement per dollar spent.
The Center for Facilities Research of the APPA also saw a need for strategic
planning and recommended leveraging facility assets in the APPA Thought Leaders
Series 2014. This document recommended focusing on facility contributions to the core
goals of the institution by “contributing to student success, using total cost of ownership
principles, maximizing space management, expanding data analytics systems, and
involving the campus community in sustainability and energy efficiency” (CFaR, 2014,
p. 38).
The planning process. A British study by Belfield and Thomas (2000) noted a
correlation between larger, more well-funded colleges and improved academic
performance. Ultimately, they found in their study that “how resources are used matters
at least as much as how many resources are available.”
As Kadamus said in 2015, the goal is to maintain high quality education while
keeping costs in check. This is often difficult task at a time when as many as one third of
all colleges and universities were reporting significantly weaker financial positions than
59
prior years, particularly due to having more liabilities, debt, and expenses, while revenue
was decreasing. Kadamus reported expensive amenities (i.e., fancy dormitories, state-of-
the-art gyms, and climbing walls) have garnered a large portion of the focus in relation to
costs, but the bigger concern for institutions is the large number of buildings that are
aging rapidly and in need of renovation or replacement. As Kadamus stated:
The amount of investment required to maintain complex buildings and to catch up
on deferred maintenance and renovations required for post-war buildings is too
much for institutions to handle unless they closely examine their missions and
make tough decisions regarding capital investments. (p. 75)
Colleges are reaching a point of crisis as campus buildings have aged, deferred
maintenance backlogs have grown, and operating budgets have been reduced, making
staying competitive and meeting changing programmatic and student needs extremely
difficult (Kadamus, 2015). Old buildings require renovation, and newer buildings require
more upkeep and maintenance, so operations budgets are experiencing a greater and
greater burden. Kadamus recommended colleges implement strategies to meet these
challenges by creating policies and practices to reallocate operating savings to increase
campus stewardship; his suggestion was to repair campuses while simultaneously
slowing deferred maintenance rates.
In contrast, Kenton (2014) noted colleges have increased tuition at much higher
rates than inflation over the past several years, all the while counting on the common
perception that a college degree is essential in this day and age. The result is that
students have accumulated massive amounts of debt and yet are struggling to find good
paying jobs when they graduate. Kenton noted, “As students carry an increasing burden
60
for funding the enterprise, institutions will need to find ways to lessen the burden of
annual tuition increases if they wish to remain viable entities” (p. 17). Each institution is
different and some colleges may be better able to survive an economic downturn than
others, but change is still needed. Kenton suggested better management and utilization of
faculty time, reducing release times, and managing faculty loads were needed changes.
Next would be a control of what the author called curricular proliferation, where new
programs are added but few are dropped, leading to small class size and increased class
costs. A third consideration was to bring more of a balance to employee compensation
by reducing high salaries for “special” positions like presidents, coaches, and star faculty
members. According to Kenton,
… with each new building comes an obligation to pay for its maintenance,
operations and (depending on its funding) debt financing… Today many
campuses don’t fully utilize their existing buildings…. If they were to better
utilize their existing facilities, they may not need these new facilities. (p. 21)
Vidalakis, Sun, and Papa (2013) reported expenditures on land and facilities is the
second largest expenditure for universities next to salaries, so wise budgeting could free
up funds for other aspects related to the student experience. The quality of the campus
adds value by enhancing marketability, strengthening identity, and facilitating
recruitment. Facilities must provide a good ROI by developing a deep understanding of
the user’s needs. Vidalakis et al. quoted Kowalski (1983) as saying:
Educational facilities, like other material resources, are consumable. In time, they
are used up and must be replaced or revitalized… In an era of declining resources
and dramatically changing educational programs, it is essential that those

61
individuals responsible for solving educational facility problems understand the
issues if they are to effectively meet the needs of future generations of students.
(p. 490)
Since universities have become increasingly dependent on tuition and fees paid by
students, recruitment has become particularly important. Therefore, student “purchase
behavior” is of prime importance, according to Vidalakis et al. Given the information
presented on students’ college choices, the conclusion drawn would be that quality built
and maintained facilities are a necessity for recruitment and retention. Vidalakis et al.
said, “Maintaining the quality of facilities to high standards can have a significant impact
on student recruitment” (p. 498). However, the expectation is that in order for facilities
to impact recruitment, they must be incorporated into the college’s marketing strategy.
The study ultimately recommended the design and procurement of buildings, facilities,
and related services should be focused on users’ needs, as well as a good return for the
money spent (Vidalakis et al., 2013).
Haas (2015) proposed the development of an integrated strategic plan to look at
the problems and proposals from all directions to determine the feasibility and impact on
all departments and the college as a whole. Integrated planning should be a regularly
scheduled and frequently occurring activity resulting in the allocation, reallocation, and
effective use of resources. Haas recommended four tools to provide a common
understanding and basis for planning: (a) inventory of the past and present, (b) statement
of the division of labor and the objectives of the institution, (c) future projections, and (d)
special studies. Planning must be approached strategically: completing facility condition
assessments (FCA), determining functional adequacy, and performing a gap analysis to
62
start (Dufresne, 2012). By proceeding in a systematic and data-driven manner, the plan is
defensible and costs are quantified, which can help to prevent unnecessary spending
(Dufresne, 2012).
Blanchette (2012), however, recognized fragmentation and ambiguity in the
academic culture of shared governance. Roles are fragmented as a result of independent
actions of faculty and administrators and ambiguous due to unclear lines of authority
(who is responsible for what). Blanchette recognized the decisions often are made using
limited rational choice theory (information needed is seldom complete), all alternatives
are not considered, individual preferences came into play, and agreement on the goals
does not exist, resulting in uncertainty and risk. Two of these aspects, individual
preferences and conflicting goals, make the decision more political in nature and are even
more pronounced when there is competition over scarce resources.
Chapman (2012) agreed, as he recognized money spent on facilities results in
scarce educational resources which put important services and programs in jeopardy. He
emphasized this premise by saying, “public choice theoretical perspective argues that
many of the expenditures made to expand campus facilities are wasteful” (p. 97). He
cited studies (Jensen, 2000; Milgrom and Roberts, 1992; and Cyert and March, 1963) that
pointed out the self-serving behavior of administrators, which often overrule rational
decisions. Of concern for the future is that higher education campuses will look very
different from those of the past in terms of square footage actually needed. Chapman
recommended college and university stakeholders challenge and evaluate proposed
changes in campus square footage given the prediction of reduced student populations in
the future. With a projected decline in the number of potential students and growing

63
online enrollment, square footage needs require recalculation based on empirical data and
strategic planning (Chapman, 2012). Out of concern for the planning process and space
usage, Blanchette (2012) developed four recommendations for space management
decision-making:
1. Develop a protocol for requesting space.
2. Delegate decision-making authority.
3. Ensure delegates have complete knowledge of and commitment to
institutional priorities.
4. Develop and maintain quantitative and qualitative data on space. (p. 68)
Concern for the proper planning of college campuses was expressed in a
conference of university associations held in 2012 called Physical Place on Campus: A
Summit on Community (Rullman & Van Den Kieboom, 2012). Rullman and Van Den
Kieboom (2012) reported the primary concern in this summit was the importance of
exploring whether physical spaces are making appropriate contributions to the colleges’
learning and civic goals, emphasizing the college campus should be a place to receive a
well-rounded education through community in spaces that allowed it to be possible.
They noted, “…campus planning too often occurs within the management silos of a
typical college administrative structure, one which more likely reflects staff reporting
lines than the interconnectedness of the student experience” (p. 179).
The summit supported the perspective of architectural probabilism—behavior is
not predictable—but it is possible to enhance behavioral responses through thoughtful
design. The bureaucracy of higher education has focused more on efficiency and
productivity than on the student experience and, as a result, students have found their

64
own forms of community away from the college but without the potential to enhance
learning (Rullman & Van Den Kieboom, 2012). Facility planning and design must
improve to allow the college to recommit to this role. Institutional leadership for
facilities planning must be familiar with the research on community and place to achieve
places for learning and engagement. Rullman and Van Den Kieboom (2012) stated, “As
the world becomes flatter, funding becomes tighter, and the national narrative becomes
more challenging, higher education simply must do more to ensure an intentional link
between what it does, what is learned, and what society needs” (p. 190).
Summary of the Literature
This literature review presented information that should be considered when
evaluating the impact of campus facilities on student perceptions of colleges and
universities, and how those perceptions have related to recruitment over the past several
decades. New generations are now enrolled, and enrolling, in college. The Millennials
have different needs, abilities, and desires from previous generations, as does the next
cohort, Generation Z. Their characteristics must be taken into consideration when
operating, maintaining, and building facilities for their use. Table 2 provides
characteristics of potential student generations currently enrolling, or soon to be
enrolling, in institutions of higher education.
Institutions are now seeing the next generation of students, Generation Z, entering
their halls. As can be inferred from Table 2, differences must be expected and planned
for, with the coming generation recognizing, as Dimock (2018) pointed out, that this
newest generation is still young and many specific characteristics are yet to be identified.

65
Determining their specific characteristics will be an ongoing task and an important topic
to follow for campus planners as they move into the next generation of students.
As times and people have changed, the higher education institution has had to
adjust. With each different generation, colleges have worked to meet their needs in
academic programs, student activities, and in facilities. Colleges have come to realize the
importance of the type and quality of the facilities offered in relation to recruitment and
retention. The challenge though, is in determining what specific facilities are most
important to current students, their perceptions, and their decisions to enroll.

66
Table 2
Comparison of Generations Currently Enrolling: Baby Boomers through Generation Z
Parameter Baby Boomers Generation X Millennials Generation Z
Birth Years 1946 - 1964 1965 - 1980 1981 - 2000 After 2000
Current Age 54 - 72 38 - 53 18 - 37 0 - 17
% of 2017
Population 15% 20% 27% 32%
Influences Television
Vietnam
Civil rights
Cold War
Watergate
Space race
Divorce
Sexual revolution
Woodstock
Independent
Challenge
authority
Computers
HIV/AIDS
MTV
Energy crisis
Global competition
Divorce
Collapse of communism
Dual income families
Latchkey kids
Job instability
Digital Media/
Internet
School
shootings
Terrorism
Children of divorce
Sheltered as children
Economic expansion
Kept busy as kids
Children with
schedules
Continuous
technology
Iraq/ Afghanistan
First U.S. President of color
War on Terror
School & other shootings
Bullying
International espionage
Political unrest
Great Recession
Characteristics Independent
Challenge authority
Entitled
Team-oriented
Optimistic
Ambitious
Diligent
Insecure
Diverse
Cynicism
Work to live
Adaptable
Desire independence
Confident
Narcissistic
Depressed
Reject social norms
Anxious/ Sensitive/ Limited self-control
Less obligation to employer
Loyal Thoughtful
Compassionate
Open-minded
Responsible
Career-minded
Multi-taskers
(continued)
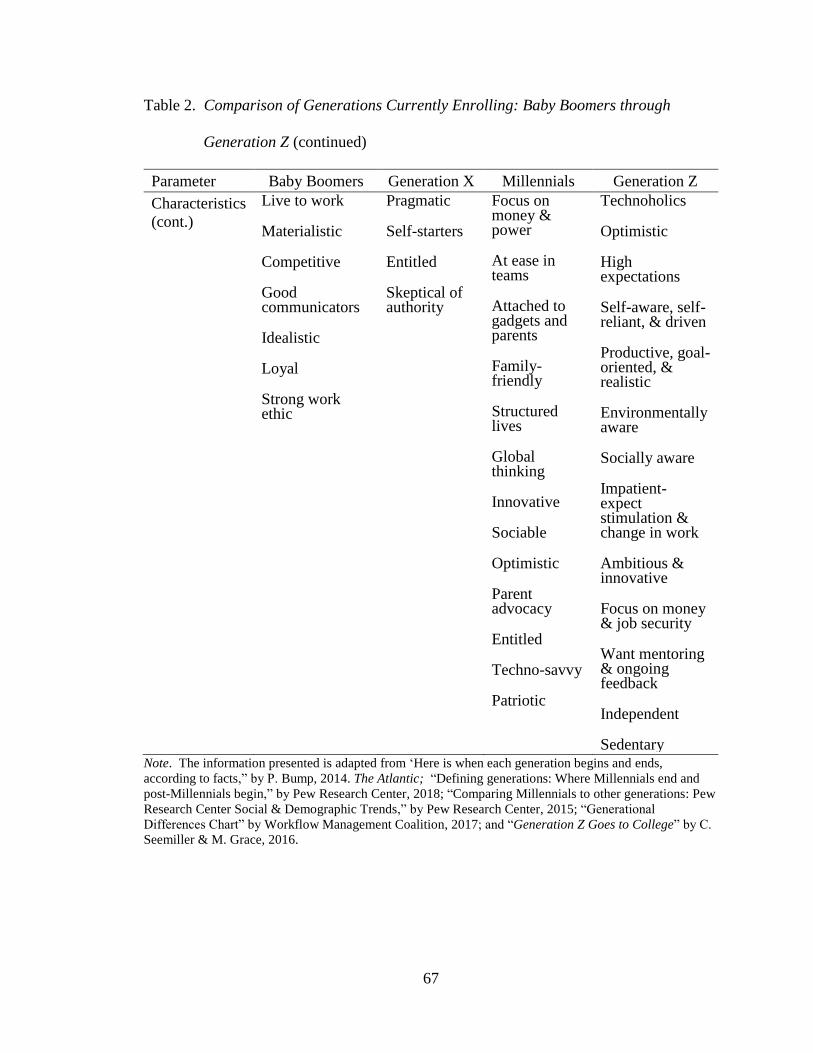
67
Table 2. Comparison of Generations Currently Enrolling: Baby Boomers through
Generation Z (continued)
Parameter Baby Boomers Generation X Millennials Generation Z
Characteristics
(cont.)
Live to work
Materialistic
Competitive
Good communicators
Idealistic
Loyal
Strong work ethic
Pragmatic
Self-starters
Entitled
Skeptical of authority
Focus on money & power
At ease in teams
Attached to gadgets and parents
Family- friendly
Structured lives
Global thinking
Innovative
Sociable
Optimistic
Parent advocacy
Entitled
Techno-savvy
Patriotic
Technoholics
Optimistic
High expectations
Self-aware, self-reliant, & driven
Productive, goal-oriented, & realistic
Environmentally aware
Socially aware
Impatient- expect stimulation & change in work
Ambitious & innovative
Focus on money & job security
Want mentoring & ongoing feedback
Independent
Sedentary Note. The information presented is adapted from ‘Here is when each generation begins and ends,
according to facts,” by P. Bump, 2014. The Atlantic; “Defining generations: Where Millennials end and
post-Millennials begin,” by Pew Research Center, 2018; “Comparing Millennials to other generations: Pew
Research Center Social & Demographic Trends,” by Pew Research Center, 2015; “Generational
Differences Chart” by Workflow Management Coalition, 2017; and “Generation Z Goes to College” by C.
Seemiller & M. Grace, 2016.

68
Many changes have been made over the years in college facilities in response to
changes in generational characteristics. The Carnegie Foundation for the Advancement
of Teaching (1986) completed a study of 1,000 high school seniors to gather information
on what affected their college choices. The Generation X students surveyed during that
1984 study ranked campus visits as the most important source of information in making
decisions. Students surveyed in the Carnegie study said the visits allowed them to talk
with students, see buildings, and get a feel for the campus. Sixty-two percent of the
students noted the appearance of the buildings and grounds was most influential. One
interesting piece of information from the study was that only about 28% of the students
surveyed utilized “computerized college information” in their decision process.
The Carnegie (1986) study of Generation X students provided contrast to the
study presented by Reynolds and Valcik in 2007 of early Millennial students. That report
stated that 66.9% of the 13,782 U.S. students involved ranked the “overall quality of
campus facilities” as essential or very important (p. 66). This factor fell behind “strong
major in field of interest” (79.6%), “excellent teachers” (78.8%), “preparation for a
career” (77.7%), “accessible professors” (71.8%), and “customizable education” (71.6%)
(Reynolds and Valcik, 2007, p. 66). The most important facilities noted in this study
were those for their major, the library, residential facilities, technology, and classrooms.
This study also found a well-maintained facility is important to students even to the point
of rejecting an institution if it is poorly maintained (Reynolds and Valcik, 2007). Today,
seeing the campus up close and personal is still important. Students develop their
feelings about the campus based on aesthetics and their interpretations of community as
they observe during campus visits (Okerson, 2016)

69
This information gathered on college student preferences stresses the necessity for
colleges to stay in touch with the changing needs and desires of students and work to
provide for those needs. Regular evaluations of student characteristics and preferences
are necessary in making these types of decisions. By studying student responses to
questions regarding their needs and desires, conclusions can be drawn that provide
direction for college administrators for future planning.
Beyond the needs and desires of the students, however, administrators also must
consider the objectives of the university as a whole as outlined by their strategic plan.
Facilities construction, improvements, and expansions must be considered in light of the
stated mission and developed cooperatively with all stakeholders, faculty, staff, and
students. Additionally, colleges and universities must evaluate all options to provide
optimum utilization of facilities to obtain the best ROI. As suggested in the Sightlines
2018 State of Facilities in Higher Education report:
By proactively engaging campus constituents, facilities organizations can tell their
story regarding resource constraints, understand what is most important to their
customers, and involve the campus community in decisions around resource
tradeoffs. This won’t make the decisions any easier, but the transparency can
create institutional alignment and ultimately increase the general satisfaction with
the decisions that are made. (p. 8)
70
CHAPTER III: METHODOLOGY
Introduction
This research effort was a mixed-methods study looking to answer two questions:
What type of facilities are most important to you in choosing a college? and How can
college leadership enhance recruitment efforts of current and future generations through
the facilities offered?
A survey instrument was developed to determine which specific aspects are more,
or less, important to the prospective student. The expectation, based on previous studies,
was that students do in fact choose a college based, at least partially, upon the atmosphere
and quality of the facilities. But it also is foreseeable that students of the current
generation may place emphasis on different aspects of facilities than previous
generations.
Research Questions
The purpose of this study was to identify the institutional characteristics students
view as most influential when selecting a four-year college or university. The desired
outcome for this study was to present information that will provide college administrators
with supporting data helpful in making decisions regarding renovation and operations of
existing facilities, as well as in the planning for new facilities. To investigate this topic,
research questions were formulated:
1. What are the top considerations students view as being most influential in the
college selection process?
2. What campus facilities do students identify as being most important in the
college selection process?

71
3. What classroom features (i.e., windows, seating, colors) are most important to
students in the college selection process?
4. What common learning resources (i.e., computer availability, internet
availability, hard copy reference materials) are important to students in the
college selection process?
5. What technology features do students deem most important in the college
selection process?
6. Which facility’s characteristic is the primary reason students reject a college
in the selection process?
Study Design
For this study a sample of freshman students attending four-year universities was
utilized. Looking at preferences for the general population of freshmen was determined
to be more pragmatic than considering specific characteristics of the group. The
demographic considerations for this study included age, college size, and college type
(public or private).
This study was a Utilization-Focused Evaluation (UFE). The intent of the UFE is
to provide information of value to a specific group of stakeholders for use in
administration of an organization (Mertens & Wilson, 2012). In this case, the
information gathered was intended to be useful to college and university administrators,
from facilities operations personnel to presidents, and those involved in the designing and
planning for college campuses, such as architects and planners. Mertens and Wilson
(2012) presented information on three inquiry phases of an evaluation specifically for
learning organizations, as developed by Preskill and Torres (1999):

72
1. Focusing on the inquiry. For this study, the topic of concern was determining
what facilities have the most impact on students’ college selection.
2. Carrying out the inquiry. For the purposes of this study, the determination of
the design, methods, analysis, and interpretation related to the subject was
decided by the evaluator and advisors.
3. Applying learning. The intention of the evaluator was to provide adequate
generalizable information to be a basis for operations and planning decisions
at similar institutions.
In this study, the population was defined as freshman students attending four-year
universities. A sample was determined to allow for manageable yet generalizable results.
The sample was based on only four-year universities and colleges in Kentucky.
Clustered sampling was considered the method of choice for developing the sample
group for this study. Looking at all freshman classes in the 50 or so Kentucky public and
private colleges/universities could have been considered clustered. However, that size
sample would be difficult to manage; even using only the eight public universities would
have been difficult. Therefore, the study was limited by selecting only six of the colleges
and universities in the state: Western Kentucky University, The University of Kentucky,
Eastern Kentucky University, Morehead State University, Centre College, and
Georgetown College. The selected group provided a broad and comprehensive range in
regard to size and type of schools.
The survey instrument for this study was an online questionnaire that provided a
list of various options to each question that could be considered important to the student
in the college selection process. The list included many possible reasons for choosing a

73
particular institution, including options related specifically to facilities. Student
preference questions were developed in consideration of previous similar research with
the intent of providing comparisons to past generations of students. The survey also
included questions related to specific facility-related items such as colors, classroom
design, and furnishings. The student was prompted to select the appropriate options.
The survey instrument was made up of nine questions that were a combination of
a Likert rating scale and multiple choice. The Likert scale was used to measure the
importance of certain features on the student’s college selection. Other questions allowed
the student to choose those features they considered most desirable in the college
selection process. Students also were asked to indicate features that caused them to reject
a university. A copy of the survey is included as Appendix A. The survey, constructed
through Qualtrics, was initially distributed in March 2019.
Limitations and Delimitations
The study had the potential to be limited if response to the questionnaire was
inadequate. A small response could have caused the usefulness and generalizability to be
reduced. Although requests to complete the survey were sent to over 9,600 students at
the six universities, usable data were received from only 224. It was determined this
number would provide adequate data to develop conclusions regarding the subject based
on the distribution across all categories, as shown in Table 3.

74
Table 3
Distribution of Responses to Survey
University Size and Type
Birth year
Large public
university
Medium public
university
Small public
university
Small private
university
2000-2001 46 39 3 14
1998-1999 19 27 0 13
1988-1997 3 4 2 1
Pre-1988 1 1 0 1
Undisclosed 26 15 3 6
Total 95 86 8 35
Validity and Reliability
To assess the validity of the survey instrument, the questions were submitted to
panels of experts both from the administrative/recruitment aspect and the facilities/
operations aspect of higher education. Two groups reviewed questions related to the
most important factors relative to choosing or rejecting a college. Group 1 was made up
of four persons involved in admissions and recruitment at various Kentucky colleges.
Group 2 included six persons involved with facilities management and operations who
reviewed questions involving facility-related factors. The results of their reviews are
included in Tables 4 and 5.
Kappa values of 0.7 or above were considered sufficient for analysis. There was
some discrepancy between the two groups on Questions 1 and 2. However, the
determination was made that the birth year and type and size of institution, as asked in
these questions, would provide the desired demographic information to evaluate the data.
Also, the initial survey proposed, in Question 3, to ask students how many total colleges

75
they considered, and applied to, during the college selection process. Based on the
experts’ reviews, this question was removed from the survey instrument.
Table 4
Content Validity Index Results – Group 1 (4 experts)
# Question Kappa
Q1 What year were you born? 0.667
Q2 Indicate the type of institution in which you are enrolled. 0.200
Q3 How many total colleges did you consider, and apply to, during your
college selection process? 0.667
Q4 Select the most important factors you considered when choosing a
college. 1.000
Q10 How would you rank the importance of each facility element? 1.000
Q11 Select if you rejected the facility because… the facility was not present,
the facility was inadequate, the facility was not being maintained? 1.000
Overall 0.756
Upon review of the data for validity and the Kappa values obtained, the survey was
determined to be adequate and appropriate and would measure what was intended with
the modifications mentioned.

76
Table 5
Content Validity Index Results – Group 2 (6 experts)
# Question Kappa
Q1 What year were you born? 0.080
Q2 Indicate the type of institution in which you are enrolled. 0.816
Q3 How many total colleges did you consider, and apply to, during your
college selection process?
0.273
Q4 Select the most important factors you considered when choosing a
college.
1.000
Q5 Which is your primary method of study? 0.816
Q6 What were the top technology and other learning tools you considered
absolutely necessary for the college to provide for your college
experience?
0.816
Q7 Which classroom would you prefer? With or without windows? 0.816
Q8 Which color of classroom accent wall would you most prefer? Blue,
white, plum, or yellow?
0.816
Q9 Which classroom seating style would you prefer? Tables and chairs,
chairs with desks, rolling chairs with desks?
0.816
Q10 How would you rank the importance of each facility element? 1.000
Q11 Select if you rejected the facility because… the facility was not present,
the facility was inadequate, the facility was not being maintained?
1.000
Overall 0.750
Reliability of the survey instrument was confirmed using a test-retest process. A
freshman class of 24 students at Western Kentucky University was asked to complete a
paper version of the survey instrument. A week later, the same questions were
administered to the same class of students. Both times the students were asked for input
on the quality and clarity of the questions and the instrument itself. No problems or
difficulties were noted by the students. Kappa values were determined from the test-
retest results and are presented in Table 6.

77
During analysis of the test results from the first and second test, several questions
presented Kappa values that would be considered only fair to moderate in agreement
(0.2-0.6), but were determined to be adequate for the survey as they related to previous
studies, as well as provided useful information for college administrators and facilities
managers. There also were a few low Kappa values (< 0.2), exhibiting low confidence in
the question, which required modification.
1. The question regarding classroom colors had a typographical error that caused
confusion and some students only chose one color, causing an error in the
Kappa calculation (Question 12). The typographical error was corrected in
the final version of the survey.
2. The list included classrooms (Question 16) and the library (Question 17), both
of which provided low Kappa values. Upon consideration, these facilities
remained unchanged in the final survey due to their direct correlation to
earlier similar studies.
3. The list of facilities used in the survey originally included a visual arts center
(Question 18). Since the test-retest did not show significant agreement, the
visual arts center was removed from the instrument.
4. The initial survey instrument separated open space between indoor and
outdoor space (Questions 23 and 24). Since the test-retest data showed little
significance separately, the two were combined into one item, open space—
multipurpose for community and group activity.

78
5. Similar to Item 4, student recreation and student exercise facilities (Questions
25 and 26) showed little significance separately so were combined into one
item.
6. Biking/hiking trails (Question 29) were originally included in the list of
facilities but were removed when little significance was shown in the test-
retest results.
Table 6
Test-Retest Results
# Question Kappa
6 Which is your primary method of study? (Q5) 0.276
10 Which classroom would you prefer? With or without windows? (Q7) 0.640
11 Which color of classroom accent wall would you most prefer?
Choose two: Blue, white, plum, or yellow? (Q8)
0.674
12 Which color of classroom accent wall would you most prefer?
Choose two: Blue, white, plum, or yellow? (Q8)
0.000
13 Which classroom seating style would you prefer? Tables and chairs,
chairs with desks, rolling chairs with desks? (Q9)
0.697
14 Ranking (Q10) – Facilities for my major 0.302
15 Ranking (Q10) – Technology 0.259
16 Ranking (Q10) – Classrooms 0.063
17 Ranking (Q10) – Library 0.171
18 Ranking (Q10) – Visual arts center -0.010
19 Ranking (Q10) – Performing arts center 0.420
20 Ranking (Q10) – Residence halls 0.309
21 Ranking (Q10) – Dining Facilities 0.595
22 Ranking (Q10) – Student center 0.340
23 Ranking (Q10) – Open space – indoor 0.041
(continued)

79
Table 6. Test-Retest Results (continued)
# Question Kappa
24 Ranking (Q10) – Open space – outdoor 0.123
25 Ranking (Q10) – Student recreation facilities 0.045
26 Ranking (Q10) – Student exercise facilities 0.102
27 Ranking (Q10) – Varsity athletic facilities 0.197
28 Ranking (Q10) – Intramural sports facilities 0.417
29 Ranking (Q10) – Biking/hiking trails 0.185
30 Ranking (Q10) – Bookstore on campus 0.290
31 Ranking (Q10) – Public transportation 0.220
38 Rejected facility (Q11) – Residence halls 0.806
39 Rejected facility (Q11) – Dining Facilities 0.513
40 Rejected facility (Q11) – Student center 0.597
41 Rejected facility (Q11) – Open space – indoor 0.704
42 Rejected facility (Q11) – Open space – outdoor 0.692
43 Rejected facility (Q11) – Student recreation facilities 0.583
44 Rejected facility (Q11) – Student exercise facilities 0.674
45 Rejected facility (Q11) – Varsity athletic facilities 0.592
46 Rejected facility (Q11) – Intramural sports facilities 0.896
47 Rejected facility (Q11) – Biking/hiking trails 0.793
48 Rejected facility (Q11) – Bookstore on campus 0.685
49 Rejected facility (Q11) – Public transportation 0.688

80
CHAPTER IV: FINDINGS AND RESULTS
Introduction
With the desire to garner as many responses as possible, an e-mail requesting
participation was sent out to the entire freshman class of the six participating Kentucky
universities: Western Kentucky University, The University of Kentucky, Eastern
Kentucky University, Morehead State University, Centre College, and Georgetown
College. The initial e-mails were sent in March 2019, with additional follow-up e-mails
continuing through April 2019. The e-mail, sent to over 9,600 students, requested the
students’ participation in the study and provided a link to the Qualtrics website (see
Appendix B). Data were extracted from the Qualtrics website in May 2019 and indicated
374 students had responded to the survey. Of those 374 responses, 224 had completed
the survey.
Data Analysis
For this research study, separate analyses were conducted for quantitative and
qualitative components for the research questions (RQ) listed previously. The primary
goal of the study was to answer the following questions: What type of facilities are most
important to you in choosing a college? and How can college leadership enhance
recruitment efforts of current and future generations through the facilities offered?
Results
In evaluating the data obtained from the survey instrument, each question was
analyzed in terms of the related research question. In all cases, results were evaluated
relative to student age and college type and size.

81
In terms of age, of the 224 completed surveys, 174 students provided their birth
year. As Table 3 illustrates, the large majority of students, 89%, were born in 1999 and
2000 (based on those who reported their birth year).
When looking at college type and size, standard ranges were developed and
partnered with the colleges’ status as a public or private school. Size was divided into
those with enrollment greater than 25,000 being categorized as large, those between
10,000 and 25,000 being medium, and those less than 10,000 as small colleges. Based on
these criteria, the schools included in the survey were:
• Large Public Universities: University of Kentucky
• Medium Public Universities: Eastern Kentucky University, Western Kentucky
University
• Small Public Universities: Morehead State University
• Small Private Universities: Georgetown College, Centre College
The data indicated that 42% (95 students) were from the large university, 38% (86
students) from medium universities, 16% (35 students) from small private colleges, and
4% (8 students) from the small public university.
RQ1: What are the top considerations students view as being most influential in the
college selection process?
For RQ1, students were asked to select their top five most important factors for
choosing a college or university to attend. A list of 33 choices related to academics,
facilities, activities, and other college information that was provided. This list included
indoor and outdoor features of campus facilities.

82
Overall, the five most important factors were determined by ranking the
calculated percentages of students who selected the factor. The most important factors
chosen were: (a) a strong major in the field of interest; (b) location of institution—
nearness to home; (c) pleasant and attractive campus/surroundings; (d) location of
institution—city, state, etc.; and (e) preparation for a career (see Figure 1). A comparison
of influential factors based on birth year and college type can be found in Appendix C.
Those factors determined to be least important were calculated similarly and all garnered
less than 5% of the student selections. They included biking/hiking trails (0.4%),
sophisticated technology (2.2%), availability of intramural sports activities (2.7%),
bookstore on campus (3.1%), visual and/or performing arts center (3.6%), open space—
multipurpose for community (3.6%), availability of public transportation (4.0%),
excellent academic advising (4.5%), student recreation facilities (4.9%), and student
exercise facilities (4.9%).
When looking back at the results of the 2007 study by Reynolds and Valcik, many
similarities were apparent. Having a strong major in the student’s field of interest was
the most influential factor, but location has become more significant for this generation.
Excellent teachers, preparation for a career, and accessible professors were in the top 10,
but at slightly lower levels of significance. One interesting finding in these results related
to small, private colleges. While the top 10 factors remained very similar, academic
resources seemed to play a more significant role. Excellent teachers, accessible
professors, and challenging courses ranked higher at the small, private colleges (refer to
Appendix C for more information).

83
While overall quality of the facilities was within the top 10, having an attractive
campus has moved up in the rankings since the Reynolds and Valcik study in 2007.
Recommendations from friends or family also has moved into the top 10 within that time
frame. These findings are consistent with generational information that indicates the
current generation of students tends to be more family-oriented, are concerned with
comfort and security, and consider college a necessary step in their path to a productive
career.
This analysis also gauged those items students considered the least significant. A
decade ago (Reynolds and Valcik, 2007) the availability of intramural sports activities
and visual and/or performing arts centers was low on the list of significant items and still
is. Those dropping in significance since the Reynolds and Valcik survey in 2007 include
sophisticated technology, a bookstore on campus, open space, student exercise facilities,
and student recreation facilities.
Figure 1. Top five most influential factors for college selection. The most influential
factors were determined by ranking the percentage of students who chose each particular
factor. The question was answered by 224 students (n = 224).
28.1
37.9
39.7
41.1
57.1
Preparation for a career
Location of institution(City, State, etc.)
Pleasant & attractivecampus/facilities
Location of institution(nearness to home)
Strong major in field ofinterest
Percentage of Students Responding

84
RQ2: What campus facilities do students identify as being most important in the
college selection process?
To identify the most important campus facilities for RQ2, students were asked to
rate a list of 14 common university facilities. The list included the following:
• Facilities for my major
• Technology
• Classrooms
• Library
• Residence halls
• Performing arts center
• Dining facilities
• Student center
• Open space—multipurpose for community and group activity
• Student recreation/exercise facilities
• Varsity athletic facilities
• Intramural sports facilities
• Bookstore on campus
• Public transportation
Looking more closely at the significance of facilities, students were asked to rank the list
on a Likert scale from 1 to 5 (1 = Very Unimportant, 2 = Unimportant, 3 = Somewhat
Important, 4 = Important, 5 = Very Important).
A simple evaluation of the data revealed “Facilities for my major” was ranked as
somewhat important, important, or very important by 94.5% of students responding.

85
This factor was followed by “Technology,” “Residence halls,” “Classrooms,” “Dining
facilities,” and “Library” all ranking as somewhat important, important, or very important
by over 85% of the students. Table 7 presents a ranking of the 14 facilities based upon
the mean of the chosen values.
In comparing this significant facilities list to that of Reynolds and Valcik (2007),
dining facilities have moved up and displaced exercise facilities in terms of ranking. This
finding, having quality dining facilities on campus, may be in response to current
students’ concerns for security by staying in the closer and safer campus surroundings.
Table 7
Rank Order of Student Ratings of Facilities’ Importance
Facility Mean
No. of students
responding (n)
Facilities for my major 4.4 219
Technology 4.1 218
Residence halls 3.9 218
Classrooms 3.8 219
Dining facilities 3.8 218
Library 3.7 217
Recreation/exercise facilities 3.6 218
Student center 3.5 216
Open space 3.5 217
Public transportation 3.3 216
Bookstore on campus 3.3 217
Varsity athletic facilities 2.7 217
Intramural sports facilities 2.5 216
Performing arts center 2.4 217
Additional analyses indicated (as found in Appendix D) three overall factors
affect a student’s evaluation of a university: academic-related facilities, student living
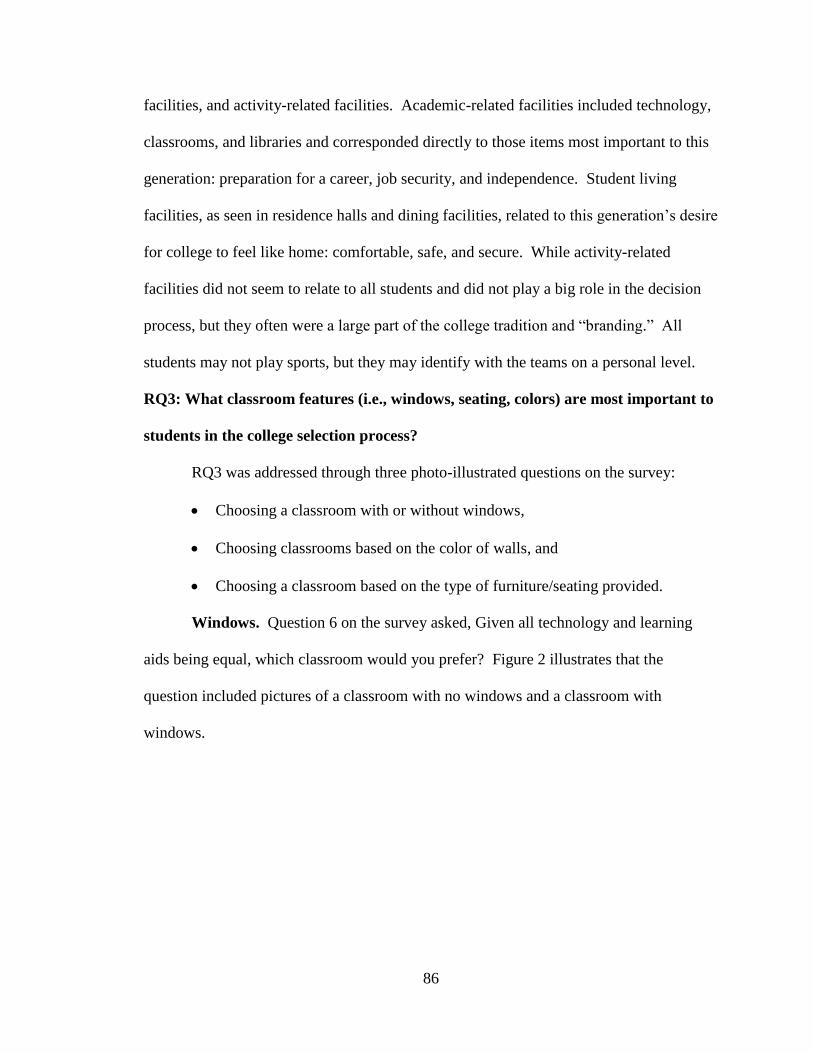
86
facilities, and activity-related facilities. Academic-related facilities included technology,
classrooms, and libraries and corresponded directly to those items most important to this
generation: preparation for a career, job security, and independence. Student living
facilities, as seen in residence halls and dining facilities, related to this generation’s desire
for college to feel like home: comfortable, safe, and secure. While activity-related
facilities did not seem to relate to all students and did not play a big role in the decision
process, but they often were a large part of the college tradition and “branding.” All
students may not play sports, but they may identify with the teams on a personal level.
RQ3: What classroom features (i.e., windows, seating, colors) are most important to
students in the college selection process?
RQ3 was addressed through three photo-illustrated questions on the survey:
• Choosing a classroom with or without windows,
• Choosing classrooms based on the color of walls, and
• Choosing a classroom based on the type of furniture/seating provided.
Windows. Question 6 on the survey asked, Given all technology and learning
aids being equal, which classroom would you prefer? Figure 2 illustrates that the
question included pictures of a classroom with no windows and a classroom with
windows.

87
Figure 2. Survey illustration for preference related to classroom windows. Shown is a
classroom without windows and a classroom with windows.
Results for the question regarding windows revealed a strong preference to having
windows in the classroom, as illustrated in Figure 3. A complete comparison of these
results can be found in Appendix C.
Figure 3. Student preference related to the presence of windows in the classroom. The
preference for having windows in the classroom was determined by comparing the
percentage of students who did, or did not, want windows. The question was answered
by 223 students (n = 223).
This finding is in agreement with previous studies as reported in the literature that
express students’ preference for windows and that windows have a positive impact on
88.3
11.7
Windows No windows
Percentage of Students Responding
Classroom with no windows Classroom with windows

88
student success. Direct sunlight was said to provide a warm and friendly atmosphere.
And Lei (2010) noted that well-lit rooms were conducive to active learning.
Color. Survey Question 7 asked, Given all technology and learning aids being
equal, which two classrooms would you most prefer? The illustrations provided pictures
of a classroom with a blue accent wall, a classroom with all white walls, a classroom with
a plum accent wall, and a classroom with a yellow accent wall as shown in Figure 4. The
blue and plum colors were similar to those cool colors found by Wang (2003) to be most
preferred. The white color was chosen as representative of many current, monotone,
neutral classrooms. And the yellow color was presented as a warm color choice that is
said to stimulate brain activity.
In selecting color preferences overall, well over half of the students preferred the
blue color (58.5%), with the next most preferred color being white, at 39.3%, as shown in
Figure 5. A comparison of the results for color preferences can be found in Appendix C.

89
Figure 4. Survey illustration for preference related to classroom wall color. The four
pictures present a classroom with an accent wall color of either blue, white, plum, or
yellow.
Figure 5. Student preference related to classroom wall colors. The preference for the
color of an accent wall in a classroom was determined by comparing the percentage of
students who chose the different colors presented: blue, white, plum, or yellow. The
question was answered by 223 students (n = 223).
58.7
39.5
26.5 25.6
Blue White Plum Yellow
Percentage of All Students Responding
Classroom - blue Classroom - plum Classroom – white Classroom - yellow

90
Herzog and Valcik (2007), Lei (2010), and Kurt and Osueke (2014) reported
colors in the classroom can have a psychological impact on student behavior, learning,
and success. Lei went on to say light colors have a calming effect, bright colors have a
gloomy effect, and multiple-color patterns facilitate pondering/thinking during class time.
Kurt and Osueke found more color was shown to affect moderate arousal and increase
memory retention. However, the use of large areas of white was considered boring and
uninteresting. The study recommended balancing complexity and unity avoiding large,
one-color areas (Kurt & Osueke, 2014). Wang’s study in 2003 indicated student wall
color preferences in the “cool color” palette (blues and violets). This finding was
consistent with the findings of the current study, as blue is the favored color choice.
The current study did not survey students for color preferences related to other
areas outside of classrooms, but the importance of the emotional impact of colors should
be taken into consideration based on the activities planned for the spaces. Fabris (2014)
suggested the use of non-neutral colors in community areas and Nugent (2012), likewise,
recommended the use of moderate amounts of inviting colors. Kurt and Osueke (2014)
recommended these environments should include colors in changing hue, saturation and
brightness, and changing temperatures. They recommended the use of warm and cool
colors with a complement of the dominant color to a degree.
Furniture. Survey Question 8 asked, Given all technology and learning aids
being equal, which classroom seating styles do you prefer? The illustrations for this
question, as seen in Figure 6, were pictures of tables and chairs, chairs with desks, and
rolling chairs with desks.

91
In rating classroom furniture preferences, the results showed that, overall,
students preferred the rolling chairs with desks with tables and chairs coming in at a close
second as shown in Figure 7. Less than 10% of students showed a preference to the “old
style” of chairs with attached desks. A full comparison of these results can be found in
Appendix C.
Many researchers; including Kent (2009), Veltri et al. (2006), McLaughlin &
Faulkner (2012), Fabris (2012), and Weber-Bezich (2014) agreed students need
furnishings that allow for group interaction and creativity in keeping with newer
pedagogical methods. Traditional classrooms with straight rows and chairs facing
forward are not conducive to student interaction, teamwork, or developing interpersonal
skills (Kent, 2009). Easily movable furniture allows students to enjoy a more
participatory, informal learning environment with relaxed, informal physical facilities
where they can meet, discuss, and learn from one another (McLaughlin & Faulkner,
2012). This desire is reflected in the results of the current study.

92
Figure 6. Survey illustration for preference related to classroom seating styles. The
pictures provide images of classrooms with different student furniture: tables with chairs,
chairs with desks, and rolling chairs with desks.
Figure 7. Student preferences related to classroom furniture. The preference for type of
furniture in a classroom was determined by comparing the percentage of students who
chose one of the three options. The question was answered by 221 students (n = 221).
45.2
8.1
46.6
Tables and Chairs
Chairs with Desks
Rolling Chairs with Desks
Percentage of All Students Responding
Tables and chairs Chairs with desks Rolling chairs with desks

93
RQ4: What common learning resources (i.e., computer availability, internet
availability, hardcopy reference materials) are important to students in the college
selection process?
To determine students’ preferences related to study resources, the survey asked
whether students used:
• Books, paper, and pen for reference, taking notes, and study
• Computer for reference, but paper and pen for taking notes and study
• Electronic equipment used only for reference, taking notes, and study
This question was developed to discern just how much current students rely on electronic
equipment versus hardcopy study materials and physically writing out information as
these preferences can have a bearing on facilities and technology design. As students
evaluate the various facilities within the campus, how they learn and study may be part of
the consideration process. If using only a laptop or tablet, the student requires much less
desktop space but needs quality WiFi access and most likely an electrical power source.
The student using only books, pens, and paper needs a place to spread out their materials,
and little else. By far, the most common answer was using the computer for reference but
still using pen and paper for taking notes and studying. In this case the student requires
not only a larger desktop area, but also WiFi access and a power source. This
information has implications in classroom design as well as the design of other facilities
like libraries, residence halls, and other common areas. Figure 8 presents the results for
this question. A complete comparison of the results can be found in Appendix C.

94
Figure 8. Student preferences related to learning resources. The preference for type of
learning resources was determined by comparing the percentage of students who chose
one of the three options. The question was answered by 222 students (n = 222).
RQ5: What technology features do students deem most important in the college
selection process?
RQ5 was addressed through a question on the survey allowing students to select
their top three preferred technology and learning tools. Fifteen choices of common
technology and learning aids were provided. As illustrated in Figure 9, of the 15 choices,
having WiFi in campus buildings was by far the most desired. Following at a distant
second and third were having student-accessible printers situated around campus and
having WiFi in all outdoor spaces. Those items in which students showed the least
interest were having video-only projection equipment in classrooms and having a
“smartboard” in classrooms. Refer to Figure 9 for all rankings and to Appendix C for
more detailed information related to these preferences.
9.9
76.1
14.0
I use only my book, paper, and pen forreference, taking notes, and study
I use my computer for reference, butpaper and pen for taking notes and study
I use only electronic equipment for takingnotes and study
Percentage of All Students Responding

95
Figure 9. Top five most important technology features. The most important technology-
related factors were determined by ranking the percentage of students who chose each
particular factor. The question was answered by 221 students (n = 221).
RQ6: What facilities’ element is the primary reason students reject a college in the
selection process?
For this final research question, RQ6, students were asked to consider the 14
common campus facilities and to relate whether they were the cause of a decision to
reject the college from consideration. If the particular facility had been a cause for
rejection of a university, the student could specify whether the rejection was because they
did not have the facility, the facility was inadequate, or it was poorly maintained.
The most common reason students reported rejecting a school from consideration
was related to the facilities for their major; primarily either the college did not have the
facility or the college’s facility was not considered adequate. Following as a close
second were residence halls. In this case, students rejected the university primarily
because the residence halls were considered inadequate or were poorly maintained.
Inadequate and/or poorly maintained technology and dining facilities also ranked high as
12.2
12.2
15.4
37.1
42.1
90.0
Centralized student printing
Hardcopy handouts in classes
Computer connected projectionequipment in classroom
WiFi in outdoor areas
Student-access printers atlocations around campus
WiFi in all buildings
Percentage of All Students Responding

96
reasons for rejecting a university. Those facilities having the least impact on rejections
were performing arts centers, intramural sports facilities, and bookstores on campus.
Table 8 presents the list of the 14 campus facilities and information related to them being
cause for rejection of an institution.
Table 8
Comparison of Causes of Rejection of an Institution
Total number
of rejections
Number of Rejections Caused by:
Facility
Not having
the facility
Inadequate
facility
Poorly
maintained
facility
Facilities for my major 137 55 55 27
Residence hall 132 12 63 57
Technology 88 18 48 22
Dining facilities 81 13 42 26
Classrooms 80 10 36 34
Public transportation 79 27 35 17
Recreation/exercise facilities 75 16 31 28
Library 72 15 39 18
Student center 72 18 34 20
Open space-multipurpose 71 13 39 19
Varsity athletic facilities 70 17 32 21
Bookstore on campus 66 13 32 21
Performing arts center 63 13 30 20
Intramural sports facilities 59 14 30 15

97
CHAPTER V: DISCUSSION, CONCLUSIONS, AND RECOMMENDATIONS
Introduction
The primary goal of this research study was to answer the question, What type of
facilities are most important to you in choosing a college?, as well as to provide insights
for the question, How can college leadership enhance recruitment efforts of current and
future generations through the facilities offered?
Significant Facilities
Each of the research questions and their corresponding questions on the survey
instrument were developed to provide insight into what facilities are of most importance
to current and future students of higher education. With this information, efforts in
recruitment and facilities management can be focused more directly on those areas of
most impact.
Students were first asked what aspects of the university were the most significant
as they were making decisions. The responses indicated a strong major in their field of
interest, the location of the institution (nearness to home), pleasant and attractive
campus/surroundings, the location of the institution (city, state, etc.), and their
preparation for a career were of greatest significance.
In looking at previous studies and making comparisons, the significance of the
location of the institution has seemed to fluctuate over time. Chapman (1981) reported
that over 50% of freshmen attended a college within 50 miles of home. In 2007,
Reynolds and Valcik reported the location of the institution was an important
consideration. In this current study, location was one of the most important, at least at
the public universities surveyed. Nearly 64% of the responding students noted the

98
location of the institution as important. However, consistent with an earlier study by
Choy et al. (1998), private college students ranked location as less significant, with only
40% selecting it as important.
In an additional step, students were asked to rate specific campus facilities. The
analysis of the rankings revealed students considered facilities related to academic
resources (technology, classrooms, and library) and student living arrangements
(residence halls and dining facilities) as being most important. The findings were
confirmed by additional responses in which students were asked what facilities caused
them to reject a college from further consideration. The lack of facilities for the students’
major, or those facilities being inadequate, were the primary causes for rejection of a
college. Inadequate or poorly maintained residence halls were also indicated as causes
for rejection as were technology and dining facilities. This information is fairly
consistent with that reported by Reynolds and Valcik in 2007.
The data also provided insight into those facilities that were not particularly
significant to students: a performing arts center, intramural sports facilities and varsity
athletic facilities. To a lesser extent, a bookstore on campus and the availability of public
transportation were not ranked as important.
Five questions in the survey asked for preferences on specific design-/planning-
related items: classroom windows, colors, classroom furniture, technology, and learning
aids. Students’ responses revealed that:
• Classrooms with windows are preferred by students over those without
windows.
• Blue is a preferred accent color in classrooms.

99
• Flexible and easily movable furniture is preferred over more traditional
classroom furnishings.
• The majority of students utilize electronic equipment for reference and
document preparation but still prefer pen, paper, and hardcopy reference
materials for taking notes and study.
• The availability of WiFi on campus, particularly in all buildings, is by far the
most important technology required by students. Also, the need for having
student-accessible printers located around the campus is significant.
Enhancing Recruitment Through the Facilities Offered
Leaders in higher education must recognize the impact of facilities on recruitment
efforts. As Hoover (2010b) said, “Looks matter a lot to the beholder, and first
impressions do much to shape future action” (p. 37). Making an impression is more than
just making sure the floor is shiny and the grass is cut. Recruitment is not affected by
just the housekeeping and maintenance of the facilities. Planning, design, and operations
endeavors also must take the needs and desires of potential students into consideration.
These endeavors are a group effort, often impacting many divisions of the university on a
nearly daily basis. Each institutional person must recognize the goal of facilities is to
support the primary mission of the university, which is to provide a quality education.
Facilities should provide a place that encourages and empowers the institution as a whole
to ensure that goal.
Facilities Operations and Management
In 1987, Kealy and Rockel reported the most significant recruitment effort is the
college visit not necessarily a tour, but a chance to experience the campus. Ruffalo Noel

100
Levitz (2017) suggested open houses and campus visit days, including overnights and
weekend days, are very effective recruitment efforts. Whatever method is chosen, when
a prospective new student arrives on the college campus, they want to see those areas of
campus that are most significant in their decision-making process:
• Facilities for their major
• Classrooms
• Libraries
• Residence halls
• Dining facilities
Since WiFi availability was shown to be of high importance, it can be expected that they
will try it out to see how well it works while they are on campus.
They want to see clean and sparkling hallways, rooms, offices, and restrooms.
They are not impressed by Out of Order or Temporarily Closed signs, overflowing trash
cans, or weeds rather than blooms in the flower beds. These examples illustrate the
impact of nonverbal communication and that the “nonverbal messages are often seen as
more truthful than verbal or written messages” (Strange & Banning, 2001, p. 17).
Facilities personnel and college leadership must constantly be looking through “new
eyes” at their surroundings for items that could send the wrong message to prospective
students.
In this current study, 67% of the respondents reported pleasant and attractive
campus/surroundings and the overall quality of the campus facilities are important factors
when making their college selection. Students desire more than just a clean and properly
working facility; all facilities must be considered “adequate” in their eyes. They will

101
reject a college from consideration if they are not. The term “adequate” to this generation
of students may not have the same connotations as it did for university administrators
who attended college many years ago. Current students expect colleges to offer the same
safe, secure, and comfortable surroundings they experience at home (Twenge, 2017).
College leadership must remain abreast of these expectations (through routine surveys
and research studies) and include them in a university-wide continuous improvement
program.
A continuous improvement program is a recommended ongoing process for
keeping facilities up to date and attractive to prospective students. This program includes
routine updates and improvements, as well as serving as a basis for determining more
extensive renovations or enhancements that would be presented in a facilities
improvement plan.
Also highly recommended was the facilities improvement plan, or what Kaiser
and Klein (2010) referred to as a Capital Development Plan. This plan takes an in-depth
look at all college facilities: their history, condition, and needs. It is a research document
that compiles information which is then analyzed and evaluated to ultimately develop a
priority list of repairs, improvements, upgrades, additions, and deletions that are needed
over the next 5- to 10-year period, including taking related costs into consideration. At
this point, administrators might contemplate Boylan’s (2005) recommendations:
Do not assume the architects will know everything they need to know
about the particularities of the kinds of teaching and research done at the
present and planned for the future. Do not assume the faculty and staff
know what they need or what the options are. Do enough research so that

102
you know the questions to ask and how to maximize the likelihood that the
building or renovation will achieve its full potential. (p. 1)
In other words, get everyone involved: administrators, facilities operations managers,
academic representatives, information technology staff, students, architects, and
engineers. Each entity has their own viewpoint that should be taken into consideration
during the planning and design process. As Kaiser and Klein stated, “stewardship is a
fully shared institution-wide responsibility of the academic, research, and student affairs
leadership, along with the financial and facilities leadership” (p. 24).
This study offers some specific facilities-related information that may be
beneficial during planning and design, as well as the day-to-day operations. These items
include:
• Students are most interested in the facilities related to their major. Make sure
these are easily identifiable and locatable so that they can examine them
during their visit. Wayfinding is important, both inside buildings and out.
Finding and observing the facilities should be easy for the student, particularly
those listed of greatest concern, as should be the case for all potential students
including those with special needs, i.e., vision impairment or mobility.
• Classrooms are an important facility during the college selection process.
They should be comfortable, have good accessibility to the instructor, and
offer flexibility. Easily movable furniture is suggested to serve a variety of
pedagogical methods and encourage interaction and creativity. Preferably, the
classrooms should have windows for natural light and be painted in light,
neutral colors with contrasting areas or patterns of cool colors (preferably a

103
blue, based on data from this survey and others) to enhance learning and
mood. Flexibility and adaptability should be primary considerations to
enhance utilization rates and ensure long-term usability.
• Libraries are still considered important to today’s students, not necessarily
because of reference materials available, but because they provide a place to
stretch out and work, whether it be alone or in a group. Areas should be
arranged for single students as well as for group activities, for casual sitting
and reading, and for spreading out on a table. Libraries also are places where
color comes into play, and their psychological and emotional impacts should
be taken into consideration using calm, relaxing tones with areas of contrast to
encourage the thought process.
• Residence halls and dining facilities are the students’ home-away-from-home,
and they want them to feel that way. Residence halls need to have user-
friendly kitchen and laundry facilities, preferably in close proximity to
gathering areas for small group activities. They also need to have small, well-
lit nook-type areas for reading and study. Comfort is important, so sitting
areas and rooms should be homey and relaxed. Dining facilities need to be
located near residential areas and have space available for group dinners as
well as quick single meals. Color also is important for both facilities and
should be chosen based on the activities associated with the specific area and
effect desired; bright, warm colors can have a positive impact in social areas.
Additionally, safety and security are of primary concern for students and their

104
parents. Items like security cameras, controlled access, and clear emergency
response information and equipment should be visible and readily accessible.
• Today’s students do not know a time without internet and smartphones. They
come to campus with multiple devices and are continuously connected. Few
students need access to a public computer as in a computer lab or library, but
high quality WiFi is absolutely necessary throughout the college campus.
Technology must be designed such that excellent service is provided to
students even when they are using a laptop, a tablet, and a phone
simultaneously. Ample electrical outlets also are a necessity for electronic
equipment, particularly in high device use areas. While the survey responses
indicated the majority of students continue to use pen and paper to take notes,
it is likely the need for additional power outlets in classrooms will be a
necessity for future designs.
Administration and Cooperation
While much of the information found in this study seems to be acknowledged by
administrators and managers of higher education institutions, the relationship between
facilities and recruitment also appears to be somewhat nebulous leaving some
disconnects in the processes related to facilities and recruitment. The survey allowed for
communication with various college staff who provided feedback for consideration as
well. For instance, the importance of residence halls and dining facilities is well-
recognized; of particular concern for colleges were older facilities that make recruiting
efforts more difficult when students are comparing colleges with brand new buildings.
However, the importance of the facilities being in good working order, attractive, and

105
clean is well-known. What may or may not have been recognized was which facilities
are most important to prospective students, where the primary focus should be on
facilities related to the students’ major, classrooms, libraries, residence halls, and dining
facilities. Taking into consideration that campus tours are not the only visits potential
students make to a campus, the facilities must be maintained on a daily basis, not only
during special events. Thus, at a time when universities are cutting budgets, inevitably
including maintenance and housekeeping in the cutbacks, more is being expected in order
to improve recruiting efforts. Budget constraints can only help to emphasize the
importance of cooperation, communication, and planning throughout the institution to
provide the best impression while keeping associated costs under control.
Surprisingly few of the college leadership reported any regular, ongoing efforts to
discuss expectations for and between facilities and recruitment staff. Most reported only
a work order system and a calendar of events for sharing plans. Often, little is shared
between the various divisions of the institutions and key information is lost. A routine
communication process between departments is recommended to present information on
recruitment and related issues, particularly to share feedback between all offices after
major events. In addition to observations shared between divisions, developing a short
student survey to identify items of concern may be advantageous. The survey could be
developed for students who are considering the college (i.e., those who have applied) to
gauge their judgment of quality, both academic and facilities-related. Of particular
interest would be those who do not select the college in order to see what facilities did
not meet their standards and why. Additionally, interdepartmental brainstorming sessions
to openly discuss how to best address the needs and problems that have been identified

106
are suggested. These ideas can then be used in developing a continuous improvement
program and facilities improvement plan as previously discussed.
A final recommendation, given the knowledge gained and shared, is that
universities must find ways to use all of their resources to their best advantage. As
Belfield and Thomas (2000) said, “how resources are used matters at least as much as
how many resources are available” (p. 250). Resources include not only monetary, but
human resources as well. In the recruitment effort, leadership would be wise to recognize
the value of its people, not only those hired to recruit new students, but all who serve the
students and their families on a daily basis. Interaction with students, visitors, faculty,
and staff is yet another area of interconnection between recruitment and facilities
operations. Facilities operations personnel often are the most visible people on campus
and quite possibly see the most as well. Leaders can use this knowledge base as they
communicate with others, encouraging collaboration and cooperation throughout the
campus. As students visit college campuses looking at the facilities and the academic
programs, they will take notice of those who work well together. That is the “feel” they
are looking for: a place where people are helpful, friendly, and welcoming. It feels like
home.

107
REFERENCES
Agron, J. (1999). Making gains. American School & University, 71(8), 34a-34e.
Retrieved from https://saa-primo.hosted.exlibrisgroup.com/primo-
explore/fulldisplay?docid=TN_ericEJ583893&context=PC&vid=WESTKY&sear
ch_scope=default_scope&tab=default_tab&lang=en_US
Agron, J. (2009). 38th annual maintenance & operations cost study for colleges. American
School & University, 81(9), 24-27. Retrieved from
https://saaprimo.hosted.exlibrisgroup.com/primo-explore/fulldisplay?docid=TN_
ericEJ862961&context=PC&vid=WESTKY&search_scope=default_scope&tab=
default_tab&lang=en_US
Alexander, K. S., & Eckland, B. K. (1976). High school context, college quality, and
educational attainment: institutional constraints in educational stratification,
Report No. 214. Baltimore: Center for Social Organization of Schools, Johns
Hopkins University.
Alexander, L., & Drumm, K. (2016). A master facilities planning process that focuses on
ROI. Planning for Higher Education Journal, 45(1), 2-12. Retrieved from
https://saa-primo.hosted.exlibrisgroup.com/primo-
explore/fulldisplay?docid=TN_gale_ofa484628910&context=PC&vid=WESTKY
&search_scope=default_scope&tab=default_tab&lang=en_US

108
Barista, D. (2008). The games students play (student recreation facility). Building Design
+ Construction, 49(2). Retrieved from https://saa-
primo.hosted.exlibrisgroup.com/primo-
explore/fulldisplay?docid=TN_gale_ofa174833749&context=PC&vid=WESTKY
&search_scope=default_scope&tab=default_tab&lang=en_US.
Belfield, C., & Thomas, H. (2000). The relationship between resources and performance
in further education colleges. Oxford Review of Education, 26(2), 239-253.
Retrieved from https://saa-primo.hosted.exlibrisgroup.com/primo-
explore/fulldisplay?docid=TN_tayfranc10.1080/713688524&context=PC&vid=W
ESTKY&search_scope=default_scope&tab=default_tab&lang=en_US
Blanchette, S. (2012). Space & power in the ivory tower: Effective space management
and decision making – what’s the problem and what’s the process? Planning for
Higher Education, 41(1), 64-74. Retrieved from https://saa-
primo.hosted.exlibrisgroup.com/primo-
explore/fulldisplay?docid=TN_proquest1519532578&context=PC&vid=WESTK
Y&search_scope=default_scope&tab=default_tab&lang=en_US
Blocher, E. J., Stout, D. E., & Cokins, G. (2010). Cost Management: A Strategic
Emphasis (5th Ed.). New York: McGraw-Hill/Irwin.
Boylan, E. (2005). Investing in facilities – The people and the planning process: The role
of the dean. Retrieved from Project Kaleidoscope website:
http://www.pkal.org/documents/FacilitiesPeopleAndPlanning.cfm
109
Bump, P. (2014). Here is when each generation begins and ends, according to facts. The
Atlantic. Retrieved from
https://www.theatlantic.com/national/archive/2014/03/here-is-when-each-
generation-begins-and-ends-according-to-facts/359589/
Bump, P. (2015, April 1). Your generational identity is a lie. Washingtonpost.com.
Retrieved from https://saa-primo.hosted. exlibrisgroup.com/primo-
explore/fulldisplay?docid=TN_gale_ofa429846703&context=PC&vid=WESTKY
&search_scope=default_scope&tab=default_tab&lang=en_US
Carnegie Foundation for the Advancement of Teaching. (1986). How do students choose
a college? Change, 18(1), 29-32. Retrieved from https://saa-
primo.hosted.exlibrisgroup.com/primo-
explore/fulldisplay?docid=TN_jstor_archive_640177614&context=PC&vid=WE
STKY&search_scope=default_scope&tab=default_tab&lang=en_US
Center for Facilities Research (CFaR). (2014). Leveraging facilities for institutional
success. APPA Thought Leaders Series 2014. Retrieved from
https://files.eric.ed.gov/fulltext/ED547779.pdf
Chapman, D. W. (1981). A model of student college choice. The Journal of Higher
Education, 52(5), 490-505. Retrieved from https://saa-
primo.hosted.exlibrisgroup.com/primo-
explore/fulldisplay?docid=TN_tayfranc10.1080/00221546.1981.11778120&conte
xt=PC&vid=WESTKY&search_scope=default_scope&tab=default_tab&lang=en
_US

110
Chapman, J. D. (2012). An investigation into the relationships between higher education
facility square footage and student enrollments, university endowments, and
student tuition (Doctoral dissertation). Available from ProQuest Dissertations &
Theses Global. (3512902). Retrieved from https://saa-
primo.hosted.exlibrisgroup.com/primo-
explore/fulldisplay?docid=TN_proquest1024414542&context=PC&vid=WESTK
Y&search_scope=default_scope&tab=default_tab&lang=en_US
Choy, S., Ottinger, C., Carroll, C., & National Center for Education Statistics. (1998).
Choosing a postsecondary institution (Statistical analysis report, National Center
for Education Statistics). Washington, DC: U.S. Dept. of Education, Office of
Educational Research and Improvement, National Center for Education Statistics.
Retrieved from https://saa-
primo.hosted.exlibrisgroup.com/primoexplore/fulldisplay?docid=WESTKY_AL
MA2189252710002637&context=L&vid=WESTKY&search_scope=default_sco
pe&tab=default_tab&lang=en_US
Closet-Crane, C., & Pickering-Thomas, N. (2009). (Re)creating the academic library as
place for the 21st century? A critical analysis of discourse in discussions of
academic library planning and design (Doctoral dissertation). Available from
ProQuest Dissertations & Theses Global. (3399158). Retrieved from
https://saaprimo.hosted.exlibrisgroup.com/ primo-
explore/fulldisplay?docid=TN_proquest205435199&context=PC&vid=WESTKY
&search_scope=default_scope&tab=default_tab&lang=en_US
111
Cyert, R. M., & March, J. G. (1963). College and university facilities survey, Part 3:
Inventory of college and university physical facilities, December 31, 1957, A
preliminary report. Washington, DC: U.S. Department of Health, Education, and
Welfare, Office of Education.
D'Angelo, S. (2017). Room for GROWTH: New classrooms flip traditional learning on
its head. Human Ecology, 45(1), 40. Retrieved from https://saa-
primo.hosted.exlibrisgroup.com/primo-
explore/fulldisplay?docid=TN_gale_hrca533409901&context=PC&vid=WESTK
Y&search_scope=default_scope&tab=default_tab&lang=en_US
Dimock, M. (2018). Defining generations: Where Millennials end and post-Millennials
begin. Pew Research Center Social & Demographic Trends. Retrieved from Pew
Research website: http://www.pewresearch.org/fact-tank/2018/03/01/defining-
generations-where-millennials-end-and-post-millennials-begin/
Dufresne, R. (2012). Understanding functional adequacy and facility condition for
strategic decision making. Facilities Manager, 28(6), 24-26. Retrieved from
http://www.appa.org/ files/FMArticles/Feature3_ND12.pdf
Eckert, E. (2012). Examining the environment: The development of a survey instrument
to assess student perceptions of the university outdoor physical campus (Doctoral
dissertation). Available from ProQuest Dissertations and Theses (3510753).
Retrieved from https://saa-primo.hosted.exlibrisgroup.com/primo-
explore/fulldisplay?docid=TN_proquest1019235613&context=PC&vid=WESTK
Y& search_scope=default_scope&tab=default_tab&lang=en_US

112
Editor-in-Chief. (2007). How facilities affect students' college choices. Building Design
+ Construction, 48(11), 9. Retrieved from https://saa-
primo.hosted.exlibrisgroup.com/primo-
explore/fulldisplay?docid=TN_gale_ofa168775103&context=PC&vid=WESTKY
&search_scope=default_scope&tab=default_tab&lang=en_US
Ehrenberg, R. H., & Stupak, R. J. (1994, Spring). Total quality management: Its
relationship to administrative theory and organizational behavior in the public
sector. Public Administration Quarterly, 18(1), 75. Retrieved from
ABI/INFORM Global. (Document ID: 815423)
Fabris, P. (2012, May). 4 more trends in higher-education facilities. Building Design +
Construction. Retrieved from
https://saaprimo.hosted.exlibrisgroup.com/primoexplore/fulldisplay?docid=TN_pr
oquest1281967920&context=PC&vid=WESTKY&search_scope=default_scope&
tab=default_tab&lang=en_US
Fabris, P. (2014, November). What college students want in their living spaces. Building
Design + Construction. Retrieved from https://saa-primo.hosted.exlibris
group.com/primo-
explore/fulldisplay?docid=TN_proquest1629427588&context=PC&vid=WESTK
Y&search_scope=default_scope&tab=default_tab&lang=en_US

113
Falk, C. F. (2010). Strategically planning campuses for the “newer students” in higher
education. Academy of Educational Leadership Journal, 14(3), 15-38. Retrieved
from https://saa-
primo.hosted.exlibrisgroup.com/primoexplore/fulldisplay?docid=TN_gale_ofa23
5631637&context=PC&vid=WESTKY&search_scope=default_scope&tab=defau
lt_tab&lang=en_US
Giambatista, R. C., Hoover, J. D., & Tribble, L. (2017). Millennials, learning, and
development: Managing complexity avoidance and narcissism. The Psychologist-
Manager Journal, 20(3), 176-193. Retrieved from https://saa-primo.hosted.
exlibrisgroup.com/primo-explore/fulldisplay?docid=TN_apa_articles10.1037/
mgr0000056&context=PC&vid=WESTKY&search_scope=default_scope&tab=d
efault_tab&lang=en_US
Grummon, P. T. H. (2009, March 26). Best practices in learning space design: Engaging
users. Educause Review. Retrieved from the Educause website:
https://er.educause.edu/articles/2009/3/best-practices-in-learning-space-design-
engaging-users
Haas, R. M. (2015). Effective use of resources: SCUP-11 in retrospect: Integrating
academic, fiscal, and facilities planning. Planning for Higher Education Journal,
43(3), 15-21. Retrieved from https://saa-
primo.hosted.exlibrisgroup.com/primoexplore/fulldisplay?docid=TN_gale_ofa42
6925131&context=PC&vid=WESTKY&search_scope=default_scope&tab=defau
lt_tab&lang=en_US

114
Herzog, S., & Valcik, N. A. (2007). The ecology of learning: The impact of classroom
features and utilization on student academic success. New Directions for
Institutional Research, (135), 81-106. Retrieved from https://saa-
primo.hosted.exlibrisgroup.com/primo-
explore/fulldisplay?docid=TN_wj10.1002/ir.224
&context=PC&vid=WESTKY&search_scope=default_scope&tab=default_tab&l
ang=en_US
Hill, S. (N. D.). The history of enrollment management: The changing landscape of
higher education. Retrieved from the Capture website:
http://innovate.capturehighered.com/history-of-enrollment
Hoover, E. (2009, March 6). ‘Golden walk’ gets a makeover from an auditor of campus
visits (Jeff Kallay and York College). The Chronicle of Higher Education, 55(26),
A1-A23. Retrieved from https://saa-
primo.hosted.exlibrisgroup.com/primoexplore/fulldisplay?docid=TN_gale_ofa19
4706476&context=PC&vid=WESTKY&search_scope=default_scope&tab=defau
lt_tab&lang=en_US
Hoover, E. (2010a, April 8). The exquisite minutiae of campus-visit day. The Chronicle
of Higher Education, n/a. Retrieved from
https://www.chronicle.com/blogs/headcount/the-exquisite-minutiae-of-campus-
visit-day/22410
Hoover, E. (2010b, August 22). Campus tours go Disney: The traditional college visit has
gotten more interesting. And more manipulative. Washington Monthly, 42(9, 10),
35. Retrieved from https://saa-primo.hosted.exlibrisgroup.com/primo-
115
explore/fulldisplay?docid=TN_gale_ofa236631525&context=PC&vid=WESTKY
&search_scope=default_scope&tab=default_tab&lang=en_US
Hunter, J., & Cox, A. (2014). Learning over tea! Studying in informal learning spaces.
New Library World, 115(1/2), 34-50. Retrieved from https://saa-
primo.hosted.exlibrisgroup.com/primo-
explore/fulldisplay?docid=TN_emerald_s10. 1108/ NLW-08-2013-
0063&context=PC&vid=WESTKY&search_scope=
default_scope&tab=default_tab&lang=en_US
Ike, N., Baldwin, C., & Lathouras, A. (2016). Student accommodation: Who cares?
Planning for Higher Education Journal, 44(3), 46-60. Retrieved from https://saa-
primo.hosted.exlibrisgroup.com/primo-
explore/fulldisplay?docid=TN_gale_ofa471145039&context=PC&vid=WESTKY
&search_scope=default_scope&tab= default_tab&lang=en_US
Jamieson, P. (2003). Designing more effective on-campus teaching and learning spaces:
A role for academic developers. International Journal of Academic Development,
8(1/2), 119-133.
Jensen, M. C. (2000). A theory of the firm. Cambridge, MA: Harvard University Press.
June, A. W. (2006, June 9). Facilities play a key role in students’ enrollment decisions,
study finds. The Chronicle of Higher Education, 52(40). Retrieved from
https://saaprimo.hosted.exlibrisgroup.com/primo-
explore/fulldisplay?docid=TN_proquest214670338&context=PC&vid=WESTKY
&search_scope= default_scope&tab=default_tab&lang=en_US

116
Kadamus, J. A. (2015). To build or not to build: Addressing facilities needs while
controlling costs. Change: The Magazine of Higher Learning, 47(2), 73-78.
Retrieved from https://saa-primo.hosted.exlibrisgroup.com/primo-
explore/fulldisplay?docid=TN_tayfranc10.1080/00091383.2015.1019326&contex
t=PC&vid=WESTKY&search_scope=default_scope&tab=default_tab&lang=en_
US
Kahlenberg, R. D. (2011, September 1). Innovations: The purposes of higher education.
The Chronicle of Higher Education. Retrieved from The Chronicle of Higher
Education website: https://www.chronicle.com/blogs/innovations/the-purposes-
of-higher-education/30258
Kaiser, H. H., & Klein, E. (2010). The 6 principles of facilities stewardship. Facilities
Manager, 26(1), 22-27. Retrieved from https://eric.ed.gov/?id=EJ910296
Kealy, M. J., & Rockel, M. L. (1987). Student perceptions of college quality: The
influence of college recruitment policies. The Journal of Higher Education, 58(6),
683-703. Retrieved from https://saa-
primo.hosted.exlibrisgroup.com/primoexplore/fulldisplay?docid=TN_tayfranc10.
1080/00221546.1987.11778293&context=PC&vid=WESTKY&search_scope=de
fault_scope&tab=default_tab&lang=en_US

117
Kent, K. M. (2009). The coffee house classroom: The difference between student and
faculty perceptions of classroom spatial design in a community college
environment (Doctoral dissertation). Available from ProQuest Dissertations and
Theses Global. (304900508). Retrieved from
https://saaprimo.hosted.exlibrisgroup.com/primoexplore/fulldisplay?docid=TN_pr
oquest304900508&context=PC&vid=WESTKY&search_scope=default_scope&t
ab=default_tab&lang=en_US
Kenton, J.D. (2014). Harvesting the high-hanging fruit. Change: The Magazine of Higher
Learning, 46(5), 16-22. Retrieved on April 11, 2017 from https://saa-
primo.hosted. exlibrisgroup.com/primo-
explore/fulldisplay?docid=TN_tayfranc10.1080/00091383.2014.941765&context
=PC&vid=WESTKY&search_scope=default_scope&tab=default_tab&lang=en_
US
Kohn, M. G., Manski, G. F., & Mandel, D. S. (1973). An empirical investigation of
factors which influence college going behavior. Santa Monica, CA: Rand
Corporation.
Kowalski, T. J. (1983). Solving educational facility problems. Muncie, IN: Accelerated
Development.

118
Kurt, S., & Osueke, K. K. (2014). The effects of color on the moods of college students.
Sage Open, 4(1). Retrieved from https://saa-primo.hosted.exlibrisgroup.
com/primo-
explore/fulldisplay?docid=TN_sage_s10_1177_2158244014525423&context
=PC&vid=WESTKY&search_scope=default_scope&tab=default_tab&lang=en_
US
Learning Spaces Collaboratory. (2012). Focusing on the relationship between mission
and planning learning spaces. Structures for Science: A Handbook for Planning
Facilities for Undergraduate Natural Science Communities. Retrieved from the
Learning Spaces Collaboratory website: https://www.pkallsc.org/wp-
content/uploads/2017/12/Focusing-on-the-Relationship-between-Mission-VolIII-
2.pdf
Lei, S. A. (2010). Classroom physical design influencing student learning and evaluations
of college instructors: A review of literature. Education, 131(1), 128-134.
Retrieved from https://saa-primo.hosted.exlibrisgroup.com/primo-
explore/fulldisplay?docid=TN_ericEJ917176&context=PC&vid=WESTKY&sear
ch_scope=default_scope&tab=default_tab&lang=en_US
Letawsky, N. R., Schneider, R. G., Pedersen, P. M., & Palmer, C. J. (2003). Factors
influencing the college selection process of student-athletes: Are their factors
similar to non-athletes? College Student Journal, 37(4), 604-610. Retrieved from
https://saaprimo.hosted.exlibris group.com/primo-
explore/fulldisplay?docid=TN_gale_ofa112720427&context=PC&vid=WESTKY
&search_scope= default_scope&tab=default_tab&lang=en_US

119
Lipman Hearne offers research on how millennials decide where to go to college. (2014,
August 27). Professional Services Close-Up. Retrieved from
http://libsrv.wku.edu:2048/login?url=https://searchproquestcom.libsrv.wku.edu/d
ocview/1556150762?accountid=15150
Litten, L. H. (1982). Different strokes in the applicant pool: Some refinements in a model
of student college choice. The Journal of Higher Education, 53(4), 383-402.
Retrieved from https://saa-primo.hosted.exlibrisgroup.com/primo-
explore/fulldisplay?docid=TN_tayfranc10.1080/00221546.1982.11780470&conte
xt=PC&vid=WESTKY&search_scope=default_scope&tab=default_tab&lang=en
_US
Loveland, E. (2017). Instant generation. Journal of College Admission, (234), 34.
Retrieved from https://saa-primo.hosted.exlibrisgroup.com/primo-
explore/fulldisplay?docid=TN_proquest1870922941&context=PC&vid=WESTK
Y&search_scope=default_scope&tab=default_tab&lang=en_US
Mahnke, F. (1996). Color, environment and human response. John Wiley.
Marcus, J. (2017, June 29). Universities and colleges struggle to stem big drops in
enrollment. The Hechinger Report. Retrieved from The Hechinger Report
website: https://hechingerreport.org/universities-colleges-struggle-stem-big-
drops-enrollment/

120
Martinez, M., & Wolverton, M. (2009). Enriching planning through industry analysis:
The authors perform an “industry analysis” for higher education, using the five
forces model of M.E. Porter. Planning for Higher Education Journal, 38(1), 23-
30. Retrieved from https://saa-primo.hosted.exlibrisgroup.com/primo-
explore/fulldisplay?docid=TN_eric
EJ877487&context=PC&vid=WESTKY&search_scope=default_scope&tab=defa
ult_tab&lang=en_US
Massis, B. E. (2011). “Serendipitous” browsing versus library space. New Library World,
112(3/4), 178-182. doi:10.1108/03074801111117078
McLaughlin, P., & Faulkner, J. (2012). Flexible spaces… what students expect from
university facilities. Journal of Facilities Management, 10(2), 140-149.
doi:10.1108/14725961211218776
Meredith, J. R., & Shafer, S. M. (2010). Operations management for MBAs (4th Ed.).
Hoboken, NJ: John Wiley & Sons, Inc.
Mertens, D. M., & Wilson, A. T. (2012). Program evaluation theory and practice: A
comprehensive guide. New York: Guilford Press.
Milgrom, P. R., & Roberts, J. (1992). Economics, organization, & management. Upper
Saddle River, NJ: Prentice-Hall, Inc.
Miller, L. (2012, November). The library and the campus visit: Communicating value to
prospective students and parents. College & Research Libraries News, 73(10),
586-589. Retrieved from https://saa-primo.hosted.exlibrisgroup.com/primo-
explore/fulldisplay?docid=TN_proquest1220983014&context=PC&vid=WESTK
Y& search_scope=default_scope&tab=default_tab&lang=en_US

121
Mills, D. (2012, February). Fusion facilities: 8 reasons to consolidate multiple functions
under one roof. Building Design + Construction. Retrieved from from https://saa-
primo.hosted.exlibrisgroup.com/primo-
explore/fulldisplay?docid=TN_proquest1277018464&context=PC&vid=WESTK
Y&search_scope=default_scope&tab=default_tab&lang=en_US
Moss, S. (2016). Generational cohort theory. Sicotests. Retrieved from Sicotests website:
http://www.sicotests.com/psyarticle.asp?id=374
Muntz, P. (2004). Millennials go to college. Journal of College Admission, (183), 26-27.
Retrieved from https://saa-primo.hosted.exlibrisgroup.com/primo-
explore/fulldisplay?docid=TN_proquest219136873&context=PC&vid=WESTKY
& search_scope=default_scope&tab=default_tab&lang=en_US
Newton, F. B. (2000). The new student. About Campus, 5(5), 8-15. Retrieved from
https://saa-primo.hosted.exlibrisgroup.com/primo-
explore/fulldisplay?docid=TN_ericEJ622740&context=PC&vid=WESTKY&sear
ch_scope=default_scope &tab=default_tab&lang=en_US
Nolfi, G. H., Fuller, W. C., Corrazzini, A. J., Epstein, W. H., Freeman, R. B., Manski, C.
F., Nelson, V. I., & Wise, D. A. (1978). Experiences of recent high school
graduates. Lexington, MA: D. C. Heath.
Nugent, J. (2012). Residential common spaces that really work: A post-occupancy study.
Planning for Higher Education, 41(1), 234-243. Retrieved from
https://saaprimo.hosted. exlibrisgroup.com/primo-
explore/fulldisplay?docid=TN_proquest1519532778&context=PC&vid=WESTK
Y&search_scope=default_scope&tab=default_tab&lang=en_US

122
Oblinger, D. (2003, July/August). Boomers, gen-Xers, & millennials: Understanding the
new students. Educause Review, (Jul-Aug), 37-47. Retrieved from
https://www.naspa.org/images/uploads/main/OblingerD_2003)_Boomers_genXer
s_and_millennials_Understanding_the_new_students.pdf
Oblinger, D. G., & Oblinger, J. L. (2005). Educating the net generation. Educause, 2.1-
2.20. Retrieved from https://www.educause.edu/research-and-
publications/books/educating-net-generation
Okerson, J. R. (2016). Beyond the campus tour: College choice and the campus visit
(Doctoral dissertation). Williamsburg, VA: College of William and Mary.
Retrieved from
http://publish.wm.edu/cgi/viewcontent.cgi?article=1004&context=etd
Parents: A key to college choice. (1986). Change, The Magazine of Higher Learning,
(18), 31. Retrieved from https://saa-primo.hosted.exlibrisgroup.com/primo-
explore/fulldisplay?docid=TN_
gale_ofa4629416&context=PC&vid=WESTKY&search_scope=default_scope&ta
b=default_tab&lang=en_US
Park, E. L., & Choi, B. K. (2014). Transformation of classroom spaces: Traditional
versus active learning classroom in colleges. Higher Education: The International
Journal of Higher Education and Educational Planning, 68(5), 749-771.
doi:10.1007/s10734-014-9742-0

123
Pew Research Center. (2015, March 19). Comparing millennials to other generations.
Pew Research Center Social & Demographic Trends. Retrieved from
http://www.pewsocialtrends.org/2015/03/19/comparing-millennials-to-other-
generations/#!11
Pew Research Center. (2018, March 1). Defining generations: Where Millennials end and
post-Millennials begin. Pew Research Center Social & Demographic Trends.
Retrieved from http://www.pewresearch.org/fact-tank/2018/03/01/defining-
generations-where-millennials-end-and-post-millennials-begin/
Preskill, H., & Torres, R. (1999). Evaluation inquiry for learning in organizations.
Thousand Oaks, CA: Sage.
Project Kaleidoscope. (1998). What difference do improved facilities make? A Report of
the project Kaleidoscope Committee of Visitors. Retrieved from the Learning
Spaces Collaboratory website: https://www.pkallsc.org/wp-content/uploads/
2017/12/committee-of-visitors-report-facilities.pdf
Reynolds, G. L., & Valcik, N. A. (2007). The impact of facilities on recruitment and
retention of students. New Directions for Institutional Research, (135), 63-80.
Retrieved from https://saa-
primo.hosted.exlibrisgroup.com/primoexplore/fulldisplay?docid=TN_wj10.1002/i
r.223&context=PC&vid=WESTKY&search_scope=default_scope&tab=default_t
ab&lang=en_US

124
Ruffalo Noel Levitz. (2017). 2017 Marketing and student recruitment report of effective
practices. Higher Ed Benchmarks. Retrieved from the Ruffalo Noel Levitz
website:
http://learn.ruffalonl.com/rs/395EOG977/images/2017RecruitmentMarketingEffe
ctivePracticesReport.pdf
Rullman, L., & Van Den Kieboom, J. (2012). Creating community: Designing spaces that
make a difference. Planning for Higher Education, 41(1), 178-193. Retrieved
from https://saa-primo.hosted.exlibrisgroup.com/primo-
explore/fulldisplay?docid=TN_gale_ofa325092237&context=PC&vid=WESTKY
&search_scope= default_scope&tab=default_tab&lang=en_US
Salmen, J. P. S. (2011). Universal design for academic facilities. New Directions for
Student Services, (134), 13-20. Retrieved from https://saa-primo.
hosted.exlibrisgroup.com/primo-
explore/fulldisplay?docid=TN_ericEJ935584&context=
PC&vid=WESTKY&search_scope=default_scope&tab=default_tab&lang=en_U
S
Secore, S. (2018). The significance of campus visitations to college choice and strategic
enrollment management. Strategic Enrollment Management Quarterly, (5/4), 150-
158. Retrieved from https://onlinelibrary.wiley.com/doi/pdf/10.1002/sem3.20114
Seemiller, C., & Grace, M. (2016). Generation Z goes to college. San Francisco: Jossey-
Bass.
Seemiller, C., & Grace, M. (2017). Generation Z: Educating and engaging the next
generation of students. About Campus, 22(3), 21-26.

125
Sewell, W. H., & Shah, V. P. (1967). Socio-economic status, intelligence, and the
attainment of higher education. Sociology of Education, 40(Winter 1967), 1-23.
Showers, R. (2016, March 21). 7 things admissions needs to know about generation z.
Retrieved from Brazen website:
https://www.brazen.com/blog/category/universities/
Sightlines. (2018). 2018 state of facilities in higher education (6th Annual Report).
Retrieved from https://www.sightlines.com/insight/2018-state-of-facilities/
Steelcase Education Solutions. (2014, April). New study shows classroom design is key
contributing factor in college students’ enrollment decisions. PR Newswire.
Retrieved from
http://libsrv.wku.edu:2048/login?url=https://search.proquest.com/docview/15160
40209?accountid=15150
Strange, C. C., & Banning, J. H. (2001). Educating by design: Creating campus learning
environments that work. San Francisco: Jossey-Bass.
Suttell, R. (2007). The changing campus landscape. Buildings, 101(2), 62-64. Retrieved
from https://saa-
primo.hosted.exlibrisgroup.com/primoexplore/fulldisplay?docid=TN_gale_ofg
159696905&context=PC&vid=WESTKY&search_scope=online_only&tab=onlin
e_tab&lang=en_US
Thomas, G. E. (1977). Race and sex effects on access to college, Report No. 229.
Baltimore: Center for Social Organization of Schools, Johns Hopkins University.

126
Tierno, S. A. (2013). College union facilities and their perceived influence on
institutional retention (Doctoral dissertation). Available from ProQuest
Dissertations and Theses (3567824). Retrieved from
https://saaprimo.hosted.exlibrisgroup.com/primoexplore/fulldisplay?docid=TN_pr
oquest1424274095&context=PC&vid=WESTKY&
search_scope=default_scope&tab=default_tab&lang=en_US
Trent, J. (1974). The decision to go to college: A cumulative multivariate process, CSE
Report No. 64. Los Angeles: Center for the Study of Evaluation, University of
California.
Twenge, J. M. (2017). IGen: Why today's super-connected kids are growing up less
rebellious, more tolerant, less happy-- and completely unprepared for adulthood
(and what this means for the rest of us). New York: Atria Books.
Valenti, M. (2015, July/August). Beyond active learning: Transformation of the learning
space. Educause Review, (July/August), 31-38. Retrieved from
https://er.educause.edu/articles/2015/6/ beyond-active-learning-transformation-of-
the-learning-space
Veltri, S., Banning, J. H., & Davies, T. G. (2006). The community college classroom
environment: Student perceptions. College Student Journal, 40(3), 517-527.
Retrieved from https://saa-primo.hosted.exlibrisgroup.com/primo-
explore/fulldisplay?docid=
TN_ericEJ765350&context=PC&vid=WESTKY&search_scope=default_scope&t
ab=default_tab&lang=en_US

127
Vidalakis C., Sun, M., & Papa, A. (2013). The quality and value of higher education
facilities: A comparative study. Facilities, 31(11), 489-504. Retrieved from
http://dx.doi.org.libsrv. wku.edu/10.1108/F-10-2011-0087
Vladeck, B. C. (1979, December/January). Buildings and budgets: The overinvestment
crisis. Change, The Magazine of Higher Learning, 10(11), 36-40. Retrieved from
https://saa-
primo.hosted.exlibrisgroup.com/primoexplore/fulldisplay?docid=TN_medline102
44850&context=PC&vid=WESTKY&search_scope=default_scope&
tab=default_tab&lang=en_US
Wang, H. (2003). Computer classroom wall color preference and personality type of
college students (Master’s thesis). Retrieved from https://saa-primo.hosted.
exlibrisgroup.com/primo-
explore/fulldisplay?docid=TN_texas_thinktech2346/10087&context=PC&vid=W
ESTKY&search_scope=default_scope& tab=default_tab&lang=en_US
Weber-Bezich, H. (2014). Classroom design and student engagement in post-secondary
institutions: An evaluative case study (Doctoral dissertation). Available from
ProQuest Dissertations and Theses (3621165). Retrieved from https://saa-
primo.hosted.exlibrisgroup.com/primo-
explore/fulldisplay?docid=TN_proquest1545690937&context=PC&vid=WESTK
Y&search_scope=default_scope&tab=default_tab&lang=en_US

128
Williams, S. (1985, March/April). The architecture of the academy. Change, The
Magazine of Higher Learning, 17(2), 14-30, 50-55. Retrieved from https://saa-
primo.hosted.exlibrisgroup.com/primo-
explore/fulldisplay?docid=TN_tayfranc10.1080/00091383.1985.9937023&contex
t=PC&vid=WESTKY&search_scope=default_scope&tab=default_tab&lang=en_
US
Wode, J. (2018). Identifying the factors that motivate students to choose off-campus
housing. Journal of College & University Student Housing, 44(2), 44-63.
Retrieved from https://saa-primo.hosted.exlibrisgroup.com/primo-
explore/fulldisplay?docid=TN_ericEJ1177314&context=PC&vid=WESTKY&sea
rch_scope=default_scope&tab=default_tab&lang=en_US
Workflow Management Coalition. (N.D.). Generational differences chart. Retrieved
from http://www.wmfc.org/uploads/GenerationalDifferencesChart.pdf

126
APPENDICES
127
APPENDIX A
QUALTRICS SURVEY QUESTIONNAIRE

128
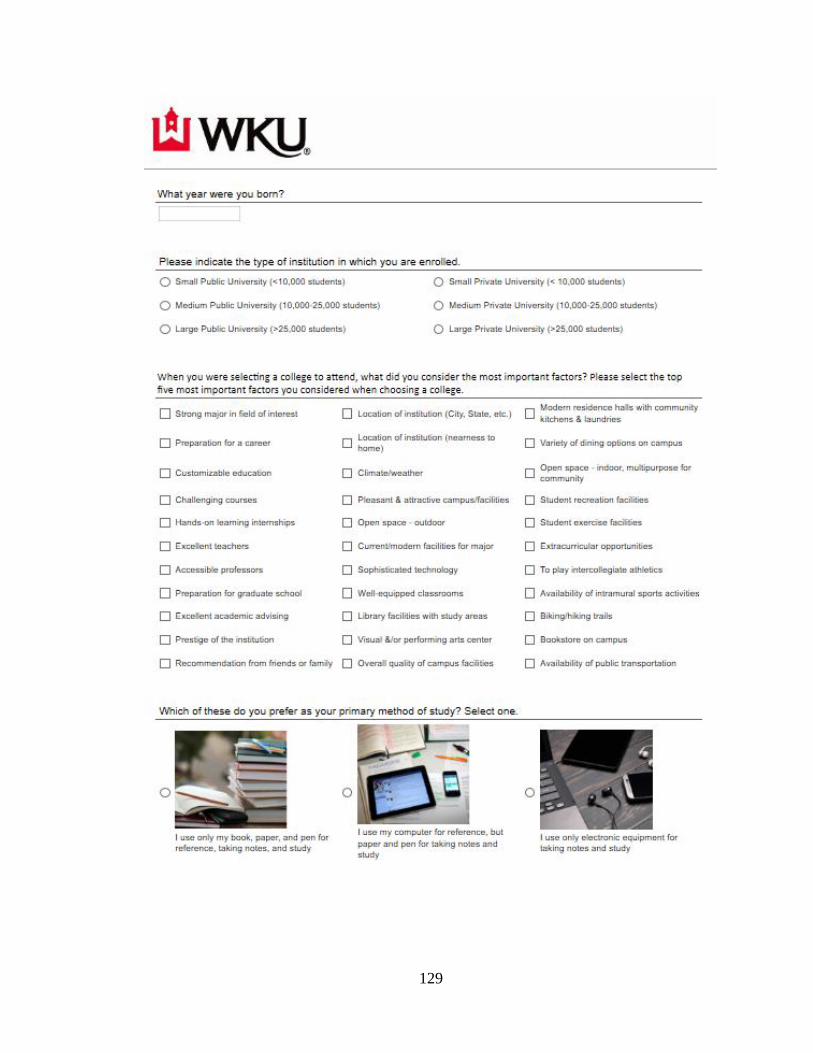
129

130

131

132
APPENDIX B
PARTICIPATION REQUEST E-MAIL

133

134
APPENDIX C
DATA AND ANALYSIS OF SURVEY RESPONSES

135
20.1
24.7
27.6
33.3
35.1
36.2
48.9
51.1
52.9
73.6
Recommendation fromfriends or family
Accessible professors
Excellent teachers
Modern residence hallswith community kitchens
& laundries
Overall quality of campusfacilities
Preparation for a career
Location of institution(city, state, etc.)
Pleasant & attractivecampus/facilities
Location of institution(nearness to home)
Strong major in field ofinterest
Total Students Responding (n = 174)
12.7
12.7
18.6
19.6
24.5
31.4
34.3
37.3
39.2
45.1
59.8
Customizable education
Preparation for graduateschool
Excellent teachers
Accessible professors
Preparation for a career
Modern residence hallswith community kitchens
& laundries
Overall quality of campusfacilities
Location of institution(city, state, etc.)
Pleasant & attractivecampus/facilities
Location of institution(nearness to home)
Strong major in field ofinterest
Students Responding Born 2000-2001 (n = 102)
18.6
20.3
22.0
22.0
27.1
30.5
35.6
37.3
37.3
61.0
Preparation for graduateschool
Accessible professors
Excellent teachers
Modern residence hallswith community kitchens
& laundries
Overall quality of campusfacilities
Preparation for a career
Pleasant & attractivecampus/facilities
Location of institution(nearness to home)
Location of institution(city, state, etc.)
Strong major in field ofinterest
Students Responding Born 1998-1999 (n = 53)
23.1
23.1
23.1
30.8
30.8
30.8
30.8
38.5
46.2
53.8
Challenging courses
Accessob;e professors
Well-equippedclassrooms
Customizable education
Excellent teachers
Location of institution(city, state, etc.)
Location of institution(nearness to home)
Pleasant & attractivecampus/facilities
Preparation for a career
Strong major in field ofinterest
Students Responding Born Before 1998 (n = 13)
Figure C1. Top 10 most influential factors for college selection based on birth year of the students responding.

136
15.6
19.2
21.4
25.9
27.2
28.1
37.9
39.7
41.1
57.1
Recommendation fromfriends or family
Accessible professors
Excellent teachers
Modern residence hallswith community kitchens
& laundries
Overall quality of campusfacilities
Preparation for a career
Location of institution(city, state, etc.)
Pleasant & attractivecampus/facilities
Location of institution(nearness to home)
Strong major in field ofinterest
Total Students Responding (n = 224)
13.7
13.7
20.0
21.1
26.3
33.7
36.8
40.0
42.1
48.4
64.2
Customizable education
Preparation for graduateschool
Excellent teachers
Accessible professors
Preparation for a career
Modern residence hallswith community kitchens
& laundries
Overall quality of campusfacilities
Location of institution(city, state, etc.)
Pleasant & attractivecampus/facilities
Location of institution(nearness to home)
Strong major in field ofinterest
Large Public Universities (n = 95)
12.8
14.0
15.1
15.1
18.6
20.9
24.4
25.6
25.6
41.9
Preparation for graduateschool
Accessible professors
Excellent teachers
Modern residence hallswith community kitchens
& laundries
Overall quality of campusfacilities
Preparation for a career
Modern residence hallswith community kitchens
& laundries
Location of institution(city, state, etc.)
Pleasant & attractivecampus/facilities
Strong major in field ofinterest
Medium Public Universities (n = 86)
37.5
37.5
37.5
50.0
50.0
50.0
50.0
62.5
75.0
87.5
Challenging courses
Accessible professors
Well-equipped classrooms
Customizable education
Excellent teachers
Location of institution(city, state, etc.)
Location of institution(nearness to home)
Pleasant & attractivecampus/facilities
Preparation for a career
Strong major in field ofinterest
Small Public Universities (n = 8)
22.9
22.9
25.7
28.6
31.4
37.1
37.1
48.6
54.3
60.0
Location of institution(nearness to home)
Location of institution(city, state, etc.)
Extracurricularopportunities
Pleasant & attractivecampus/facilities
Preparation for graduateschool
Preparation for a career
Strong major in field ofinterest
Challenging courses
Excellent teachers
Accessible professors
Small Private Universities (n = 35)
Figure C2. Top ten most influential factors for college selection based on college type of the students responding.

137
Figure C3. Summary of rating of facilities.
1- Unimportant 5 5 11 13 15 77 13 19 17 16 70 64 23 34
2 - Somewhat Unimportant 7 7 19 19 11 43 10 28 25 25 32 44 34 32
3 - Somewhat Important 23 43 47 57 40 52 52 52 61 55 45 61 64 43
4 - Important 44 76 65 52 57 17 65 57 60 61 34 29 54 59
5 - Very Important 140 87 77 76 95 28 78 60 54 61 36 18 42 48
Mean 4.4 4.1 3.8 3.7 3.9 2.4 3.8 3.5 3.5 3.6 2.7 2.5 3.3 3.3
Median 5 4 4 4 4 2 4 4 4 4 3 2.5 3 3
Mode 5 5 5 5 5 1 5 5 3 5 1 1 3 4
Standard Deviation 0.957 0.963 1.153 1.196 1.199 1.373 1.137 1.262 1.203 1.214 1.472 1.269 1.238 1.369
Variance 0.916 0.926 1.330 1.431 1.437 1.885 1.294 1.592 1.448 1.473 2.166 1.611 1.532 1.875
No. Responses 219 218 219 217 218 217 218 216 217 218 217 216 217 216
5 - Very Important 63.9 39.9 35.2 35.0 43.6 12.9 35.8 27.8 24.9 28.0 16.6 8.3 19.4 22.2
4 - Important 20.1 34.9 29.7 24.0 26.1 7.8 29.8 26.4 27.6 28.0 15.7 13.4 24.9 27.3
3 - Somewhat Important 10.5 19.7 21.5 26.3 18.3 24.0 23.9 24.1 28.1 25.2 20.7 28.2 29.5 19.9
Sum 94.5 94.5 86.3 85.3 88.1 44.7 89.4 78.2 80.6 81.2 53.0 50.0 73.7 69.4
2 - Somewhat Unimportant 3.2 3.2 8.7 8.8 5.0 19.8 4.6 13.0 11.5 11.5 14.7 20.4 15.7 14.8
1- Unimportant 2.3 2.3 5.0 6.0 6.9 35.5 6.0 8.8 7.8 7.3 32.3 29.6 10.6 15.7
Sum 5.5 5.5 13.7 14.7 11.9 55.3 10.6 21.8 19.4 18.8 47.0 50.0 26.3 30.6
Summary of Ranking of Facilities
Important vs. Unimportant
Percentage of Students Responding as Unimportant, or Somewhat Unimportant
Percentage of Students Responding as Very Important, Important, or Somewhat Important
Performing
arts center
Residence
hallsLibraryClassroomsTechnology
Facilities for
my major
Technology
Facilities for
my major
Public
transportation
Bookstore on
campus
Imtramural
sports
Varsity athletic
facilities
Recreation/
exercise Open spaceStudent center
Dining
facilities
Student center
Dining
facilities
Performing
arts center
Residence
hallsLibraryClassrooms
Public
transportation
Bookstore on
campus
Imtramural
sports
Varsity athletic
facilities
Recreation/
exercise Open space
Open space
Recreation/
exercise
Varsity athletic
facilities
Imtramural
sports
Bookstore on
campus
Public
transportation
Facilities for
my major Technology Classrooms Library
Residence
halls
Performing
arts center
Dining
facilities Student center

138
88.3
84.2
91.8
75.0
94.3
11.7
15.8
8.2
25.0
5.7
Overall(n = 223)
Large Public(n = 95)
MediumPublic (n = 85)
Small Public(n = 8)
Small Private(n = 35)
No windows Windows
88.4
93.1
84.5
69.2
11.6
6.9
15.5
30.8
Overall(n = 173)
2000-2001(n = 102)
1998-1999(n = 58)
Pre-1998(n = 13)
No windows Windows
Figure C4. Preference for windows in the classroom by birth year and college type of the students responding.

139
Figure C5. Preference for wall color in the classroom by birth year of students responding.
58.4 57.8 56.9
69.2
40.5 42.2 43.1
15.4
27.224.5
31.0 30.827.2 25.5
29.3 30.8
Overall (n = 173) 2000-2001 (n = 102) 1998-1999 (n = 58) Pre-1998 (n = 13)
Blue White Plum Yellow

140
Figure C6. Preference for wall color in the classroom by college type of the students responding.
58.762.1
57.6
50.054.3
39.5 41.137.6 37.5
40.0
26.5
18.9
32.9
25.0
31.4
25.6 27.4 28.2
12.5
20.0
Overall (n = 223) Large Public (n = 95) Medium Public (n = 85) Small Public (n = 8) Small Private (n = 35)
Blue White Plum Yellow

141
Figure C7. Preference for furniture in the classroom by birth year of the students responding.
43.6 45.142.1
38.5
8.1 8.8 8.8
0.0
48.346.1
49.1
61.5
Overall (n = 172) 2000-2001 (n = 102) 1998-1999 (n = 57) Pre-1998 (n = 13)
Tables and Chairs
Chairs with Desks
Rolling Chairswith Desks
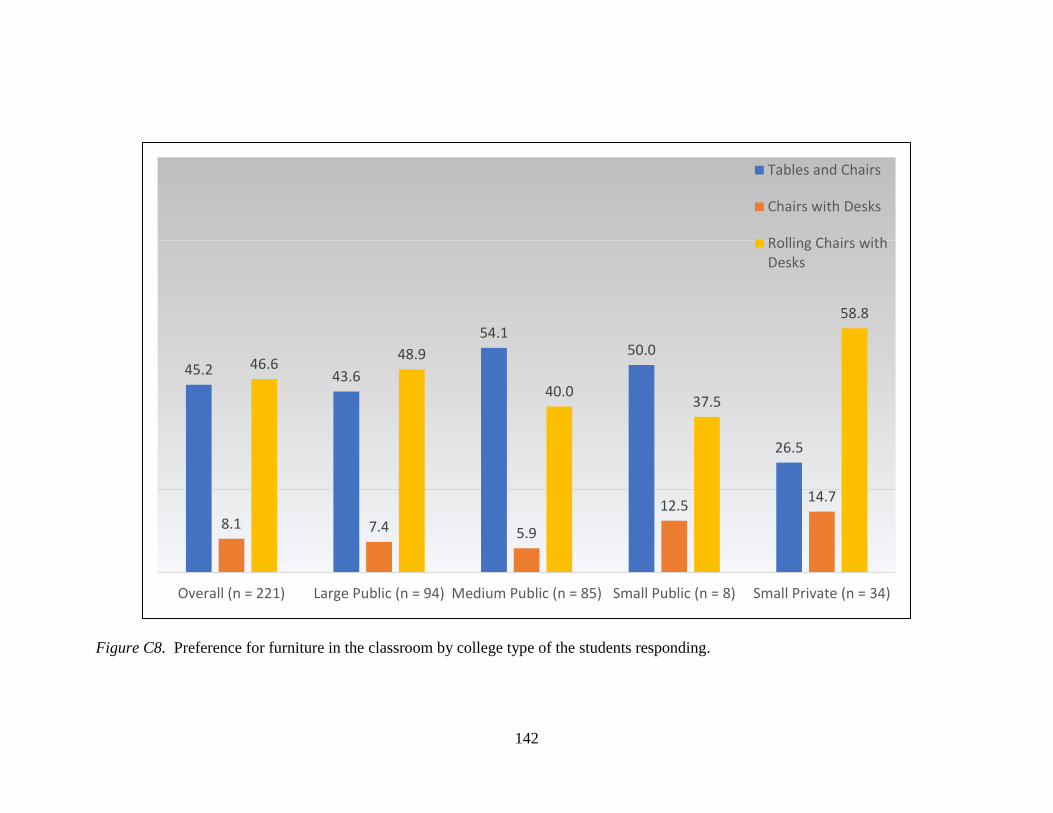
142
Figure C8. Preference for furniture in the classroom by college type of the students responding.
45.2 43.6
54.150.0
26.5
8.1 7.4 5.9
12.514.7
46.648.9
40.037.5
58.8
Overall (n = 221) Large Public (n = 94) Medium Public (n = 85) Small Public (n = 8) Small Private (n = 34)
Tables and Chairs
Chairs with Desks
Rolling Chairs withDesks

143
Figure C9. Preference for learning resources by birth year of the students responding.
9.87.8
13.6
7.7
77.079.4
72.976.9
12.1 12.710.2
15.4
Overall (n = 17) 2000-2001 (n = 102) 1998-1999 (n = 59) Pre-1998 (n = 13)
Percentage of Usageby Birth Year
I use only my book,paper, and pen forreference, takingnotes, and study
I use my computerfor reference, butpaper and pen fortaking notes andstudy
I use only electronicequipment for takingnotes and study

144
Figure C10. Preference for learning resources by college type of the students responding.
9.9 8.4 7.1
12.5
20.0
76.1
69.5
83.3
75.077.1
14.0
22.1
9.512.5
2.9
Overall (n = 222) Large Public (n = 95) Medium Public (n = 84) Small Public (n = 8) Small Private (n = 35)
Percentage of Usageby College Type
I use only my book,paper, and pen forreference, takingnotes, and study
I use my computerfor reference, butpaper and pen fortaking notes andstudy
I use only electronicequipment for takingnotes and study
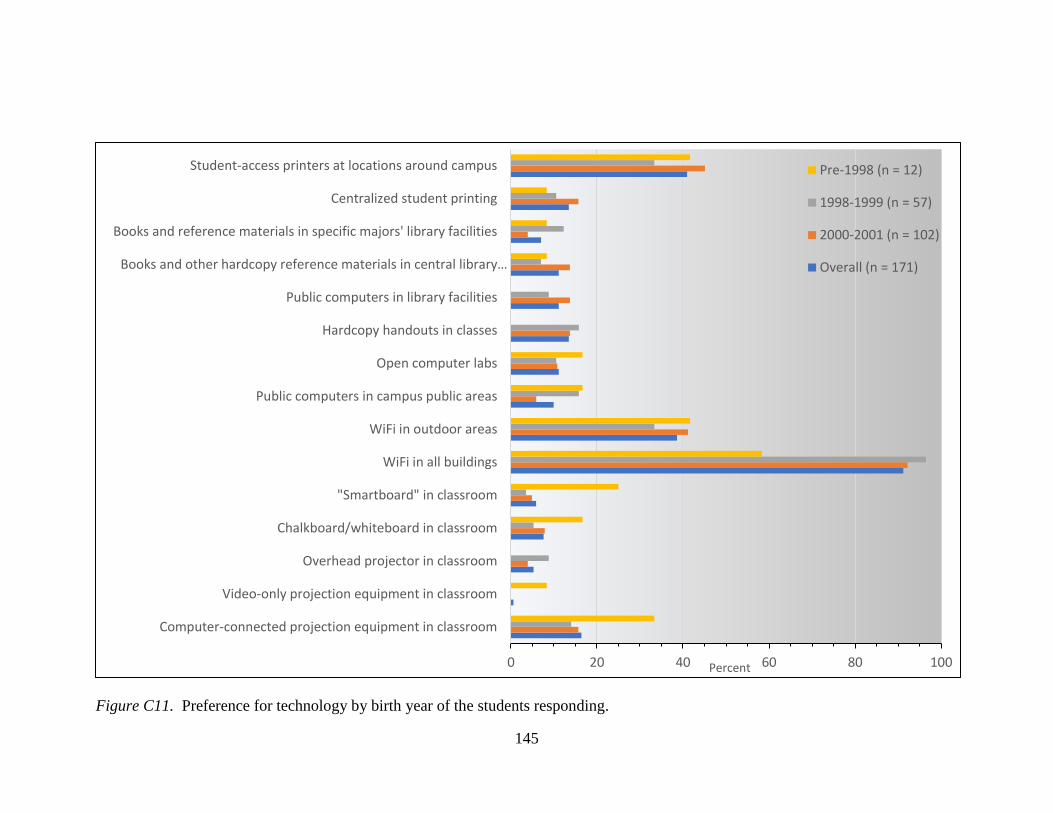
145
Figure C11. Preference for technology by birth year of the students responding.
0 20 40 60 80 100
Computer-connected projection equipment in classroom
Video-only projection equipment in classroom
Overhead projector in classroom
Chalkboard/whiteboard in classroom
"Smartboard" in classroom
WiFi in all buildings
WiFi in outdoor areas
Public computers in campus public areas
Open computer labs
Hardcopy handouts in classes
Public computers in library facilities
Books and other hardcopy reference materials in central library…
Books and reference materials in specific majors' library facilities
Centralized student printing
Student-access printers at locations around campus
Percent
Pre-1998 (n = 12)
1998-1999 (n = 57)
2000-2001 (n = 102)
Overall (n = 171)

146
Figure C12. Preference for technology by college type of the students responding.
0 10 20 30 40 50 60 70 80 90 100
Computer-connected projection equipment in classroom
Video-only projection equipment in classroom
Overhead projector in classroom
Chalkboard/whiteboard in classroom
"Smartboard" in classroom
WiFi in all buildings
WiFi in outdoor areas
Public computers in campus public areas
Open computer labs
Hardcopy handouts in classes
Public computers in library facilities
Books and other hardcopy reference materials in central library…
Books and reference materials in specific majors' library facilities
Centralized student printing
Student-access printers at locations around campus
Percent
Small Private (n = 34)
Small Public (n = 8)
Medium Public (n = 84)
Large Public (n = 95)
Overall (n = 221)

147
APPENDIX D
IMPORTANT FACILITIES FACTOR ANALYSIS

148
Exploratory Factor Analysis
After the initial review, an Exploratory Factor Analysis (EFA) was completed
using Stata. In Table D1, the skewness and kurtosis for each question is presented.
Skewness indicates a level of prejudice toward one end of the scale or the other (most
data plotting either to the right or left of the center of a graph). Skewness should be in
the range of -2.0 to 2.0. Kurtosis, on the other hand, looks at the horizontal plot. If each
answer to a question had the same number of responses, the line formed on the graph
would be straight and horizontal; respondents were equally divided on the question.
However, if the majority of respondents were undecided on a question, there would be a
high peak at the center of the graph. Kurtosis should be in a range of -7.0 to 7.0. In this
study, both skewness and kurtosis were within the desired ranges.
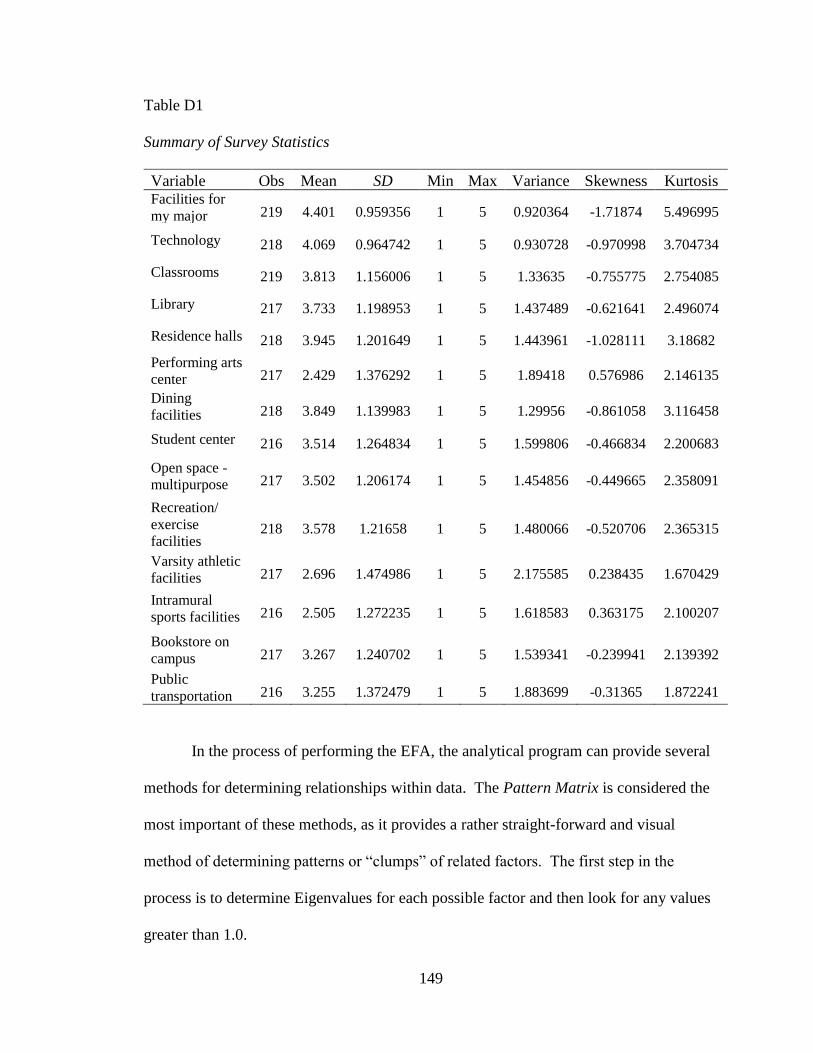
149
Table D1
Summary of Survey Statistics
Variable Obs Mean SD Min Max Variance Skewness Kurtosis Facilities for
my major 219 4.401 0.959356 1 5 0.920364 -1.71874 5.496995
Technology 218 4.069 0.964742 1 5 0.930728 -0.970998 3.704734
Classrooms 219 3.813 1.156006 1 5 1.33635 -0.755775 2.754085
Library 217 3.733 1.198953 1 5 1.437489 -0.621641 2.496074
Residence halls 218 3.945 1.201649 1 5 1.443961 -1.028111 3.18682
Performing arts
center 217 2.429 1.376292 1 5 1.89418 0.576986 2.146135
Dining
facilities 218 3.849 1.139983 1 5 1.29956 -0.861058 3.116458
Student center 216 3.514 1.264834 1 5 1.599806 -0.466834 2.200683
Open space -
multipurpose 217 3.502 1.206174 1 5 1.454856 -0.449665 2.358091
Recreation/
exercise
facilities 218 3.578 1.21658 1 5 1.480066 -0.520706 2.365315
Varsity athletic
facilities 217 2.696 1.474986 1 5 2.175585 0.238435 1.670429
Intramural
sports facilities 216 2.505 1.272235 1 5 1.618583 0.363175 2.100207
Bookstore on
campus 217 3.267 1.240702 1 5 1.539341 -0.239941 2.139392
Public
transportation 216 3.255 1.372479 1 5 1.883699 -0.31365 1.872241
In the process of performing the EFA, the analytical program can provide several
methods for determining relationships within data. The Pattern Matrix is considered the
most important of these methods, as it provides a rather straight-forward and visual
method of determining patterns or “clumps” of related factors. The first step in the
process is to determine Eigenvalues for each possible factor and then look for any values
greater than 1.0.

150
Figure D1. Scree plot of factors affecting college selection.
As can be seen in the Scree plot in Figure D1, the first three factors have the
biggest impact on the graph. Past that point, the line begins to level out and show little
change. This is verified by the Stata program which also indicated three factors at levels
above 1.0; Factors 1, 2 and 3. A factor analysis is then repeated based on a Maximum
Likelihood of three factors. Table D2 presents factor loadings for the three factors.
Factor Eigenvalue
Factor 1 5.00795
Factor 2 1.72498
Factor 3 1.29234
Factor 4 0.91820
Factor 5 0.82282
Factor 6 0.76232
Factor 7 0.68035
Factor 8 0.67609
Factor 9 0.51154
Factor 10 0.40893
Factor 11 0.36305
Factor 12 0.29432
Factor 13 0.27305
Factor 14 0.26405

151
Table D2
Factor Loadings
Variable Factor 1 Factor 2 Factor 3 Uniqueness
Facilities for my major 0.1513 0.0492 0.3048 0.8818
Technology 0.3731 0.2745 0.4407 0.5912
Classrooms 0.4699 0.2656 0.6265 0.3162
Library 0.3760 0.3583 0.5637 0.4125
Residence halls 0.5982 -0.0889 -0.0590 0.6307
Performing arts center 0.3123 0.3696 0.0466 0.7637
Dining facilities 0.9452 -0.2280 -0.0554 0.0515
Student center 0.6812 0.2890 0.0691 0.4475
Open space - multipurpose 0.5760 0.2632 0.0764 0.5931
Recreation/exercise facilities 0.5202 0.4554 -0.1007 0.5119
Varsity athletic facilities 0.3700 0.5202 -0.3763 0.450
Intramural sports facilities 0.3735 0.7075 -0.3767 0.2182
Bookstore on campus 0.3932 0.4554 0.1723 0.6083
Public transportation 0.4123 0.2279 0.0810 0.7715
The next step in the process was to determine what the three factors actually
represented. This was completed by reviewing the questions and comparing them to the
factor loading results. In an effort to find ways to interpret the data to get clear results, a
rotation of the factor structure was performed. There are several methods of performing
a rotation; but in looking for factors that are correlated, an oblique rotation was used. For

152
this study, an oblique rotation was completed, with all numbers below 0.3 being
eliminated as insignificant. The results are shown in Table D3.
Table D3
Rotated Factor Loadings (< 0.3 results eliminated)
Variable Factor 1 Factor 2 Factor 3 Uniqueness
Facilities for my major 0.3957 0.8818
Technology 0.6694 0.5912
Classrooms 0.8950 0.3162
Library 0.8502 0.4125
Residence halls 0.6434 0.6307
Performing arts center 0.3480 0.7637
Dining facilities 1.0803 0.0515
Student center 0.3608 0.4475
Open space - multipurpose 0.5931
Recreation/exercise facilities 0.5558 0.5119
Varsity athletic facilities 0.8227 0.4509
Intramural sports facilities 1.0097 0.2182
Bookstore on campus 0.4267 0.3418 0.6083
Public transportation 0.7715
It is generally considered that the best loadings are greater than 0.7. Two values,
technology and residence halls, were below that number, but barely; Therefore, they were
retained in the analysis. The loading for facilities for my major, performing arts center,
student center, student recreation/exercise facilities, and bookstore on campus were well

153
below the 0.7 threshold and were removed from further analysis. Based on the data as
amended, the following questions loaded to Factor 1: technology, classrooms, and
library. Those loading to Factor 2 were varsity athletic facilities and intramural sports
facilities. Factor 3 factors included residence halls and dining facilities. There were no
cross-loaded items in this data. From this information, it appears that Factor 1 was
related to academic facility resources, Factor 2 is related to sports facilities, and Factor 3
is related to student living facilities.
With factors determined, a summary of data for the three factors was completed,
as presented in Table D4. Cronbach’s alpha was considered adequate reliability for the
three factors, although Factor 2 related to activities was slightly less.
Table D4
Summary of Factor Analysis
Variable
Obser-
vations Mean Std. Dev.
Min
Value
Max
Value
Cronbach’s
Alpha
Academic resources 216 11.625 2.759023 3 15 0.7811
Activities 217 6.267 2.315905 2 10 0.6377
Student living 218 7.794 2.089816 2 10 0.7436
Confirmatory Factor Analysis
At this point, it was desired to confirm the hypothesis by using Structural
Equation Modeling (SEM). The first step in this process was to draw an illustration of
the model within Stata.

154
Figure D2. Structural equation model.
The model was then analyzed utilizing the data from the survey and the results
included in the model presented as Figure D3.
Figure D3. Structural equation model with analysis results.
Figure D4 presents the standardized loadings (column labeled “Coef.”), standard
errors (column labeled “Std. Err.”), and p-values for all factor loadings, from Stata.

155
Figure D4. Stata factor analysis results.
LR test of model vs. saturated: chi2(11) = 20.92, Prob > chi2 = 0.0343
cov(Activities,Facilities) .4054884 .0948789 4.27 0.000 .2195292 .5914477
cov(Resources,Facilities) .1939352 .0534486 3.63 0.000 .089178 .2986925
cov(Resources,Activities) .248581 .0655304 3.79 0.000 .1201437 .3770182
var(Facilities) .5922841 .1449044 .3666745 .9567082
var(Activities) 1.154821 .2850586 .7118729 1.873386
var(Resources) .3748545 .0794332 .2474513 .5678528
var(e.Q91_7) .2009447 .1706032 .0380541 1.061088
var(e.Q91_5) .8479595 .1229075 .6382602 1.126555
var(e.Q91_11) 1.540108 .1984066 1.196448 1.982478
var(e.Q91_10) .3131997 .2512378 .0650156 1.508778
var(e.Q91_4) .6909236 .0899634 .5353 .8917905
var(e.Q91_3) .2820288 .0904474 .1504218 .5287815
var(e.Q91_2) .5561297 .0633384 .4448684 .6952174
_cons 3.837963 .0773756 49.60 0.000 3.68631 3.989616
Facilities 1.357984 .2365544 5.74 0.000 .8943461 1.821622
Q91_7
_cons 3.935185 .0816566 48.19 0.000 3.775141 4.095229
Facilities 1 (constrained)
Q91_5
_cons 2.685185 .0997889 26.91 0.000 2.489602 2.880768
Activities .7272544 .1727327 4.21 0.000 .3887045 1.065804
Q91_11
_cons 3.564815 .0824402 43.24 0.000 3.403235 3.726395
Activities 1 (constrained)
Q91_10
_cons 3.74537 .0805869 46.48 0.000 3.587423 3.903318
Resources 1.378027 .1657224 8.32 0.000 1.053217 1.702836
Q91_4
_cons 3.814815 .0775505 49.19 0.000 3.662819 3.966811
Resources 1.647144 .1949431 8.45 0.000 1.265062 2.029225
Q91_3
_cons 4.064815 .0656514 61.92 0.000 3.93614 4.193489
Resources 1 (constrained)
Q91_2
Measurement
Coef. Std. Err. z P>|z| [95% Conf. Interval]
OIM
( 3) [Q91_5]Facilities = 1
( 2) [Q91_10]Activities = 1
( 1) [Q91_2]Resources = 1
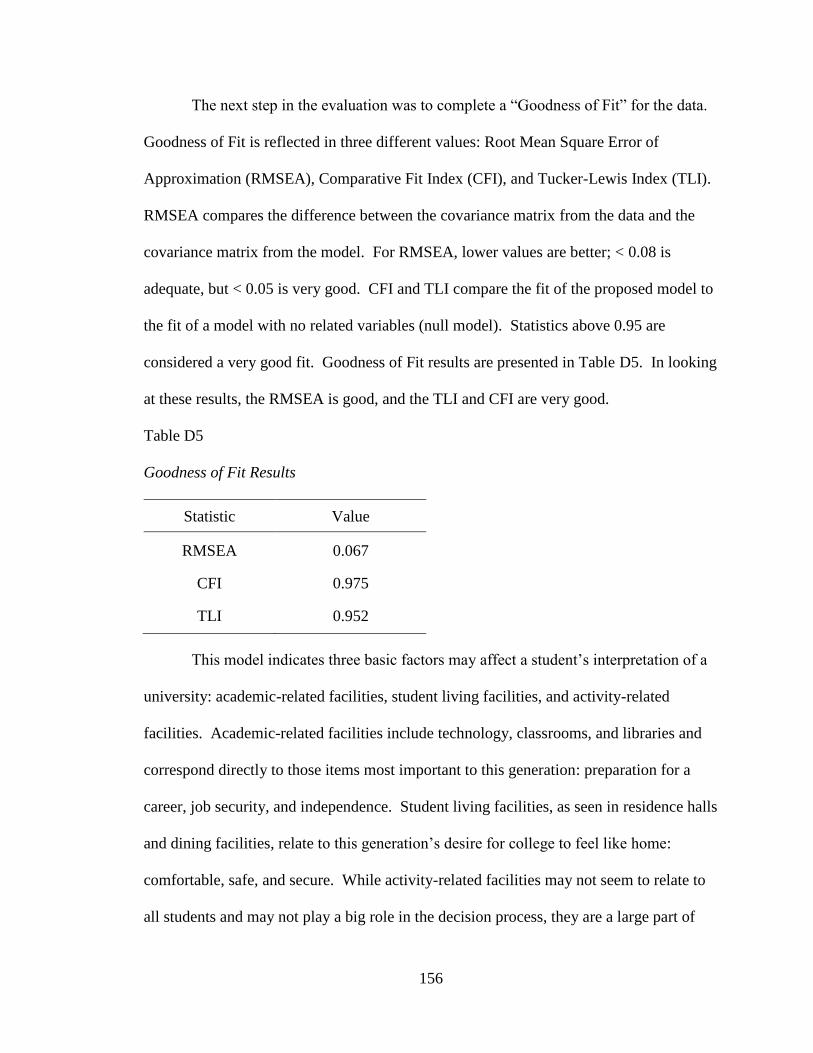
156
The next step in the evaluation was to complete a “Goodness of Fit” for the data.
Goodness of Fit is reflected in three different values: Root Mean Square Error of
Approximation (RMSEA), Comparative Fit Index (CFI), and Tucker-Lewis Index (TLI).
RMSEA compares the difference between the covariance matrix from the data and the
covariance matrix from the model. For RMSEA, lower values are better; < 0.08 is
adequate, but < 0.05 is very good. CFI and TLI compare the fit of the proposed model to
the fit of a model with no related variables (null model). Statistics above 0.95 are
considered a very good fit. Goodness of Fit results are presented in Table D5. In looking
at these results, the RMSEA is good, and the TLI and CFI are very good.
Table D5
Goodness of Fit Results
Statistic Value
RMSEA 0.067
CFI 0.975
TLI 0.952
This model indicates three basic factors may affect a student’s interpretation of a
university: academic-related facilities, student living facilities, and activity-related
facilities. Academic-related facilities include technology, classrooms, and libraries and
correspond directly to those items most important to this generation: preparation for a
career, job security, and independence. Student living facilities, as seen in residence halls
and dining facilities, relate to this generation’s desire for college to feel like home:
comfortable, safe, and secure. While activity-related facilities may not seem to relate to
all students and may not play a big role in the decision process, they are a large part of

157
the college tradition and “branding.” All students may not play sports, but they identify
with the teams on a personal level.