the impact of corporate social responsibility on default ... 2.pdf · the impact of corporate...
TRANSCRIPT

Business & Economic Review: Vol. 9, No. 3 2017 pp. 36-70 DOI: dx.doi.org/10.22547/BER/9.3.2
36
The Impact of Corporate Social Responsibility on Default Risk: Empirical evidence from US Firmsa
Muhammad Suhail Rizwan1, Asifa Obaid2, Dawood Ashraf3
Abstract
This paper investigates the risk mitigation effects of engagement in corporate social responsibility (CSR) activities by using data from 1,119 non-financial US firms between 2000 and 2012. We find evidence that firms with higher CSR activity scores experience lower probability-of-default. However, the credit mitigation effect of CSR is more pronounced with activities related to primary stakeholders (employee relations, product quality, diversity, and governance). Engagement in secondary (institutional) CSR activities (environmental and community related) are not significant in this relationship. We found that the dotcom crisis (2001-02) and the financial crisis (2007-08) substantially increased default probabilities. This study provides robust evidence that engagement and disclosure of CSR-related activities reduces credit risk suggesting that both management and investors can use socially responsible behavior as a pricing factor.
Keywords: CSR, Probability-of-default (PD), principal component analysis (PCA), beta regression
1 NUST Business School (NBS), National University of Sciences and Technology, Islamabad, Pakistan. Email: [email protected] 2 NUST Business School (NBS), National University of Sciences and Technology, Islamabad, Pakistan. Email: [email protected] 3 Islamic Research & Training Institute (A member of Islamic Development Bank Group), Jeddah, Kingdom of Saudi Arabia. a Acknowledgments: We would like to thank Dr. Barbara Marie L’Huillier, Professor Ishaq Bhatti, and participants of NBS PhD seminar for their valuable feedback on an earlier draft. We would also like to thank the Chief Editor (Dr. Attaullah Shah), and two anonymous referees for their helpful comments and suggestions that enabled us to improve the quality of this paper considerably. The views expressed in this paper are those of the author(s) and do not necessarily reflect the views of the Islamic Research and Training Institute or the Islamic Development Bank Group. All the remaining errors are the responsibility of the authors ARTICLE HISTORY
21 Mar, 2017 Submission Received 07 May, 2017 First Review 09 May, 2017 Revised Version Received 14 Jun, 2017 Second Review 19 Jun, 2017 Revised Version Received 30 Jun, 2017 Accepted

Muhammad Suhail Rizwan, Asifa Obaid, Dawood Ashraf
37
1. Introduction
For a firm’s sustainable and long-term profitability, environmental, social, and governance (ESG) issues are top of the agenda for most CEOs recently surveyed by Price Waterhouse Coopers4. This implies that catering for ESG concerns may have a positive impact on the financial performance of firms.5 Although there is a significant amount of research available on the impact of CSR on corporate performance, its effect on firms is still not completely understood. The positive impact of ESG-related activities could be ‘wealth enhancing’ and/or ‘risk mitigating’.
Empirical evidence on the wealth-enhancing function of CSR is, at best, mixed. Findings range from a positive association (Hillman & Keim, 2001), to a negative association (Brammer, Brooks & Pavelin, 2006) to a neutral association (Renneboog, Horst & Zhang, 2008; Bauer, Koedijk & Otten, 2005) between the level of CSR engagement and financial performance of firms. While from a risk-mitigating perspective, Kytle and Ruggie (2005) suggest that firms can reduce their level of riskiness by pro-actively engaging in social risk management through CSR. Other studies found decreased financial risk (Jiraporn, Jiraporn, Boeprasert & Chang., 2014; Oikonomou, Brooks & Pavelin, 2012), and lower cost of equity capital (El Ghoul, Guedhami, Kwok & Mishra, 2011).
Proponents of agency theory challenge the effectiveness of CSR and consider it to be a potential conflict of interest among managers and shareholders. Barnea and Rubin (2010) argue that a firm’s insiders (managers and large block-holders) over-invest in CSR for their private benefit to improve their reputation as good global citizens. Furthermore, Sprinkle and Maines (2010) suggest that CSR-related cash outflow requirements may result in opportunity costs that harm the profit maximization goal of an organization.
In a recent study Jiraporn et al. (2014) found a positive relationship between CSR and credit ratings. They found that firms with better CSR scores enjoy higher credit ratings from the same industry and geographical region. However, the use
4 Survey results are available at http://www.pwc.com/gx/en/ceo-survey/2014/sustainability-perspective. html 5 In the empirical literature, ESG-related issues are generally researched under a broader term of corporate social responsibility (CSR). For the purposes of this paper, we use the term CSR as a synonym for ESG.
Muhammad Suhail Rizwan, Asifa Obaid, Dawood Ashraf
38
of credit ratings as a proxy for the probability-of-default is not appreciated due to its simplified approach based on publicly available information that does not include information on systematic risk and uncertainty (Hilscher & Wilson, 2013). Furthermore, the use of credit ratings as a proxy for credit risk not only reduces the number of observations but also does not take into consideration the dynamic nature of a firm’s behavior over the period. Rösch and Scheule (2014) and Ashraf and Goddard (2012) also suggest that credit ratings are an incorrect measure of credit risk because they failed to predict corporate failure during the recent global financial crisis. This paper contributes to the literature on the impact of engagement in CSR-related activities on the credit risk of non-financial US firms using the probability-of-default as a proxy for credit risk using the Merton (1974) model6. Probability-of-default is considered a superior measure as compared to credit ratings or a simple credit score card approach as found by Hilscher and Wilson, (2013). Credit ratings suffer from irregularity in updating while a simple credit score card approach relies on accounting information and, as such, are exposed to the possibility of manipulation. Probability-of-default capitalizes on market information which is frequently updated and is not exposed to any manipulations (Byström, 2003).
In this paper, we consider both risk mitigation and the agency theory view of CSR and develop our hypotheses accordingly. By using dynamic panel data methodology on a sample of 1,119 US non-financial firms for the period 2000 to 2012, we found evidence that suggests CSR helped reduce credit risk as measured by their probability-of-default. The empirical evidence contradicts the agency view of engagement in CSR activities and supports the wealth protection function of CSR activities. We also found that the credit risk of firms increased substantially during the dotcom (2001-02) and financial (2007-08) crises. By splitting CSR into technical (primary stakeholders related) and institutional (secondary stakeholders related) CSR, we found robust evidence to suggest that technical CSR (TCSR) has a significantly negative effect on credit risk while institutional CSR (ICSR) has an insignificant relationship with credit risk.
This study extends the work of Jiraporn et al. (2014) by linking CSR and credit risk literature. We estimated the probability-of-default for non-financial US
6 To the best of the authors’ knowledge, there is no prior study that has investigated CSR and the credit risk relationship by using the probability-of-default as a proxy for credit risk.

Muhammad Suhail Rizwan, Asifa Obaid, Dawood Ashraf
39
firms during a time period spanning two crisis periods that provided an interesting comparison of magnitude and severity of both these crises. By using a beta regression model, we find evidence that suggests that a higher level of CSR engagement significantly decreases the probablity-of-default in our sample firms. In terms of severity, we found that the probablity of default was considerably higher during the global financial crisis as compared with the dotcom bubble crisis. Furthermore, we investigated the effect of technical and institutional CSR separately and concluded that only technical CSR is significant and relevant in performing an insurance-type function.
In terms of policy implications, these findings are valuable for equity investors as well as bond investors. In addition to wealth protection benefits, engagement in CSR-related activities might help improve credit terms whereby investors may allow a discount for engagement in CSR-related activities when computing their required rate-of-return. Furthermore, management can view the engagement in CSR activities as a signal to mitigate default risk and reduce the cost of capital.
The rest of the paper is organized as follows. Section two provides a literature review and develops the testable hypotheses. Section three develops the econometric methodology and defines variables for empirical analysis. Section four presents data sources and descriptive statistics. Empirical results are discussed in section five and section six concludes the paper.
2. Literature Review
Literature relating to the relationship between CSR and financial performance of firms is based on several arguments. Those who argue about the positive impact of engagement in CSR-related activities on firms generally fall into two categories depending upon their ontological preferences. There are those that adopt the stakeholder maximization view of CSR from a wealth-maximization and risk mitigation perspective. Others view CSR as an agency problem whereby management use CSR-related activities for the building of their own personal image rather than striving for the profit maximization goal of the firm (Reinhardt, Stavins & Vietor, 2008).

Muhammad Suhail Rizwan, Asifa Obaid, Dawood Ashraf
40
The stakeholder maximization view of CSR suggests that a firm’s voluntary participation in socially responsible activities not only maximizes shareholder value (wealth maximization) but also helps a broader group of stakeholders (Jiraporn et al., 2014). Firms that are more socially responsible and who cater to the needs of other stakeholders enjoy better stock valuation (Jiao, 2010; Benson & Davidson, 2010), elicit more favorable stock market reactions (Atkas, Bodt & Cousin, 2011) and have higher acquisition announcement returns (Deng, Kang & Low, 2013). Gardberg and Fombrun (2006) suggest that the improved reputation that is gained by investment in CSR is strategic in nature and helps companies to penetrate international markets. Godfrey, Merrill and Hansen, (2009), using a dataset of 254 negative events from 91 firms between 1992 to 2003, found that engagement in CSR activities acts like an ‘insurance’ especially for negative events. Their empirical findings suggest that firms with better (low) CSR engagement suffered lower (more) losses during a negative event.
Aside from a wealth-enhancing function, socially responsible behavior may serve as a risk mitigating function in the form of lower financial risks. The risk mitigation view suggests that by engaging in CSR-related activities management is signaling a long-term sustainable view of the corporation. Any increase in perceived social responsibility may enhance the reputation of the firm and the market may perceive it as a risk mitigating factor7. Alternatively, investors may view the investment in socially irresponsible firms to be riskier and may demand a higher premium for the possibility of law suits or fines from regulatory agencies. McGuire, Sundgren and Schneeweis (1988), by utilizing Fortune magazine’s reputation ratings, found that past performance and default risk are highly correlated with the firm’s perception of social responsibility. They also found that firms low in social responsibility experience lower returns on their assets.
El Ghoul et al. (2011) found that firms with better CSR performance, as measured by CSR scores using the KLD STATS8 database, enjoy lower costs of
7 By engaging in CSR activities firms can reduce the chances of law suits and fines for socially irresponsible behavior. 8 Kinder Lydenberg Domini (KLD STATS) is created and maintained by KLD Research & Analytics Inc. (KLD))
Muhammad Suhail Rizwan, Asifa Obaid, Dawood Ashraf
41
equity. They suggest that improvement in social responsibility in terms of employee relations, environmental policies, product quality, and safety exert downward pressure on the cost of equity. Similarly, Goss and Roberts (2011), using a sample of 3,996 loan contracts to large US firms and CSR data from KLD Stat, provide robust evidence that socially irresponsible firms pay 7 to 18 base points more on their loans as compared with perceived socially responsible firms.
The academic literature has primarily focused on the relationship between CSR and the measure of financial risk management such as the cost of capital (El Ghoul et al., 2011; Goss & Roberts, 2011) or variance in earnings and stock returns (Spicer, 1978). However, there is a little research on the impact of CSR on the probability-of-default of socially responsible firms.
Sun and Cui (2013), by using the credit ratings of 303 companies from Standard & Poors for the period 2008 to 2010, found that firms with better CSR engagements enjoyed improved credit ratings. Likewise, Jiraporn et al. (2014) reported a positive relationship between credit ratings and CSR scores. However, Hilscher and Wilson (2013) criticized the use of credit ratings as a proxy for the probability-of-default due to the fact that credit ratings are based on a simple model of publicly available information and does not include information on systematic risk and uncertainty. To overcome this shortcoming, we use the probability-of-default based on the Merton (1974) model and hypothesize whether the active engagement in CSR-related activities leads to lower default risk or not.
H1: Credit risk of socially responsible firms decreases with higher engagement in CSR activities.
Freeman, Harrison and Wicks (2008) categorized corporate stakeholders into two groups: primary stakeholders – those who are necessary for the organization and, secondary stakeholders – those who can influence primary stakeholders. Mattingly and Berman (2006) provided empirical evidence to support such a classification for CSR-related stakeholders into technical CSR and institutional CSR using the KLD database. Technical CSR (TCSR) is linked with primary stakeholders that include employee relations, product quality, diversity and governance. Institutional CSR (ICSR) is related to secondary stakeholders

Muhammad Suhail Rizwan, Asifa Obaid, Dawood Ashraf
42
and includes environmental and community-related CSR disclosures. Both TSCR and ICSR potentially reduce relative riskiness and may have a positive wealth protection impact on firms. However, TCSR that is related to primary stakeholders seem more relevant in CSR credit risk relationships and may act like insurance during times of adverse events (Godfrey et al., 2009). Based on this argument, we hypothesize that both TCSR and ICSR are negatively related to the probability-of-default. However, we anticipate that the effect of TCSR may have greater magnitude and significance. We hypothesize that:
H2: All else being the same, TCSR has an inverse relationship with probability-of-default.
H3: All else being the same, ICSR has an inverse relationship with probability-of-default.
The engagement in CSR may cause a conflict of interest between management and shareholders. Management, as an insider, may gain from the positive aspects of CSR and ignore the long-term profit maximization objectives of the corporation (Barnea & Rubin, 2010). Sprinkle and Maines (2010) argued that although broad stakeholder groups demand socially responsible firms they are not in favor of firms abandoning their profit maximization goals. Cash outflow requirements of CSR may result in opportunity costs that potentially harm the profit maximization goal of the organization. Barnea and Rubin (2010) found a dampening effect of engagement in CSR on cash flows and it can limit a firm’s ability to pay off its debt obligations. Based on agency theory we hypothesize;
H4: All else being equal, a firm’s probability-of-default increases with higher engagement in CSR.
3. Covariate Definitions
For testing the hypotheses developed in section two we developed the following covariates.

Muhammad Suhail Rizwan, Asifa Obaid, Dawood Ashraf
43
3.1 Probability-of-default (PDit)
Default risk is the probability that a firm may not be able to make a promised payment whether principle and/or interest. Empirical literature9 often uses credit ratings as a proxy for default risk due to easy access and is widely used by creditors and investors. During the recent global financial crisis using the credit rating as a proxy for default risk was heavily criticized by regulators and investors due to its inability to predict corporate failures. In a few cases, regulators took action against credit ratings agencies such as when the U.S. government sued S&P over pre-crisis fraud10. From the perspective of regulators, credit ratings have loopholes that can have an impact on investment decisions. As a result, regulators called for alternatives to credit ratings in such decisions (Hilscher & Wilson, 2013). Hilscher and Wilson (2013) found that ratings are poor predictors of corporate failure when they compared estimated default probabilities with the ability of failure prediction by credit ratings. Due to these short-comings we develop the probability-of-default variable using the Merton (1974) model.
Merton (1974)11 suggests that the equity of a firm is equivalent to a long position in a call option on the assets of the firm. By using this equivalence, he derives asset volatility of a firm and associated market values of underlying assets. More accurately, Merton (1974) used the Black and Scholes (1973) framework to solve for underlying asset value and volatility indicated by the price and volatility of an option. Consequently, asset value and volatility can be combined into a risk measure called ‘distance-to-default’ which is a measure of creditworthiness of an equity-issuing firm.
The Merton (1974) model attaches market values of equity and assets in the following way: = ( ) − ( ) ( ) (1)
Here, is market value of the equity, is market value of a firm’s assets, D is the total amount of a firm’s debts, T-t is time to maturity of the debt, r is the risk free rate, (. ) is cumulative normal distribution, and are defined as:
9 We note that credit ratings are often used as proxies for default probability. See for example, West (1970), Blume, Lim and MacKinlay (1998), Krahnen and Weber (2001), Loffler (2004), Molina (2005), and Avramov, Chordia, Jostova and Philipow (2009). 10 Section 939A of the Dodd-Frank Act (2010) calls for federal agencies to review regulations containing any references or requirements regarding credit ratings. In February of 2013 the U.S. Department of Justice sued S&P. 11 For model derivation and background working, please refer to Merton (1974) and Byström (2003).

Muhammad Suhail Rizwan, Asifa Obaid, Dawood Ashraf
44
= ( )( )( ) (2)
= − ( − ) (3)
In this model, the firm is presumed to have an uncomplicated capital structure comprising of a single homogenous class of debt and leftover equity. The debt is to mature at time T. In addition, it can be shown that equity and asset volatility are related: = ( ) (4)
where, is the volatility of a firm’s equity returns and is the volatility of a firm’s asset returns.
Solving non-linear system of equations (2) and (5) gives and and ‘distance-to-default’ (DD) as;
= ( )( )( ) (5)
DDM is the distance-to-default and is the number of standard deviations that the value of the firm is from the point of default. A small value of DDM reflects a higher probability-of-default. The distance-to-default can be delineated into a (risk neutral) probability-of-default or, it can be used to categorize individual firms according to their creditworthiness.
DDM from equation (5) contains more than two unknowns and needs to be solved through optimization. Byström (2003) suggested a simplified approach to solve equation (5) for the distance-to-default. The simplified version contains all determinable parameters hence distance-to-default can be measured without solving for unknown parameters. This simplification is based on three assumptions;
1) The magnitude of the drift term ( − )( − ) is ‘small’
2) It has been assumed that ℕ( ) is ‘close to one’
3) Face value of debt has been used to calculate the leverage ratio i.e.
Byström (2003) provides the rationale behind each of these assumptions. Assumption one has two rationales. First, in most practical situations ‘drift term’

Muhammad Suhail Rizwan, Asifa Obaid, Dawood Ashraf
45
turned out to be very small as compared to first term ln . Second, empirically
it is very difficult to estimate the actual drift rate of stocks and other assets. Therefore, the ‘drift-term’ is usually assumed to be zero. The rationale for assumption two is based on the extreme event scenario where is close to D (option is almost at-the-money) and the underlying volatility of assets is very high then ℕ( ) is different from one. The third assumption is based on the view that the amount paid against debt settlement is the ‘book value’ and not the ‘market value’.
Capitalizing on the first assumption that ‘drift term’ is very small compared to the first term and by utilizing the common notion that time-to-maturity of the debt is one year, equation (5) can be reduced to: = ( ⁄ )
(6)
If is further replaced with and that the third assumption of ℕ( ) is
close to one then: = ( ⁄ )⁄ (7)
Ultimately, if leverage is defined as = then a simplified expression of
distance-to-default can be written as: = ( ⁄ )( ) = ( )( ) (8)
Equation (8) contains all the observable parameters which can be used to estimate distance-to-default. Probability-of-default can be estimated from distance-to-default by: = (− ) (9)
3.2 Measurement of engagement in corporate social responsibility
In recent literature, an additive index of strength and weaknesses is used as a proxy to determine the level of CSR activities among non-financial firms.12 Under this method, a CSR score is obtained by subtracting the cumulative
12 Oikonomou et al. (2012); Godfrey et al. (2009); Bae, Kang and Wang (2011); Verwijmeren and Derwall (2010); and El Ghoul et al. (2011) all used an index of CSR activities to build on the additive rule.

Muhammad Suhail Rizwan, Asifa Obaid, Dawood Ashraf
46
concerns score from cumulative strengths score of each company and mathematically written as:
, = ∑ _ − ∑ _ (10)
Where f indicates the number of indicators used for the construction of the index, comp_strfct, and comp_confct are cumulative strengths and weaknesses of indicators respectively. Deng et al. (2013) argued that the calculation of CSR scores based on cumulative scores is biased in terms of the number of indicators in every CSR aspect. Aspects having more indicators will get more weightage in the net score using the additive rule. To remove the additive bias Deng et al. (2013) divided the cumulative ‘Raw score’ by the number of aspects in each indicator.
, = ∑ ∑ _ , ,# _ , , − ∑ ∑ _ , ,# _ , , (11)
Although this methodology helped to alleviate the additive bias it still treats every indicator equally. Under both approaches CSR scores are ordinal and provide only the relative performance score of every firm but not the variation. To address this concern, we use the principal component analysis (PCA) approach for the construction of CSR scores. The PCA approach not only provides a relative performance matrix but also explains the maximum variation by assigning weights to each component based on relative correlation (Goss & Roberts, 2011).
For principal component analysis, we used the algorithmic approach of Cutter, Boruff and Shirley (2003). We computed CSR score using standardized data as proposed by Schmidtlein, Deutsch, Piegorsch and Cutter (2008)13. After the standardization of data, we applied PCA that provided the orthogonal components. These orthogonal components are linear combinations of all input standardized variables. The first component is a linear combination of all the variables that explain maximum variation. The second component contains second maximum variation and so on. For selection criteria, we used the Kaiser (1960) criterion to select a parsimonious subset of components. We constructed three separate PCA indexes. The first component index explains the maximum
13 Data standardization is highly recommended due to its sensitivity with input variables.
Muhammad Suhail Rizwan, Asifa Obaid, Dawood Ashraf
47
variation in the input variables (Goss & Roberts, 2011). The second PCA index is an equal-weighted index using equal weights to selected components. The third PCA index is constructed by assigning weights to each of the selected components according to the proportion of their explanatory power. Empirical estimations are provided based on all three indexes. However, we do not expect any major differences in the explanatory power of these indexes. The next subsection explains other control variables used in the empirical analysis.
3.3 Other control variables
Following the existing literature on default risk we use the following control variables that can affect the credit risk of a firm.
3.3.1 Size (SIZEit)
The size of a firm can play an important role in terms of its stability. Bouzouita and Young (1998) found that managers of firms that are larger in size are usually more experienced, have better access to capital markets, and the firms can benefit from economies of scale. Their findings support the earlier work of Ben-Zion and Shalit (1975) who argued that since large firms grow over a long period of time it follows that firm size is a mirror of its past performance which is a potential indicator of future performance hence, its risk. To control for the size of a firm, we use the log of Total Assets (SIZEit). We expect a negative coefficient of SIZEit with probability-of-default.
3.3.2 Leverage (LEVit)
Merton (1974) suggests that highly leveraged firms have a higher probability-of-default especially during periods of stress. To control for the impact of leverage, we use the ratio of total debt to the sum of total liabilities plus the market value of the firm’s equity (LEVit). We anticipate a positive coefficient of LEVit with probability-of-default.
3.3.3 Profitability (ROAit)
Firms with higher profitability may have lower probability-of-default on their obligations. Higher profitability may lead to higher cash flows that can be
Muhammad Suhail Rizwan, Asifa Obaid, Dawood Ashraf
48
used to pay for the financial obligations of firms resulting in a lower probability-of-default. Following Jiraporn et al. (2014) we control for profitability by taking the return of assets (ROAit) as a measure to gauge profitability. We anticipate a negative coefficient of ROAit with PDit.
3.3.4 Future growth (MBit)
Improving future prospects of a firm’s growth and profitability decrease the likelihood that the firm’s value will hit the default threshold. Empirical literature usually applies the ratio of market-value equity to book-value of equity (market-to-book) to identify companies with positive future growth potentials. Murcia, Murcia, Rover and Borba (2014) reported a positive association between market-to-book ratio and credit ratings of firms. Similarly, Pastor and Veronesi (2003) provided theoretical as well as empirical evidence that the market-to-book ratio of firms increase as expected profitability increase. Following Pastor and Veronesi (2003) we used the market-to-book ratio (MBit) as a measure of future growth potential of a firm. We anticipated a negative coefficient of MBit with probability-of-default.
3.3.5 Systematic risk (BETAit)
Johnson, Chebonenko, Cunha, D’Almeida, and Spencer (2011) suggest that there is a negative relationship between default risk and expected stock returns. Variation in stock returns reflects the market view of relative riskiness of firms relative to the market. Investors require higher returns from those firms with higher systematic risk that can lead to bankruptcy14. To control for the impact of systematic risk, we use the beta of each stock calculated from the capital asset pricing model using the S&P500 index as a benchmark. We expected a positive coefficient of BETAit with the probability-of-default.
3.3.6 Dotcom and financial crises (I.Crisi & F.Crisis)
The dotcom crisis in 2002 and the economic meltdown during the 2007-09 financial crisis increased risk specifically for those firms operating in the IT and financial sectors and linked industries generally. We anticipated a dampening 14 Higher required rate-of -returns makes it difficult for companies to raise new capital or issue new debt.

Muhammad Suhail Rizwan, Asifa Obaid, Dawood Ashraf
49
effect of both these crises on a firm’s credibility and hence an increase in the credit risk of firms. We control for the dotcom and financial crisis with dummies taking values of 1 during 2002 and 2007-09 respectively, and zero otherwise.
4. Data Sources and Descriptive Statistics
In this section, we describe the sources of data used in the empirical analysis and present a summary of descriptive statistics. The sample is comprised of annual data from all non-financial firms reporting on the KLD Research and Analytics (KLD) database from 2000 to 2012. Waddock and Graves (1997) considered KLD STATS data as a standard database of corporate social responsibility.
KLD ranks companies in thirteen dimensions of CSR: community, diversity, governance, employee relations, human rights, environment, product, alcohol, gambling, firearms, military, tobacco, and nuclear power. From these dimensions, the first seven dimensions have data in the form of strengths and concerns while the remaining six dimensions are dichotomous variables having a score 1 if the company is involved in any of the above businesses and zero otherwise. Under the first seven dimensions, companies can receive ‘strength’ scores for better performance in a particular aspect of social responsibility while it can have weakness/concern for socially irresponsible behavior in a particular aspect. We developed a socially responsible index by using these seven aspects after excluding firms from the banking and insurance industries due to their regulated natures. Annual financial statement data and daily stock price data is obtained from DataStream.
KLD database consists of a total of 32,232 firm-year observations with 660 firms reporting CSR-related disclosures in year 2000 that increased to 3,034 firms in 2012. After matching these firms with financial and stock price data, we got a final sample of 1,119 firms. As our sample has large positive or negative outliers we winsorized its covariates at the 1st and 99th percentile of their respective distributions. To avoid survivorship bias entry into, and exit from, the sample was not restricted.
Muhammad Suhail Rizwan, Asifa Obaid, Dawood Ashraf
50
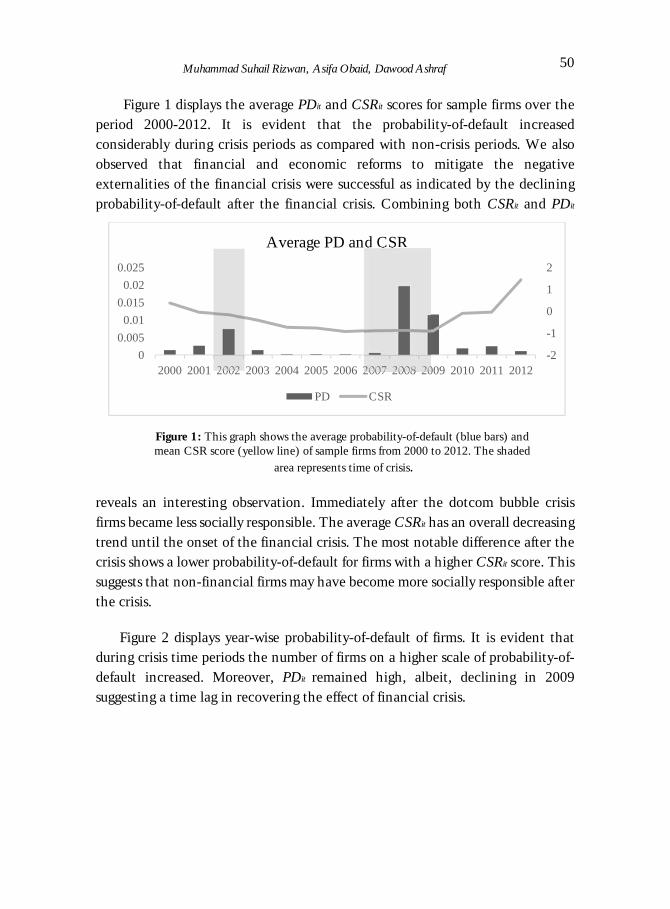
Figure 1 displays the average PDit and CSRit scores for sample firms over the period 2000-2012. It is evident that the probability-of-default increased considerably during crisis periods as compared with non-crisis periods. We also observed that financial and economic reforms to mitigate the negative externalities of the financial crisis were successful as indicated by the declining probability-of-default after the financial crisis. Combining both CSRit and PDit
reveals an interesting observation. Immediately after the dotcom bubble crisis firms became less socially responsible. The average CSRit has an overall decreasing trend until the onset of the financial crisis. The most notable difference after the crisis shows a lower probability-of-default for firms with a higher CSRit score. This suggests that non-financial firms may have become more socially responsible after the crisis.
Figure 2 displays year-wise probability-of-default of firms. It is evident that during crisis time periods the number of firms on a higher scale of probability-of-default increased. Moreover, PDit remained high, albeit, declining in 2009 suggesting a time lag in recovering the effect of financial crisis.
Figure 1: This graph shows the average probability-of-default (blue bars) and mean CSR score (yellow line) of sample firms from 2000 to 2012. The shaded
area represents time of crisis.
-2
-1
0
1
2
00.0050.01
0.0150.02
0.025
2000 2001 2002 2003 2004 2005 2006 2007 2008 2009 2010 2011 2012
Average PD and CSR
PD CSR

Muhammad Suhail Rizwan, Asifa Obaid, Dawood Ashraf
51
Figure 2: This graph show year-wise probability-of-default of non-financial US firms. Data is from 2000 to 2012.
Table 1 reports the descriptive statistics for variables used in this study. On average, the probability-of-default (PDit) of firms in the sample is 0.38% and ranges from 0 to 30%. The mean of CSR, based on simple arithmetic (CSRraw and CSRadj), are negative. While the average CSR using the PCA method is much smaller it reflects similar variations suggesting a diversity of CSR practices within the sample. The lower CSR scores based on the PCA method confirms the suitability of using the PCA approach for the computation of CSR indices. Among other control variables, the average of market multiples (MBit) stands at 2.86 suggesting that most companies are trading at higher multiples than the book value of their equity. On average, firms in the sample have leverage (LEVit) of about 16% ranging from no long-term liabilities to 59% long term liabilities as compared with the sum of the book-value of liabilities and market-value of equity. A lower leverage ratio reflects the conservative nature of the sample firms. This can be confirmed with the level of systematic risk assumed by the sample firms as measured by the BETAit. On average, firms in the sample have a BETAit of 0.89 which shows that the systematic risk of firms is close to market risk. However, there are firms with BETAit >1 showing higher risk as compared with the market. Firms in the sample on average have profitability, measured by return-on-assets (ROAit), of 3%.

Muhammad Suhail Rizwan, Asifa Obaid, Dawood Ashraf
52
Table 2 shows a correlation of all the variables. CSRit and PDit have a negative correlation irrespective of the CSR measure used. The correlation matrix provides a crude indication of the risk mitigation function of CSR through the negative
Table 1: D
escriptive Statistics
-------------------Quintiles-----------------
Variable
Definition
Obs.
Mean
S.D.
Min
0.25 M
edian 0.75
Max
PDit
Probability of default 10787
.0038 0.02
0 1.16e-28
3.43e-14 6.47e-07
0.30 D
Dit
Log of Distance to default
10787 1.96
0.65 -0.65
1.57 2.01
2.40 6.44
CSR
Rit
CSR
-Raw
score 10787
-0.42 2.69
-7.00 -2.00
-1.00 1.00
9.00 C
SRA
it C
SR-A
djusted score 10787
-0.17 0.67
-1.67 -0.53
-0.20 0.07
2.50 C
SRF
it C
SR-First com
ponent of PCA
10787
-0.01 0.99
-2.63 -0.45
-0.06 0.30
3.70
CSR
Eit
CSR
-Equally weighted com
ponents of PC
A
10787 -0.06
1.39 -5.14
-0.53 0.20
0.67 3.46
CSR
Wit
CSR
- Weighted com
ponents of PCA
10787
-0.03 0.7
-2.54 -0.26
0.10 0.32
1.77
TC
SRE
it T
echnical CSR
- Equally weighted
components of PC
A
10787 -0.02
2.16 -4.66
-1.49 -0.03
1.25 6.59
ICSR
Eit
Institutional CSR
- Equally weighted
components of PC
A
10787 -0.11
2.24 -7.81
-0.07 -0.07
-0.07 7.73
TC
SRR
it T
echnical CSR
- Raw
Score 10787
-0.39 1.99
-5.00 -2.00
-1.00 1.00
6.00 IC
SRR
it Institutional C
SR- R
aw Score
10787 -0.01
1.32 -4.00
0 0
0 5.00
TC
SRA
it T
echnical CSR
- Adjusted Score
10787 -0.17
0.49 -1.26
-0.5 -0.20
0.02 1.51
ICSR
Ait
Institutional CSR
- Adjusted Score
10787 0.01
0.31 -0.88
0 0
0 1.33
SIZEit
Size of Firm-Log of T
otal Assets
10787 7.76
1.55 2.68
6.64 7.65
8.78 13.59
LEV
it Leverage
10764 0.16
0.13 0
0.06 0.14
0.24 0.59
RO
Ait
Return of A
ssets 10787
0.03 0.15
-4.58 0.01
0.05 0.08
1.91 M
Bit
Market-to-B
ook Ratio
10764 2.8
3.17 -7.35
1.41 2.09
3.31 19.65
BE
TA
it System
atic Risk using M
arket Model
(S&P 500)
10787 0.89
0.4 0.05
0.61 0.86
1.13 2.12

Muhammad Suhail Rizwan, Asifa Obaid, Dawood Ashraf
53
association with default risk. The signs of other control variables are generally in line with expectations. MBit, SIZEit, ROAit and ADTRit are negatively correlated with PDit, while LEVit and BETAit are positively correlated with PDit. This table shows the descriptive statistics of all variables; contains data from 2000 to 2012. All variable definitions are provided in column 2.
Table 3 shows the descriptive statistics of non-dummy variables based upon three quintiles of Raw CSR scores. Also, annual stock returns and Sharpe Ratio comparison of firms has been provided based upon three CSR quintiles, for whole of the sample time-period, and during financial and dotcom crisis. Stock returns and Sharpe ratios based on CSR quintiles suggest an inverse U relationship where firms in the lower and the top CSR quintiles exhibit lower returns and lower Sharpe ratio with firms with median CSR score shows highest nominal and risk-adjusted returns suggesting that the market views engagement in CSR activities differently.

Muhammad Suhail Rizwan, Asifa Obaid, Dawood Ashraf
54 T
able 2: Correlation M
atrix
PD
it D
Dit
CSR
Rit
CSR
A,it
CSR
Fit
CSR
Eit
CSR
Wit
SIZE
it L
EV
it R
OA
it M
Bit
DD
it -0.4912*
1
CSR
Rit
-0.0659* 0.1870*
1
C
SRA
,it -0.0578*
0.1605* 0.9114*
1
CSR
Fit
-0.0612* 0.1724*
0.9447* 0.8758*
1
C
SRE
it -0.0381*
0.0403* 0.6128*
0.6550* 0.7012*
1
CSR
Wit
-0.0404* 0.0493*
0.6438* 0.6798*
0.7316* 0.9990*
1
SIZE
it -0.0185*
0.0689* 0.1175*
0.0623* 0.0548*
-0.3550* -0.3362*
1
LEV
it 0.3430*
-0.6605* -0.1373*
-0.1011* -0.1350*
-0.0878* -0.0925*
0.1861* 1
RO
Ait
-0.2419* 0.3527*
0.0736* 0.0660*
0.0632* -0.0129
-0.0085 0.1744*
-0.1961* 1
M
Bit
-0.0918* 0.2224*
0.1158* 0.0794*
0.1060* 0.0219*
0.0274* -0.0200*
-0.2344* 0.0818*
1 B
ET
Ait
0.2328* -0.4617*
-0.1151* -0.0782*
-0.0798* 0.1350*
0.1243* -0.3419*
0.0660* -0.2435*
-0.0807*
This table show
s the correlation among all variables; contains data from
2000 to 2012. Variables are defined in
column 2 of T
able 1.
Table 3: D
escriptive Statistics of Variables B
ased Upon T
hree Quintiles
First Q
uintile Second Q
uintile T
hird Quintile
Variable
Mean
Std. Dev.
Mean
Std. Dev.
Mean
Std. Dev.
PD
0.008 0.041
0.005 0.031
0.004 0.033
SIZE 7.759
1.484 7.400
1.372 8.332
1.577 LEV
0.173
0.132 0.159
0.128 0.141
0.113 R
OA
0.028
0.141 0.025
0.113 0.049
0.095 M
B
2.760 2.696
2.850 2.767
3.425 3.196
BET
A
0.917 0.398
0.917 0.393
0.796 0.390
Stock Returns (annual)
3.303 48.482
6.592 47.139
3.597 41.713
Stock Returns (annual) during FC
-31.384
58.168 -36.541
59.752 -30.197
54.196 Stock R
eturns (annual) during IC
-17.601 48.212
-9.863 47.810
-12.653 42.794
Sharpe Ratio
0.157 0.918
0.226 0.912
0.162 0.879
Sharpe Ratio during FC
-0.464
0.915 -0.558
0.925 -0.538
0.871 Sharpe R
atio during IC
-0.304 0.723
-0.133 0.700
-0.260 0.710
This table reports the descriptive statistics of variables based upon three quintiles of R
aw C
SR scores and quintile-w
ise stock return (in percentage) and Sharpe ratio com
parison.

Muhammad Suhail Rizwan, Asifa Obaid, Dawood Ashraf
55
Table 4 shows the sector-wise descriptive statistics of Probability-of-Default during Non-Crisis, Financial Crisis and Dotcom Crisis time periods. It is evident that during the financial crisis the construction sector shows maximum average probability-of-default. This is in line with the fact that the financial crisis was caused by sub-prime mortgages and resulted into a sharp decline in construction businesses. Mining, transportation, and wholesale sectors show increased default risk during the dotcom crisis.
The descriptive statistics and graphical representation of the PD-CSR relationship in Figure 1 and correlation matrix provides support for the risk mitigation function of CSR and requires further investigation. The next section provides a discussion on the empirical results obtained from the model developed in section three.
5. Methodology
Selection of a suitable statistical technique is the Achilles heel of data analysis. Considering the importance of this fact we did a preliminary analysis on the distributional properties of probability-of-default. Figure 3 shows the probability density diagram of probability-of-default. Two distinctive features can be observed from Figure 3; probability-of-default is bounded between 0 and 1, and probability distribution is highly skewed toward zero.
Table 4: Sector-Wise Descriptive Statistics of Probability-of-Default
Non-Crisis Financial Crisis Dotcom Crisis Industry Mean SD Mean SD Mean SD Agriculture 0.0006 0.0034 0.0015 0.0043 0.0000 0.0000 Mining 0.0021 0.0107 0.0141 0.0296 0.0114 0.0581 Construction 0.0041 0.0198 0.0325 0.0576 0.0000 0.0001 Manufacturing 0.0013 0.0103 0.0056 0.0231 0.0046 0.0216 Transportation 0.0035 0.0210 0.0010 0.0384 0.0134 0.0451 Wholesale 0.0009 0.0065 0.0036 0.0148 0.0156 0.0592 Retail 0.0022 0.0145 0.0102 0.0343 0.0003 0.0012 Non-Classified 0.0003 0.0019 0.0011 0.0028 0.0000 0.0000
This table shows the sector-wise descriptive statistics of Probability-of-Default during Non-Crisis, Financial Crisis and Dotcom Crisis time periods.

Muhammad Suhail Rizwan, Asifa Obaid, Dawood Ashraf
56
For situations where the dependent variable is fractional or bounded between zero and one, the use of a tobit model is considered appropriate. However, the use of a tobit model on highly skewed data is criticized due to the underlying normality assumption.15 Ferrari and Cribari-Neto (2004) argued that the linear regression model is not appropriate for situations where the dependent variable is bounded (0<y>1) since it may yield fitted values of variable-of-interest that may exceed lower and upper limits and instead proposed a beta regression model. Smithson and Verkuilen (2006) compared different models which can be used in bounded-dependent variable situations and found that beta regression models are better suited.
Figure 3: This graph shows the probability density of the probability-of-default of non-
financial US firms from year 2000-2012.
In financial and credit risk literature Navarro-Martinez et al. (2011) used a beta regression model for the analysis of consumer debt repayment decisions.
15 See, for example; Angrist and Pischke (2009).

Muhammad Suhail Rizwan, Asifa Obaid, Dawood Ashraf
57
The Beta regression model uses the beta density function of distribution. The beta density with shape parameters p and q is given by: ( : , ) = ( )( ) ( ) (1 − ) (12)
with 0<y<1, p, q >0 and Γ(. ) denoting the gamma function. Due to the difficulty in interpretation of shape parameters with regard to conditional expectations in regression framework Paolino (2001), Ferrari and Cribari-Neto (2004), and Smithson and Verkuilen (2006) proposed a substitute parameterization for beta regression. In this alternative parameterization shape parameters p and q are parameterized into location and dispersion (or precision) parameters when p=μ and q=(1- μ) . By replacing the values of p and q in equation (12) we get: ( ; , ) = ( )( ) (( ) ) (1 − )( ) (13)
with 0<y<1, and >0. The dependent variable y is now ~ ( , ) and (y) =μ with ( ) = ( ). If Y is a random variable with ~ ( , )and i=1,….,n
the beta regression model is: ( ) = (14)
Where is a vector of regression parameters and is the vector of covariates. Logit link function has been used for (. ) to ensure that the dependent variable lies between zero and one which transforms equation (14) so that it now reads:
ln (( ))= (15)
We used the beta regression in our estimation16.
16 For a detail discussion on beta regression see Paolino (2001), Ferrari and Cribari-Neto (2004), and Smithson and Verkuilen (2006). We used the betafit module of STATA written by Buis, Cox and Jenkins (2012).

Muhammad Suhail Rizwan, Asifa Obaid, Dawood Ashraf
58
6. Empirical Results and Discussion
Before discussing the results of this study, it is pertinent to discuss the validity of our estimation technique. We perform the Shapiro and Wilk (1965) test with the null hypothesis of normality in residuals. The null hypothesis is rejected at one percent significance confirming the violation of normality assumption. Under such circumstances, the beta regression model is preferred as it works with non-normal distribution of residuals. Error terms are clustered at firm level to control for unobserved firm effects. A Wald test using chi2, reported in table 5 to 6, confirms the validity of the model.
Table 5 reports the estimation results based on five alternative CSR measures: unadjusted (Raw) CSR (CSRRit), adjusted CSR (CSRAit), first component PCA CSR (CSRFit), equally weighted PCA CSR (CSREit) and weighted average PCA CSR (CSRWit) from panels 1 to 5 respectively. As anticipated, the coefficient of CSR is negative and significant irrespective of the CSR measure used. This suggests that a higher level of involvement in positive CSR activities mitigate the default risk of a firm. If a firm’s score of CSRRit increased by 1 unit, its default risk reduces by almost 10 bps. The impact of CSR on probability-of-default is more pronounced in the case of first component PCA CSR index (CSRFit). This further confirms that the magnitude of the relationship depends on how the CSR score is calculated.
Among other control variables, the coefficient on SIZEit is negative and significant irrespective of the CSR measure used, suggesting that the probability-of-default decreases with an increase in the size of firms. This may be attributed to management skills and the ability of firms to access financial markets during periods of financial distress. Our findings are in line with Bouzouita and Young (1998) suggesting that credit ratings of firms improve with an increase in size since it reduces the likelihood of default. The coefficient on LEVit is positive and significant in all models. This suggests that leverage increases insolvency risk. These results are in line with Gray, Mirkovic and Ragunathan (2006) and Ashbaugh-Skaife, Collins and LaFond (2006) who found that highly leveraged firms are associated with higher failure expectations. The coefficient of ROAit is negatively significant showing that increased returns enable firms to pay their debt so their probability-of-default decreases. These results are in line with Jiraporn et
Muhammad Suhail Rizwan, Asifa Obaid, Dawood Ashraf
59
al. (2014) who found a positive relationship between profitability and credit ratings.
Among market-based control variables, MBit is negative and significant irrespective of the CSR measure used showing that firms with growth-oriented future prospects are less exposed to default risk. These findings are in line with Murcia et al. (2014) who found that firms with ‘brighter’ future prospects are given higher credit ratings by rating agencies. The coefficient of systematic risk (BETAit) is positive and significant showing that as systematic risk increases, chances of default risk also increases.

Muhammad Suhail Rizwan, Asifa Obaid, Dawood Ashraf
60
The dummy variables to capture the impact of the two crisis periods, dotcom bubble and global financial crisis, are positive and statistically significant at 1% suggesting that overall default probabilities increased during each crisis. However, a point worth mentioning is that the financial crisis (Fcrisis) had a stress effect almost one and half times higher than that of the dotcom crisis.
Table 5: Estimation Results using the Beta Regression Estimation Technique. (1) (2) (3) (4) (5) VARIABLES CSRRit CSRAit CSRFit CSREit CSRWit CSRit -0.00971*** -0.0772*** -0.0226** -0.0396*** -0.0771*** (0.00371) (0.0140) (0.0101) (0.00688) (0.0137) SIZEit -0.0327*** -0.0333*** -0.0338*** -0.0463*** -0.0454*** (0.00945) (0.00937) (0.00938) (0.00941) (0.00939) LEVit 5.372*** 5.372*** 5.378*** 5.399*** 5.396*** (0.114) (0.113) (0.114) (0.113) (0.113) ROAit -0.490*** -0.483*** -0.490*** -0.485*** -0.485*** (0.158) (0.159) (0.158) (0.156) (0.156) MBit -0.00663** -0.00661** -0.00666** -0.00681** -0.00678** (0.00284) (0.00285) (0.00283) (0.00283) (0.00283) BETAit 1.307*** 1.308*** 1.307*** 1.315*** 1.314*** (0.0337) (0.0337) (0.0337) (0.0339) (0.0339) Icrisis 0.382*** 0.379*** 0.380*** 0.379*** 0.379*** (0.0290) (0.0291) (0.0289) (0.0290) (0.0290) Fcrisis 0.457*** 0.451*** 0.457*** 0.447*** 0.447*** (0.0133) (0.0132) (0.0134) (0.0134) (0.0134) Constant -8.021*** -8.029*** -8.010*** -7.927*** -7.933*** (0.108) (0.108) (0.107) (0.107) (0.107) Observations 8,937 8,937 8,937 8,937 8,937 Firm Cluster YES YES YES YES YES Wald test Chi2 0.000 0.000 0.000 0.000 0.000 Shapiro-Wilk Test (on residuals)
0.000 0.000 0.000 0.000 0.000
Number of firms 1119 1119 1119 1119 1119 This table shows the estimation results of equation (14) using the Beta Regression estimation technique. Data is from 2000 to 2012. Variable definition is provided in Table 1. The dependent variable is PDit where model 1 through 5 use five alternative CSR measures as provided in the row beneath the model numbers. I.Crisis is dummy for dotcom bubble crisis; F.Crisis is dummy for Financial Crisis. *** p<0.01, ** p<0.05, * p<0.1.

Muhammad Suhail Rizwan, Asifa Obaid, Dawood Ashraf
61
To test whether there is any dissimilarity on the impact of technical and institution-related CSR activities on the probability-of-default, we estimated equation (14) with two distinctive CSR variables namely TCSRit and ICSRit. Estimation results of re-estimated equation (14) are given in Table 6. We used ‘Raw summation’ measurement of TCSRit and ICSRit, adjusted and first component of PCA from panel (1) to (3) respectively. Interestingly coefficients of institutional CSR (ICSRit) are insignificant irrespective of which CSR measure is used. On the other hand, technical CSR (TCSRit) shows a significant negative coefficient for all models. These results are in line with those of Godfrey et al. (2009) about the insurance-like function of technical CSR. There are no major differences among other control variables in terms of signs or statistical significance as compared with results from Table 3.
Overall, we find support for the alternative hypotheses suggesting that a higher level of CSR engagement significantly decreases the probablity-of-default. An enagagement in technical CSR helps reduce the probablity-of-default more than institutional CSRs. Furthermore, the impact of the global financial crisis was more severe on US firms as compared with the dotcom bubble crisis. These findings are in line with Jiraporn et al. (2014) and Godfrey et al. (2009) that CSR has a positive effect on credit ratings of a firm.
6.1 Robustness check
Smithson and Verkuilen (2006) used transformation to shift the observations at the margin 0 and 1 into the unit of interval in response to the fact that beta regression does not use values on the margin in the analysis and use =( − 1) + 0.5 / ; where N is sample size. Bittschi, Pennerstorfer and Schneider (2014) also performed this transformation because the major portion of their data lays on the margin 0 and 1 (more than 50%). Although in our case only 15% of data is at margin 0 we did this transformation and generated PDtrans as a robustness check to test whether our results still hold.

Muhammad Suhail Rizwan, Asifa Obaid, Dawood Ashraf
62
For robustness purposes, we report empirical results based on the CSR index through first principal component analysis (CSRFit) only. Table 7 column 1 reports the empirical results based on the Smithson and Verkuilen (2006) transformation. There is no change in the sign or significance in the CSR
Table 6: Estimation Results of Beta Regression Technique (1) (2) (3) VARIABLES PD PD PD TCSRit -0.0173*** -0.124*** -0.0239*** (0.00510) (0.0187) (0.00442) ICSRit 0.00647 0.0211 0.00580 (0.00755) (0.0299) (0.00453) SIZEit -0.0309*** -0.0315*** -0.0299*** (0.00949) (0.00939) (0.00946) LEVit 5.374*** 5.377*** 5.373*** (0.114) (0.114) (0.113) ROAit -0.488*** -0.479*** -0.484*** (0.159) (0.160) (0.160) MBit -0.00680** -0.00689** -0.00678** (0.00284) (0.00286) (0.00285) BETAit 1.305*** 1.307*** 1.304*** (0.0336) (0.0336) (0.0335) Icrisis 0.387*** 0.384*** 0.389*** (0.0292) (0.0293) (0.0292) Fcrisis 0.459*** 0.454*** 0.459*** (0.0134) (0.0133) (0.0134) Constant -8.038*** -8.053*** -8.040*** (0.108) (0.108) (0.108) Observations 8,937 8,937 8,937 Firm clustering YES YES YES Wald test Chi2 0.000 0.000 0.000 Shapiro-Wilk Test (on residuals)
0.000 0.000 0.000
No. of Firms. 1119 1119 1119 This table shows the estimation results of equation (14) estimated using Beta Regression technique. Data is from 2000 to 2012. PDit is probability-of-default. TCSR and ICSR measured by CSRraw is a CSR index constructed adding Raw scores (1), CSRadj is adjusted CSR (2), CSRpc1 is CSR using first component of PCA (3), Variables are defined in the second column of Table 1. Standard errors are in parentheses *** p<0.01, ** p<0.05, * p<0.1.

Muhammad Suhail Rizwan, Asifa Obaid, Dawood Ashraf
63
probability-of-default relationship and generally results remained robust after the transformation.
To further confirm our results, we did robustness checks by using an alternative risk variable and replaced probability-of-default with distance-to-default. We logarithmically transformed the distance-to-default due to the presence of extreme outliers. A longer ‘distance-to-default’ implies lower chances of default. Since DDit is an inverse of probability-of-default, we expect the opposite relationship of CSR and other control variables as compared with PDit.
Because DDit is not bounded linear regression analysis can be used in the estimation. As an unobservable heterogeneity problem may arise due to the unobservable differences among firms that do not vary over time and directly affect the levels of riskiness of each firm. The panel data model offers useful opportunities for taking these latent characteristics of firms into account by modeling it as an individual effect which is then eliminated by taking the first difference of variables. For testing the proposed hypotheses, we estimate a dynamic panel model, specifically, the Generalized-Method-of-Moments (GMM) estimator developed by Arellano and Bond (1991). The GMM model allows for the control of unobservable heterogeneity problems as well as possible endogeneity between dependent and independent variables.
The estimation results based on DDit are reported in the second column of Table 7. Similar to the previous estimation results, CSRit is positive and significant. This further confirms the robustness of the risk-mitigating evidence of CSR. Signs of other control variables are as expected with no major difference.
Muhammad Suhail Rizwan, Asifa Obaid, Dawood Ashraf
64
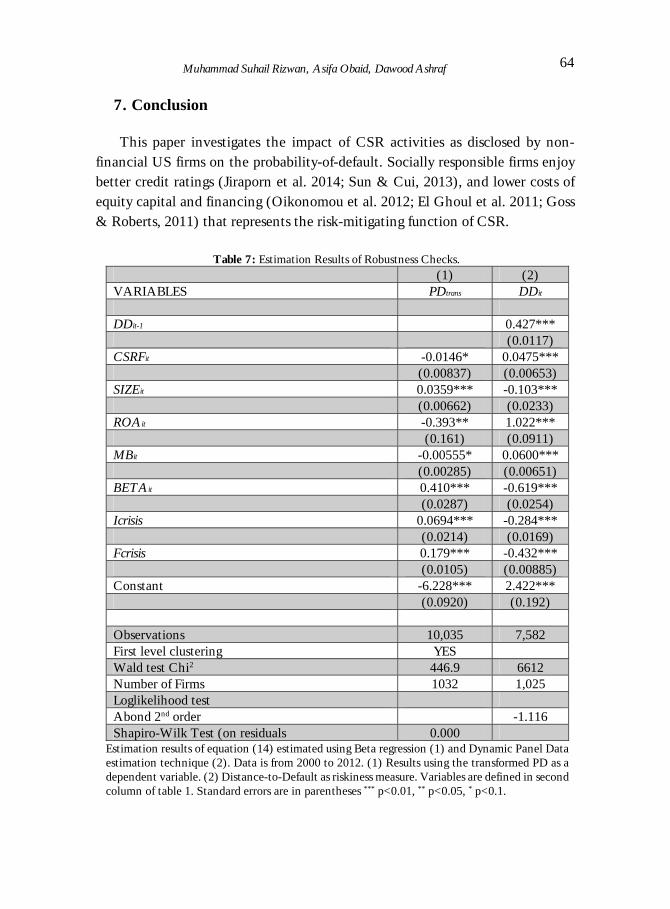
7. Conclusion
This paper investigates the impact of CSR activities as disclosed by non-financial US firms on the probability-of-default. Socially responsible firms enjoy better credit ratings (Jiraporn et al. 2014; Sun & Cui, 2013), and lower costs of equity capital and financing (Oikonomou et al. 2012; El Ghoul et al. 2011; Goss & Roberts, 2011) that represents the risk-mitigating function of CSR.
Table 7: Estimation Results of Robustness Checks. (1) (2) VARIABLES PDtrans DDit DDit-1 0.427*** (0.0117) CSRFit -0.0146* 0.0475*** (0.00837) (0.00653) SIZEit 0.0359*** -0.103*** (0.00662) (0.0233) ROAit -0.393** 1.022*** (0.161) (0.0911) MBit -0.00555* 0.0600*** (0.00285) (0.00651) BETAit 0.410*** -0.619*** (0.0287) (0.0254) Icrisis 0.0694*** -0.284*** (0.0214) (0.0169) Fcrisis 0.179*** -0.432*** (0.0105) (0.00885) Constant -6.228*** 2.422*** (0.0920) (0.192) Observations 10,035 7,582 First level clustering YES Wald test Chi2 446.9 6612 Number of Firms 1032 1,025 Loglikelihood test Abond 2nd order -1.116 Shapiro-Wilk Test (on residuals 0.000
Estimation results of equation (14) estimated using Beta regression (1) and Dynamic Panel Data estimation technique (2). Data is from 2000 to 2012. (1) Results using the transformed PD as a dependent variable. (2) Distance-to-Default as riskiness measure. Variables are defined in second column of table 1. Standard errors are in parentheses *** p<0.01, ** p<0.05, * p<0.1.

Muhammad Suhail Rizwan, Asifa Obaid, Dawood Ashraf
65
To proxy overall CSR-related activity this study used a PCA approach to construct a CSR index following Schmidtlein et al. (2008). The PCA approach is preferred over additive index and weighted additive index approaches used in recent studies. Under additive approaches, CSR scores are ordinal and provide only the relative performance score of every firm but not the variation. By using the PCA approach of assigning weights to each component based on the relative correlation, not only does it provide a relative performance matrix but it also helps explain the maximum variation (Goss & Roberts, 2011). After considering criticism on the use of credit ratings as a measure of credit risk this study used probability-of-default as a measure of credit risk.
We found evidence that suggests that the probability-of-default for firms with high CSR index scores is less than those scoring low CSR index scores. Moreover, after splitting CSR into primary (Technical) and secondary (Institutional) stakeholders, we found that technical CSR has a significantly negative relationship with default risk while institutional CSR has an insignificant relationship. These empirical findings are in line with the literature showing that CSR plays a risk-mitigating function. Apart from our core findings, we also found that the dotcom bubble and financial crisis had a huge negative effect on the solvency of firms.
Our results indicate the importance of engagement in CSR activities and have important policy implications for management and investors alike. Management can use CSR-related activities to reduce the credit risk of their firms. For shareholders to benefit, they have to be conscientious investors who value firms that engage in socially responsible behavior
References
Angrist, J. D., & Pischke, J. S. (2008). Mostly harmless econometrics: An empiricist's companion. Princeton university press.
Arellano, M., & Bond, S. (1991). Some tests of specification for panel data: Monte Carlo evidence and an application to employment equations. Review of Economic Studies, 58(2), 277–297.
Muhammad Suhail Rizwan, Asifa Obaid, Dawood Ashraf
66
Ashbaugh-Skaife, H., Collins, D. W., & LaFond, R. (2006). The effects of corporate governance on firms’ credit ratings. Journal of accounting and economics, 42(1), 203–243.
Ashraf, D., & Goddard, J. (2012). Derivatives in the wake of disintermediation: A simultaneous equations model of commercial and industrial lending and the use of derivatives by US banks. International Journal of Banking, Accounting & Finance, 4(3), 250–271.
Atkas, N., Bodt, E. D., & Cousin, J. G. (2011). Do financial markets care about SRI? Evidence from mergers and acquisitions, Journal of Banking & Finance, 35(7), 1753–1761.
Avramov, D., Chordia, T., Jostova, G., & Philipov, A. (2009). Dispersion in analysts’ earnings forecasts and credit rating. Journal of Financial Economics, 91(1), 83–101.
Bae, K. H., Kang, J., K., & Wang, J. (2011). Employee treatment and firm leverage: A test of the stakeholder theory of capital structure. Journal of Financial Economics, 100(1), 130–153.
Barnea, A., & Rubin, A. (2010). Corporate social responsibility as a conflict between shareholders. Journal of Business Ethics, 97(1), 71–86.
Bauer, R., Koedijk, K., & Otten, R. (2005). International evidence on ethical mutual fund performance and investment style, Journal of Banking & Finance, 29(7), 1751–1767.
Benson, B. W., & Davidson, W. N. (2010). The relation between stakeholder management, firm value, and CEO compensation: A test of enlightened value maximization. Financial Management, 39(3), 926–964.
Ben-Zion, U., & Shalit, S. S. (1975). Size, leverage and dividend record as determinant of equity risk. The Journal of Finance, 30(4), 1015–1026.
Bittschi, B., Pennerstorfer, A., & Schneider, U. (2015). Paid and unpaid labour in non‐profit organizations: Does the substitution effect exist? British Journal of Industrial Relations, 53(4), 789–815.
Black, F., & Scholes, M. (1973). The pricing of options and corporate liabilities. Journal of Political Economy, 81(3), 637–659.
Blume, M. E., Lim, F., & MacKinlay, A. C. (1998). The declining credit quality of U.S. corporate debt: myth or reality? Journal of Finance, 53(4), 1389–1413.

Muhammad Suhail Rizwan, Asifa Obaid, Dawood Ashraf
67
Bouzouita, R., & Young A. J. (1998). A Probit analysis of best ratings. The Journal of Insurance Issues, 21(1), 23–34.
Brammer, S., Brooks, C., & Pavelin, S. (2006). Corporate social performance and stock returns: UK evidence from disaggregate measures. Financial Management, 35(3), 97–116.
Buis, M., Cox, N., & Jenkins, S. (2012). BETAFIT: Stata module to fit a two-parameter beta distribution. Available at: http://EconPapers.repec.org/RePEc:boc:bocode:s435303.
Byström, H. (2003). Merton for dummies: A flexible way of modelling default risk. Research Paper Series No. 112, Quantitative Finance Research Centre, University of Technology, Sydney.
Cutter, S. L., Boruff, B. J., & Shirley, W. L. (2003). Social vulnerability to environmental hazards. Social Science Quarterly, 84(2), 242–261.
Deng, X., Kang, J. K., & Low, B. S. (2013). Corporate social responsibility and stakeholder value maximization: Evidence from mergers. Journal of Financial Economics, 110(1), 87–109.
Ferrari, S. L. P., & Cribari-Neto, F. (2004). Beta regression for modelling rates and proportions. Journal of Applied Statistics, 31(7), 799–815.
Freeman, R. E., Harrison, J. S., & Wicks, A. C. (2008). Managing for stakeholders: Survival reputation and success (8th ed.). London: Yale University press.
Gardberg, N. A., & Fombrun, C. (2006). Corporate citizenship: Creating intangible assets across institutional environment. Academy of Management Review, 31(2), 329–346.
El Ghoul, S., Guedhami, O., Kwok, C. C. Y., & Mishra, D. R, (2011). Does corporate social responsibility affect the cost of capital? Journal of Banking & Finance, 35(9) 2388–2406.
Godfrey, P. C., Merrill, C. B., & Hansen, J.M. (2009). The relationship between corporate social responsibility and shareholder value: An empirical test of the risk management hypothesis. Strategic Management Journal, 30(4), 425–445.
Goss, A., & Roberts, G. S. (2011). The impact of corporate social responsibility on the cost of bank loans. Journal of Banking & Finance, 35(7), 1794–1810.
Gray, S., Mirkovic, A., & Ragunathan, V. (2006). The determinants of credit ratings: Australian evidence. Australian Journal of Management, 31(2), 333–354.

Muhammad Suhail Rizwan, Asifa Obaid, Dawood Ashraf
68
Hillman, A. J., & Keim, G. D. (2001). Shareholder value, stakeholder management, and social issues: what's the bottom line? Strategic Management Journal, 22(2), 125–139.
Hilscher, J., & Wilson, M. I. (2013). Credit ratings and credit risk: Is one measure enough? Meetings Paper, AFA 2013 San Diego. Available at: http://ssrn.com/abstract= 1474863.
Jiao, Y. (2010). Stakeholder welfare and firm value. Journal of Banking & Finance, 34(10), 2549–2561.
Jiraporn, P., Jiraporn, N., Boeprasert, A., & Chang, K. (2014). Does corporate social responsibility (CSR) improve credit ratings? Evidence from geographic identification. Financial Management, 43(3), 505–531.
Johnson, T. C., Chebonenko, T., Cunha, I., D’Almeida, F., & Spencer, X. (2011). Endogenous leverage and expected stock returns. Finance Research Letters, 8(3), 132–145.
Kaiser, H. F. (1960). The application of electronic computers to factor analysis. Educational and Psychological Measurement, 20(1), 141–151.
Krahnen, J. P., & Weber, M. (2001). Generally accepted rating principles: A primer. Journal of Banking & Finance, 25(1), 3–23.
Kytle, B., & Ruggie, J., G. (2005). Corporate social responsibility as risk management: A model for multinationals. Working paper No. 10, Harvard University. Available at: http://www.ksg.harvard.edu/m-rcbg/CSRI/publications/workingpaper_10_kytle_ ruggie.pdf
Loffler, G. (2004). Ratings versus market-based measures of default risk in portfolio governance. Journal of Banking & Finance, 28(11), 2715–720.
Mattingly, J. E., & Berman S. L. (2006). Measurement of corporate social action: Discovering taxonomy in Kinder Lydenberg Domini ratings data. Business and Society, 45(1), 20–46.
McGuire, J. B., Sundgren, A., & Schneeweis T. (1988). Corporate social responsibility and firm financial performance. Academy of Management Journal, 31(4), 854–872.
Merton, R. C. (1974). On the pricing of corporate debt: The risk structure of interest rates. Journal of Finance, 29(2), 449–470.
Molina, C. A., (2005). Are firms underleveraged? An examination of the effect of leverage on default probabilities. Journal of Finance, 60(3), 1427–1459.

Muhammad Suhail Rizwan, Asifa Obaid, Dawood Ashraf
69
Murcia, F. C. S., Murcia, F. D., Rover, S., & Borba, J. A. (2014). The determinants of credit rating: Brazilian evidence. Brazilian Administration Review, 11(2), 188–209.
Navarro-Martinez, D., Salisbury, L. C., Lemon, K. N., Stewart, N., Matthews, W. J., & Harris, A. J. L. (2011). Minimum required payment and supplemental information disclosure effects on consumer debt repayment decisions. Journal of Marketing Research, 48(SPL), S60–77. doi:10.1509/jmkr.48.SPL.S60.
Oikonomou, I., Brooks, C., & Pavelin, S. (2012). The impact of corporate social performance on financial risk and utility: A longitudinal analysis. Financial Management, 41(2), 483–515.
Paolino, P. (2001). Maximum likelihood estimation of models with beta-distributed dependent variables. Political Analysis, 9(4), 325–346.
Pastor, L., & Veronesi, P. (2003). Stock valuation and learning about profitability. Journal of Finance, 58(5), 1749–1790.
Reinhardt, F. L., Stavins, R. N., & Vietor, R.H.K. (2008). Corporate social responsibility through an economic lens. Review of Environmental Economics and Policy, 2(2), 219–239.
Renneboog, L., Horst, J. T., & Zhang, C. (2008). Socially responsible investments: Institutional aspects, performance, and investor behavior. Journal of Banking & Finance, 32(9), 1723–1742.
Rösch, D., & Scheule, H. (2014). Forecasting mortgage securitization risk under systematic risk and parameter uncertainty. Journal of Risk & Insurance, 81(3), 563–586.
Schmidtlein, M. C., Deutsch, R. C., Piegorsch, W. W., & Cutter, S. L. (2008). A sensitivity analysis of the social vulnerability index. Risk Analysis, 28(4), 1099–1114.
Shapiro, S. S., & Wilk, M. B. (1965). An analysis of variance test for normality (complete samples). Biometrika 52(3–4), 591–611.
Smithson, M. & Verkuilen, J. (2006). A better lemon squeezer? Maximum-likelihood regression with beta-distributed dependent variables. Psychological Methods, 11(1), 54–71.
Spicer, B. H. (1978). Market risk, accounting data and companies’ pollution control records, Journal of Business Finance & Accounting, 5(1), 67–83.
Muhammad Suhail Rizwan, Asifa Obaid, Dawood Ashraf
70
Sprinkle, G., & Maines, L. (2010). The benefits and costs of corporate social responsibility. Business Horizon, 53(5), 445–453.
Sun, W., & Cui K. (2013). Linking corporate social responsibility to firm default risk. European Management Journal, 32(2), 275–287.
Verwijmeren, P., & Derwall, J. (2010). Employee well-being, firm leverage, and bankruptcy risk, Journal of Banking & Finance, 34(5), 956–964.
Waddock, S., & Graves, S. (1997). The corporate social performance-financial performance link. Strategic Management Journal, 18(4), 303–319.
West, R. R. (1970). An alternative approach to predicting corporate bond ratings. Journal of Accounting Research, 8(1), 118–12.