the impact of covid-19 on productivity - nicholas bloom
TRANSCRIPT

NBER WORKING PAPER SERIES
THE IMPACT OF COVID-19 ON PRODUCTIVITY
Nicholas BloomPhilip BunnPaul Mizen
Pawel SmietankaGregory Thwaites
Working Paper 28233http://www.nber.org/papers/w28233
NATIONAL BUREAU OF ECONOMIC RESEARCH1050 Massachusetts Avenue
Cambridge, MA 02138December 2020, Revised December 2020
The authors would like to thank the Economic and Social Research Council, Nottingham and Stanford universities for financial support. We would like to thank Jonathan Haskell, Richard Heys, Stuart Newman, John Van Reenen and seminar participants at Dartmouth, ESCoE and the Nottingham Macro Working Group for comments. Corresponding Author: [email protected]. The views do not necessarily represent those of the Bank of England or its Committees. The views expressed herein are those of the authors and do not necessarily reflect the views of the National Bureau of Economic Research.
NBER working papers are circulated for discussion and comment purposes. They have not been peer-reviewed or been subject to the review by the NBER Board of Directors that accompanies official NBER publications.
© 2020 by Nicholas Bloom, Philip Bunn, Paul Mizen, Pawel Smietanka, and Gregory Thwaites. All rights reserved. Short sections of text, not to exceed two paragraphs, may be quoted without explicit permission provided that full credit, including © notice, is given to the source.

The Impact of Covid-19 on ProductivityNicholas Bloom, Philip Bunn, Paul Mizen, Pawel Smietanka, and Gregory Thwaites NBER Working Paper No. 28233December 2020, Revised December 2020JEL No. E0,L2
ABSTRACT
We analyze the impact of Covid-19 on productivity in the United Kingdom using data derived from a large monthly firm panel survey. Our estimates suggest that Covid-19 will reduce TFP in the private sector by up to 5% in 2020 Q4, falling back to a 1% reduction in the medium term. Firms anticipate a large reduction in ‘within-firm’ productivity, primarily because measures to contain Covid-19 are expected to increase intermediate costs. The negative ‘within-firm’ effect is partially offset by a positive ‘between-firm’ effect as low productivity sectors, and the least productive firms among them, are disproportionately affected by Covid-19 and consequently make a smaller contribution to the economy. In the longer run, productivity growth is likely to be reduced by diminished R&D expenditure and diverted senior management time spent on dealing with the pandemic.
Nicholas BloomStanford UniversityDepartment of Economics579 Serra MallStanford, CA 94305-6072and [email protected]
Philip BunnBank of EnglandThreadneedle StreetLondon EC2R 8AHUnited [email protected]
Paul MizenDepartment of Economics Nottingham University Nottingham NG7 2QXUnited [email protected]
Pawel SmietankaBank of EnglandThreadneedle StreetLondon EC2R 8AHUnited [email protected]
Gregory ThwaitesUniversity of Nottingham73 Bromfield AvenueHoughton StreetLondon WC2A 2AE London n13 4jrUnited [email protected]

1
Introduction The advent of Covid-19 has been the largest shock to the world economy since World War II. It has induced a large contraction in GDP that has been unusually synchronized across countries. But the shock has also had asymmetric effects across sectors of the economy, with those sectors that involve the most social contact in consumption bearing the brunt. Furthermore, the shock has necessitated a reorganization of production processes – both in the near-term as an immediate response but also over the medium-term – that will have implications for productivity and factor usage. The spread of Covid-19 and measures to contain it are therefore likely to have important implications for productivity. This paper presents an analysis of the impact of Covid-19 on productivity in a major industrialised economy. We use survey data from the Decision Maker Panel (DMP), a large and representative monthly panel survey of UK firms that was established in 2016. Whilst the DMP survey does not ask about productivity directly, panel members have been asked about the impact of Covid-19 on all of the main components of productivity, covering inputs, outputs and prices. We take pre-Covid measures of firm-level productivity derived from company accounts data and project them forward using more timely and/or forward-looking data from the DMP on the impact of Covid-19 on these components. We assess the impact of Covid-19 on both measures of labour productivity and total factor productivity (TFP). We build our results up from the firm level and decompose the aggregate impacts into ‘within-firm’ and ‘between-firm’ effects (hereafter within and between effects) using the accounting framework of Baily et al. (1992). So in contrast to other studies that must infer the impact of a shock on productivity from some natural temporal or unobserved cross-firm variation in exposure, the DMP data allows us to ask firms directly. We show that these reported impacts account for much of the realised changes in the firm-level data. The results suggest that Covid-19 will reduce TFP in the UK private sector, relative to what would otherwise have happened, by about 3% on average between 2020 Q2 and 2021 Q2, peaking at 5% in 2020 Q4 (Figure 1). Businesses anticipate a large reduction in productivity within firms, partly because measures to contain Covid-19 are expected to increase intermediate costs. The negative within-firm effect is partially offset by a positive between effect as low productivity sectors, and the least productive firms among them, are disproportionately affected and consequently make a smaller contribution to the economy. The effects of Covid-19 on hourly labour productivity are estimated to be less negative than those on TFP (Figure 1).1 That is because hours worked are estimated to have dropped by around 40% in 2020 Q2, which is a larger fall than the input share weighted fall in capital (which dropped by 1% in 2020 Q2) and hours. Labour productivity per hour is estimated to have increased in 2020 Q2 as the large short-term between effects more than offset the impact of higher costs. To gauge the effects over the medium term, we use responses to survey questions asking about the expected impacts of Covid-19 in 2022+. We estimate that the pandemic will reduce TFP by about 0.7% over the medium term, equivalent to about around one year of pre-pandemic UK productivity growth.
1 The effects on labour productivity per job are estimated to be negative through, particularly in 2020 Q2 and Q3, as the number of jobs has fallen by much less than hours worked due to workers being put on furlough under the Government Coronavirus Job Retention Scheme (jobs on furlough are assumed to remain but at zero hours).

2
Importantly, it is worth highlighting this positive between impact of productivity is not entirely the usual Schumpeterian process of creative destruction, whereby lower productivity firms are replaced by higher productivity firms. Instead much of this is simply destruction of low productivity sectors. Industries like accommodation and food, and recreational services have experienced substantial contractions with limited expansion of other sectors. So, while this may increase average productivity it will reduce total economic output, and hence likely reduce overall welfare. As such, while Covid induced changes in productivity so far appear perhaps surprisingly limited – we estimate a maximum impact of -5% in 2020Q4 – this has arisen in part from the permanent contraction of some low-productivity sectors.
This paper draws together three strands of literature, on the link between firm-level productivity and aggregate performance, on business surveys, and on the economic impact of Covid-19.
First, the literature on using micro-data to analyse the drivers of macro productivity. Baily et al. (1992) developed the formula to decompose productivity changes into within changes and between reallocation which we employ in this study. Their decomposition has been extensively used in the productivity literature (see, e.g. Foster, Haltiwanger and Syversson (2001) or Syversson (2011)). Bartelsman et al. (2013) show that differences in the covariance between size and productivity drive productivity differences across countries, while our study shows that Covid is expected to induce changes in this covariance that will offset some of its adverse effects. A Covid induced productivity slowdown is more concerning given the gradual decline in US, UK and European productivity growth since the 1960s. Indeed, over the last decade US, UK and EU productivity growth have fallen to under 1% a year, so a major impact from Covid-19 could easily lead this to become negative (see for example Jones (2009), Cowen (2011), Gordon (2016), and Bloom et al. (2020)).
Second, we contribute to the literature on using business surveys to evaluate the impact of major shocks. We employ a business survey (the Decision Maker Panel) that is one of a growing number of monthly business panel surveys that collect data to measure firms’ subjective expectations as well as their objective performance (see Altig et al. (2020a)). Altig et al. (2020b) use these surveys to assess the impact of the Covid-19 crisis on economic uncertainty. The use of these large scale, high frequency forward looking firm surveys to measure the productivity impact of shocks – both the within and between elements – is a novel approach to evaluating the impact of major events as they happen.
Lastly, our paper is one of many in a rapidly growing literature on the economic impact of Covid-19, which are already too numerous to cite and many of which are surveyed in Brodeur et al. (2020). Some examples include Alekseev et al. (2020), Bartik et al. (2020a and 2020b), Brynjolfsson et al. (2020), Buffington et al. (2020), Bloom, Fletcher and Yeh (2020), Gourinchas et al. (2020), and Papanikolaou and Schmidt (2020) who show pervasive impacts on firms. Baqaee and Farhi (2020) show that negative sectoral supply shocks can be stagflationary and can be amplified by complementarities in production, Chetty et al. (2020), Kahn et al. (2020) and Cajner et al. (2020) show large and heterogeneous labour-market impacts of Covid-19, Adams-Prassl et al. (2020), Alon et al. (2020) and Mongey et al. (2020) and show the gender impact of the pandemic, Guerrieri et al. (2020) show that supply shocks can cause demand shortages, and Jorda et al. (2020) examine the longer-run consequences of past pandemics.
3
The remainder of this paper is structured as follows. Section 2 provides an overview of the Decision Maker Panel survey and looks at how the pandemic has affected response rates. Section 3 sets out the analytical framework that we use to assess the impact of Covid-19 on productivity. Section 4 contains our empirical results, highlighting some potentially important measurement issues, before section 5 concludes. Section 2: The Decision Maker Panel (DMP) Survey methodology The DMP was launched in August 2016 by the Bank of England in collaboration with Stanford University and the University of Nottingham, supported by funding from the Economic and Social Research Council.2 It is similar in style to the Survey of Business Uncertainty run in the United States by the Federal Reserve Bank of Atlanta, which is described in Altig et al. (2019). The DMP is a large and representative online survey of Chief Financial Officers in UK businesses. It is a flexible tool for assessing business conditions, and in particular has been adapted to collect detailed information on how businesses are being affected by important economic events. For example, it has been used to assess the response to the UK’s decision to leave the European Union. Most recently, the DMP survey has been refocused to help assess the impact of Covid-19 on businesses.3 The Covid-related questions are discussed in more detail below. As well as special questions on topical policy issues, the survey contains regular questions on sales, prices, employment and investment. These questions ask about recent developments and expectations for the year ahead, including about uncertainties surrounding those expectations. The sampling frame for the DMP is the population of all 48,000 active UK businesses with 10 or more employees in the Bureau van Dijk FAME database.4 It covers small, medium and large private sector businesses across all industries (see Appendix Figure A1). Firms are selected randomly from this sampling frame and are invited by telephone to join the panel by a recruitment team based at the University of Nottingham. This approach helps to ensure that the survey provides a representative view of the UK economy. Once firms are part of the panel they receive monthly emails with links to a 5- to 10-minute online survey. Firms that do not respond to the survey for three consecutive months are re-contacted by telephone to check whether they received the emails or have other reasons for not completing the survey. When the DMP recruitment team first contact firms they ask to speak to the CFO, and failing that the CEO. As a result 85% of respondents are in these two positions (70% are CFOs and 15% are CEOs) with the remainder mostly senior finance managers (see Table A1). Given that the typical firm in the survey has about 100 employees (see the summary statistics in Table 1) these CFOs and CEOs have a very good sense of the overall direction and performance of the business. The DMP grew quickly after its launch and now includes more than 8,300 senior executives; it has averaged just under 3,000 responses a month since 2019 (see Figure 2). That makes it one of the
2 More details on the DMP are also available at www.decisionmakerpanel.co.uk. 3 See Bloom et al. (2019) for analysis of the impact of Brexit on UK businesses using data from the DMP. 4 FAME is provided by Bureau Van Dijk (BVD) using data on the population of UK firms from the UK Companies House. FAME itself is part of the global AMADEUS database.

4
largest monthly business surveys in Europe. The surveys have a rotating three-panel structure – each member is randomised at entry into one of the three panels (A, B or C). Each panel is given one third of the questions in any given month, so that within each quarter all firms rotate through all questions. This helps to keep the survey short for respondents whilst yielding a regular monthly flow of data (so around 1,000 firms respond to each question each month). Results are typically weighted using employment data. Data provided by DMP panel members appear to be of high quality. Where comparable data are available, data provided by respondents match up well with the corresponding audited information from company accounts for variables such as sales and employment (see Figure A2). By comparing year-ahead expectations to what subsequently happened in the relevant period (for the pre-Covid period) we also validate that businesses are able to make relatively accurate predictions about their future sales, employment and prices and, to a lesser extent, investment (Figure A3). An important advantage of the DMP survey relative to other business surveys is the quantitative nature of the data that it collects. Many other business surveys tend to focus on questions that ask businesses to indicate whether they expect the conditions that they face to get better or worse, rather than by how much they expect them to get better or worse. But the extent to which conditions are better or worse has been particularly important in the context of the Covid-19 pandemic where the size of such changes is much larger than in normal times. This quantitative information on how businesses have been affected by Covid-19 and expect to be affected in the future is a crucial input into the analysis in this paper on how Covid-19 is likely to affect productivity. The reason that the DMP targets the CFOs (or CEOs) at these firms is because they are likely to be sufficiently numerate to respond to somewhat complex quantitative questions. The impact of Covid-19 on response rate in the Decision Maker Panel The Covid-19 pandemic and the associated measures to contain it have disrupted UK businesses, forcing some firms to suspend operations and many staff to work from home. This disruption may in itself have impacted the willingness and ability of panel members to respond in a timely and accurate fashion to the monthly survey. Fortunately, an online survey can be accessed from office or home and we demonstrate below that there has only been a modest impact on the response rate. Importantly, there is no evidence to suggest lower response rates have been concentrated amongst businesses that might be expected to be most severely affected by Covid-19. Figure 2 shows that in 2019 the response rate of active panel members averaged 55%, with number of responses also broadly stable at just under 3,000 a month. This response rate fell to 50% in March 2020 as UK lockdown restrictions were introduced whilst the survey was in the field. But it recovered in April and has averaged 54% since then, only 1 percentage point lower than the average for 2019. Even though the total response rate has held up well, it is still possible that the composition of firms responding to the survey has been affected by the pandemic. To assess this, in column (1) of Table 2, we run a simple regression of the propensity for a firm to respond to the survey that month (conditional on being in the sampling frame) on the industry impact of Covid-19 on sales in 2020 Q2 (as reported in the DMP survey). This regression refers to data from March 2020 onwards,
5
covering the period when responses may have been affected by the Covid-19 shock. We detect no significant relationship between the industry level loss in sales from Covid-19 and propensity to respond to the survey. In column (2) we estimate the regression over a longer period and interact the Covid sales impact with a dummy variable for the Covid period (March 2020 onwards), again finding no significant relationship. This indicates that changes in response patterns have not differed significantly across industries (rather than varying with the extent of the Covid-19 slowdown), possibly reflecting the more general impact of the lockdown disruption on business survey response.5 In column (3) we test whether there has been any change in the propensity to respond to the survey since March 2020 by level of pre-Covid productivity, a key input into our calculations. Again, we find no evidence of a difference in survey response propensity. In summary, there is no sign that the small and temporary change in survey response rates that we observed in early 2020 is likely to have materially affected the quality of data in the DMP survey. The fact these response rates remained high may at least partly reflect the fact that the survey is carried out online, so that CEOs and CFOs would continue to receive the survey while working at home. Business failures could also be another source of attrition from the survey, but as we discuss in more detail later in the paper; these have so far remained low during the pandemic in the UK, at least up to autumn 2020. Section 3: Analytical framework To assess the impact of Covid-19 on productivity we take pre-Covid measures of firm-level productivity derived from company accounts data and project them forward using more timely data on the impact of Covid-19 from the DMP survey. By building the results up from the firm level we are also able to decompose the aggregate impacts into within effects and between effects. In this section we define the measures of productivity that we consider, discuss how we use the DMP survey to measure the impact of Covid-19 on various components of productivity, and set out the framework that we use to decompose productivity into within and between effects Measures of productivity The DMP survey does not directly ask businesses about productivity, but as a result of the refocussing of the survey with new questions on the impact of Covid-19 specifically since April 2020, it has asked about the marginal impact of Covid-19 on inputs, output and prices, all of the main components needed to calculate productivity. These questions are described below. We use this data to project forward productivity for each firm under the assumption that it would otherwise have been unchanged from its 2017-2019 value in the absence of Covid-19. We consider the effect of Covid-19 on both labour productivity (on a per hour and per job basis) and total factor productivity. These measures are defined below. For the purposes of this decomposition, we posit a Cobb-Douglas production function for real turnover defined over
5 Figure A4 in the Appendix also shows this by plotting the change in response rate by industry against the impact of Covid-19 on sales in 2020 Q2.

6
labour hours L, capital K and intermediate inputs M, each of which is associated with factor-augmenting productivity AL, AK and AM respectively:
(1)
Taking logs, denoting them with lower-case letters and taking the total derivative we have
(2)
And we define TFP for this final output production function as
(3)
with the total derivative given simply by
(4)
We define unit costs mu as the volume of intermediates per unit of real final sales. In this case, defining value-added as Y-M, we can show that the total derivative for value-added TFP is given by
(5)
where is the capital share in value-added and so on. We can rewrite this as
(6)
We measure firm-level changes in value-added TFP with this equation.6
We use accounting data provided by Bureau Van Dijk to calculate each measure of productivity for all firms in the survey in the pre-Covid period. We use a three year average of 2017 to 2019 data rather than a single year to reduce measurement error. Labour productivity is calculated as real value-added (operating profits plus total labour costs divided by the aggregate GDP deflator) per employee using accounting data. Data are scaled so that industry-level labour productivity from accounts is equal to official ONS industry-level labour productivity per job data.7 TFP is calculated as the residual from a production function, ln(VAit) = (2/3)ln(Lit) +(1/3)ln(Kit), where VAit is real value-added of firm i in year t, L is labour input which we measure as total real labour costs and K is capital, measured as total real fixed assets.8 Nominal values from accounting data
6 One can show that . 7 Figure A5 in the Appendix shows that industry level labour productivity data constructed from accounting data are well correlated with official data from the ONS. However, they are not identical and so we scale the industry accounting data to match the ONS data to try and ensure that our results align as closely as possible with official statistics. 8 Usually TFP would be normalized at the industry level. We do not do this in our analysis because we require differences in the level of productivity between industries to be able to consider the effects of reallocation between

7
are deflated using the GDP deflator. Factor shares are assumed to be 1/3 of capital and 2/3 on labour, to align with the values from national accounts, which is important for aggregating productivity impacts. Measuring the impact of Covid-19 on inputs and outputs using the DMP Since April 2020, the DMP survey has included questions about the expected impact of Covid-19 on respondents’ sales, employment, and investment. The questions are of the form: ‘Relative to what would have otherwise happened, what is your best estimate for the impact of the spread of coronavirus (Covid-19) on the sales/employment/investment of your business in the following quarters?’ These questions ask about the impact in the current quarter and about expectations for the following three quarters and 2022+. Respondents are asked to provide a numerical response to these questions. To estimate the impact of Covid-19 on total hours worked, information from three separate questions is combined. We use data from the question outlined above on the impact of Covid-19 on employment, data from a similar question asking about the average hours worked of employees who remain active, and data on the percentage of employees on furlough – people who remain employed but who are not required to work any hours. The UK Government’s Job Retention Scheme offered to pay 80% of the wages of employees who were furloughed, up to a maximum of £2500 a month.9 People on furlough are still measured as employed in official statistics. According to the DMP survey around a third of private sector employees were furloughed in 2020 Q2, which accounted for the majority of the fall in hours worked in that period.10 Since June, businesses have also been asked about the impact of measures to contain Covid-19 on their unit costs.11 The DMP survey has not directly asked about the impact of Covid-19 on capital or prices, but there are other data in the survey that we use to estimate these impacts. On capital, we cumulate the reported effects of Covid-19 on investment at the firm level and assume an annual depreciation rate of 4% and no additional capital scrapping.12 On prices, the DMP has since its inception asked firms about changes in output prices over the past year and about expectations for the next year. For the purposes of this paper, we assume that the change in output price inflation in the year to 2020 Q2, relative to 2019, was the effect of Covid-19. Similarly, we assume that changes in expected price inflation for the year to 2021 Q2, relative to expectations for 2020 that were
industries on aggregate productivity. We apply the same industry level scaling factor used to help labour productivity data better match official data to the TFP estimates (this is not available for TFP given industry data are typically normalised) 9 Between August and October 2020 businesses also had to make some contribution towards this. 10 See Figure A6 in the Appendix for a decomposition of the effects of Covid-19 on total hours into employees on furlough, hours worked by employees who remained active and changes in employment. Although furloughing accounts for most of the initial fall in hours worked, by 2021 Q2, almost all of the reduction in hours worked is expected to be via lower employment. 11 The wording of this question is ‘Relative to what would otherwise have happened, what is your best estimate for the impact of measures to contain coronavirus (social distancing, hand washing, masks and other measures) on the average unit costs of your business in each of the following periods?’ 12 Annual investment is equal to about 6% of the capital stock in the UK. The depreciation assumption is consistent with aggregate UK data. The assumption of no additional capital scrapping poses some downside risk to our capital estimates.
8
provided during 2019, were due to Covid-19. We do our calculations at a 1 digit industry rather than firm level and find that the effects of Covid-19 on both capital and prices are small (see Figure 3), so neither of these assumptions have a large impact on our productivity calculations.13 The data that we use in this paper were collected between July and November 2020. For each firm we use the most recently available data point for each question.14 Around 2,000 firms in the DMP survey have answered all of the relevant questions at least once during this period and have all the accounting data necessary to calculate pre-Covid labour productivity and TFP.15 All our analysis is for private sector firms with at least 10 employees. Figure 3 summarises all of the DMP evidence relating to the impact of Covid-19 on inputs and outputs that we use in the productivity calculations. We save a more detailed description of these data for the results section below.16 This approach to gauging the effects of a shock is different to other studies that estimate the productivity impact of shocks, in that we have been able to directly ask firms about the impact of the shock on the variables that determine productivity rather than infer the impact from a before-after comparison or some natural treatment-control comparison. Decomposing productivity into within and between effects In order produce an estimate of the impact of Covid-19 on aggregate productivity in the UK, we weight together pre- and post-Covid estimates of productivity for each firm, where the input weights (e.g. employment or hours worked) are allowed to change to reflect the impact of Covid-19. This approach allows us to decompose the changes in aggregate productivity that are associated with Covid-19 into within and between effects using the formula below, following Baily et al. (1992). The between effects in this decomposition also include effects arising from the entry and exit of firms. Entry and exit effects are more difficult to model using current data from the DMP17, but in the results section below we demonstrate the potential sensitivity of our results to different assumptions around entry and exit.
… within firms (7)
13 We assume that the impact on prices does not persist over the medium term (2022+). 14 Figure A7 in the Appendix shows different monthly vintages of data on the impact of Covid-19 on sales and employment. Monthly changes have been relatively small since July. Not all periods are asked about in all months. For example, questions about 2020 Q2 were only asked in July and questions about 2022+ were only asked in November. Where data are not available for all periods for a firm they are imputed using data from the time periods where data are available for that firm. 15 As a consequence these data differ slightly from aggregate DMP data published by the Bank of England because they are based on a subset of the total sample. 16 Our calculations all rely on questions asking businesses about the marginal impact of Covid-19, relative to what would have otherwise happened. For variables such as sales and employment where the survey asks also asks about what has happened to overall sales and employment recently and about expectations for the year-ahead, it is possible to produce an alternative estimate of the impact of Covid-19 by comparing overall data and assuming that recent trends would have otherwise continued. The two approaches give broadly similar results although these alternative estimates are not available for all periods and not for all variables. 17 In the longer-run we can evaluate these when we obtain the Bureau van Dijk (Amadeus) UK public and private firm population data for 2020 which will be available from late 2021 onwards.

9
… reallocation between surviving firms (8)
…. reallocation to new firms (9)
…. reallocation from exiting firms (10)
Here is GVA per head/hour in firm i at time t, is aggregate GVA per head/hour at time t,
is the employment/hours share of firm i at time t and a bar over a variable indicates the average of the variables across times t-1 and t. Δ is with respect to Covid, not time. ΔEntry and ΔExit denote the firms that, as a result of Covid, are the set of entering and exiting firms. The within effect measures the contribution of changes in firm-level productivity for a given allocation of labour across firms, where the labour allocation is measured as the average at time t and t-1, such that the decomposition is exact.18 The between effect is the impact on total productivity of a reallocation of inputs towards firms with lower or higher levels of productivity. Once again, productivity levels are measured as an average of periods t and t-1. There is an additional between effect arising from the birth or death of firms which depends on both the rate of entry and exit and the extent to which firms who are born or die have levels of productivity that are different to the average. Section 4: Results Our results imply that Covid-19 is likely to have some large and at least partially offsetting effects on productivity (see Figure 4). Within-firm effects lower productivity, primarily because of the higher costs associated with measures to contain coronavirus. In the other direction, between effects push up on productivity as low productivity firms and industries have been more severely affected and will be a smaller proportion of the economy as a result. In this section, we first describe the within effects and then the between effects before bringing the two together and summarising the overall impact. We finish the section by highlighting some measurement issues that might affect our results. Within-firm effects Figure 3 shows how sales initially fell by less than hours worked following the Covid-19 shock, which is likely to have pushed up on within-firm productivity. Businesses, on average, estimated
18 We use this decomposition because it is straightforward to implement. It is also possible to calculate an alternative, but more complex to implement decomposition where changes in employment shares and productivity are multiplied with levels which are measured in period t-1, alongside the introduction of an explicit covariance term.

10
that Covid-19 led to a very sharp fall in sales of around 30% in 2020 Q2 (on an employment weighted basis), relative to what otherwise would have happened.19 But that masks large dispersion between industries with sales in 2020 Q2 in the worst affected industries – accommodation and food and recreational services – estimated at more than 70% lower than they would have been, compared to around 10% in the least affected industries such other production (which includes agriculture, mining and utilities) and information and communication. After 2020 Q2, sales were expected to recover, particularly between 2020 Q2 and Q3, but sales were still expected to be around 5% lower than they would have been by 2021 Q2. Over the medium term (2022+), the effects on sales were expected to be small at around -0.5%. Total hours worked were estimated to have fallen by more than sales in 2020 Q2 and Q3, but with the effect becoming closer to the impact on sales in later quarters. Sales falling by less than hours worked implies that Covid-19 led to an increase in sales per employee within firms in 2020 Q2 and Q3. Increased costs associated with measures to contain Covid-19 will have acted to reduce productivity within firms. These higher intermediate inputs will accordingly push down on value-added relative to sales, such that labour productivity within firms will be lower.20 Firms estimated that Covid-19 increased average unit costs by around 7% in 2020 Q2 and Q3. The unit cost impact of Covid-19 was then expected to taper off somewhat to around 4% by 2021 Q2. A smaller impact on costs of just under 2% was expected to persist into 2022+. As discussed above, we map firms’ reported changes in unit costs into unit intermediate costs and then total real costs and TFP using equation (6) above. In practice, these additional unit costs could reflect two channels: (i) new costs, for example associated with businesses having to buy things like PPE and plastic screens; and (ii) increased unit costs that arise from a reduction in capacity, for instance social distancing at restaurants reducing the number of tables available. The DMP survey has also asked about the impact of Covid-19 on capacity. In 2020 Q3, businesses estimated that Covid-19 had reduced capacity by around 10% on average. At the firm-level, there is a clear correlation between reductions in capacity and reported increases in unit costs (see Figure A8 in the Appendix). But in a simple regression this correlation is less than one-for-one, implying some role for new costs too. Figure 5 summarises the contributions of both real sales per employee and intermediate costs to aggregate within-firm labour productivity per hour. As well as the percentage impact on sales, hours worked and prices, this also depends on whether the effects in percentage terms are the same for high and low productivity firms. For example, a 10% reduction in productivity for a firm with a low starting level of productivity has a smaller effect on aggregate productivity than a 10% fall for a firm with a high starting level productivity.21
19 Using sales weights the fall in sales in 2020 Q2 is estimated to have been smaller at 26%. This fall in sales is smaller because sales weights give less weight to lower productivity sectors than employment weights. 20 One corollary of this rise in intermediate inputs is that, in those places where early vintages of GDP are measured using firms’ sales growth as a proxy, GDP may be overstated. We give more detail on this in the measurement section below. 21 In 2020 Q2, the impact of Covid-19 on labour productivity per hour was estimated to have been more negative for firms with a higher starting level of productivity. This was because some low productivity firms furloughed a large percentage of their workers and reported sales fell by less than hours worked. However, by 2021 Q2 there is no longer a clear relationship.

11
The effects of Covid-19 on within-firm labour productivity per hour are estimated to be negative through the period from 2020 Q2 to 2021 Q2 (see Figure 5). The average within effect over this period is around -2%, although peaking at -4% in 2020 Q4. A smaller negative effect is of around -1% is also expected over the medium term. The contributions from real sales per employee are typically positive. But the overall within effect is negative throughout because of persistent negative contributions from higher intermediate costs, although this contribution starts to become smaller as we move into 2021 and beyond as the extent of these additional costs is expected to fall back (see Figure 5). On a per job basis, the within effects on labour productivity are estimated to be much more negative than on a per hour basis in 2020 (see Figure A9 in the Appendix). That is because employment in jobs terms fell by much less than employment in hours (shown on Figure 3), as much of the initial reduction in hours came from employees being placed on furlough (and still measured as being employed) rather than through job cuts.22 The impact on TFP, relative to hourly labour productivity, will depend on whether the impact on the capital stock is anticipated to be larger or smaller than on hours worked. Figure 3 shows that investment is expected to be more negatively affected than sales, and to recover more slowly. However, quarterly investment is equal to only about 1.5% of the capital stock on average, so that Covid-19 is anticipated to only reduce the capital stock by around 2% by 2021 Q2. This means that elasticity-weighted inputs are expected to fall by less than labour inputs, such that within-firm TFP is expected to perform worse than labour productivity (Figure 6 shows the different contributions from weighted inputs). Between 2020 Q2 and 2021 Q2, Covid-19 is expected to have lowered within-firm TFP by around 5% on average, with a peak impact of -9% in 2020 Q2. As with labour productivity, the within-firm effects become less negative in later quarters as the additional cost pressures start to ease. Over the medium term, for 2022+, within-firm TFP is estimated to be around 1% lower than it would have been without the Covid-19 pandemic. The analysis of the within-firm effects on productivity described above is an accounting type exercise. It provides some insight into the reasons for lower within productivity, particularly the role of high intermediate costs, but it does not directly link all of these effects to economic explanations. Questions in the DMP survey have asked about some of the potential channels. For example, DMP members estimated that R&D investment in 2020 is likely to be around 14% lower than it otherwise would have been (see Figure 7). Reduced investment in R&D and innovation would be likely to lower within productivity, although the effects of this might be largest over the longer term. Another relevant factor might be time spent by senior management on managing the effects of Covid-19 on their business, which might have otherwise been spent on productivity enhancing activities. DMP members estimated that their CEO’s have spent large amounts of time managing the effects of Covid-19 on their business over the 6 months to November 2020 (Figure 7) - around 12 hours a week on average. Bloom et al. (2019) show how time spent preparing for Brexit was associated with lower productivity among UK firms, indicating that this channel is potentially important. Senior managers are critical for developing new products and processes, and if they are
22 Figure A6 in the Appendix shows contributions to total hours worked from the different channels.

12
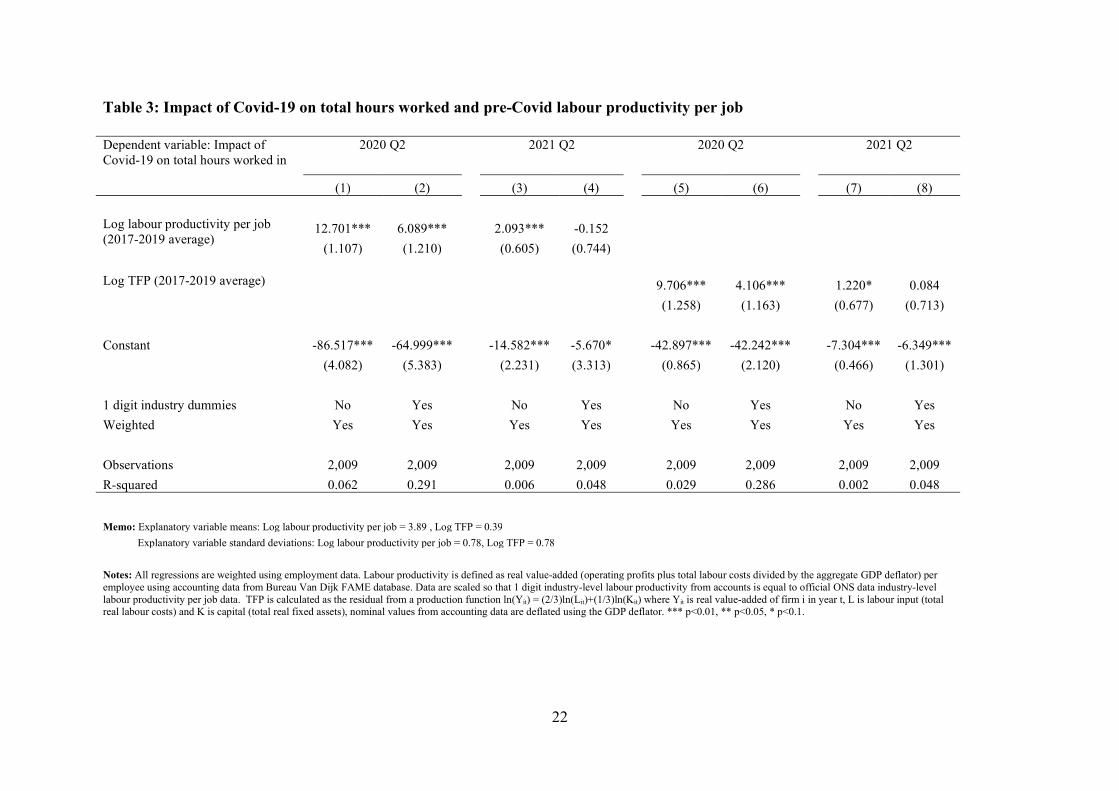
absorbed in dealing with the pandemic this type of long-run productivity enhancing activity will suffer. Finally, there may be some positive offsetting impact of working from home on firm productivity. However, the magnitude of this is likely to be small at possibly around 2% in the longer-run (Barrero et al. 2020a), and there may also be some channels through which more regular working from home reduces productivity, for example through reduced innovation and creativity. It is estimated that the number of days that employees are likely to be working from home post-Covid will rise from around 5% pre-Covid to around 25% of days post-Covid, which combined with (at best) a 10% increase in productivity from home working leads to only a limited 2% rise in productivity.23 Between-firm effects Firms anticipate that the impact of Covid-19 will vary a great deal across sectors and across firms within those sectors. In particular, firms that have seen the most negative effects on demand and employment are generally those that are least productive. The reason for this is the most face-to-face sectors of the economy that suffered the largest pandemic contractions – leisure, entertainment, accommodation and food and travel – have lower levels of labour productivity.24 This gives rise to a positive between or ‘reallocation effect’. This section describes these effects in more detail. It starts by discussing reallocation effects between surviving firms and then considers the possible effects from firm entry and exit. The blue dots on Figure 8 show there was a strong positive correlation between pre-Covid labour productivity and the impact of Covid-19 on hours worked at the firm level in 2020 Q2.25 The chart implies that the least productive firms saw a fall of around 60%, on average, in hours worked, compared to around 20% for the most productive firms, relative to what would have otherwise happened. As we input-weight productivity in our calculations it is this relationship that is a key determinant of the extent of the reallocation effects. The data for 2020 Q2 shows that higher productivity firms shrank less and therefore saw their overall weight increase, while low productivity firms shrank more and saw their weight fall. The size of the differences is large, which is consistent with there being a large positive between-firm effect in that period. The red diamonds on Figure 8 show that, by 2021 Q2, a positive relationship between pre-Covid labour productivity and the impact of Covid-19 on hours worked was expected to remain. But the effects on hours worked are much smaller, implying that a positive reallocation effect is expected to persist, albeit much smaller than in 2020 Q2. Table 3 formalizes the scatter plot shown in Figure 8 into some simple regressions. The dependent variable is the impact of Covid-19 on hours worked at the firm level in different periods. Column (1) shows the strong positive relationship between pre-Covid labour productivity and the impact
23 Dingel and Neiman (2020) show that a large fraction of jobs in industrialised countries can be done from home. 24 This is, perhaps, unsurprising given their relatively high shares of low wage workers and low levels of capital intensity. 25 We do not have historic data on hours worked at the firm level but rather only on the number of employees. Consequently, we use labour productivity per job in this analysis as our measure of pre-Covid productivity. This implicitly assumes that average hours worked per employee are the same across all firms.

13
of Covid-19 on hours worked in 2020 Q2. In column (2), we add 1-digit industry dummies. The coefficient on pre-Covid labour productivity more than halves but is still statistically significant. That indicates how reallocation between industries, or inter industry effects as we define them, plays an important role in explain the overall reallocation effects, but there is still some effect from within industries, or intra industry effects. The latter within industry effect could potentially reflect that fact that more productive firms are better managed and more able to cope with the dislocation of the pandemic, or possibly better capitalized so more able to deal with a period of tough business conditions. For 2021 Q2, shown in column (3), the coefficient on pre-Covid labour productivity is much smaller than for 2020 Q2, consistent with a smaller reallocation effect. Again, the size of coefficient drops once industry is controlled for in column (4) and is no longer significant this time, implying that reallocation between industries at least is expected to remain important. Columns (5) to (8) replicate this analysis in TFP space. The results are similar to those for labour productivity. Figure 9 highlights how an important source of the inter-industry reallocation effects is because the falls in hours worked were reported to have been largest in 2020 Q2 in recreational services and in accommodation and food, which are also the two lowest productivity industries that we consider. These are both industries where a large proportion of spending involves face-to-face contact and/or social activity and where it is particularly difficult for these services to be provided from home. Figure A10 in the Appendix shows how lower productivity industries were less likely to involve home working prior to Covid and to have a higher percentage of sales that involve face-to-face contact with customers. Importantly, it is worth highlighting this positive between industries impact of productivity is not entirely the usual Schumpeterian process of creative destruction. Instead much of this is simply destruction of low productivity industries like accommodation and food or recreational services without substantial creation in other industries (as evidenced by the large reduction in overall employment). So, while this may increase average productivity it will reduce total economic output, and potentially reduce overall welfare. Figure 10 summarises the estimated between effects among surviving firms. The effects are positive and large in 2020 Q2, around 10% in hourly labour productivity space and 7% for TFP.26 The effects then diminish sharply over the subsequent four quarters as overall hours worked recover and as differences between the most and least affected sectors and firms become smaller. A positive between effect of just over 1% was expected to remain by 2021 Q2 on both measures, although this is expected to diminish further over the medium term. On average, inter-industry reallocation between industries accounts for around 85% of the total between effects on hourly labour productivity. For TFP, the inter-industry component accounts for more like 75% of the positive effect in 2020 and 2021. The above analysis focuses on reallocation effects between surviving firms. This is the main source of reallocation effects that we identify, but firm entry and exit can contribute too. These effects are more difficult to quantify using the DMP survey because firms are not asked whether they expect Covid-19 to put them out of business, and businesses that have yet to be born are clearly not part
26 Between effects on labour productivity per head are small throughout given the impact of Covid-19 on employment is estimated to be much smaller than the effects on hours. This is shown in Figure A9 in the Appendix.
14
of the survey either. But we can describe what any firm entry and exit effect will depend on and provide some sensitivity analysis. The key determinants of how Covid-19 will affect productivity through firm entry and exit will be: (i) how Covid-19 affects the number of jobs lost/created, relative to what would have otherwise happened; and (ii) what is the average productivity of firms that die versus the average productivity of new firms that are born. Figure 11 shows that employment weighted firm births and deaths both fell during 2020. They were both around 15% lower than in 2019, such that net entry and exit was little changed. So, unless there were large changes in the productivity of new firms and those that die, relative to usual, firm entry and exit is likely to have had little impact on productivity up to 2020 Q3. Firm entry and exit could have effects on productivity over a longer time horizon if Covid-19 leads to a large rise in firm failures. The presence of Government support schemes and delays in processing insolvencies caused by lockdown restrictions (such as reduced operation of courts) can help to explain why firm deaths have fallen during the first three quarters of 2020. But these are likely to be temporary factors. Firm births might also fall further. Below we explore the sensitivity of our calculations to a scenario in which the employment weighted firm death rate rises by just under 30%, and the birth rate falls by a similar amount. We do this just for firms with more than 10 employees, given that is the sample we use for the rest of our analysis.27 This scenario would lower overall employment by 1% in 2021 Q2, with equal contributions of 0.5% from lower births and higher deaths. Such a scenario would be of a broadly similar order of magnitude to the financial crisis of 2008-09 (see Figure 11). Firms that are newly born and those that die tend to be less productive than average. That implies lower births and higher deaths will raise average productivity, since there are fewer low productivity firms in the economy than there would otherwise have been. Using labour productivity data derived from company accounts for the DMP sampling frame, businesses incorporated since 2016 have on average been 19% less productive than the average firm in their first year. Businesses that have failed over this period have been 15% less productive than average in the year before they died. In our scenario we assume that new firms that could have been born would have been 20% less productive than average, in line with historical data. The 1% of firms in the DMP data who expect the largest reduction in sales from Covid-19 are only 50% as productive as average so we assume firms who die are 50% less productive than average because the Covid-19 shock has been particularly concentrated among low productivity sectors.28 In our simple scenario, lower firm births would raise average productivity by 0.1% by 2021 Q2, and higher deaths would add a further 0.2%, making a total of 0.3% from firm entry and exit (see
27 The statistics on firm births and deaths discussed in the previous paragraph are for firms of all sizes because timely data on firm births and deaths for 2020 were only available for all firms at the time of writing. Data on births and deaths by firm size are only available on an annual basis with more of a lag. 28 Note that assuming firms that exit are only 15% less productive would make the overall impact of Covid-19 more negative on productivity, so this is a potentially conservative estimate, although given the small impact of entry and exit on the overall productivity effect of Covid-19 this is not material.

15
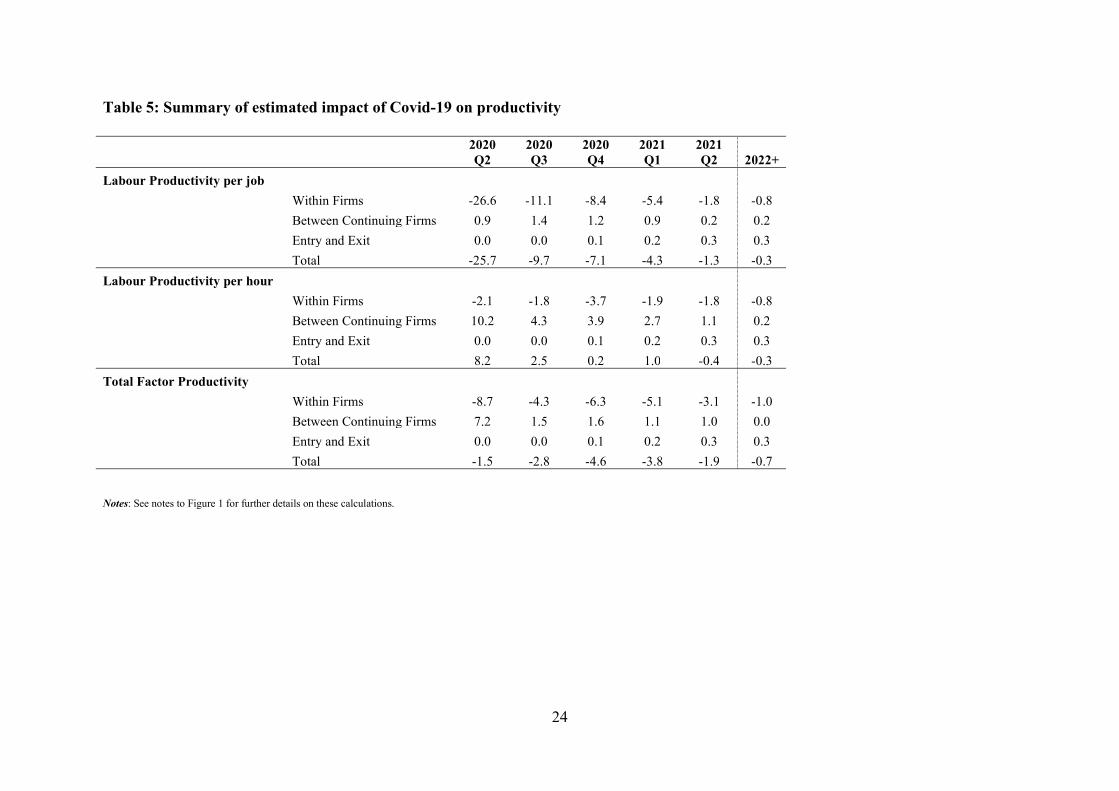
Table 4).29 That is smaller than the effect of around 1% from reallocation between existing firms in 2021 Q2, and much smaller than the larger reallocation effects in earlier quarters. The precise numbers are sensitive to the assumptions of the scenario, but overall this analysis suggests that Covid-19 could modestly raise the average productivity of our sample through reduce firm entry and increased exit. Overall impact Bringing all of the different channels together, we estimate that Covid-19 is likely to lower TFP (see Figure 1 and Table 5). Although between-firm effects are likely to push up on TFP, our estimates suggest that it will be more than offset by lower within-firm TFP, partly associated with an increase in intermediate costs. Between 2020 Q2 and 2021 Q2, TFP is estimated to be around 3% lower, on average, than it would have been otherwise because of Covid-19, with a peak impact of 5% in 2020 Q4. However, in those earlier periods the magnitude of the offsetting positive between and negative within effects were much larger (see Figure 4). Our estimates imply that TFP will be around 1% lower over the medium term (2022+). The effects of Covid-19 on hourly labour productivity are estimated to be less negative than those on TFP. That is because hours worked fall by more than elasticity-weighted capital and labour inputs. In 2020 Q2, hourly labour productivity is estimated to have increased markedly.30 Those effects fall back after 2020 Q2 and become slightly negative by 2021 Q2. A small negative effect of around -0.3% is implied over the medium term. The effects on labour productivity per job are estimated to be negative throughout, particularly in 2020 Q2 and Q3 as the number of jobs falls by much less than hours worked. Section 5: Measurement issues The results presented in this paper are clearly heavily dependent on businesses’ expectations and their response to the DMP survey. The analysis above attempts to measure and project the impact of Covid-19 on ‘true’ labour productivity and TFP. There may be some ways in which our analysis does not perfectly capture this concept. But official published data may also measure changes in productivity with some error. In this section we enumerate the sources of some of these potential measurement errors:31
29 The firms who are assumed to die would still shrink in our baseline calculations. That is accounted for in our between analysis of surviving firms. We allow for this therefore estimate the effect of firm deaths at 0.2% rather than 0.25% to prevent double counting. 30 A flash estimate of official data from the ONS points to a fall in hourly labour productivity of around 2% in 2020 Q2 rather than an increase of 8% from the DMP data. That can be entirely accounted for by a smaller fall in hours worked in the ONS data. However, much of the fall in hours worked in our estimates is accounted for by employees being furloughed, and in this respect the DMP data match up closely with administrative data from HMRC who run the scheme and other business surveys such as the ONS BICS survey. But data from the Labour Force Survey on employees temporarily away from work, which is normally used in the construction of official productivity statistics point to smaller proportion of employees on furlough. Publication of labour productivity data have been delayed while this discrepancy is investigated further. No official data on TFP in the UK during the pandemic have yet been published at the time of writing. 31 For example see ONS articles on measurement issues affecting National Accounts; prices; the labour market; and productivity

16
Capital and Labour reallocation costs The reallocation of output across firms and sectors may involve adjustment costs for capital and labour, for example the costs of moving, scrapping or repurposing capital, or the time required to retrain workers (e.g. Hammermesh and Pfann (1996) or Cooper and Haltiwanger (2006)). As such this will lower the positive impact of productivity through lost current or future output.32 This could be particularly important for the Covid-19 shock given the extent of reallocation and its large cross-sectoral nature (e.g. Barrero et al. (2020b)).
Social distancing, capital utilization and capital productivity Capital productivity will be reduced by social distancing if business premises (e.g. restaurants and offices) must operate with few customers and staff. There will be less labour input and value-added per square metre. This can be thought of as a reduction in the productivity of capital and hence TFP. However, utilization of equipment will be reduced by social distancing if this is located too closely together to be fully used (think of a barber shop that can only use every other chair), so conceptually this could also be defined in terms of lower capacity utilization. Either way output will fall from the given capital stock. One material effect could be if lower capital utilization leads to lower capital depreciation, although we think this effect is likely to be very small – restaurants, shops, factories etc. operating at reduced capacity are probably not going to have materially lower deprecation rates of buildings and equipment.
Working from home and factor inputs Workers working from home will employ capital (e.g. home offices) and consume intermediates (e.g. electricity) which contribute to firms’ value added but are not recorded as such. Labour hours may be understated by working from home, if home-based employees work longer hours per day. There is evidence to suggest workers at home work longer hours as part of the time previously devoted to commuting is used to work. In reverse, however, labour hours at home may be lower than reported if employees have to carry out childcare while working. On net it appears working from home may marginally increase longer-run productivity (e.g. Barrero et al. (2020a) and Emanuel and Harrington (2020)).
Labour quality Official TFP estimates make adjustments for the average quality of labour input. To the extent that our estimates account for the changes in composition of the workforce from higher productivity firms having a relatively higher weight in the economy than they did, they should account for this. But they will not necessarily account for changes in labour quality within businesses. For example, low skilled employees within a business may have been more likely to be placed on furlough.
32 This point has also been made in the context of the broader debate about misallocation, e.g. Asker et al. (2014).

17
Business use of intermediate inputs The question on unit costs in the DMP survey is about total unit costs, from which we assume the rise in intermediate unit costs is the same as the effects on total costs. But it could be that intermediate unit costs rise by more than unit labour costs. If that were true, the substantial negative within effects from higher intermediate costs would be even larger than we estimate. Section 6: Conclusions This paper presents a detailed bottom-up analysis of the impact of Covid-19 on productivity in the UK, which has experienced a similar impact of Covid-19 to the US and other advanced European countries. We employ survey data from the Decision Maker Panel (DMP), a large and representative monthly panel survey of around 3,000 UK firms that was established in 2016. We take pre-Covid-19 measures of firm-level productivity derived from company accounts data for UK businesses and project them forward using more timely data on the impact of Covid-19 from the DMP. While the DMP survey does not directly ask about productivity, it has asked about the impact of Covid-19 on all of the main components of productivity, covering inputs, outputs and prices. Our analysis covers each quarter between 2020 Q2 and 2021 Q2 and presents medium-term estimates for 2022+. We assess the impact of Covid-19 on both measures of labour productivity and total factor productivity (TFP). We build our results up from the firm level and decompose the aggregate impacts into within and between effects using the accounting framework of Baily et al. (1992). Our results suggest that Covid-19 will reduce TFP in the UK private sector by up to 5% in 2020 Q4 and by around 1% in 2022 and beyond. Businesses anticipate a large reduction in productivity within firms, partly because measures to contain Covid-19 are expected to increase intermediate costs. The negative within-firm effect is expected to be partially offset by a positive between-firm effect as low productivity sectors, and the least productive firms within them, are disproportionately affected and make a smaller contribution to the economy. We note these positive between-firm effects are a mix of creative-destruction – low productivity firms being replaced by higher productivity firms – and destruction in that low productivity industries like accommodation, entertainment and travel have shrunk with limited offsetting expansion of other industries. As such while these between effects may boost productivity through a positive averaging effect they will not increase total output. The dynamics of the Covid-19 effect are also very notable. In earlier quarters these offsetting negative within and positive between firm effects are both estimated to have been larger. The effects of Covid-19 on hourly labour productivity are estimated to be less negative than those on TFP because hours worked fall by more than elasticity-weighted capital and inputs. In the longer run, we see that Covid-19 has led to a large reduction in R&D expenditure by firms. There are also issues around the efficacy of this R&D because of the difficulty of carrying out research under lockdown if scientists and engineers cannot physically access equipment. As we report, Covid-19 has also been extremely time consuming for senior managers with CEOs

18
spending about a third of their time directly dealing with the pandemic, which is time that has presumably been taken away in part from other longer-run productivity enhancing activities. To some extent these channels may be factored in to businesses’ longer-term expectations and may help to explain why TFP is expected to be around 1% lower over the medium term. But it may also take time for these effects to become apparent and there may potentially be some additional longer run negative effect on productivity from diminished innovation and intangible investment by firms.

19
References Adams-Prassl, Abi, Teodora Boneva, Marta Golin, and Christopher Rauh (2020), “Inequality in
the Impact of the Coronavirus Shock: Evidence from Real Time Surveys”, CEPR Discussion Paper 14665.
Alekseev, Georgij, Safaa Amer, Manasa Gopal, Theresa Kuchler, JW Schneider, Johannes Stroebel & Nils C. Wernerfelt (2020), “The Effects of COVID-19 on U.S. Small Businesses: Evidence from Owners, Managers, and Employees”, NBER Working Paper 27833.
Alon, Titan, Doepke, Matthias, Olmstead-Rumsey and Michele Tertilt (2020), “This time it’s different: The Role of Women’s Employment in a Pandemic Recession”, Manheim mimeo.
Altig, D., Barrero, J. M., Bloom, N., Davis, S. J., Meyer, B. H., & Parker, N. (2020), “Surveying business uncertainty”, Journal of Econometrics (Forthcoming).
Altig, D., Baker, S., Barrero, J.M., Bloom, N., Bunn, P., Chen, S., Davis, S.J., Leather, J., Meyer, B., Mihaylov, E. and Mizen, P. (2020), “Economic uncertainty before and during the COVID-19 pandemic”, Journal of Public Economics, 191, article 104274.
Asker, John, Allan Collard-Wexler, and Jan De Loecker, (2014), “Dynamic Inputs and Resource (Mis)Allocation” Journal of Political Economy, 122, pp. 1013– 1063.
Baily, M.N., Hulten, C., Campbell, D., Bresnahan, T. and Caves, R.E. (1992), “Productivity dynamics in manufacturing plants”, Brookings papers on economic activity. Microeconomics, 1992, pp. 187-267.
Baqaee and Farhi (2020), “Supply and Demand in Disaggregated Keynesian Economies with an Application to the Covid-19 Crisis”, mimeo.
Barrero, Jose, Bloom, Nicholas and Steven Davis (2020a), “Why working from home will stick”, Becker-Friedman Institute Working Paper.
Barrero, Jose, Bloom, Nicholas and Steven Davis (2020b), “COVID-19 is also a reallocation shock”, NBER Working Paper 27137.
Barnett, A., Chiu, A., Franklin J., and Sebastiá-Barriel, M (2014), “The productivity puzzle: a firm-level investigation into employment behaviour and resource allocation over the crisis”, Bank of England Staff Working Paper 495.
Bartelsman, E., Haltiwanger, J. and Scarpetta, S. (2013), “Cross-country differences in productivity: The role of allocation and selection”, American Economic Review, 103(1), pp. 305-34.
Bartik, Alexander, Marianne Bertrand, Zoë B. Cullen, Edward L. Glaeser, Michael Luca, and Christopher Stanton, (2020), “The Impact of COVID-19 on Small Business Outcomes and Expectations”, Proceedings of the National Academy of Sciences 117, no. 30 (July 28, 2020).
Bartik, Alexander W., Zoe B. Cullen, Edward L. Glaeser, Michael Luca, and Christopher T. Stanton (2020), “What Jobs are Being Done at Home During the Covid-19 Crisis? Evidence from Firm-Level Surveys,” NBER Working Paper 27422.
Bloom, Nicholas, Bunn, Phil, Mizen, Paul, Smietanka, Pawel and Thwaites, Gregory (2019), “The impact of Brexit on UK firms”, NBER Working Paper 26218.
Bloom, Nicholas, Charles I. Jones, John Van Reenen and Michael Webb (2020), “Are Ideas Getting Harder to Find?”, American Economic Review, March, pp. 1104-1144.
Bloom, Nicholas, Fletcher, Robert and Ethan Yeh (2020), “The Impact of COVID-19 on US Firms”, Stanford mimeo.

20
Brynjolfsson, Erik, John J. Horton, Adam Ozimek, Daniel Rock, Garima Sharma, and Hong-Yi TuYe (2020), “COVID-19 and Remote Work: An Early Look at US Data”, NBER Working Paper 27344.
Buffington, Catherine, Carrie Dennis, Emin Dinlersoz, Lucia Foster, and Shawn Klimek, (2020), “Measuring the effect of Covid-19 on us small businesses: The small business pulse survey”, Discussion paper.
Cajner, Tomaz, Ryan A. Crane, Leland D.and Decker, John Grigsby, Adrian Hamins-Puertolas, Erik Hurst, Christopher Kurz, and Ahu Yildirmaz, (2020,) “The U.S. Labor Market during the Beginning of the Pandemic Recession.” NBER Working Paper 27159.
Chetty, R., Friedman, J., Hendren, N. and Stepner, M. (2020), “The economic impacts of COVID-19: Evidence from a new public database built from private sector data”, Opportunity Insights.
Cooper, Russell and John Haltiwanger (2006), “On the Nature of the Capital Adjustment Process”, Review of Economic Studies, 73, pp. 611–633.
Cowen, Tyler. 2011. The Great Stagnation: How America Ate All the Low-Hanging Fruit of Modern History, Got Sick, and Will (Eventually) Feel Better. New York: Dutton.
Dingel, J.I. and Neiman, B. (2020), “How many jobs can be done at home?”, NBER Working Paper 26948.
Emanuel, Natalia and Emma Harrington (2020), “Working” remotely?: Selection, treatment and the market provision remote work”, Harvard mimeo.
Foster, Lucia, John Haltiwanger and C.J. Krizan (2001), “Aggregate Productivity Growth: Lessons from Microeconomic Evidence”, New Developments in Productivity Analysis, NBER, University of Chicago Press.
Gordon, Robert J. 2016. The Rise and Fall of American Growth: The US Standard of Living since the Civil War. Princeton, NJ: Princeton University Press.
Gourinchas, P. O., Kalemli-Özcan, Ṣ., Penciakova, V., & Sander, N. (2020), “Covid-19 and SME Failures”, NBER Working Paper 27877.
Guerrieri, V., Lorenzoni, G., Straub, L. and Werning, I., (2020), “Macroeconomic Implications of COVID-19: Can Negative Supply Shocks Cause Demand Shortages?”, NBER Working Paper 26918.
Hamermesh, Daniel and Gerard A. Pfann (1996), “Adjustment Costs in Factor Demand”, Journal of Economic Literature Vol. 34, No. 3 (Sep., 1996), pp. 1264-1292
Jones, Benjamin F. (2009), “The Burden of Knowledge and the ‘Death of the Renaissance Man’: Is Innovation Getting Harder?”, Review of Economic Studies 76 (1): 283–317.
Jordà, Ò., Singh, S.R. and Taylor, A.M. (2020), “Longer-run economic consequences of pandemics”, NBER Working Paper 26934.
Kahn, Lisa B., Fabian Lange, and David G. Wiczer (2020), “Labor Demand in the Time of COVID-19: Evidence from Vacancy Postings and UI Claims”, NBER Working Paper 27061.
Mongey, Simon, Laura Pilossoph, and Alex Weinberg (2020), “Which Workers Bear the Burden of Social Distancing Policies?”, NBER Working Paper 27085.
Papanikolaou, Dimitris, and Lawrence D. W. Schmidt (2020), “Working Remotely and the Supply-side Impact of Covid-19”, NBER Working Paper 27330.
Syverson, Chad, (2011), “What Determines Productivity?”, Journal of Economic Literature, 49(2), 326-365.

20
Table 1: Summary Statistics
Mean SD p25 p50 p75 N
Employment 213 304 49 99 219 2009
ln(GVA, £ '000) 8.595 1.211 7.826 8.452 9.275 2009
ln(Labour Productivity, £ '000) 3.849 0.775 3.342 3.790 4.292 2009
ln(TFP, £ '000) 0.387 0.781 -0.095 0.386 0.833 2009
Notes: Firm characteristics are averages of 2017 to 2019 accounts data from Bureau Van Dijk FAME database. Gross Value Added (GVA) is defined as operating profits plus total labour costs divided by the aggregate GDP deflator. Labour productivity is defined as real value-added per employee using accounting data. Data are scaled so that 1 digit industry-level labour productivity from accounts is equal to official ONS data industry-level labour productivity per job data. Total Factor Productivity (TFP) is calculated as the residual from a production function ln(Yit) = (2/3)ln(Lit)+(1/3)ln(Kit) where Yit is real value-added of firm i in year t, L is labour input (total real labour costs) and K is capital (total real fixed assets), nominal values from accounting data are deflated using the GDP deflator. All variables are winsorized at bottom and top 1%.

21
Table 2: Linear probability models for propensity to respond to the DMP
(1) (2) (3)
Sample Mar-Sep 20 Jan19-Nov 20
Industry impact of Covid on sales in 2020 Q2 -0.001
(0.007)
Ln(Pre-Covid labour productivity) 0.726***
(0.047)
Industry impact of Covid on sales in 2020 Q2 interacted with Covid period dummy variable
0.002
(0.004) Ln(Pre-Covid labour productivity) interacted with Covid period dummy variable
-0.083
(0.072)
Survey wave dummies Yes Yes Yes
1 digit industry dummies No Yes Yes
Individual firm fixed effects No No No
Observations 324,279 865,222 865,222
R-squared 0.005 0.007 0.008
Notes: Linear probability model for whether a firm in the sampling frame responds to the DMP survey in each month between January 2019 and November 2020 (1=responded to DMP, 0=Not responded). Firm characteristics are averages of 2017 to 2019 accounts data from Bureau Van Dijk FAME database. Labour productivity is defined as real value-added (operating profits plus total labour costs divided by the aggregate GDP deflator) per employee using accounting data. Regressions only includes firms who were part of the sampling frame in January 2019 and who have productivity data available from company accounts. Covid period dummy variable takes the value of one for March to November 2020. All equations are estimated by OLS. Standard errors are clustered at the firm level. *** p<0.01, ** p<0.05, * p<0.1.
22
Table 3: Impact of Covid-19 on total hours worked and pre-Covid labour productivity per job Dependent variable: Impact of Covid-19 on total hours worked in
2020 Q2 2021 Q2 2020 Q2 2021 Q2
(1) (2) (3) (4) (5) (6) (7) (8)
Log labour productivity per job (2017-2019 average)
12.701*** 6.089*** 2.093*** -0.152
(1.107) (1.210) (0.605) (0.744) Log TFP (2017-2019 average) 9.706*** 4.106*** 1.220* 0.084
(1.258) (1.163) (0.677) (0.713)
Constant -86.517*** -64.999*** -14.582*** -5.670* -42.897*** -42.242*** -7.304*** -6.349***
(4.082) (5.383) (2.231) (3.313) (0.865) (2.120) (0.466) (1.301)
1 digit industry dummies No Yes No Yes No Yes No Yes
Weighted Yes Yes Yes Yes Yes Yes Yes Yes
Observations 2,009 2,009 2,009 2,009 2,009 2,009 2,009 2,009
R-squared 0.062 0.291 0.006 0.048 0.029 0.286 0.002 0.048
Memo: Explanatory variable means: Log labour productivity per job = 3.89 , Log TFP = 0.39
Explanatory variable standard deviations: Log labour productivity per job = 0.78, Log TFP = 0.78
Notes: All regressions are weighted using employment data. Labour productivity is defined as real value-added (operating profits plus total labour costs divided by the aggregate GDP deflator) per employee using accounting data from Bureau Van Dijk FAME database. Data are scaled so that 1 digit industry-level labour productivity from accounts is equal to official ONS data industry-level labour productivity per job data. TFP is calculated as the residual from a production function ln(Yit) = (2/3)ln(Lit)+(1/3)ln(Kit) where Yit is real value-added of firm i in year t, L is labour input (total real labour costs) and K is capital (total real fixed assets), nominal values from accounting data are deflated using the GDP deflator. *** p<0.01, ** p<0.05, * p<0.1.

23
Table 4: Sensitivity of Covid-19 productivity impact to allowing for firm entry and exit
Firms who enter Firms who exit
Labour productivity per job relative to average:
Data: 2016-2019 81% 85%
Assumption: Covid-scenarios 80% 50%
Lower entry scenario Higher exit scenario Combined scenario
Change in total employment -0.5% -0.5% -1%
Impact on aggregate labour productivity +0.1% +0.2% +0.3%
Notes: Labour productivity is defined as real value-added (operating profits plus total labour costs divided by the aggregate GDP deflator) per employee and is estimated using accounting data from Bureau Van Dijk FAME database. Labour productivity of firms who enter is productivity in their first year of accounts after incorporation and is based on firms who have been incorporated since 2016. Labour productivity of firms who die is productivity in their last year of accounts and is based on firms who have entered liquidation or who have been dissolved since 2016.
24
Table 5: Summary of estimated impact of Covid-19 on productivity
2020 Q2
2020 Q3
2020 Q4
2021 Q1
2021 Q2 2022+
Labour Productivity per job
Within Firms -26.6 -11.1 -8.4 -5.4 -1.8 -0.8
Between Continuing Firms 0.9 1.4 1.2 0.9 0.2 0.2
Entry and Exit 0.0 0.0 0.1 0.2 0.3 0.3
Total -25.7 -9.7 -7.1 -4.3 -1.3 -0.3
Labour Productivity per hour
Within Firms -2.1 -1.8 -3.7 -1.9 -1.8 -0.8
Between Continuing Firms 10.2 4.3 3.9 2.7 1.1 0.2
Entry and Exit 0.0 0.0 0.1 0.2 0.3 0.3
Total 8.2 2.5 0.2 1.0 -0.4 -0.3
Total Factor Productivity
Within Firms -8.7 -4.3 -6.3 -5.1 -3.1 -1.0
Between Continuing Firms 7.2 1.5 1.6 1.1 1.0 0.0
Entry and Exit 0.0 0.0 0.1 0.2 0.3 0.3
Total -1.5 -2.8 -4.6 -3.8 -1.9 -0.7
Notes: See notes to Figure 1 for further details on these calculations.

25
Table A1: Position of DMP respondents Title Percentage of respondents
CEO 13%
CFO/Finance Director 73%
Financial Controller/Manager/Executive 9%
Other 5%
Notes: Results are based on the question: ‘Could you tell us the position of the person in your business that typically completes the Decision Maker Panel Survey?’ and respondents were asked to choose from the following options: ‘CFO’, ‘CEO’, ‘Other (please state): …’.

Figure 1: Impact of Covid-19 on measures of productivity
Notes: Impacts on productivity are estimated as ΔΠ𝑡𝑡 = ∑i∈Surv �𝜑𝜑𝑖𝑖Δπi,t + ∑𝑖𝑖∈𝑆𝑆𝑆𝑆𝑆𝑆𝑆𝑆 Δ𝜑𝜑𝑖𝑖,𝑡𝑡 �𝜋𝜋𝑖𝑖 − �Π where πi,t is productivity in firm i at time t, Π𝑡𝑡 is productivity at time t, 𝜑𝜑𝑖𝑖,𝑡𝑡 is the labour input share of firm i at time t and a bar over a variable indicates the average of the variables across times t-1 and t. Changes between t and t-1 are changes due to Covid-19 only. The impact of Covid-19 on labour productivity for each firm is calculated as 𝑑𝑑𝑑𝑑𝑑𝑑
𝑑𝑑𝑑𝑑=𝑑𝑑𝑑𝑑
𝑑𝑑– 𝑑𝑑𝑑𝑑
𝑑𝑑– 𝑑𝑑𝑑𝑑
𝑑𝑑–
𝑑𝑑𝑑𝑑𝑑𝑑
𝑤𝑤𝑤𝑤𝑤𝑤𝑤𝑤𝑤 𝑑𝑑𝑑𝑑𝑑𝑑
= 𝑑𝑑𝑑𝑑−𝑑𝑑
𝑑𝑑𝑑𝑑𝑈𝑈
𝑑𝑑𝑈𝑈 . The impact of Covid-19 on labour productivity for each firm is calculated as 𝑑𝑑𝑑𝑑𝑑𝑑𝑑𝑑𝑑𝑑𝑑𝑑𝑑𝑑
=𝑑𝑑𝑑𝑑𝑑𝑑
– 𝑑𝑑𝑑𝑑𝑑𝑑
–β 𝑑𝑑𝑑𝑑𝑑𝑑
–α 𝑑𝑑𝑑𝑑𝑑𝑑
– 𝑑𝑑𝑑𝑑𝑑𝑑
. LP is labour productivity, TFP is total factor productivity, Y is nominal sales, P is the price level, L is labour input, M are non-labour intermediate costs, MU are intermediate unit costs and K is capital input.
-30
-25
-20
-15
-10
-5
0
5
10
2019 Q4 2020 Q1 2020 Q2 2020 Q3 2020 Q4 2021 Q1 2021 Q2 2022+
Labour productivity per jobLabour productivity per hourTFP
Percentage impact of Covid-19

Figure 2: DMP response rate
Notes: The response rate of active panel members is calculated as the percentage of panel members who had completed at least one survey over the last twelve months who responded to the survey in a given month.
0
500
1,000
1,500
2,000
2,500
3,000
3,500
4,000
20
25
30
35
40
45
50
55
60
65
2018 2019 2020
Number of responses per month (left-hand scale)Response rate of active panel members (right-hand scale)
Per centNumber of responses
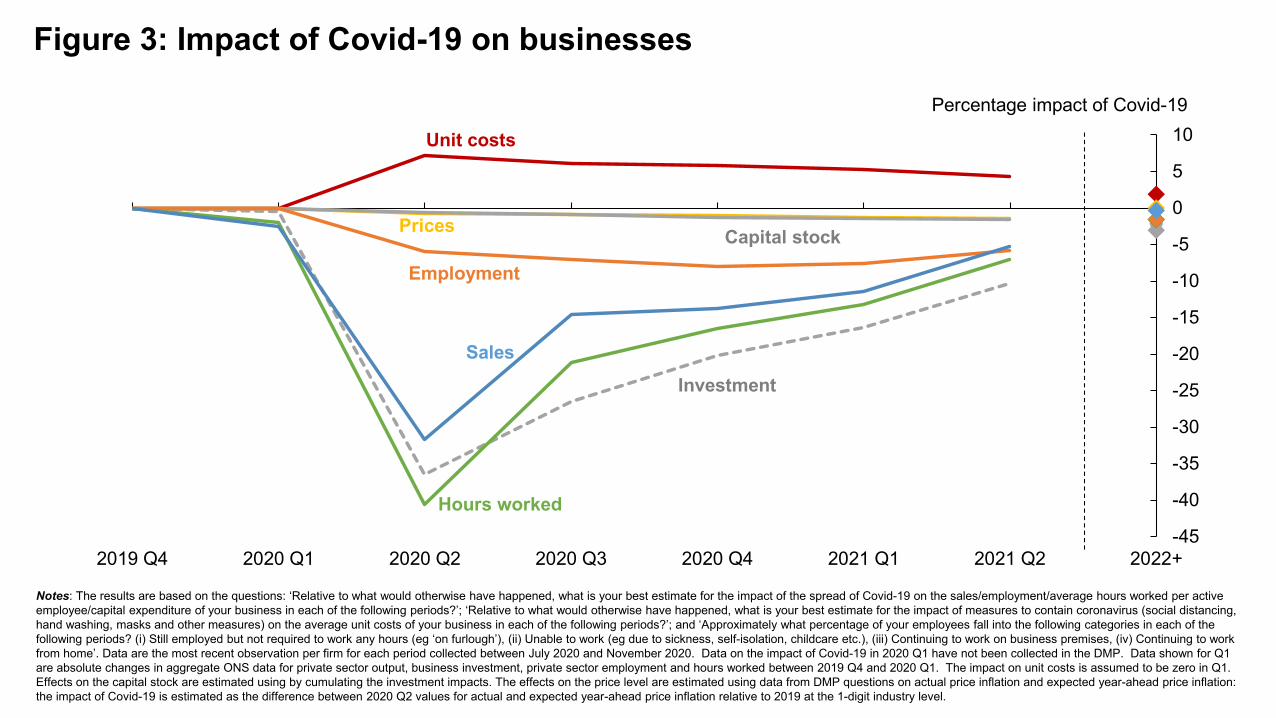
Figure 3: Impact of Covid-19 on businesses
Notes: The results are based on the questions: ‘Relative to what would otherwise have happened, what is your best estimate for the impact of the spread of Covid-19 on the sales/employment/average hours worked per active employee/capital expenditure of your business in each of the following periods?’; ‘Relative to what would otherwise have happened, what is your best estimate for the impact of measures to contain coronavirus (social distancing, hand washing, masks and other measures) on the average unit costs of your business in each of the following periods?’; and ‘Approximately what percentage of your employees fall into the following categories in each of the following periods? (i) Still employed but not required to work any hours (eg ‘on furlough’), (ii) Unable to work (eg due to sickness, self-isolation, childcare etc.), (iii) Continuing to work on business premises, (iv) Continuing to work from home’. Data are the most recent observation per firm for each period collected between July 2020 and November 2020. Data on the impact of Covid-19 in 2020 Q1 have not been collected in the DMP. Data shown for Q1 are absolute changes in aggregate ONS data for private sector output, business investment, private sector employment and hours worked between 2019 Q4 and 2020 Q1. The impact on unit costs is assumed to be zero in Q1. Effects on the capital stock are estimated using by cumulating the investment impacts. The effects on the price level are estimated using data from DMP questions on actual price inflation and expected year-ahead price inflation: the impact of Covid-19 is estimated as the difference between 2020 Q2 values for actual and expected year-ahead price inflation relative to 2019 at the 1-digit industry level.
-45
-40
-35
-30
-25
-20
-15
-10
-5
0
5
10
2019 Q4 2020 Q1 2020 Q2 2020 Q3 2020 Q4 2021 Q1 2021 Q2 2022+
Percentage impact of Covid-19
InvestmentSales
Unit costs
Employment
Capital stock
Hours worked
Prices

Figure 4: Contributions to impact of Covid-19 on productivity
Notes: Impacts on productivity are estimated as ΔΠ𝑡𝑡 = ∑i∈Surv �𝜑𝜑𝑖𝑖Δπi,t + ∑𝑖𝑖∈𝑆𝑆𝑆𝑆𝑆𝑆𝑆𝑆 Δ𝜑𝜑𝑖𝑖,𝑡𝑡 𝜋𝜋𝑡𝑡 − �Π where πi,t is productivity in firm i at time t, Π𝑡𝑡 is productivity at time t, 𝜑𝜑𝑖𝑖,𝑡𝑡 is the labour input share of firm i at time t and a bar over a variable indicates the average of the variables across times t-1 and t. Changes between t and t-1 are changes due to Covid-19 only. The first term represents the within-firm effects. The second term represents between-firm effects. The impact of Covid-19 on labour productivity for each firm is calculated as 𝑑𝑑𝑑𝑑𝑑𝑑
𝑑𝑑𝑑𝑑=𝑑𝑑𝑑𝑑
𝑑𝑑– 𝑑𝑑𝑑𝑑
𝑑𝑑– 𝑑𝑑𝑑𝑑
𝑑𝑑– 𝑑𝑑𝑑𝑑𝑑𝑑
𝑤𝑤𝑤𝑤𝑤𝑤𝑤𝑤𝑤 𝑑𝑑𝑑𝑑𝑑𝑑
= 𝑑𝑑𝑑𝑑−𝑑𝑑
𝑑𝑑𝑑𝑑𝑈𝑈
𝑑𝑑𝑈𝑈 . The impact of Covid-19 on TFP for each firm is calculated as 𝑑𝑑𝑑𝑑𝑑𝑑𝑑𝑑𝑑𝑑𝑑𝑑𝑑𝑑
=𝑑𝑑𝑑𝑑𝑑𝑑
– 𝑑𝑑𝑑𝑑𝑑𝑑
–β 𝑑𝑑𝑑𝑑𝑑𝑑
–α 𝑑𝑑𝑑𝑑𝑑𝑑
– 𝑑𝑑𝑑𝑑𝑑𝑑
. LP is labour productivity, TFP is total factor productivity, Y is nominal sales, P is the price level, L is labour input, M are non-labour intermediate costs, MU are intermediate unit costs and K is capital input.
-6
-4
-2
0
2
4
6
8
10
12
2020Q2
2020Q3
2020Q4
2021Q1
2021Q2
2022+
Between-firmWithin-firmTotal
Percentage impact of Covid-19 on labour productivity per hour
-10
-8
-6
-4
-2
0
2
4
6
8
2020Q2
2020Q3
2020Q4
2021Q1
2021Q2
2022+
Between-firmWithin-firmTotal
Percentage impact of Covid-19 on TFP

Figure 5: Contributions to impact of Covid-19 on within-firm productivity
Notes: The impact of Covid-19 on labour productivity for each firm is calculated as 𝑑𝑑𝑑𝑑𝑑𝑑𝑑𝑑𝑑𝑑
=𝑑𝑑𝑑𝑑𝑑𝑑
– 𝑑𝑑𝑑𝑑𝑑𝑑
– 𝑑𝑑𝑑𝑑𝑑𝑑
– 𝑑𝑑𝑑𝑑𝑑𝑑
𝑤𝑤𝑤𝑤𝑤𝑤𝑤𝑤𝑤 𝑑𝑑𝑑𝑑𝑑𝑑
= 𝑑𝑑𝑑𝑑−𝑑𝑑
𝑑𝑑𝑑𝑑𝑈𝑈
𝑑𝑑𝑈𝑈 . LP is labour productivity, Y is nominal sales, P is the price level, L is labour input, M are non-labour
intermediate costs and MU are intermediate unit costs. Real sales per hour contribution is 𝑑𝑑𝑑𝑑𝑑𝑑
– 𝑑𝑑𝑑𝑑𝑑𝑑
– 𝑑𝑑𝑑𝑑𝑑𝑑
. Costs contribution is – 𝑑𝑑𝑑𝑑𝑑𝑑
.
-6
-5
-4
-3
-2
-1
0
1
2
3
4
2020 Q2 2020 Q3 2020 Q4 2021 Q1 2021 Q2 2022+
Real sales per hourCostsTotal within-firm effect
Percentage impact of Covid-19 on labour productivity per hour

Figure 6: Contributions to impact of Covid-19 on within-firm productivity
Notes:. The impact of Covid-19 on labour productivity for each firm is calculated as 𝑑𝑑𝑑𝑑𝑑𝑑𝑑𝑑𝑑𝑑
=𝑑𝑑𝑑𝑑𝑑𝑑
– 𝑑𝑑𝑑𝑑𝑑𝑑
– 𝑑𝑑𝑑𝑑𝑑𝑑
– 𝑑𝑑𝑑𝑑𝑑𝑑
𝑤𝑤𝑤𝑤𝑤𝑤𝑤𝑤𝑤 𝑑𝑑𝑑𝑑𝑑𝑑
= 𝑑𝑑𝑑𝑑−𝑑𝑑
𝑑𝑑𝑑𝑑𝑈𝑈
𝑑𝑑𝑈𝑈 . The impact of Covid-19 on TFP for each firm is calculated as 𝑑𝑑𝑑𝑑𝑑𝑑𝑑𝑑𝑑𝑑𝑑𝑑𝑑𝑑
=𝑑𝑑𝑑𝑑𝑑𝑑
– 𝑑𝑑𝑑𝑑𝑑𝑑
–β 𝑑𝑑𝑑𝑑𝑑𝑑
–α 𝑑𝑑𝑑𝑑𝑑𝑑
– 𝑑𝑑𝑑𝑑𝑑𝑑
. LP is labour productivity, TFP is total factor productivity, Y is nominal sales, P is the price level, L is labour input, M are non-labour intermediate costs, MU are intermediate unit costs and K is capital input.
-30
-20
-10
0
10
20
30
2020Q2
2020Q3
2020Q4
2021Q1
2021Q2
2022+
Labour inputReal salesCostsTotal
Percentage impact of Covid-19 on labour productivity per hour
-30
-20
-10
0
10
20
30
2020Q2
2020Q3
2020Q4
2021Q1
2021Q2
2022+
Labour inputCapital inputReal salesCostsTotal
Percentage impact of Covid-19 on TFP
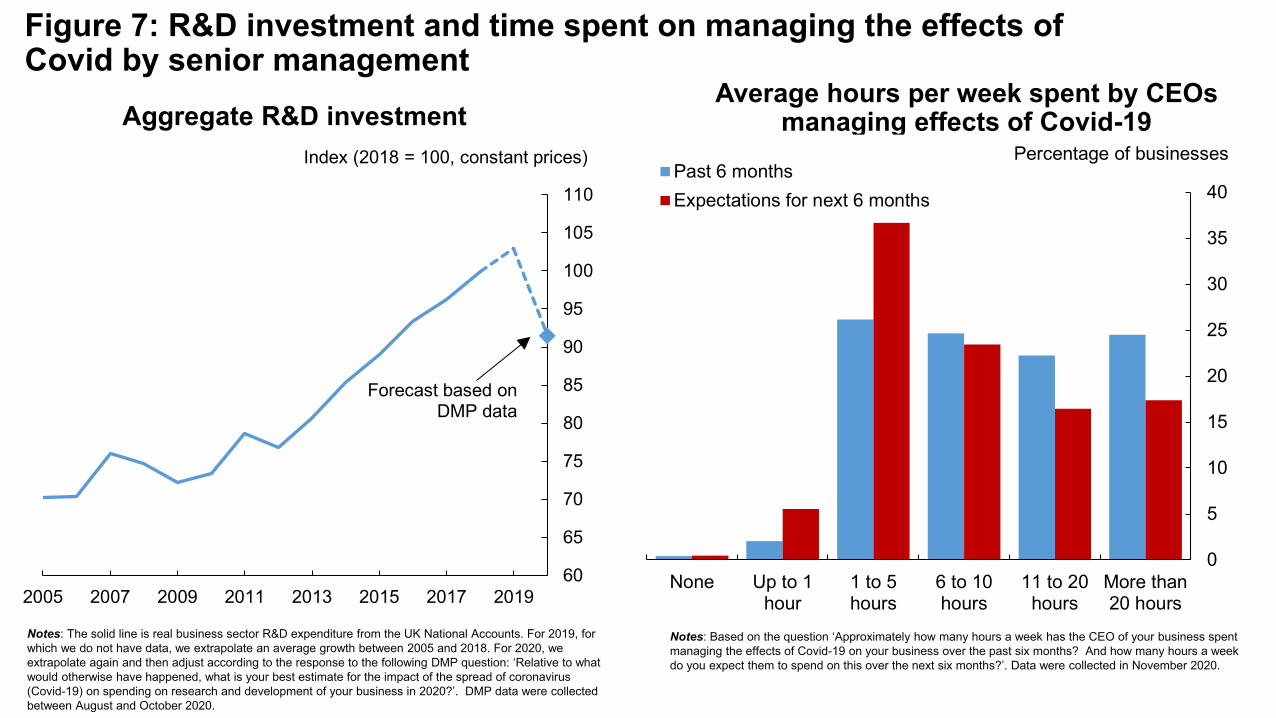
Figure 7: R&D investment and time spent on managing the effects of Covid by senior management
Aggregate R&D investment Average hours per week spent by CEOs
managing effects of Covid-19
Notes: The solid line is real business sector R&D expenditure from the UK National Accounts. For 2019, for which we do not have data, we extrapolate an average growth between 2005 and 2018. For 2020, we extrapolate again and then adjust according to the response to the following DMP question: ‘Relative to what would otherwise have happened, what is your best estimate for the impact of the spread of coronavirus (Covid-19) on spending on research and development of your business in 2020?’. DMP data were collected between August and October 2020.
60
65
70
75
80
85
90
95
100
105
110
2005 2007 2009 2011 2013 2015 2017 2019
Index (2018 = 100, constant prices)
Forecast based on DMP data
Notes: Based on the question ‘Approximately how many hours a week has the CEO of your business spent managing the effects of Covid-19 on your business over the past six months? And how many hours a week do you expect them to spend on this over the next six months?’. Data were collected in November 2020.
0
5
10
15
20
25
30
35
40
None Up to 1hour
1 to 5hours
6 to 10hours
11 to 20hours
More than20 hours
Past 6 monthsExpectations for next 6 months
Percentage of businesses

Figure 8: Impact of Covid-19 on hours worked and pre-Covid labour productivity
Notes: See notes to Figure 3 for details on how impact of Covid-19 on hours worked is calculated. Labour productivity is defined as real value-added (operating profits plus total labour costs divided by the aggregate GDP deflator) per employee using accounting data from Bureau van Dijk. Data are scaled so that 1 digit industry-level labour productivity from accounts is equal to official ONS data industry-level labour productivity per job data.
-70
-60
-50
-40
-30
-20
-10
0
2 2.5 3 3.5 4 4.5 5 5.5 6
2020 Q2
2021 Q2
Log labour productivity from accounts (2017-19 average)
Impact of Covid-19 on hours worked (%)

Figure 9: Impact of Covid-19 on hours worked and pre-Covid labour productivity by industry
Notes: See notes to Figure 3 for details on how impact of Covid-19 on hours worked is calculated. Industry-level labour productivity data are official ONS data.
-150 -125 -100 -75 -50 -25 0 25 50 75 100 125 150
-100 -80 -60 -40 -20 0 20 40 60 80 100
Real EstateFinance & InsuranceOther ProductionInformation & CommsManufacturingConstructionProfessional & ScientificTransport & StorageWholesale & RetailOther ServicesAdmin & SupportHealthRecreational ServicesAccommodation & Food
Total hours in 2020 Q2 (bottom scale)Total hours in 2021 Q2 (bottom scale)Pre-Covid labour productivity (top scale)
Percentage impact of Covid-19
(GVA per job, £000, 2018)
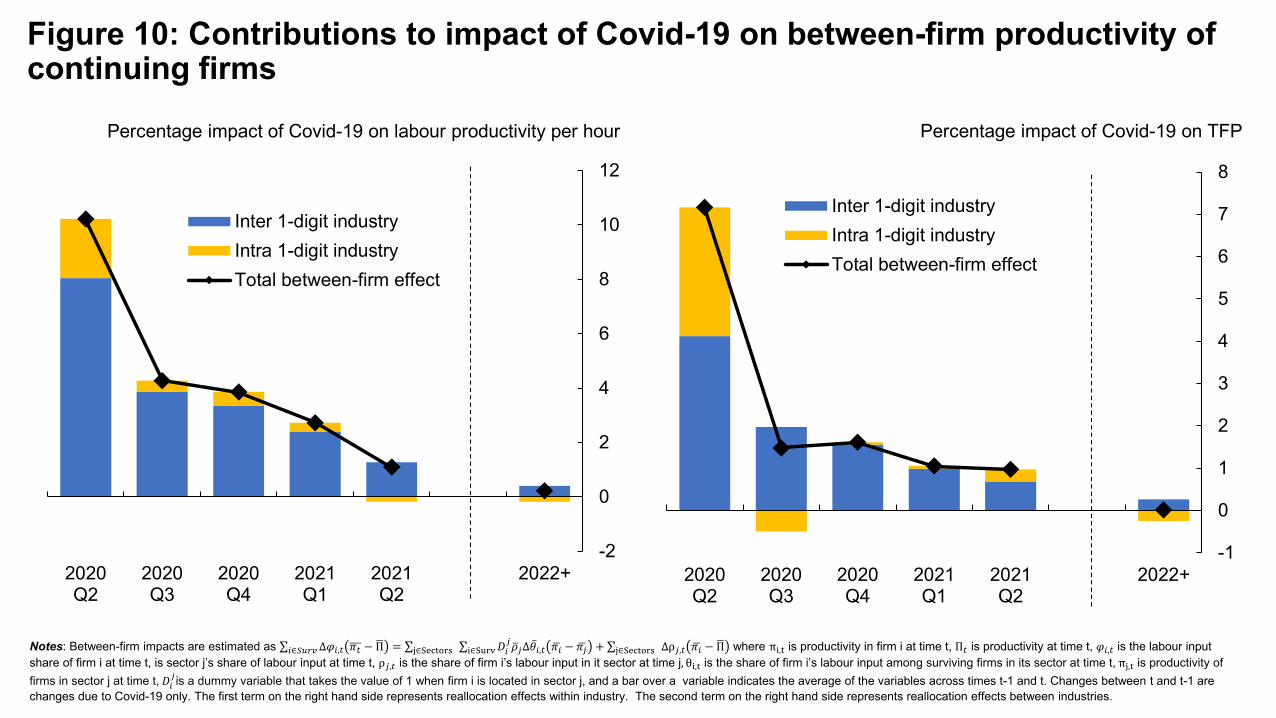
Figure 10: Contributions to impact of Covid-19 on between-firm productivity of continuing firms
Notes: Between-firm impacts are estimated as ∑𝑖𝑖∈𝑆𝑆𝑆𝑆𝑆𝑆𝑆𝑆 Δ𝜑𝜑𝑖𝑖,𝑡𝑡 𝜋𝜋𝑡𝑡 − �Π = ∑j∈Sectors ∑i∈Surv𝐷𝐷𝑖𝑖𝑗𝑗 �𝜌𝜌𝑗𝑗Δ�̅�𝜃𝑖𝑖,𝑡𝑡 �𝜋𝜋𝑖𝑖 − �𝜋𝜋𝑗𝑗 + ∑j∈Sectors Δρ𝑗𝑗,𝑡𝑡 �𝜋𝜋𝑖𝑖 − �Π where πi,t is productivity in firm i at time t, Π𝑡𝑡 is productivity at time t, 𝜑𝜑𝑖𝑖,𝑡𝑡 is the labour input
share of firm i at time t, is sector j’s share of labour input at time t, ρ𝑗𝑗,𝑡𝑡 is the share of firm i’s labour input in it sector at time j, θi,t is the share of firm i’s labour input among surviving firms in its sector at time t, πj,t is productivity of firms in sector j at time t, 𝐷𝐷𝑖𝑖
𝑗𝑗 is a dummy variable that takes the value of 1 when firm i is located in sector j, and a bar over a variable indicates the average of the variables across times t-1 and t. Changes between t and t-1 are changes due to Covid-19 only. The first term on the right hand side represents reallocation effects within industry. The second term on the right hand side represents reallocation effects between industries.
-2
0
2
4
6
8
10
12
2020Q2
2020Q3
2020Q4
2021Q1
2021Q2
2022+
Inter 1-digit industryIntra 1-digit industryTotal between-firm effect
Percentage impact of Covid-19 on labour productivity per hour
-1
0
1
2
3
4
5
6
7
8
2020Q2
2020Q3
2020Q4
2021Q1
2021Q2
2022+
Inter 1-digit industryIntra 1-digit industryTotal between-firm effect
Percentage impact of Covid-19 on TFP
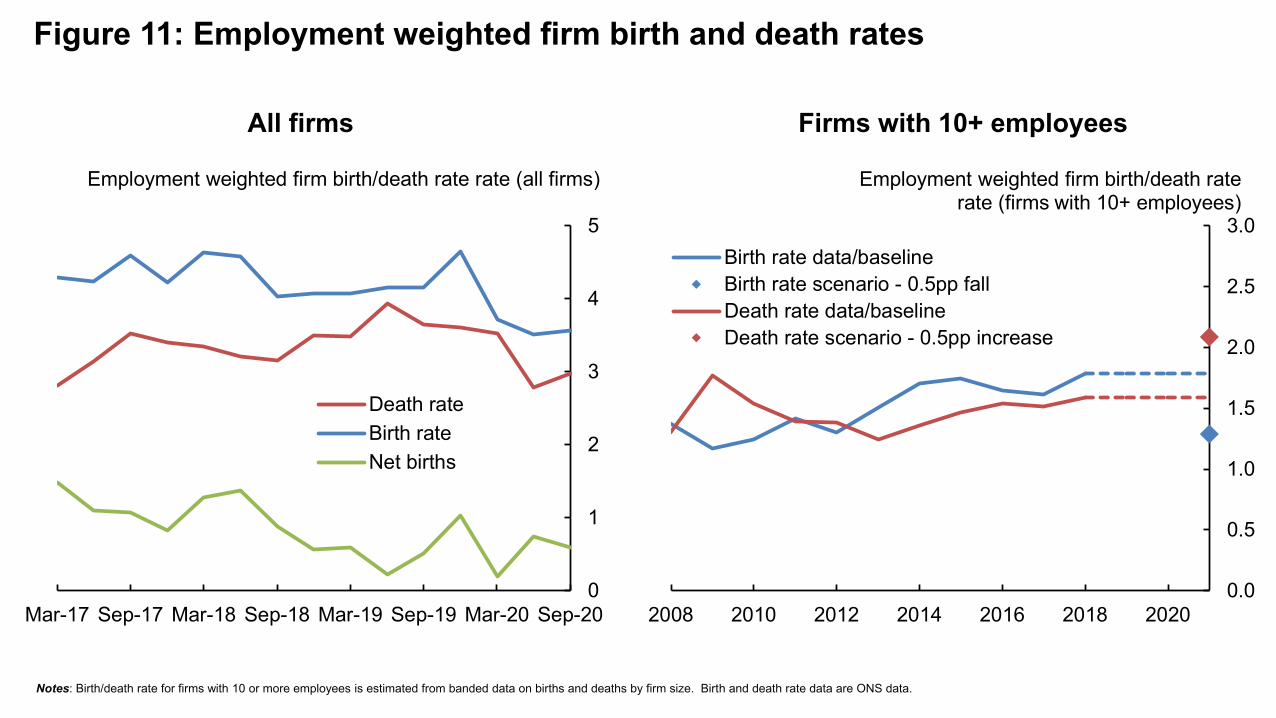
Figure 11: Employment weighted firm birth and death rates
Firms with 10+ employeesAll firms
Notes: Birth/death rate for firms with 10 or more employees is estimated from banded data on births and deaths by firm size. Birth and death rate data are ONS data.
0.0
0.5
1.0
1.5
2.0
2.5
3.0
2008 2010 2012 2014 2016 2018 2020
Birth rate data/baselineBirth rate scenario - 0.5pp fallDeath rate data/baselineDeath rate scenario - 0.5pp increase
Employment weighted firm birth/death rate rate (firms with 10+ employees)
0
1
2
3
4
5
Mar-17 Sep-17 Mar-18 Sep-18 Mar-19 Sep-19 Mar-20 Sep-20
Death rateBirth rateNet births
Employment weighted firm birth/death rate rate (all firms)
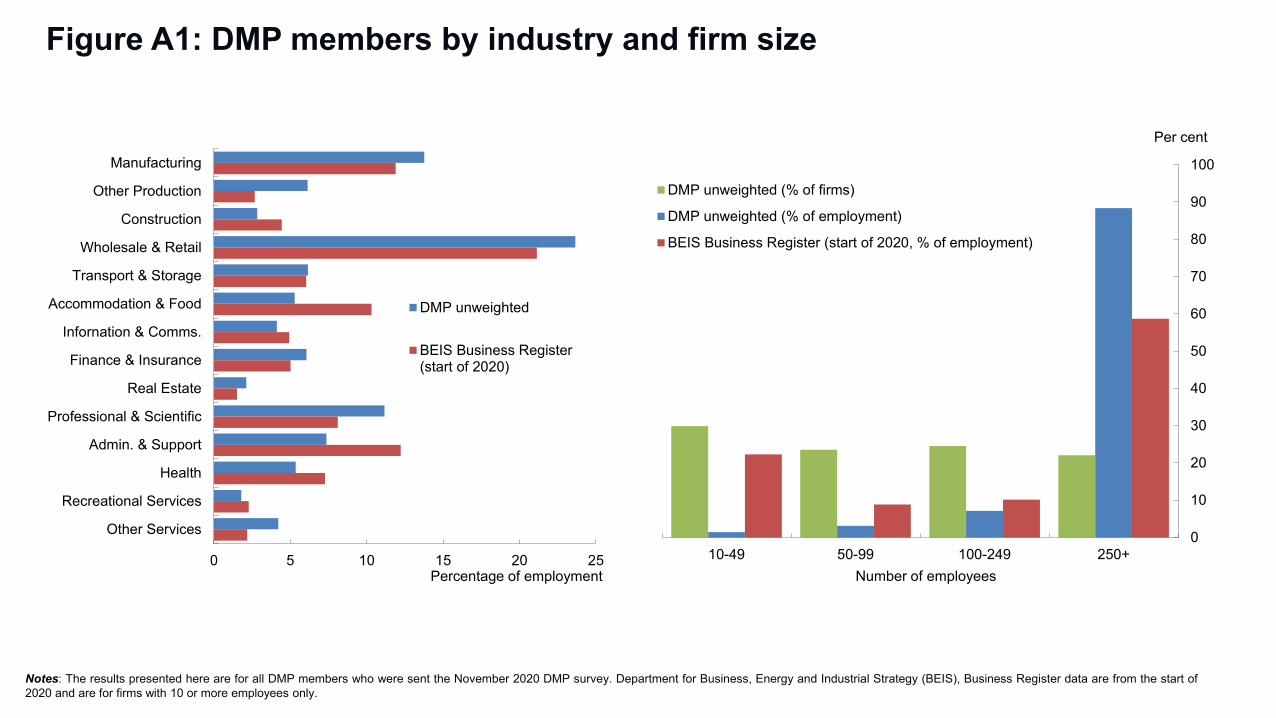
Figure A1: DMP members by industry and firm size
Notes: The results presented here are for all DMP members who were sent the November 2020 DMP survey. Department for Business, Energy and Industrial Strategy (BEIS), Business Register data are from the start of2020 and are for firms with 10 or more employees only.
0 5 10 15 20 25
Manufacturing
Other Production
Construction
Wholesale & Retail
Transport & Storage
Accommodation & Food
Infornation & Comms.
Finance & Insurance
Real Estate
Professional & Scientific
Admin. & Support
Health
Recreational Services
Other Services
DMP unweighted
BEIS Business Register(start of 2020)
Percentage of employment
0
10
20
30
40
50
60
70
80
90
100
10-49 50-99 100-249 250+
DMP unweighted (% of firms)
DMP unweighted (% of employment)
BEIS Business Register (start of 2020, % of employment)
Per cent
Number of employees
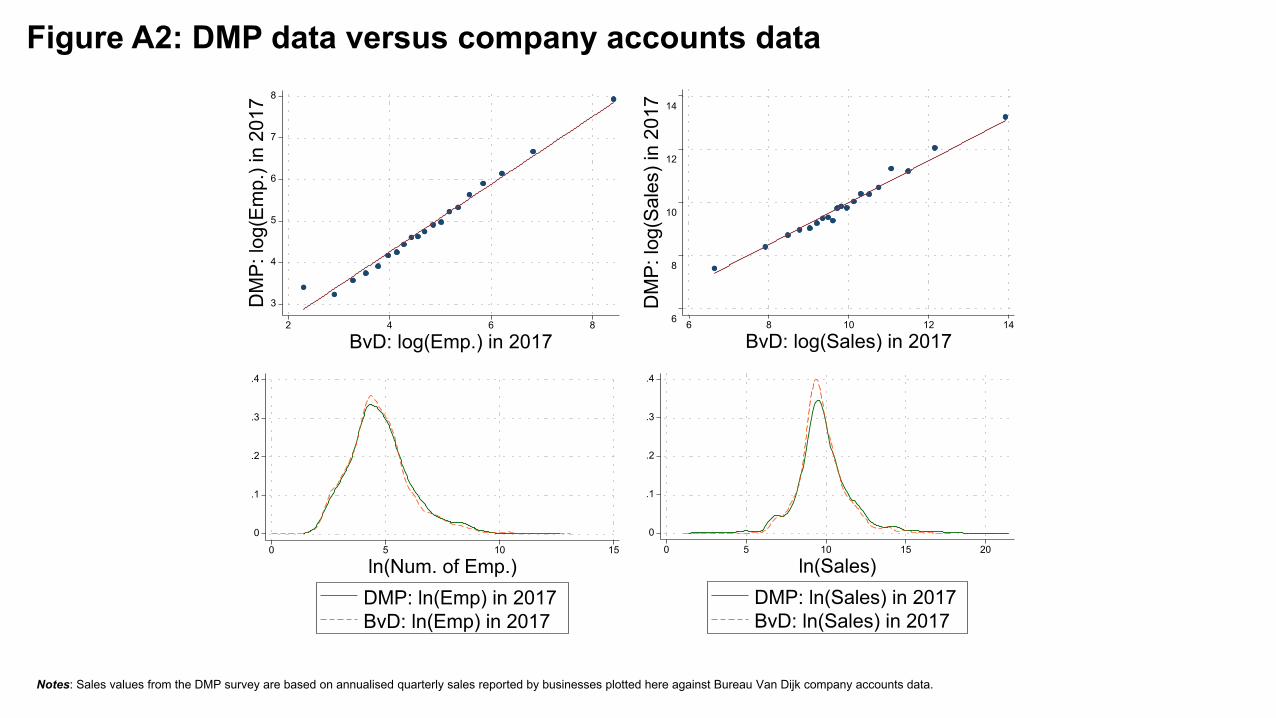
Figure A2: DMP data versus company accounts data
Notes: Sales values from the DMP survey are based on annualised quarterly sales reported by businesses plotted here against Bureau Van Dijk company accounts data.
3
4
5
6
7
8
DM
P: lo
g(Em
p.) i
n 20
17
2 4 6 8
BvD: log(Emp.) in 2017
0
.1
.2
.3
.4
0 5 10 15
ln(Num. of Emp.)DMP: ln(Emp) in 2017BvD: ln(Emp) in 2017
6
8
10
12
14
DM
P: lo
g(Sa
les)
in 2
017
6 8 10 12 14
BvD: log(Sales) in 2017
0
.1
.2
.3
.4
0 5 10 15 20
ln(Sales)DMP: ln(Sales) in 2017BvD: ln(Sales) in 2017

Notes: Y-axes show realised growth in sales, employment, prices, and investment. X-axes show expectations for year-ahead growth rates calculated from questions were respondents are asked to provide 5 scenarios foryear-ahead growth (highest/high/medium/low/lowest) and the probabilities they attach to each scenario. Forecasts made between November 2016 and April 2019 (therefore excluding realisations during the Covid-19pandemic). Each dot represents 1% of observations grouped by expected sales/employment/price/investment growth.
Figure A3: DMP forecasts versus realisationsSales growth Employment growth
Price growth Investment growth
-20
-10
010
2030
Rea
lised
sal
es g
row
th (p
er c
ent)
-20 0 20 40 60Expected sales growth a year earlier (per cent)
-10
-50
510
15R
ealis
ed e
mpl
oym
ent g
row
th (p
er c
ent)
-20 -10 0 10 20Expected employment growth a year earlier (per cent)
-50
510
Rea
lised
pric
e gr
owth
(per
cen
t)
-5 0 5 10 15Expected price growth a year earlier (per cent)
-100
-50
050
100
Rea
lised
inve
stm
ent g
row
th (p
er c
ent)
-200 -100 0 100 200Expected investment growth a year earlier (per cent)
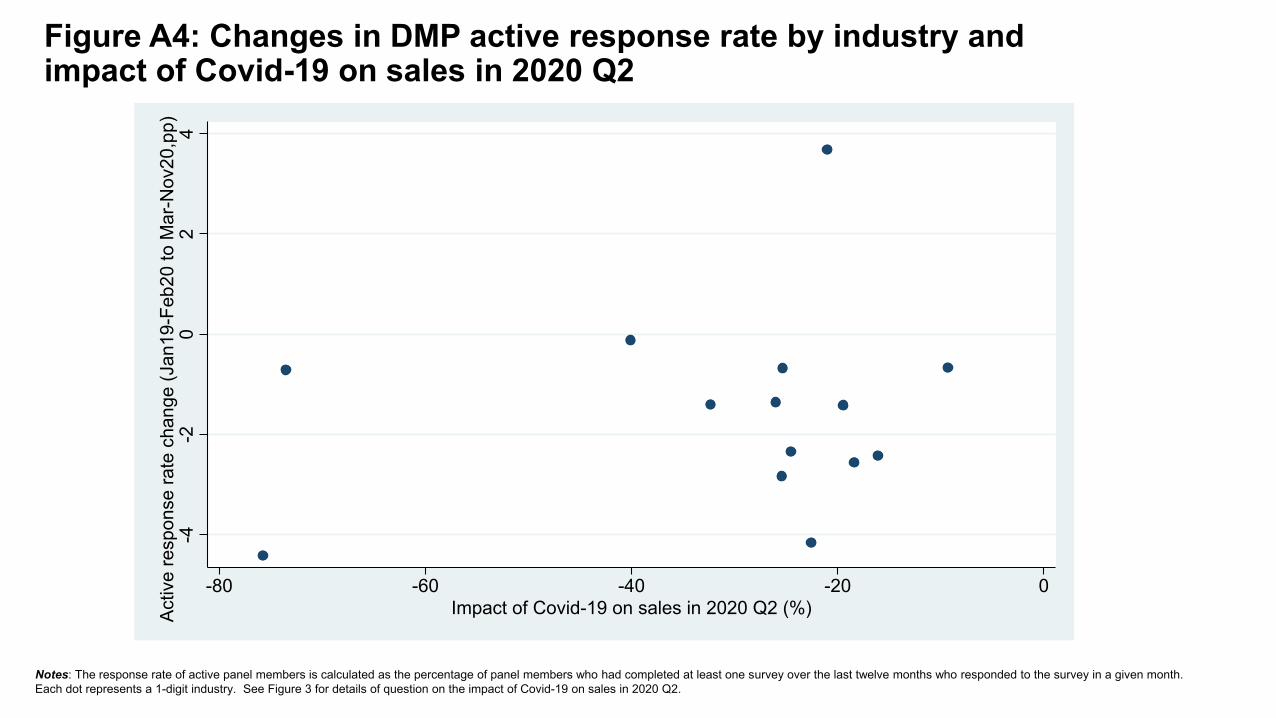
Figure A4: Changes in DMP active response rate by industry and impact of Covid-19 on sales in 2020 Q2
Notes: The response rate of active panel members is calculated as the percentage of panel members who had completed at least one survey over the last twelve months who responded to the survey in a given month. Each dot represents a 1-digit industry. See Figure 3 for details of question on the impact of Covid-19 on sales in 2020 Q2.
-4-2
02
4Ac
tive
resp
onse
rate
cha
nge
(Jan
19-F
eb20
to M
ar-N
ov20
,pp)
-80 -60 -40 -20 0Impact of Covid-19 on sales in 2020 Q2 (%)

Figure A5: Different measures of industry-level labour productivity per job
16
0
20
40
60
80
100
120
140
0 20 40 60 80 100 120 140Labour productivity from accounts (GVA per job, £000, 2017-2019 average)
Labour productivity from ONS data (GVA per job, £000, 2018)
45 degree line
0 20 40 60 80 100 120 140
Manufacturing
Other Production
Construction
Wholesale & Retail
Transport & Storage
Accom & Food
Info & Comms
Finance & Insurance
Real Estate
Prof & Scientific
Admin & Support
Health
Recreational Services
Other Services
Accounts (2017-2019 average,employment weighted)ONS (2018)
Industry labour productivity (GVA per job, £000)
Notes: Labour productivity from company accounts is defined as real value-added (operating profits plus total labour costs divided by the aggregate GDP deflator) per employee using accounting data from Bureau Van DijkFAME database.

Figure A6: Contributions to impact of Covid-19 on total hours worked
Notes: See Figure 3 for details of the questions used to calculate the impact of Covid-19 on hours worked.
-45
-40
-35
-30
-25
-20
-15
-10
-5
0
2020 Q2 2020 Q3 2020 Q4 2021 Q1 2021 Q2 2022+
Changes in employmentEmployees on furloughAverage hours of active employeeTotal hours worked
Percentage impact of Covid-19 on total hours worked

Figure A7: Vintages of DMP data
Sales Employment
Notes: Aggregate DMP data as published on the Bank of England website. The results are based on the question: ‘Relative to what would otherwise have happened, what is your best estimate for the impact of the spread of Covid-19 on the sales/employment of your business in each of the following periods?’. Each monthly survey did not ask about all periods.
-35
-30
-25
-20
-15
-10
-5
0
5
2020 Q2 2020 Q3 2020 Q4 2021 Q1 2021 Q2 2022+
Jul-20Aug-20Sep-20Oct-20Nov-20/latest available data
Survey month:
Percentage impact of Covid-19 on sales
-10
-9
-8
-7
-6
-5
-4
-3
-2
-1
0
2020 Q2 2020 Q3 2020 Q4 2021 Q1 2021 Q2 2022+
Jul-20Aug-20Sep-20Oct-20Nov-20/latest available data
Survey month:
Percentage impact of Covid-19 on employment

Figure A8: Impact of Covid-19 on unit costs and capacity constraints
05
1015
20Im
pact
of C
ovid
-19
on u
nit c
osts
in 2
020
Q3
(%)
-80 -60 -40 -20 0Impact of Covid-19 on capacity in 2020 Q3 (%)
Notes: The results are based on the questions: ‘Relative to what would otherwise have happened, what is your best estimate for the impact of measures to contain coronavirus (social distancing, hand washing, masks and other measures) on the average unit costs of your business in each of the following periods?’; and ‘Do you expect the measures to contain the coronavirus such as social distancing, hand washing, masks, and other measures to reduce the amount of goods or services that your business will be able to produce or offer in 2020 Q3 (July to September)? For example, if a restaurant can only use every other table this would be a 50% reduction. Note, this refers to the amount of goods and services you could produce if there was sufficient demand, not actual sales.’

Contributions to within-firm effectOverall impact
Figure A9: Contributions to impact of Covid-19 on labour productivity per job
-30
-25
-20
-15
-10
-5
0
5
2020Q2
2020Q3
2020Q4
2021Q1
2021Q2
2022+
Between-firmWithin-firmTotal
Percentage impact of Covid-19 on labour productivity per job
-30
-25
-20
-15
-10
-5
0
5
2020Q2
2020Q3
2020Q4
2021Q1
2021Q2
2022+
Real sales per employeeCostsTotal within-firm effect
Percentage impact of Covid-19 on labour productivity per job
Notes: Impacts on productivity are estimated as ΔΠ𝑡𝑡 = ∑i∈Surv �𝜑𝜑𝑖𝑖Δπi,t + ∑𝑖𝑖∈𝑆𝑆𝑆𝑆𝑆𝑆𝑆𝑆 Δ𝜑𝜑𝑖𝑖,𝑡𝑡 𝜋𝜋𝑡𝑡 − �Π where πi,t is productivity in firm i at time t, Π𝑡𝑡 is productivity at time t, 𝜑𝜑𝑖𝑖,𝑡𝑡 is the labour input share of firm i at time t and a bar over a variable indicates the average of the variables across times t-1 and t. Changes between t and t-1 are changes due to Covid-19 only. The first term represents the within-firm effects. The second term represents between-firm effects. The impact of Covid-19 on labour productivity for each firm is calculated as 𝑑𝑑𝑑𝑑𝑑𝑑
𝑑𝑑𝑑𝑑=𝑑𝑑𝑑𝑑
𝑑𝑑– 𝑑𝑑𝑑𝑑
𝑑𝑑– 𝑑𝑑𝑑𝑑
𝑑𝑑– 𝑑𝑑𝑑𝑑𝑑𝑑
𝑤𝑤𝑤𝑤𝑤𝑤𝑤𝑤𝑤 𝑑𝑑𝑑𝑑𝑑𝑑
= 𝑑𝑑𝑑𝑑−𝑑𝑑
𝑑𝑑𝑑𝑑𝑈𝑈
𝑑𝑑𝑈𝑈 .. LP is labour productivity, Y is nominal sales, P is the price level, L is labour input, M are non-labour intermediate costs and MU are intermediate unit costs.

Figure A10: Industry exposure to Covid-19 and pre-Covid labour productivity
Ever worked from home in 2019 and labour productivity
Percentage of sales in 2019 that involved face-to-face contact with customers and
labour productivity
0
10
20
30
40
50
60
70
80
90
100
0 20 40 60 80 100 120 140Labour productivity from ONS data (GVA per job, £000, 2018)
Percentage of sales that involved face-to-facecontact with customers in 2019
0
10
20
30
40
50
60
0 20 40 60 80 100 120 140Labour productivity from ONS data (GVA per job, £000, 2018)
Percentage of employees who ever worked from home in 2019 (LFS)
Notes: Data are for 1 digit industries. Labour productivity data are from ONS. Data on the percentage of employees who ever worked from home in 2019 are from the ONS Labour Force Survey. Data on the percentage of sales that involved face-to-face contact with customers are from the DMP survey and are based on the question ‘What percentage of your sales in 2019 involved face-to-face contact with customers?’. These DMP data were collected in April 2020.