the impact of covid-19 on small business owners: …
TRANSCRIPT

NBER WORKING PAPER SERIES
THE IMPACT OF COVID-19 ON SMALL BUSINESS OWNERS:THE FIRST THREE MONTHS AFTER SOCIAL-DISTANCING RESTRICTIONS
Robert W. Fairlie
Working Paper 27462http://www.nber.org/papers/w27462
NATIONAL BUREAU OF ECONOMIC RESEARCH1050 Massachusetts Avenue
Cambridge, MA 02138July 2020
I would like to thank participants at the remote PPIC California labor market workshop and the remote Kauffman Foundation Entrepreneurship Issue Forum for comments and suggestions. The research project has also benefited from numerous conversations with the press and policymakers. The views expressed herein are those of the author and do not necessarily reflect the views of the National Bureau of Economic Research.
NBER working papers are circulated for discussion and comment purposes. They have not been peer-reviewed or been subject to the review by the NBER Board of Directors that accompanies official NBER publications.
© 2020 by Robert W. Fairlie. All rights reserved. Short sections of text, not to exceed two paragraphs, may be quoted without explicit permission provided that full credit, including © notice, is given to the source.

The Impact of COVID-19 on Small Business Owners: The First Three Months after Social-Distancing RestrictionsRobert W. FairlieNBER Working Paper No. 27462July 2020, Revised August 2020JEL No. J0,J15,J16,L26
ABSTRACT
Social distancing restrictions and health- and economic-driven demand shifts from COVID-19 are expected to shutter many small businesses and entrepreneurial ventures, but there is very little early evidence on impacts. This paper provides the first analysis of impacts of the pandemic on the number of active small businesses in the United States using nationally representative data from the April 2020 CPS – the first month fully capturing early effects. The number of active business owners in the United States plummeted by 3.3 million or 22 percent over the crucial two-month window from February to April 2020. The drop in active business owners was the largest on record, and losses to business activity were felt across nearly all industries. African-American businesses were hit especially hard experiencing a 41 percent drop in business activity. Latinx business owner activity fell by 32 percent, and Asian business owner activity dropped by 26 percent. Simulations indicate that industry compositions partly placed these groups at a higher risk of business activity losses. Immigrant business owners experienced substantial losses in business activity of 36 percent. Female business owners were also disproportionately affected (25 percent drop in business activity). Continuing the analysis in May and June, the number of active business owners remained low – down by 15 percent and 8 percent, respectively. The continued losses in May and June, and partial rebounds from April were felt across all demographic groups and most industries. These findings of early-stage losses to small business activity have important implications for policy, income losses, and future economic inequality.
Robert W. FairlieDepartment of EconomicsEngineering 2 BuildingUniversity of California at Santa CruzSanta Cruz, CA 95064and [email protected]

1
1. Introduction
The widespread closing of stores and businesses in the United States and around the world due to
the coronavirus is unprecedented. Stores, factories and many other businesses have closed by
policy mandate, downward demand shifts, health concerns, or other factors. Many of these
closures may be permanent because of the inability of owners to pay ongoing expenses and
survive the shutdown. The impact on small businesses around the world is likely to be severe.
The early effects of COVID-19 on small business and entrepreneurs are not well known
because of the lack of timely business-level data released by the government. This paper
addresses this limitation by creating estimates of the number of business owners from monthly
Current Population Survey (CPS) microdata files. Using these timely data, I examine how
COVID-19 impacted small business owners in mid-April 2020 – the first month to capture the
widespread shelter-in-place restrictions in the United States. I then expand the analysis to include
the next two months as many states that had restrictions started to relax those restrictions.
The CPS data are used by the Bureau of Labor Statistics (BLS) to track unemployment
rates, and have been used in previous research to study determinants of business ownership (e.g.
recently, Levine and Rubenstein 2017, Wang 2019, Fairlie and Fossen 2019). The CPS captures
the current work activity of the business owner, and whether that business owner is currently
operating the business. Thus, the number of active business owners can be captured in the data,
but there is no way of telling whether these are temporary or permanent business closures. Many
of the inactive business owners, however, are likely to permanently close their businesses
especially if the COVID-19 induced recession is prolonged. Even temporary closures caused by
the pandemic are problematic because they reflect income losses to business owners in those
inactive months.
This study provides the first estimates of the early-stage effects of COVID-19 on small
business owners from April 2020 CPS microdata.1 I find that the number of working business
owners plummeted from 15.0 million in February 2020 to 11.7 million in April 2020 because of
COVID-19 mandates and health- and economic-driven demand shifts. The loss of 3.3 million
active business owners (or 22 percent) was the largest drop on record. When conditioning on
1 The findings for April 2020 were initially released as a working paper in early May (Fairlie 2020) and were
covered widely in the press and news (e.g. Washington Post, NY Times, WSJ, PBS, CNBC, BBC). The findings
were also used in testimony to the U.S. Senate (Evans 2020), Busby (2020), a new Senate Bill (U.S Senate 2020),
arguments for the shop at black-owned businesses movement, and other policies.

2
working roughly two days per week or four days a week, the losses are even larger (28 percent
and 31 percent, respectively). Total hours worked by all business owners dropped by 29 percent.
Although incorporated businesses are more growth-oriented and stable, they experienced a drop
of 20 percent from February to April 2020.
Patterns across gender, race and immigrant status reveal alarming findings. African-
Americans experienced the largest losses, eliminating 41 percent of active business owners.
Latinx also experienced major losses with 32 percent of business owners halting activity between
February and April 2020. Immigrant business owners suffered a large drop of 36 percent in
business activity, and female business owners suffered a disproportionate drop of 25 percent.
Building on these findings, this paper extends the analysis of COVID-19 impacts into the
second and third months following widespread shelter-in-place restrictions across the country –
May and June 2020. The analysis answers the question of whether there was further closing of
small businesses or instead a partial rebound as small business owners tried to reopen or partially
reopen. The findings indicate that there was a partial rebound from April 2020 numbers in May
and an additional rebound in June. The number of active business owners bounced back by 7
percentage points resulting in a 15 percent drop in business activity from February to May 2020,
and an additional 5 percentage points rebound in June resulting in an 8 percent drop in business
activity from February to June 2020.
Patterns across gender, race and immigrant status reveal that the disproportionate impacts
from COVID-19 lingered into May and June. African-Americans continued to experience the
largest losses, eliminating 26 percent of active business owners in May and 19 percent in June.
Latinx also experienced major losses with 19 percent of business owners inactive in May and 10
percent inactive in June. Immigrant business owners suffered a large drop in business activity of
25 percent in May and 18 percent in June.
Most major industries faced large drops in the number of active business owners in April
with the only exception being agriculture. Construction, restaurants, hotels, transportation, and
personal/laundry services all faced large declines in the number of active business owners due to
COVID-19. Simulations reveal that the concentrations of female, black, Latinx and Asian
businesses in industries hit hard by the pandemic contributed to why losses in business activity
were higher for these groups than the national average loss in April. May and June brought a
partial rebound for most industries.

3
Overall, these first estimates of impacts of COVID-19 on small businesses from the April
2020 CPS indicate that losses were spread across demographic groups and types of business – no
group was immune to negative impacts of social distancing policy mandates and demand shifts.
But, they also reveal a partial bounce back for all groups. Although there is no way to know at
this time if these business closures will be permanent each month of inactivity has an impact on
the revenues, profits, and employees of these businesses.
These results build on the findings from a few related studies of the early effects of the
coronavirus on small businesses in the United States.2 Employer business applications as
measured by the U.S. Census weekly Business Formation Statistics (BFS) fell in the five weeks
from mid-March to md-April by over 27 percent relative to the previous year (Wilmoth 2020).
Examining more recent data from the BFS there is some evidence of a bounce back, but weekly
estimates show a lot of variation (U.S. Census Bureau 2020). Estimates from the weekly U.S.
Census Small Business Pulse Survey indicate that roughly 50 percent of businesses report having
a large negative effect from the COVID-19 pandemic and that only 15-20 percent of businesses
have enough cash on hand to cover 3 months of operations (U.S. Census Bureau 2020; Bohn,
Mejia and Lafortune 2020). Another weekly survey indicates that decreased demand is more
problematic than supply factors such as accessing materials and goods (Desai and Looze 2020).
Bartik et al. (2020) conducted a survey in late March of nearly 6,000 small businesses that were
members of the Alignable business network. They find that 43 percent of businesses are
temporarily closed, large reductions in employees, and the majority of businesses have less than
one month of cash on hand. The Stanford Latino Entrepreneurship Initiative (2020) surveyed 224
high-revenue Latinx-owned businesses and found that 86% of respondents reported immediate
negative effects such as delayed projects and closure from the pandemic. This paper builds on
the previous work by focusing on early-stage effects in April-June using CPS data, and by
exploring differential effects for female, minority and immigrant business owners, which is
potentially important for targeting government aid to preserve small businesses and the jobs they
create.3
2 Estimates for Canada show a decrease in business ownership between February 2020 and May 2020 of 15 and 10
percent for incorporated and unincorporated businesses, respectively (Beland, Fakorede, and Mikola 2020). 3 Large literatures explore the causes and consequences of disparities in ownership and success of minority-, female-
, and immigrant-owned businesses. For broader discussions and reviews of these literature, see, for example, Davila
and Mora (2013); Fairlie and Robb (2008); Jennings and Brush (2013); Kerr and Kerr. (2020); Parker (2018).

4
2. Data
2.1 Current Population Survey (CPS)
Although research on small businesses and entrepreneurship is growing rapidly, there are very
few national datasets that provide information on ownership with additional information on
demographic characteristics of the owners. Using microdata from the basic monthly files of the
Current Population Surveys (CPS), I measure self-employed business ownership at the individual
owner level. These surveys, conducted monthly by the U.S. Bureau of the Census and the U.S.
Bureau of Labor Statistics, are representative of the entire U.S. population and contain
observations for more than 130,000 people.
The CPS has been conducted monthly since 1940 and is the underlying source of official
government statistics on employment and unemployment. Data are collected by personal
interviews. The data cover all persons in the civilian noninstitutionalized population of the
United States living in households. The CPS is the only source of monthly estimates of
employment, self-employed persons, wage and salary employees, and unemployment. Although
the main purpose of the CPS is to collect information on the employment situation, a secondary
purpose is to collect information on the demographics of the population.
Measures of business ownership are available from only a handful of other large,
nationally representative government datasets, such as the Survey of Business Owners (SBO),
Census PUMS files, and the American Community Survey (ACS). Measures of business
ownership based on these cross-sectional data, however, cannot capture recent patterns because
there is often a 1 to 2 year delay in release. The CPS releases microdata within a month of the
survey week.
To estimate business ownership in the CPS data, I identify all individuals who own a
business as their main job in the survey month (based on the class of worker question and
monthly labor force recode). The main job is defined as the one with the most hours worked
during the survey week. Thus, individuals who start side businesses will not be counted if they
are working more hours on a wage and salary job. The CPS captures the current work activity of
the business owner, and whether that business owner is currently operating the business. Thus,
the number of active business owners can be captured in the data, but there is no way of telling

5
whether these are temporary or permanent business closures. But, inactive business owners
regardless of whether the business is temporary or permanently closed are suffering losses in
business income during those months of non-operation.
The measure of business ownership in the CPS captures all business owners including
those who own incorporated or unincorporated businesses, and those who are employers or non-
employers. Although some business owners own large businesses the predominate type are small
businesses. I interpret the data as predominately covering small business owners. In addition to
providing information on business ownership and current activity, the CPS data include
information on detailed demographic information including gender, race, and immigrant status of
the owner. The data also include information on the industry and incorporation status of the
business. The CPS data have been used in previous research to study self-employment, business
ownership and entrepreneurship (e.g. see Hipple and Hammond 2010; Chatterji et al. 2014;
Fairlie and Chatterji 2013; Levine and Rubenstein 2017; Wang 2019; Fairlie and Fossen 2019).
2.2 Survey Timing and Social Distancing Restrictions
The CPS survey reference period is generally the calendar week that contains the 12th day of the
month. The CPS survey reference period is generally the calendar week that contains the 12th
day of the month. For April, the week was Sunday, April 12th through Saturday, April 18th. The
March survey reference week was March 8th through March 14th. For May, the week was
Sunday, May 10th through Saturday, May 16th, and for June, the week was Sunday, June 14 to
Saturday, June 20. Given that shelter-in-place restrictions started after this reference week, the
April 2020 release is the first CPS survey fully covering the early-stage impacts of COVID-19.
On March 16, 2020 San Francisco Bay Area imposed shelter-in-place restrictions followed by
the State of California on March 19. New York State followed the next day. By early April most
states imposed social distancing restrictions. The analysis below mostly relies on comparisons
between February 2020 (prior to social distancing policy mandates) and April, May or June 2020
(the first three months after policy mandates).4
4 In most analyses March 2020 is not included because of partial effects. On March 11, the World Health
Organization (WHO) declared COVID-19 a pandemic which might have resulted in early demand shifts over health
concerns predating shelter-in-place restriction policies.

6
3. Results
3.1 Number of Business Owners
I first examine small business ownership patterns over time to determine the impacts of COVID-
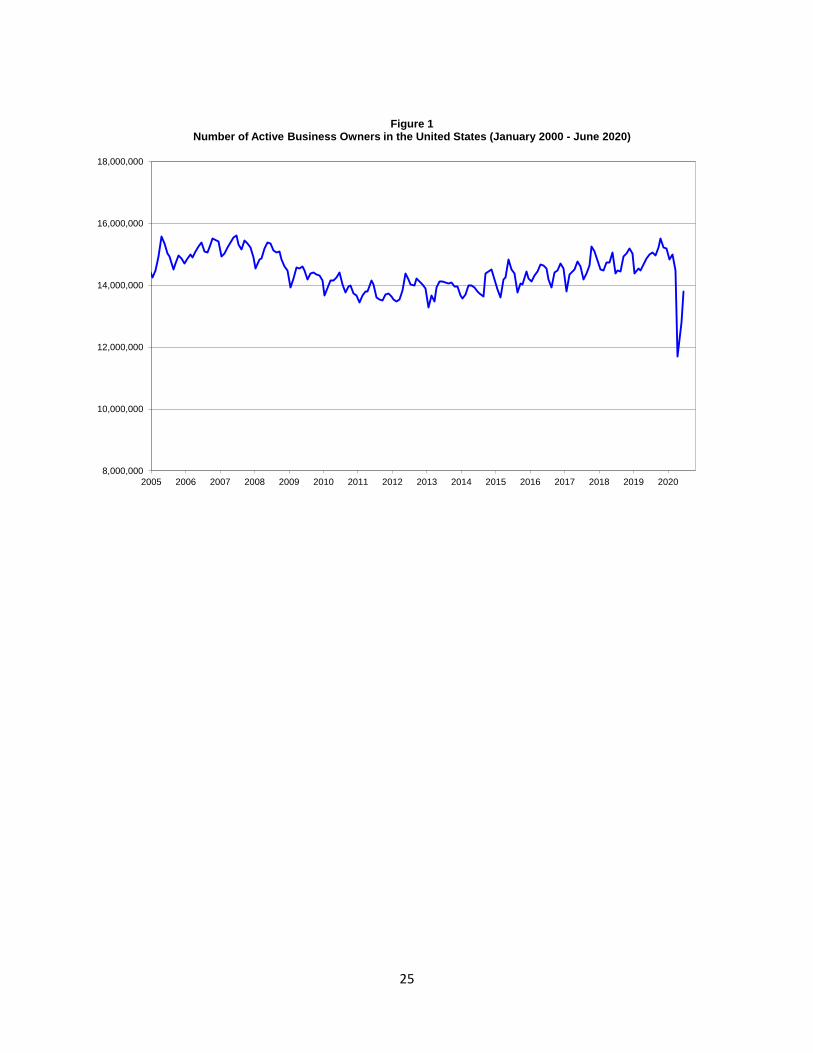
19. Long-term trends in the number of business owners are displayed in Figure 1 (and recent
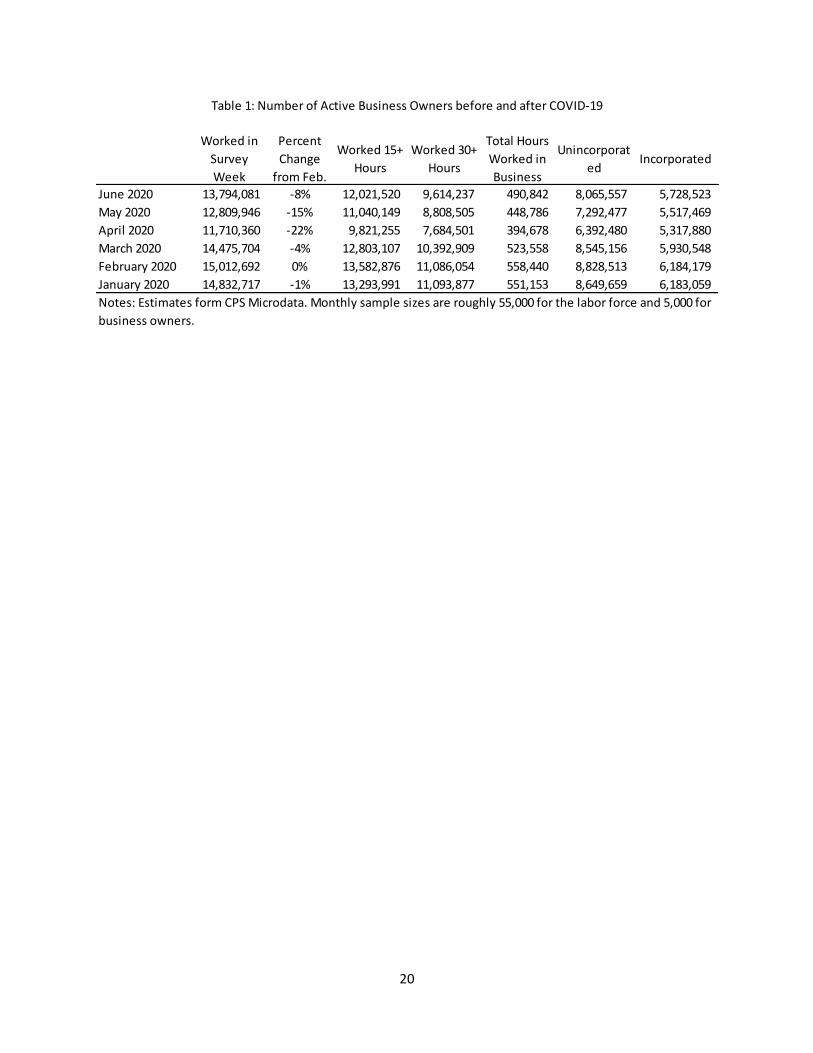
months in Table 1). The number of business owners actively working any amount is displayed in
Figure 1. Over the past two decades, the number of active business owners in the United States
has shown a relatively smooth pattern over time with a slight upward trend. What is clear,
however, is the dramatic drop in the number of active business owners in April 2020 and the
partial rebound in May and continuing rebound in June. The number of working business owners
dropped from 15.0 million in February 2020 to 11.7 million in April 2020 because of COVID-
19. March 2020 only shows a small drop in business owners likely because of the limited effect
from shelter-in-place restrictions. May 2020 shows a partial rebound from April 2020 adding
back 1.1 million active business owners (7 percentage points relative to February levels). The
losses due to COVID-19 from February remain high at 15 percent, but the rebound suggests that
not all of the losses of active business owners in April 2020 were permanent closures. June
experienced a further rebound with business activity being down 8 percent from February levels.
The loss of 3.3 million active business owners (or 22 percent) from February to April
2020 was the largest drop on record. When conditioning on working at least 15 hours in the
survey week, the losses were even larger. The choice of 15 hours is made to approximate two
days a week and accommodate lumpy hours reporting (i.e. often 10, 15, 20, etc…). There were
13.6 million business owners working 15+ hours in February 2020 and only 9.8 million in April
2020. The drop of 3.8 million business owners or 28 percent was unprecedented. Conditioning
on 30 or more hours worked results in losses of 3.4 million or 31 percent (see Table 1). The
losses conditioning on hours worked were also larger in May relative to February (19 percent for
15+ hours and 21 percent for 30+ hours). Both measures, however, show partial rebounds in
May from April 2020. From 9 to 10 percentage points of the drops in active business owners
were added back in May. Further rebounds occurred in June with losses to 15+ hours worked
business activity at 11 percent and 30+ hours worked business activity at 13 percent.
Table 1 also reports the total number of hours worked in the survey week among all
business owners by month. Figures are reported in 1,000s. From February to March there was a
drop in total hours worked in businesses by owners of 29 percent. From February to May there

7
was also a drop in total hours worked by business owners, but the drop was not as large at 20
percent. From February to June total hours worked dropped by 12 percent. These reductions in
business hours worked have important ramifications for take home earnings for business owners.
Business owners are likely to have experienced large reductions in income. Unfortunately, the
CPS data do not provide information on these losses to income. The latest data available from
the Census on business revenues indicates that average sales and receipts of businesses are
$440,000 per year (U.S. Census Bureau 2016).
Separating the number of business owners into unincorporated and incorporated status
indicates large drops in activity for both groups (see Table 1). Incorporated businesses are
viewed as more growth- oriented, committed, pro-cyclical and entrepreneurial (e.g. Fairlie,
Miranda and Zolas 2020; Levine and Rubinstein 2016, 2018). The number of active
unincoporated business owners dropped 28 percent from February to April but then rebounded
10 percentage points in May and a further 9 percentage points in June. Incorporated business
owners realized a smaller drop in active business owners of 14 percent from February to April,
and a smaller rebound of 3 percentage points in both May and June. The losses remain large,
however, with 17 percent of unincorporated business owners and 11 percent of incorporated
business owners not operating in May, and 9 percent of unincorporated and 7 percent of
incorporated not operating in June.
3.2 Demographic Patterns
The CPS data provide detailed information on gender, race and immigrant status. Figure 2 (Table
2) displays the number of active female and male business owners in February, April, May and
June 2020. Female businesses were especially hit hard by COVID-19 in April. The number of
active female business owners dropped from 5.4 million to 4.0 million in the crucial two-month
window. The decline of one-fourth of active female business owners is unprecedented. Male
business owners also suffered major losses in business activity with a reduction of 2 million
representing 20 percent of previous levels.
Continuing into May, both male and female business owners were hit hard by COVID-19
relative to February levels, prior to the social distancing restrictions. The number of active
female business owners dropped from 5.4 million to 4.5 million (16 percent), and the number of
active male business owners dropped from 9.6 million to 8.3 million (14 percent). However, both

8
female and male business owners bounced back from April losses. Female business owners
bounced back resuming work by 9 percentage points and male business owners bounced back by
7 percentage points. In June, the rebound for both female and male owners continued. The
number of active business owners was down by 10 percent for women and 7 percent for men
relative to pre-COVID levels.
In terms of the share of total active business owners, female business owners only
experienced a slight loss in shares. Table 3 reports estimates of the share of total business owners
represented by each demographic group. The female share of active business owners was 36
percent in February and declined slightly to 35 percent in April-June.
Turning to racial patterns, Figure 3 (Table 2) displays the number of active business
owners by major racial groups. The findings are alarming. The number of African-American
business owners plummeted from 1.1 million in February 2020 to 640,000 in April. The drop of
440,000 black business owners actively working in their businesses, representing 41 percent of
the previous level, is disconcerting. Although there was a partial rebound, the number of actively
working African-American business owners remains 26 percent lower in May than in February
2020, which is the largest drop for any major racial/ethnic group. The implications for lost
income from having 41 percent of business owners not working in April, 26 percent not
operating in May, and 19 percent not operating in June will have longer-term negative
consequences on savings and wealth. Average business sales and receipts among black-owned
businesses are $58,000 per year (U.S. Census Bureau 2016).
Latinx business owners also suffered major losses in business activity. The number of
active Latinx business owners dropped from 2.1 million to 1.4 million (32 percent) from
February to March. These losses in business activity from COVID-19 continued into the second
and third months after widespread shelter-in-place restrictions. The number of active Latinx
business owners dropped by 19 percent from February to May and 10 percent from February to
June. Although there was a partial rebound from April, these losses continue to be large and
contribute to lost income for owners. Average business sales and receipts among Hispanic-
owned businesses are $143,000 per year (U.S. Census Bureau 2016).
Asian business owners suffered losses in business activity of 230,000 representing 26
percent of February levels. Even with the rebounds in May and June, the number of Asian
business owners who were actively running their businesses dropped by 21 percent and 10

9
percent, respectively. Consumer discrimination against Asian-owned businesses was a concern
because of the coronavirus first appearance in China (CDC 2020a). The losses to revenues
among Asian business owners are large with average sales and receipts of $365,000 (U.S.
Census Bureau 2016).
The drop in business activity from February to April for whites were also large at 1.8
million business owners, but smaller as a percentage of starting levels (17 percent). White
business owners experienced declines in operating businesses of 11 percent in May and 5 percent
in June. Average sales and receipts of white-owned businesses are $546,000 (U.S. Census
Bureau 2016).
The black and Latinx business owner shares declined from February to April by two
percentage points (Table 3). Blacks represented 5 percent of active business owners in the nation
in April and Latinx represented 12 percent of active business owners. The share bounced back
but only partially by June (6 percent for blacks and 13 percent for Latinx). The Asian share
remained relatively stable over the four months, whereas the white share of total business owners
increased.
Focusing on immigrants, the number of active business owners dropped from 3.1 million
to 2.0 million from February to April (Figure 4 and Table 2). The loss of over 1 million active
immigrant business owners is alarming. It represents a drop of 36 percent from February levels.
The losses in business activity continue to be large for immigrants with a 25 percent reduction in
May and an 18 percent reduction in June. Although active business owner numbers partially
bounced back in May and June relative to April for immigrants the levels did not return to
anything close to pre-COVID-19 levels. For comparison, the number of active U.S. born (native)
business owners dropped by much lower levels during the first three months (18 percent in April,
12 percent in May, and 5 percent in June). These patterns led to the share of immigrant business
owners dropping from 21 percent in February to 17-18 percent in April-June (Table 3).
Comparing back to April 2019 levels, the conclusions do not differ. For all of the
demographic groups, the number of business owners dropped precipitously from April 2019 to
April 2020. In general, the number of self-employed business owners for each group does not
change substantially over time especially during stable economic conditions, and thus February
2020 is an accurately captures previous levels. April 2020 is clearly an unprecedented shock to

10
business owners that hit all groups hard throwing active business totals off relatively stable
longer-term levels.
3.3 Industry Patterns
Table 4 reports estimates by major industry groups. Almost every industry experienced sizeable
drops in the number of active business owners from February to April. The only exception was
Agriculture for which the number of active business owners increased slightly.5 Construction
which is one of the largest industries for business ownership experienced a major decline of
nearly 670,000 (27 percent) active business owners in the United States from February to April.
Although Construction partially bounced back in May and June losses in business activity
continued to be large. Although construction businesses experience a lot of swings in demand, it
is not clear how many of these business owners will be able to come back over the next several
months.
Store fronts across the country had been closed due to COVID-19 mandated restrictions
especially in April. Retail trade showed a decline of 108,000 business owners in April
representing 10 percent of February 2020 levels. Active business owners in Retail Trade are only
slightly down, however, in May and June. Restaurants experienced a decline of 22 percent in
April even though many of those remaining open turned to take-out or delivery services. The
sector has experienced continuing low levels of business activity over the next two months. The
broad sector of Arts, Leisure and Accommodations was hit especially hard losing 35 percent of
active business owners in April and essentially no rebound in May or June.
Both high-skilled and less-skilled services were hit hard by COVID-19. Personal and
Laundry Services were especially hard hit with losses of 79 percent of business owner activity in
April and continuing losses of 48 percent in May and 26 percent in June. Transportation services
which includes taxi and some uber drivers dropped by 22 percent in April, but partially
rebounded in subsequent months. Higher-skilled services such as Financial Activities and
Professional and Business Services lost 12 percent and 18 percent, respectively. Even health
5 Although farmers and other agricultural business owners might have continued to work during the pandemic they
might have experienced large losses in sales and revenues due to supply chain shutdowns from the closing of regular
buyers (e.g. schools and restaurants).

11
services experienced a drop of 16 percent. All three experienced partial rebounds in May and
June.
It is also possible to categorize industries into essential vs non-essential according to state
or local government guidelines, although there is a lot of variation across these guidelines in
terms of specific industries. Delaware State provides the most detailed and comprehensive list of
essential businesses at the 4-digit industry level and follows the same 4-digit industry codes as
the CPS (North American Industry Classification System, NAICS).6 The classification is likely
to be imperfect, however, because definitions, enforcement, business owner compliance and
health- and economic-related consumer reactions vary across the country. Using this
categorization, “essential” industries comprise 76 percent of business owners. Losses in the
number of active business owners are lower for essential industries at 17 percent in April
compared with 38 percent among non-essential industries (as expected). Although both groups of
business owners experienced partial rebounds, the number of active business owners in essential
industries was down by 10 percent in May and 5 percent in June, and the number in nonessential
industries was down by 28 percent in May and 17 percent in June.
Importance of Industry Distributions
Did the industry distribution of businesses owned by different demographic groups place them at
a higher or lower risk of COVID related shutdowns? To explore this question I simulate the total
number of business owners for each demographic group by switching their industry distribution
for the U.S. national industry distribution. The industry distributions are both measured in
February 2020. The expression for the simulated change in the number of business owners for
group j from February to April is:
(1) ∑ 𝑆𝑖𝑈𝑆𝐾
𝑖=1 (𝑁𝑖𝑗,𝐴𝑝𝑟
− 𝑁𝑖𝑗,𝐹𝑒𝑏
) ,
where 𝑆𝑖𝑈𝑆 is the share of all business owners represented by major industry i using the U.S.
national industry distribution, and 𝑁𝑖𝑗,𝑀𝑜𝑛𝑡ℎ
is the number of business owner for group j, industry
i and the defined month. The simulation essentially uses the national industry shares and
6 Delaware’s list can be accessed at “List of Delaware Business Categories that are Essential and Non-Essential
(March 22, 2020)”, https://coronavirus.delaware.gov/resources-for-businesses/.

12
multiplies them by the group specific changes in the number of active business owners between
the two months.
Table 5 reports estimates from the simulations. The number of active female business
owners declined by 25 percent from February to April 2020. The industry distribution of female
business owners was partly responsible for relatively large business activity losses from February
to April. When switching to the U.S. national industry distribution the decline in active business
owners is lower at 19 percent. Thus, the female industry distribution was “unfavorable” in terms
of placing them at a higher risk of business activity losses in April 2020. A similar finding holds
for May and June. For both months, the drop in active business owners is smaller for women
when switching to the U.S. national industry distribution.
By definition, the opposite is true for male business owners. Relative to the U.S. total
(and thus female business owners), the male industry distribution partly protected them from
larger losses due to COVID-19. Switching industry distributions to the national distribution
results in a higher predicted decline in business owner activity of 23 percent in April, 15 percent
in May, and 8 percent in June.
The industry distribution of black business owners placed them at a higher risk of
business activity losses due to COVID-19. The percent change in the number of active black
business owners becomes considerably smaller when simulations are run with the national
industry distribution. The change is from a loss of 41 percent to a loss of 35 percent in April. The
patterns are similar in May and less pronounced in June.
A similar pattern is found for Latinx. When switching the Latinx industry distribution to
the U.S. national industry distribution the predicted number of active Latinx business owners
drops from 32 percent to 28 percent for April. Latinx business owners had an “unfavorable”
industry distribution partly placing them at higher risk of business activity losses. For May and
June, the “unfavorable” industry distribution also placed Latinx business owners at a higher risk
of business activity losses.
Asian business owners show a similar pattern in April, but not in May and June. For
April, I also find that Asian business owners were more concentrated in industries placing them
at a higher risk of losses in business activity. But, when switching to the national industry
distribution in May and June Asian business owners are predicted to have larger losses in

13
business activity, which implies the opposite pattern. In these months, business activity losses
switched to industries that Asian business owners were less concentrated.
Interestingly, the large loss in the number of immigrant business owners does not appear
to be due to a less favorable industry distribution. The loss of 36 percent of active immigrant
business owners remains essentially unchanged when switching to the national industry
distribution in April. The same pattern is found in June. For May there is some evidence of a less
favorable industry distribution based on the losses in business activity in that month relative to
February.
Another way to estimate industry impacts is to examine the percentage of each
demographic group that is in “essential” industries. As noted above the classification is not
perfect and other factors such as differences in customer demand, enforcement and compliance
by businesses also influence whether they are open. The percentage of black business owners in
essential industries is 66 percent which is lower than the national percentage of 76 percent, and
consistent with the less “favorable” industry distribution placing them at higher risk of losses due
to COVID-19. Similarly, female-owned businesses are less concentrated in essential businesses
at 61 percent. On the other hand, using the Delaware codes, Latinx and immigrant business
owners are slightly more likely to be concentrated in essential industries (79-80 percent), and
Asian business owners have the same concentration in essential industries as the national average
(76 percent). The classification is likely to be imperfect and does not line up entirely well with
patterns of group-specific losses.
4. Conclusions
The first estimates of the effects of COVID-19 on the number of business owners from
nationally representative April-June 2020 CPS data indicate dramatic early-stage reductions in
small business activity. The number of active business owners in the United States plunged from
15.0 million to 11.7 million over the crucial two-month window from February to April 2020.
No other one-, two- or even 12-month window of time has ever shown such a large change in
business activity. For comparison, from the start to end of the Great Recession the number of
active business owners decreased by 730,000 representing only a 5 percent reduction. In general,
business ownership is relatively steady over the business cycle (Fairlie 2013; Parker 2018). The
loss of 3.3 million active business owners (or 22 percent) was comprised of large drops in

14
important subgroups such as owners working roughly two days per week (28 percent), owners
working four days a week (31 percent), and incorporated businesses (20 percent). When viewed
as total hours worked by all business owners there was a drop of 29 percent.
Estimates from nationally representative May 2020 CPS data – the second month into
social distancing restrictions – continue to indicate large reductions in small business activity.
The number of active business owners in the United States dropped by 15 percent from February
to May. The number of business owners in May actually rebounded somewhat from the April
low of 11.7 million. The partial rebound resulted in an increase of 1.1 million business owners or
7 percentage points from February levels. The rebound continued in June 2020 adding back
another 7 percentage points. The decline in business owner activity from February to June is 8
percent. Although the rebound shows widespread reopening of small businesses, it continues to
indicate an extremely large decrease in business activity over a short period of time. Importantly,
the drops in business activity in April, May and June represent large income losses to business
owners that cannot be fully recovered.
African-American business owners were hit the hardest by COVID-19. The first
estimates from April 2020 for black business owners in the United States indicate a massive drop
of 41 percent in business activity. Black business owners were also disproportionately negatively
affected in May and June relative to national levels with declines in business activity of 26
percent and 19 percent, respectively. Simulations indicate that the industry distribution of blacks
was partly responsible, placing black business owners at greater risk of losses in business activity
due to the pandemic. Latinx businesses were also hit hard by COVID-19 losing 32 percent of
active business owners in April, 19 percent in May and 10 percent in June. Asian business
owners experienced a 26 percent decline in business activity over the critical two-month
window, and continued losses of activity of 21 percent in May and 10 percent in June.
Simulation estimates also point to unfavorable industry distributions for Latinx, but the evidence
is less clear for Asians. Immigrant business owners were also devastated with losses of 36
percent of business activity in April. Continued disproportionate losses were felt in May (25
percent) and June (18 percent). Although industry distributions placed some groups at higher risk
of closures in the pandemic, differences in the scale of businesses are likely a major cause of
disproportionate losses among minority-owned businesses, which are smaller on average (Fairlie
and Robb 2008; U.S. Census Bureau 2012). Larger businesses are more likely to have the

15
resources, business and legal structure, and returns to scale to implement procedures to address
social distancing regulations for operating and re-opening during the pandemic.
The negative early-stage impacts on minority- and immigrant-owned businesses, if
prolonged, could be problematic for broader racial inequality because of the importance of small
businesses for local job creation (disproportionately hiring other minorities), economic
advancement, and longer-term wealth inequality (Boston 1999, 2006; Stoll, Holzer and Raphael
2001; Bradford 2003, 2014; Fairlie and Robb 2008). With major losses in business activity in
April and continued losses in May and June, even though these losses were smaller, business
owners have already lost substantial amounts of income from their businesses. If a more
complete rebound does not happen soon the long-term economic consequences could be severe.
Many minority business owners will not have the resources to weather prolonged closures,
reduced demand from health concerns, and a more comprehensive recession. The latest Census
data indicate that the median level of wealth among black families is $13,000 and Latinx families
is $20,000 compared with $139,000 among white families (U.S. Census Bureau 2015).
The first estimates of early stage impacts on active female business owners are also
worrisome. Female business ownership is substantially lower than male business ownership and
female-owned businesses have lower revenues, employees and profits on average (U.S. Census
Bureau 2016). The disproportionate losses in the first three months to the number of active
female business owners will only further increase gender inequality in business ownership and
perhaps broader economic inequality.
The next important question is whether the shutdowns of small businesses are temporary
or permanent. The government has been responding to concerns over longer-term effects on
small businesses through several programs. The largest program is the Paycheck Protection
Program (PPP) which has thus far allocated over $650 billion to help businesses. Another large
program is the Economic Injury Disaster Loan program by the SBA, which provided over $150
billion as of July 2020. Foundations and private companies are also starting to contribute to relief
efforts. For example, Magic Johnson Enterprises is providing a $100 million commitment to
minority- and female-owned businesses left out of the PPP program. Another recent example, is
that PayPal, in partnership with the Association for Enterprise Opportunity, created a $10 million
fund to help black-owned businesses, and Google is pledging $175 million on financing and
supporting black-owned businesses. Can these programs help small businesses survive the

16
setbacks and shutdowns due to the coronavirus pandemic, or will more assistance be needed?
More permanent mass closures of small businesses in the United States are likely to have a
dramatic effect on employee job losses, further income inequality, and contributing to a
prolonged recession. But, the tradeoffs from lifting restrictions on reopening of businesses on
health impacts are unknown and of concern given that COVID-19 cases have been increasing
over the summer (CDC 2020b).

17
References
Alexander W. Bartik, Marianne Bertrand, Zoë B. Cullen, Edward L. Glaeser, Michael Luca, and
Christopher T. Stanton. 2020. “How Are Small Businesses Adjusting to COVID-19? Early
Evidence from a Survey. NBER Working Paper No. w26989.
Beland, Louis-Philippe, Oluwatobi Fakorede, and Derek Mikola. 2020. "The Short-Term Effect
of COVID-19 on Self-Employed Workers in Canada." Canadian Public Policy: Accepted-
version.
Bohn, Sarah, Marisol Cuellar Mejia, and Julien Lafortune. 2020. “The Economic Toll of
COVID-19 on Small Business,” Public Policy Institute of California.
Boston, Thomas D. 1999. “Generating Jobs Through African American Business Development”,
in J. Whitehead and C. Harris, eds. Readings in Black Political Economy (Dubuque: Kendall-
Hunt).
Boston, Thomas D. 2006. “The Role of Black-owned Businesses in Black Community
Development” ed. Paul Ong, Jobs and Economic Development in Minority Communities:
Realities, Challenges, and Innovation. Temple University Press
Bradford, William D. 2003. "The Wealth Dynamics of Entrepreneurship for Black and White
Families in the U.S.," Review of Income and Wealth, 49(1): 89-116.
Bradford, William D. 2014. "The “myth” that black entrepreneurship can reduce the gap in
wealth between black and white families." Economic Development Quarterly 28.3: 254-269.
Busby, Ron. 2020. “Testimony of Ron Busby on behalf of the U.S. Black Chambers, Inc. to the
U.S. Senate Committee on Small Business & Entrepreneurship,” Capital Access for Minority
Small Businesses: COVID-19 Resources for an Equitable and Sustainable Recovery Hearing,
U.S. Senate, July 23, 2020.
Centers for Disease Control and Prevention (CDC). 2020. “Identifying the source of the
outbreak.” https://www.cdc.gov/coronavirus/2019-ncov/cases-updates/about-
epidemiology/identifying-source-outbreak.html
Centers for Disease Control and Prevention (CDC). 2020. “Trends in Number of COVID-19
Cases in the US Reported to CDC, by State/Territory.” https://www.cdc.gov/covid-data-
tracker/#trends
Chatterji, Aaron K., Kenneth Y. Chay, and Robert W. Fairlie. 2014. "The impact of city
contracting set-asides on black self-employment and employment." Journal of Labor Economics
32.3 (2014): 507-561.
Dávila, Alberto, and Marie Mora. 2013. Hispanic Entrepreneurs in the 2000s: An Economic
Profile and Policy Implications. Stanford University Press, Stanford.

18
Desai, Sameeksha, and Jessica Looze. 2020. “Business Owner Perceptions of COVID-19 Effects
on the Business: Preliminary Findings,” Trends in Entrepreneurship, No. 10. Kauffman
Foundation.
Evans, Connie. 2020. “Testimony of Connie Evans on behalf of the Association for Enterprise
Opportunity to the U.S. Senate Committee on Small Business & Entrepreneurship,” Perspectives
from Main Street: COVID-19’s Impact on Small Business, June 3, 2020
Kerr, Sari Pekkala, and William Kerr. 2020. "Immigrant entrepreneurship in America: Evidence
from the survey of business owners 2007 & 2012." Research Policy 49.3: 103918.
Koellinger, Phillipp, and Maria Minniti. 2006. "Not for lack of trying: American
entrepreneurship in black and white." Small Business Economics 27, no. 1:59–79.
Fairlie, Robert W. 2020. “The Impact of Covid-19 on Small Business Owners: Evidence of
Early-Stage Losses from the April 2020 Current Population Survey,” May 23, 2020. Stanford
University (SIEPR) Working Paper No. 20-022.
Fairlie, Robert W. 2013. "Entrepreneurship, economic conditions, and the great recession."
Journal of Economics & Management Strategy 22.2: 207-231.
Fairlie, Robert W., and Aaron K. Chatterji. 2013. "High‐technology entrepreneurship in Silicon
Valley." Journal of Economics & Management Strategy 22.2: 365-389.
Fairlie, R. W., and F. M. Fossen. 2019. "Opportunity versus Necessity Entrepreneurship: Two
Components of Business Creation." NBER Working Paper No. w26377.
Fairlie, Robert W., Javier Miranda, and Nick Zolas. 2020. “Job Creation and Survival among
Entrepreneurs: Evidence from the Universe of U.S. Startups,” Working Paper.
Fairlie, Robert W., and Alicia M. Robb. 2008. Race and Entrepreneurial Success: Black-, Asian-
, and White-Owned Businesses in the United States, Cambridge: MIT Press.
Jennings, Jennifer E., and Candida G. Brush. 2013. "Research on women entrepreneurs:
challenges to (and from) the broader entrepreneurship literature?." The Academy of Management
Annals 7.1: 663-715.
Hipple, Steven F., and Laurel A. Hammond. 2010. "Self-employment in the United States."
Monthly Labor Review 133.9: 17-32.
Levine, Ross, and Yona Rubinstein. 2016. "Smart and Illicit: Who Becomes an Entrepreneur and
Do they earn more?." Quarterly Journal of Economics.
Levine, Ross, and Yona Rubinstein. 2018. "Selection into Entrepreneurship and Self-
Employment." National Bureau of Economic Research Working Paper No. 25350.
Lofstrom, Magnus, and Chunbei Wang. 2009. "Mexican-American self-employment: a dynamic
analysis of business ownership." Research in Labor Economics 29: 197-227.
Parker, Simon C. The economics of entrepreneurship. Cambridge University Press, 2018.
19
Stoll, Michael A., Steven Raphael, and Harry J. Holzer. 2001. “Why Are Black Employers More
Likely than White Employers to Hire Blacks?” Institute for Research on Poverty, University of
Wisconsin, Madison.
Wang, Chunbei. "Tightened Immigration Policies and the Self‐Employment Dynamics of
Mexican Immigrants." Journal of Policy Analysis and Management 38.4 (2019): 944-977.
Wilmoth, Daniel. 2020. “Small Business Facts: Early Data Show Severe Disruptions,” U.S.
Small Business Administration.
U.S. Census Bureau. 2016. “Survey of Business Owners (SBO) - Survey Results: 2012”
U.S. Census Bureau. 2020. “Small Business Pulse Survey.”
U.S. Senate. 2020. “Cardin, Cantwell, Schumer, Booker, Cortez Masto & Harris Introduce
Legislation to Invest in Minority-Owned Businesses,” U.S. Senate Committee on Small Business
& Entrepreneurship.
Data Availability Statement
The microdata used in the analysis are publicly available.
20
Worked in
Survey
Week
Percent
Change
from Feb.
Worked 15+
Hours
Worked 30+
Hours
Total Hours
Worked in
Business
Unincorporat
edIncorporated
June 2020 13,794,081 -8% 12,021,520 9,614,237 490,842 8,065,557 5,728,523
May 2020 12,809,946 -15% 11,040,149 8,808,505 448,786 7,292,477 5,517,469
April 2020 11,710,360 -22% 9,821,255 7,684,501 394,678 6,392,480 5,317,880
March 2020 14,475,704 -4% 12,803,107 10,392,909 523,558 8,545,156 5,930,548
February 2020 15,012,692 0% 13,582,876 11,086,054 558,440 8,828,513 6,184,179
January 2020 14,832,717 -1% 13,293,991 11,093,877 551,153 8,649,659 6,183,059
Table 1: Number of Active Business Owners before and after COVID-19
Notes: Estimates form CPS Microdata. Monthly sample sizes are roughly 55,000 for the labor force and 5,000 for
business owners.

21
Feb. 2020 Apr. 2020 May 2020 June 2020 Feb. to May Feb. to June
Group Number Number Number Number Number Percent Percent Percent
Total 15,012,692 11,710,360 12,809,946 13,794,081 -3,302,331 -22% -15% -8%
Female 5,389,399 4,048,205 4,517,965 4,876,392 -1,341,194 -25% -16% -10%
Male 9,623,293 7,662,156 8,291,981 8,917,689 -1,961,137 -20% -14% -7%
Black 1,079,116 637,769 798,668 872,717 -441,347 -41% -26% -19%
Latinx 2,070,896 1,412,925 1,668,254 1,855,026 -657,971 -32% -19% -10%
Asian 888,528 657,896 700,393 798,811 -230,632 -26% -21% -10%
White 10,553,415 8,761,531 9,373,304 10,001,462 -1,791,884 -17% -11% -5%
Immigrant 3,120,275 2,009,597 2,329,820 2,545,926 -1,110,677 -36% -25% -18%
Native 11,892,417 9,700,763 10,480,126 11,248,155 -2,191,654 -18% -12% -5%
Table 2: Number of Active Business Owners by Demographic Group
Feb. to Apr. Change
Notes: Estimates are from CPS microdata.

22
Feb. 2020 Apr. 2020 May 2020 June 2020
Group Share Share Share Share
Total 100% 100% 100% 100%
Female 36% 35% 35% 35%
Male 64% 65% 65% 65%
Black 7% 5% 6% 6%
Latinx 14% 12% 13% 13%
Asian 6% 6% 5% 6%
White 70% 75% 73% 73%
Immigrant 21% 17% 18% 18%
Native 79% 83% 82% 82%
Table 3: Share of Active Business Owners by Demographic Group
Notes: Estimates are from CPS microdata.

23
Industry Number Percent
Feb. to
April
Feb. to
May
Feb. to
June
Agriculture 869,661 6% 7% 16% 14%
Construction 2,436,057 16% -27% -19% -8%
Manufacturing 566,192 4% -11% -26% -2%
Wholesale Trade 260,151 2% -14% 1% 5%
Retail Trade 1,068,484 7% -10% -2% -1%
Transportation 798,325 5% -22% -12% -1%
Information 235,847 2% -10% -19% -20%
Financial activities 1,301,769 9% -12% -6% -1%
Professional and bus.
services
3,295,875 22% -18% -10% -7%
Educational services 329,544 2% -39% -10% -25%
Health services 1,238,335 8% -16% -18% -8%
Arts, leisure, hotels 685,009 5% -35% -35% -31%
Restaurants 409,605 3% -22% -24% -13%
Repair and maintenance 512,403 3% -25% -22% -29%
Personal and laundry serv. 926,409 6% -79% -48% -26%
"Nonessential" industry 3,675,939 24% -38% -28% -17%
"Essential" Industry 11,336,752 76% -17% -10% -5%Notes: Estimates from CPS microdata. Essential industries are defined using the
classification provided by Delaware State for essential and nonessential businesses.
Table 4: Number of Active Business Owners by Industry
Changes in NumberFebruary 2020

24
Group Feb. to Apr. Feb. to May Feb. to June Feb. to Apr. Feb. to May Feb. to June
Total -22% -15% -8% -22% -15% -8%
Female -25% -16% -10% -19% -10% -4%
Male -20% -14% -7% -23% -15% -8%
Black -41% -26% -19% -35% -18% -17%
Latinx -32% -19% -10% -28% -13% -6%
Asian -26% -21% -10% -22% -27% -21%
White -17% -11% -5% -18% -12% -6%
Immigrant -36% -25% -18% -35% -19% -17%
Native -18% -12% -5% -19% -12% -6%
Notes: Estimates are from CPS microdata. Predicted changes switch the group's industry
distribution for the U.S. industry distribution but continue to use the group's percent change
between the two months.
Table 5: Simulations of Changes in Number of Active Business Owners from Switching
Industry Distributions
Actual Change
Predicted using National Industry
Distribution
25
8,000,000
10,000,000
12,000,000
14,000,000
16,000,000
18,000,000
2005 2006 2007 2008 2009 2010 2011 2012 2013 2014 2015 2016 2017 2018 2019 2020
Figure 1Number of Active Business Owners in the United States (January 2000 - June 2020)

26
0
1,000,000
2,000,000
3,000,000
4,000,000
5,000,000
6,000,000
7,000,000
8,000,000
9,000,000
10,000,000
Female Male
Nu
mb
er o
f B
usi
nes
s O
wn
ers
(00
0s)
Figure 2: Number of Active Business Owners by Gender before and after
COVID-19
Feb-20 Apr-20 May-20 Jun-20

27
0
500,000
1,000,000
1,500,000
2,000,000
2,500,000
African-American Latinx Asian
Nu
mb
er o
f B
usi
nes
s O
wn
ers
Figure 3: Number of Active Business Owners by Race/Ethnicity before and
after COVID-19
Feb-20 Apr-20 May-20 Jun-20

28
0
2,000,000
4,000,000
6,000,000
8,000,000
10,000,000
12,000,000
Immigrant Native
Nu
mb
er o
f B
usi
nes
s O
wn
ers
(00
0s)
Figure 4: Number of Active Business Owners by Nativity before and after
COVID-19
Feb-20 Apr-20 May-20 Jun-20