the impact of democracy on economic growth and ... fall09/3 dpi1403... · economic growth and...
TRANSCRIPT
Norris 1
DPI 403 Class 3
The impact of democracy on economic growth and socialeconomic growth and social welfare
Norris 2
P i lPrevious classes
1. Overview and roadmap2 Can democratization be strengthened by2. Can democratization be strengthened by
the international community? Barbara Wejnert: international forces Barbara Wejnert: international forces
outweigh domestic factors What strategies are used? Menu of What strategies are used? Menu of
alternative types of interventions.
Norris 3
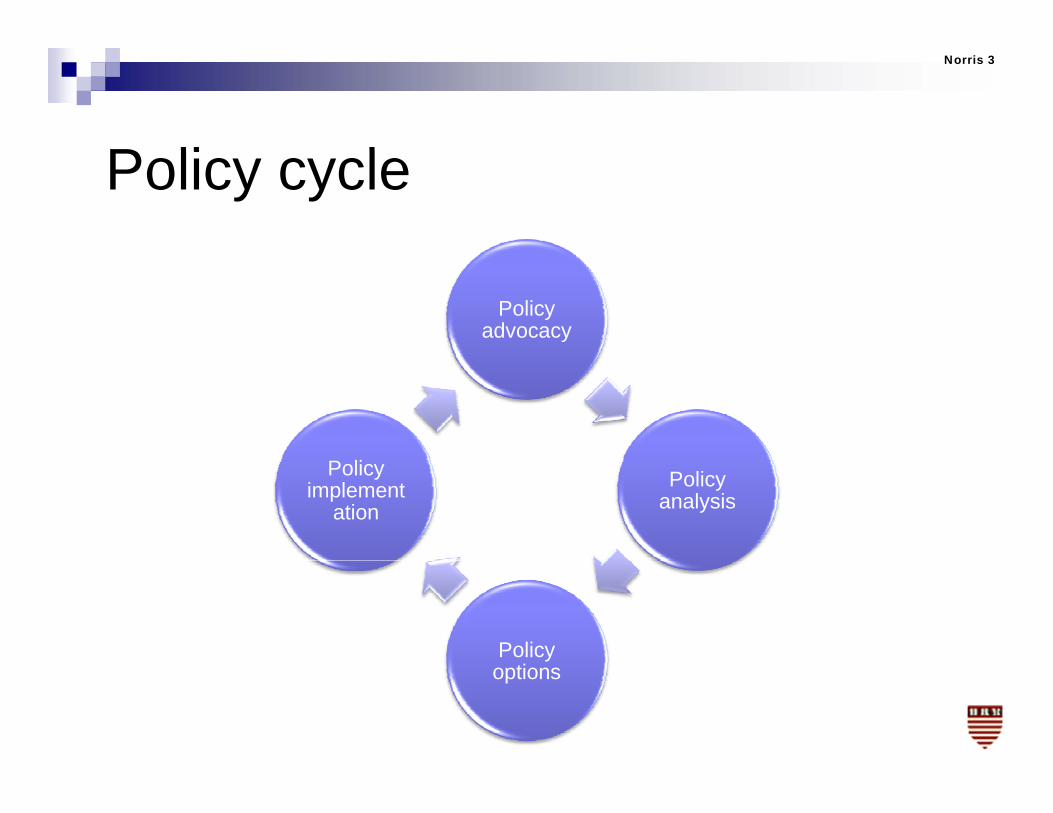
P li lPolicy cycle
Policy advocacy
Policy analysis
Policy implement
ation
Policy options
Norris 4
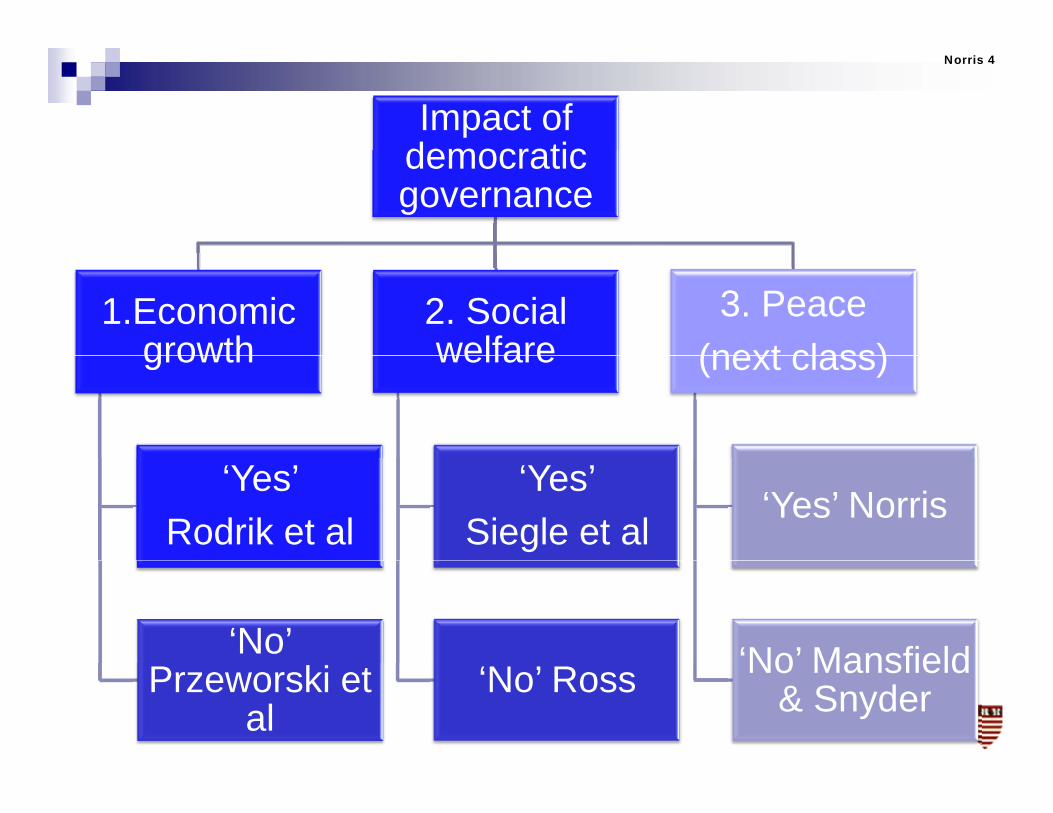
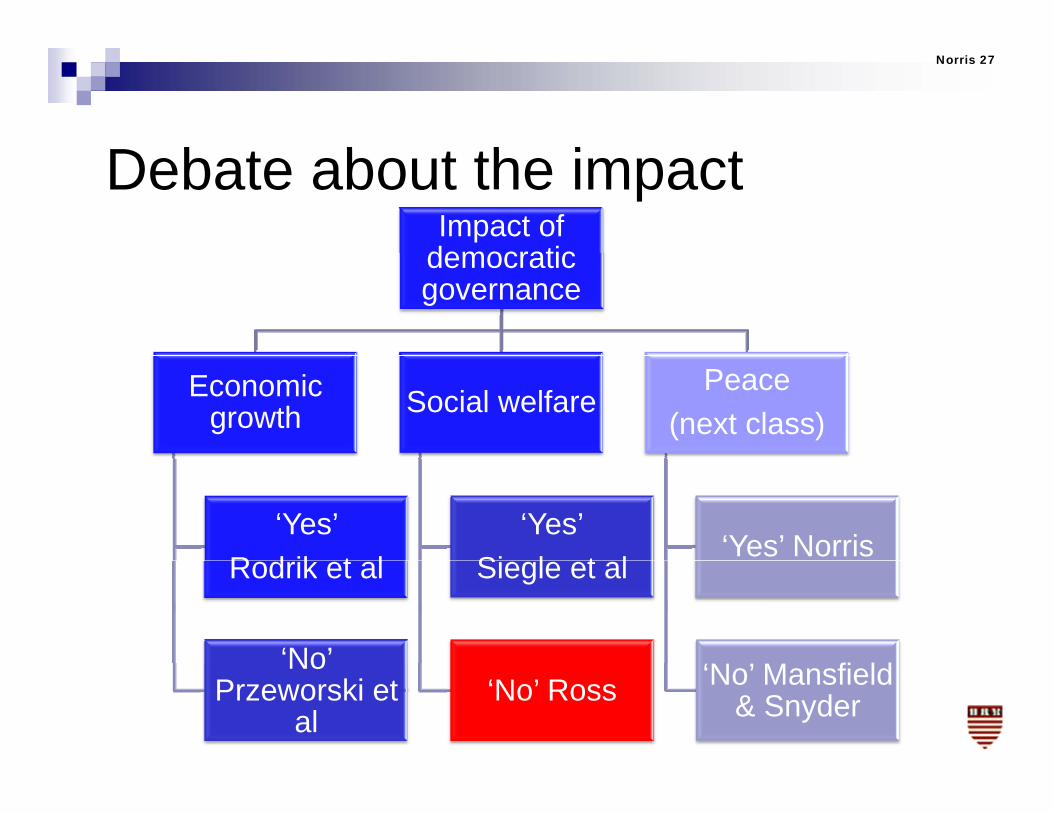
Impact of democraticdemocratic governance
1.Economic growth
2. Social welfare
3. Peace (next class)growth welfare (next class)
‘Yes’ Rodrik et al
‘Yes’Siegle et al
‘Yes’ Norris
‘No’ ‘No’ MansfieldPrzeworski et al
‘No’ Ross No Mansfield & Snyder

Norris 5
R diReadings
Dani Rodrik Institutions Rule? Adam Przeworski Institutions Matter? Adam Przeworski Institutions Matter? Michael Ross Democracy good for the
poor?poor? Haerpfer Ch 8 Democracy and capitalism

Norris 6
St t d d b tStructure: advocacy debateI. Context: does democratic governance matter g
instrumentally for development?
II Does democratic governance lead toII. Does democratic governance lead to economic growth?
III Does democratic governance lead to socialIII. Does democratic governance lead to social welfare?
IV. Discussion exercise
V. [Next class] Does democracy lead to peace?[ ] y p

Norris 7
I Context: DoesI. Context: Does democratic governance matter instrumentally for development?development?
Norris 8
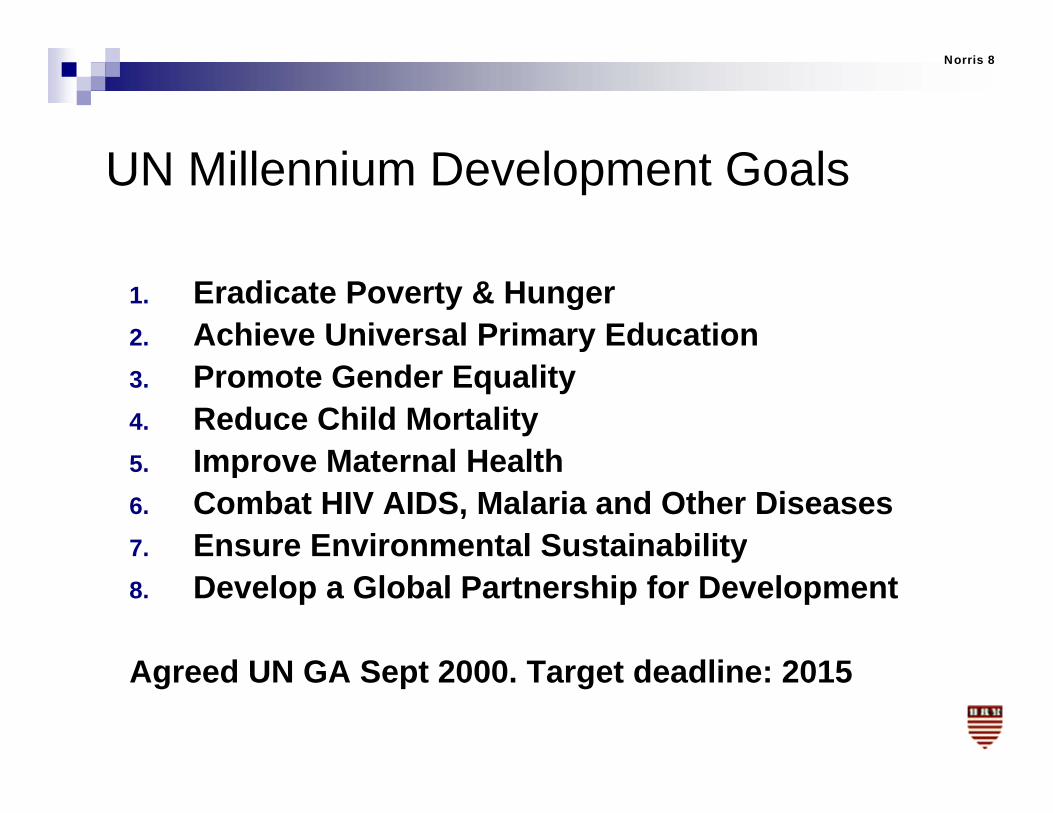
UN Millennium Development Goals
1. Eradicate Poverty & Hunger 2. Achieve Universal Primary Education3. Promote Gender Equality4. Reduce Child Mortality5 Improve Maternal Health5. Improve Maternal Health6. Combat HIV AIDS, Malaria and Other Diseases 7. Ensure Environmental Sustainabilityy8. Develop a Global Partnership for Development
A d UN GA S t 2000 T t d dli 2015Agreed UN GA Sept 2000. Target deadline: 2015
Norris 9
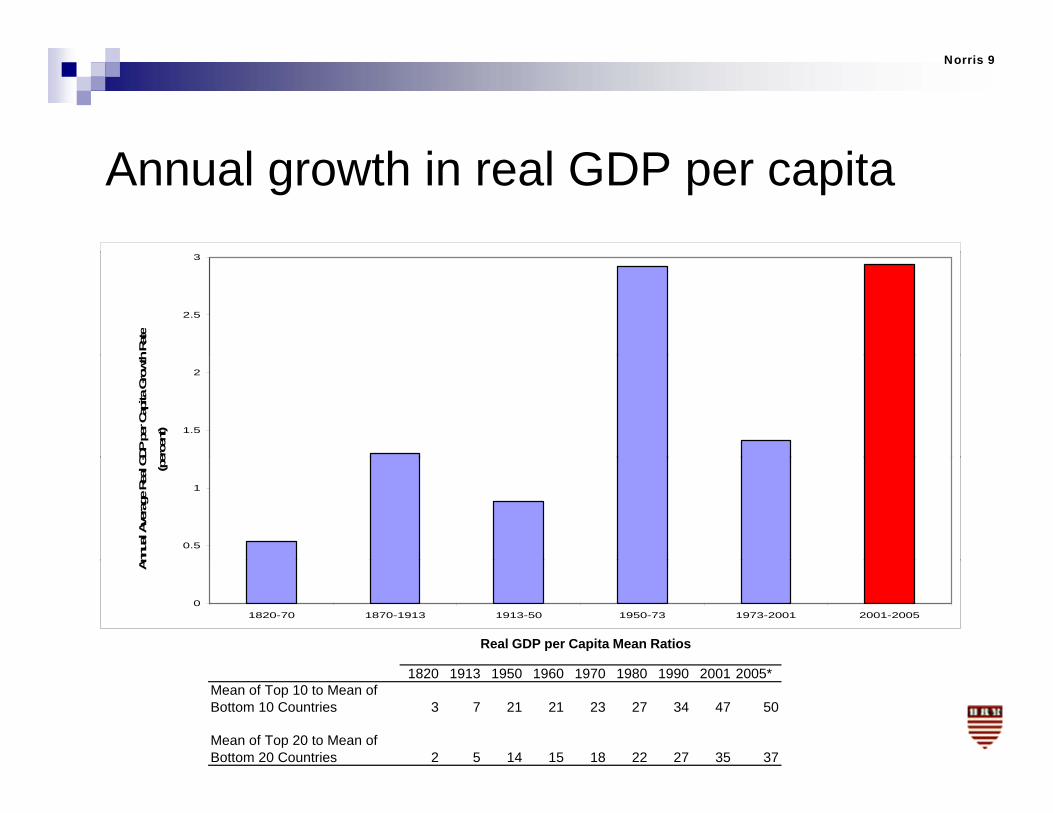
Annual growth in real GDP per capita
2.5
3
h Rat
e
1.5
2
GDP
per C
apita
Gro
wth
erce
nt)
0.5
1
Ann
ual A
vera
ge R
eal G (p
e
01820-70 1870-1913 1913-50 1950-73 1973-2001 2001-2005
An
Real GDP per Capita Mean Ratios
1820 1913 1950 1960 1970 1980 1990 2001 2005*Mean of Top 10 to Mean of Bottom 10 Countries 3 7 21 21 23 27 34 47 50
Mean of Top 20 to Mean of Bottom 20 Countries 2 5 14 15 18 22 27 35 37
Norris 10
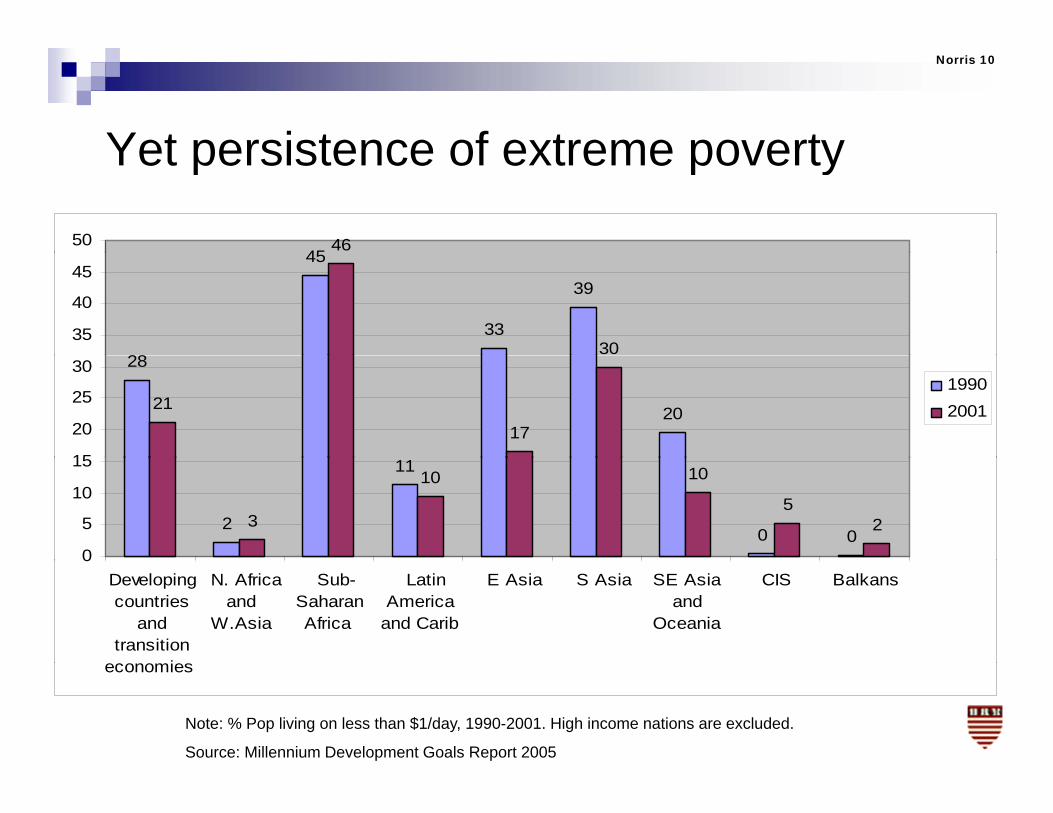
Yet persistence of extreme povertyYet persistence of extreme poverty
454650
28
45
33
39
3035
40
45
28
2021
17
15
20
25
3019902001
2
11
0 03
10 10
52
0
5
10
15
0Developingcountries
andtransition
i
N. Africaand
W.Asia
Sub-SaharanAfrica
LatinAmerica
and Carib
E Asia S Asia SE Asiaand
Oceania
CIS Balkans
economies
Note: % Pop living on less than $1/day, 1990-2001. High income nations are excluded.
Source: Millennium Development Goals Report 2005

Norris 11
G th f USAID diGrowth of USAID spending
Norris 12
II. Does democratic governance lead togovernance lead to economic growth?
Norris 13
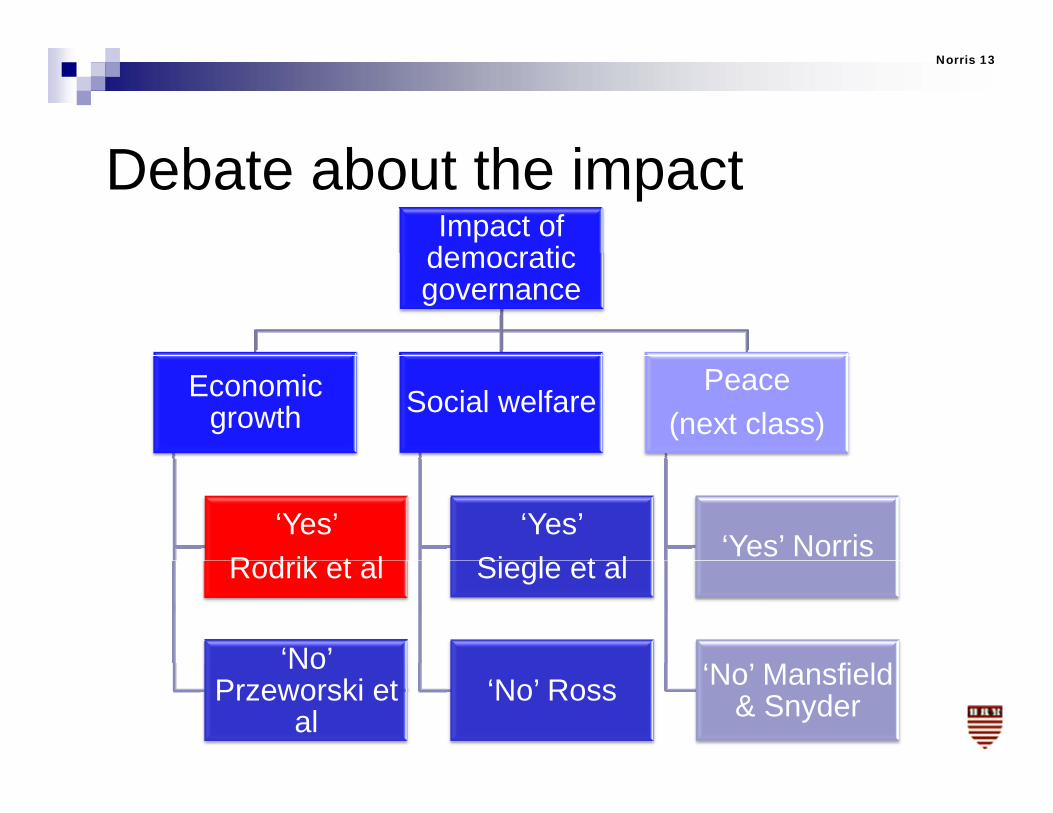
D b t b t th i tDebate about the impactImpact of
democraticdemocratic governance
Economic growth Social welfare
Peace (next class)
‘Yes’ R d ik t l
‘Yes’Si l t l
‘Yes’ NorrisRodrik et al
‘No’
Siegle et al
‘N ’ M fi ldNo Przeworski et
al‘No’ Ross ‘No’ Mansfield
& Snyder
Norris 14
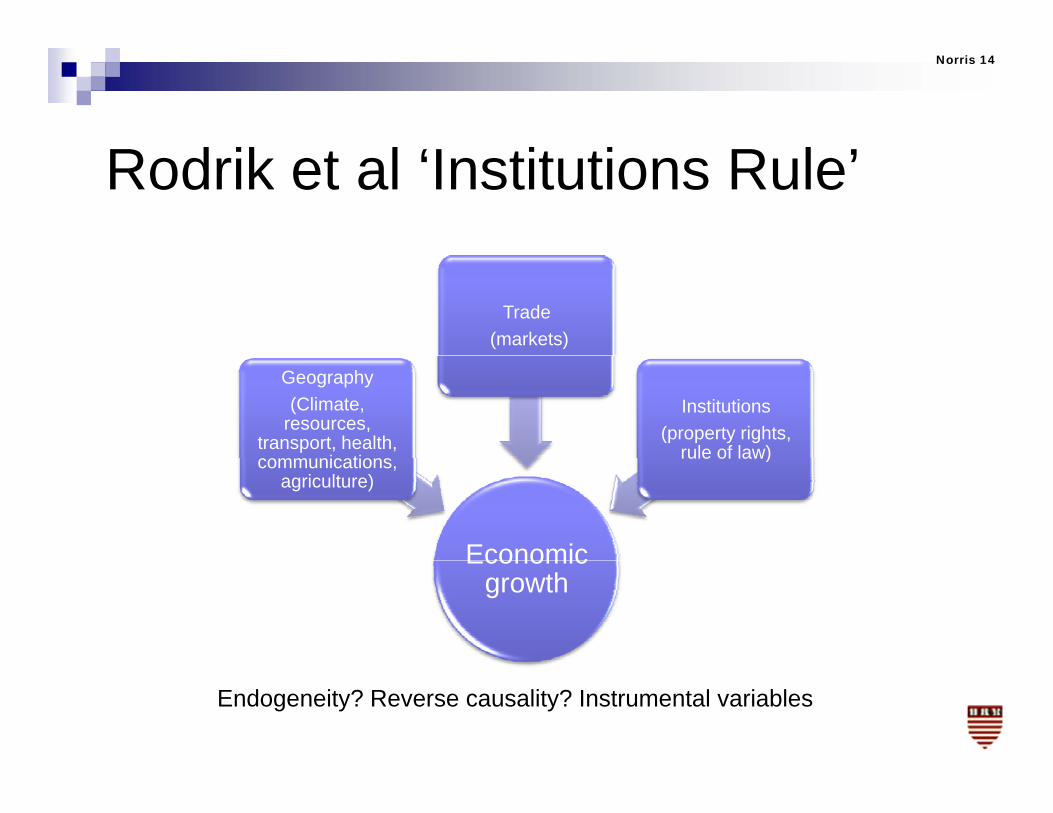
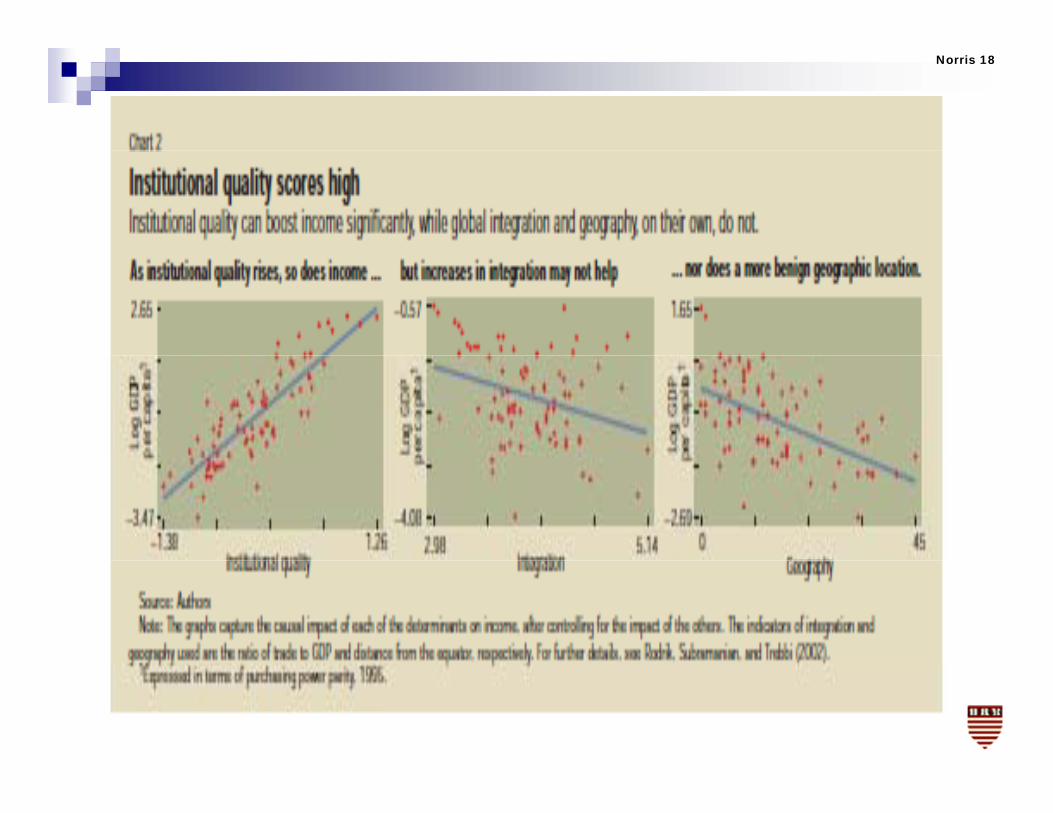
R d ik t l ‘I tit ti R l ’Rodrik et al ‘Institutions Rule’
Trade(markets)
Geography(Climate,
resources, transport, health,
i ti
Institutions (property rights,
rule of law)
Economic
communications, agriculture)
rule of law)
Economic growth
Endogeneity? Reverse causality? Instrumental variables
Norris 15
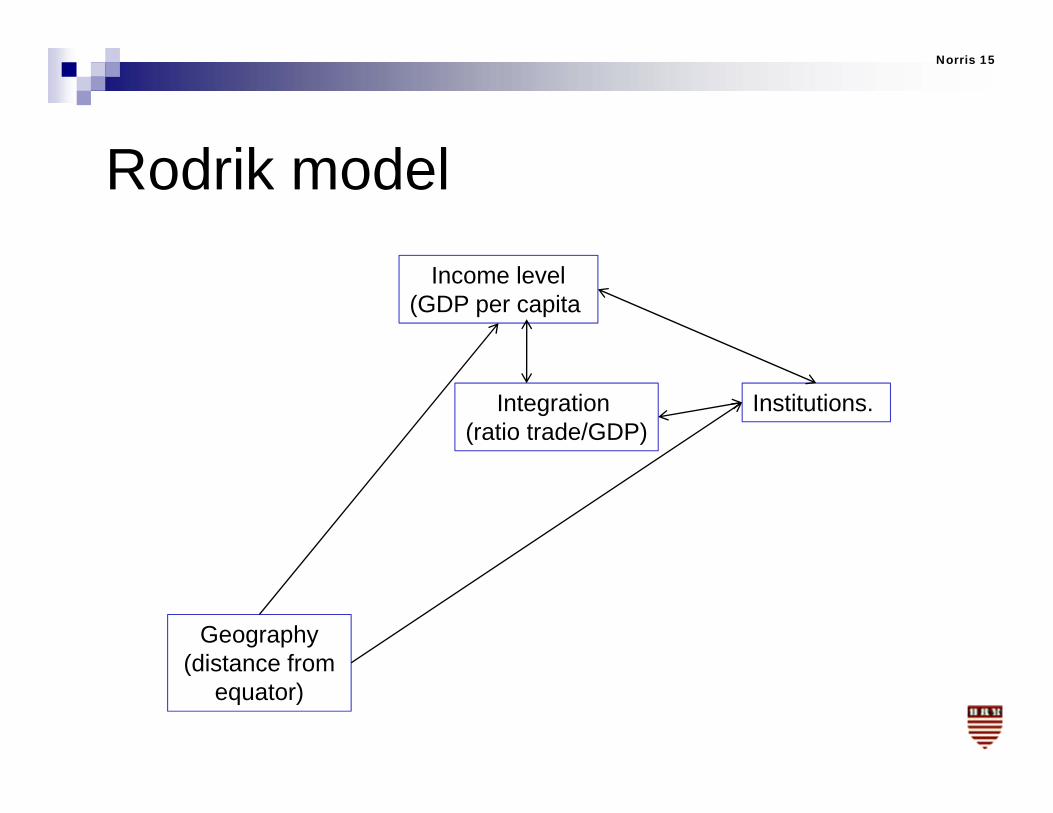
R d ik d lRodrik modelIncome level
(GDP per capita
Integration (ratio trade/GDP)
Institutions.
Geography(distance from(distance from
equator)

Norris 16
Norris 17
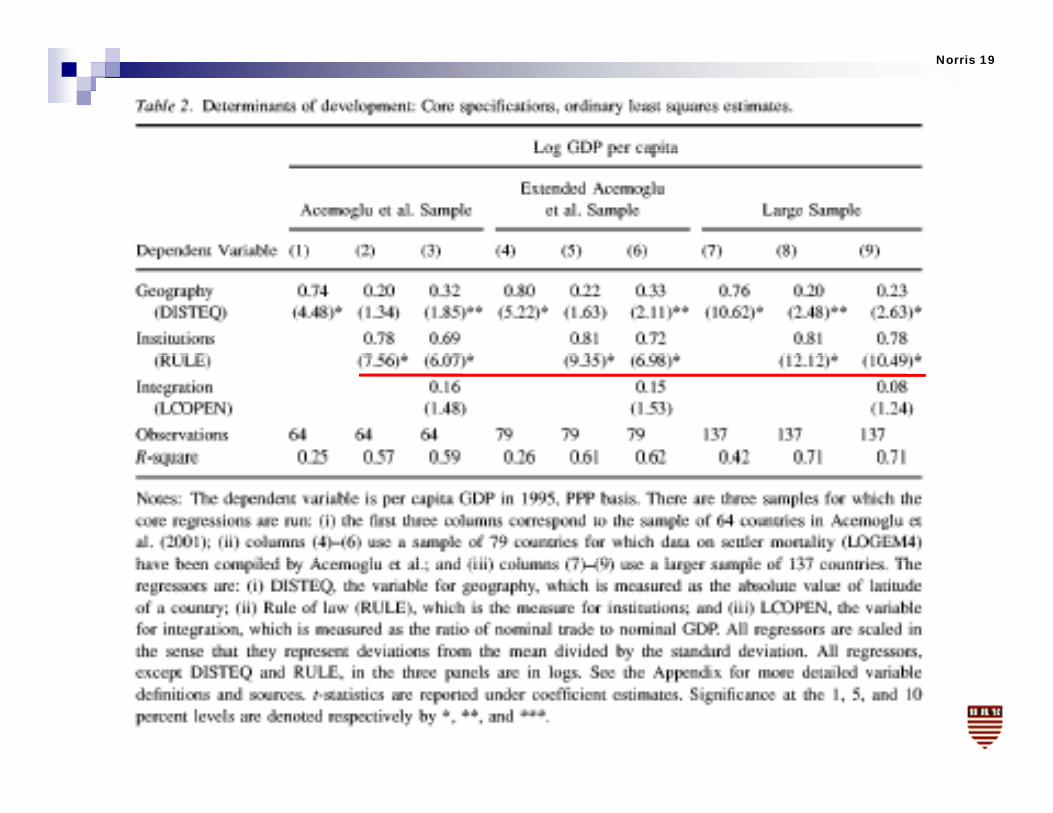
I tit ti l i blInstitutional variables
Institutions= property rights and rule of law Measured by Kaufmann-Kray/World Bank Measured by Kaufmann Kray/World Bank Settler mortality rates (Acemoglu 2001)
I t t d b ttl Instruments are measured by settler mortality rates (79 nations) and by %
ki W t E l (137speaking West European languages (137 nations)
Norris 18
Norris 19
Norris 20
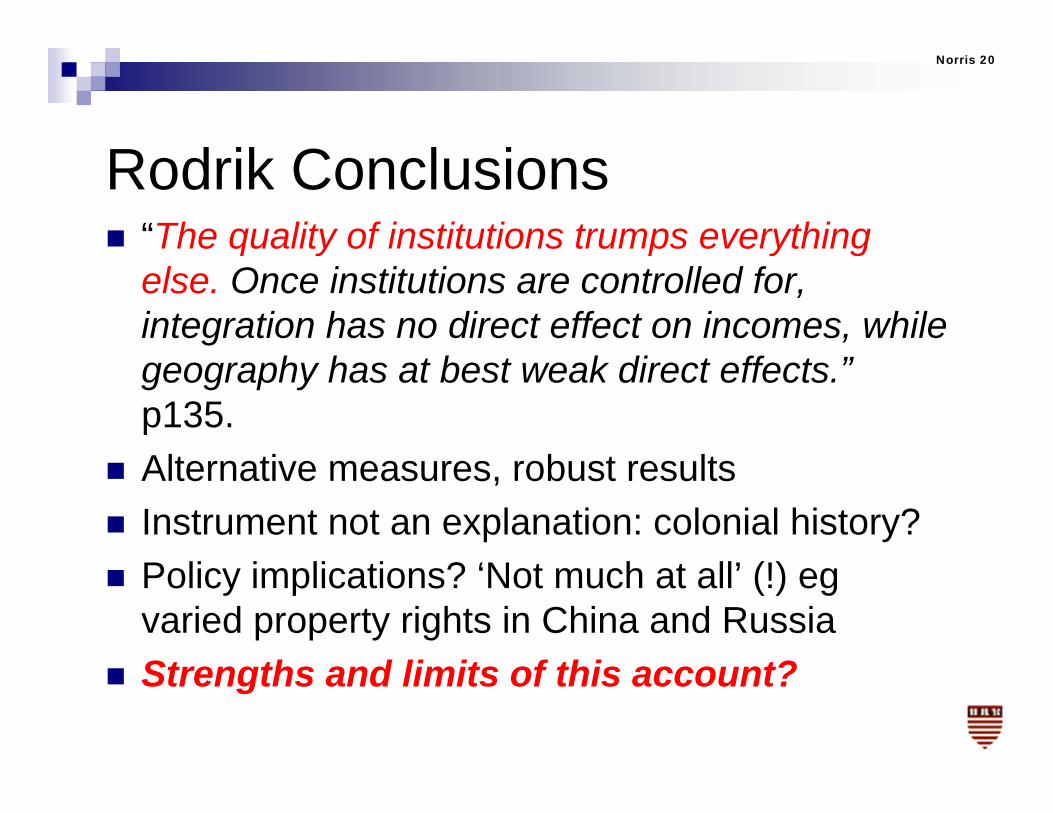
R d ik C l iRodrik Conclusions “The quality of institutions trumps everything q y p y g
else. Once institutions are controlled for, integration has no direct effect on incomes, while
ffgeography has at best weak direct effects.” p135.Alt ti b t lt Alternative measures, robust results
Instrument not an explanation: colonial history? Policy implications? ‘Not much at all’ (!) eg
varied property rights in China and RussiaSt th d li it f thi t? Strengths and limits of this account?

Norris 21
D b t b t th i tDebate about the impactImpact of
democraticdemocratic governance
Economic growth Social welfare
Peace (next class)
‘Yes’ R d ik t l
‘Yes’Si l t l
‘Yes’ NorrisRodrik et al
‘No’
Siegle et al
‘N ’ M fi ldNo Przeworski et
al‘No’ Ross ‘No’ Mansfield
& Snyder
Norris 22
P ki t l ‘N ’Przeworski et al. ‘No’
Adam Przeworksi, Michael Alvarez, Jose Cheibub and Fernando Limogi. 2000. Democracy and Development. (CUP) Ch3
Does democracy undermine growth? Growth rates of productive inputs
Investment share in GDP Probit model controlling for income, Britcol, religion
Unit of measurement: type of regime per year 1950 1990 (di t t hi d )1950-1990 (dictatorship v. democracy)
Norris 23
P ki t lPrzeworski et al.
Conclusions: “There is no trade-off between democracy and development, not even in poor countries.” p178.
In poor countries (with incomes below $3 000) the two In poor countries (with incomes below $3,000), the two regimes are almost identical in their: Investment shares Growth of capital stock Growth of capital stock Growth of labor force Output per worker P d t Product wages
Democracy need not be sacrificed to economic development
Norris 24
P ki t lPrzeworski et al. Yet important distinction between rich and poor nations Poor nations invest little, get little value from total factor
productivity and pay low wagesp y p y g Most poor nations remain poor Regimes make no difference for growth Democracy is fragile in poor nations so most have dictatorships
More affluent nations ($2500-3000+) Total growth rates similar for dictatorships and democracies Yet reasons for growth differ…
Wealthy dictatorship grow by using a lot of labor and paying low wages (repressing unions) – labor-intensive productivity, higher birth rates/fertility but shorter longevity (esp. for women)
Wealthy democracies grow by using labor more effectively: slower l ti d l b th t b t hi h b fitpopulation and labor growth rates but higher wages, benefit more
from technical progress
Norris 25
P ki t l l iPrzeworski et al. conclusions
The kind of regime does not affect the rate of investment, the growth of capital stock (p153), or the growth of total income (p156)
“There is no trade-off between democracy and d l t t i t i ” P 178development, not even in poor countries.” P.178
“Much ado about nothing.” Strengths and limits of this account? Why the contrasts with Rodrik’s account?
Norris 26
III. Does democracy lead to social welfare?
Norris 27
D b t b t th i tDebate about the impactImpact of
democraticdemocratic governance
Economic growth Social welfare
Peace (next class)
‘Yes’ R d ik t l
‘Yes’Si l t l
‘Yes’ NorrisRodrik et al
‘No’
Siegle et al
‘N ’ M fi ldNo Przeworski et
al‘No’ Ross ‘No’ Mansfield
& Snyder
Norris 28
R ‘N ’Ross ‘No’ AJPS 2006 AJPS 2006 Is democracy good for the poor? Democracy is linked to higher spending on Democracy is linked to higher spending on
health, education, and social security Yet “Democracy has little or no effect on infant Yet Democracy has little or no effect on infant
and child mortality.” Previous studies fail to control for country-e ous stud es a to co t o o cou t y
specific effects and for global health trends, and they have sample bias (autocratic states often have missing data)
Norris 29
R ’ d lRoss’s model 168 states 1970-2000 pop over 200,000p p , 5 year panels Dep var=logged infant and child mortality Independent var=Polity IV democracy-autocracy scale Control for income, pop density, econ growth, HIV-Aids
( ) Missing data imputed (Amelia) OLS panel-corrected Standard Errors (PCSE) and
lagged dependent varlagged dependent var A fixed effects model (controls for country-specific
effects but underestimates sig of slow/stable vars)
Norris 30
RRoss
No relationship between type of regime and infant/child mortality ratesy
Why? “We know little…” Incomplete information by voters? Incomplete information by voters? Weak channels of accountability? Strengths and weaknesses of this study?
Norris 31
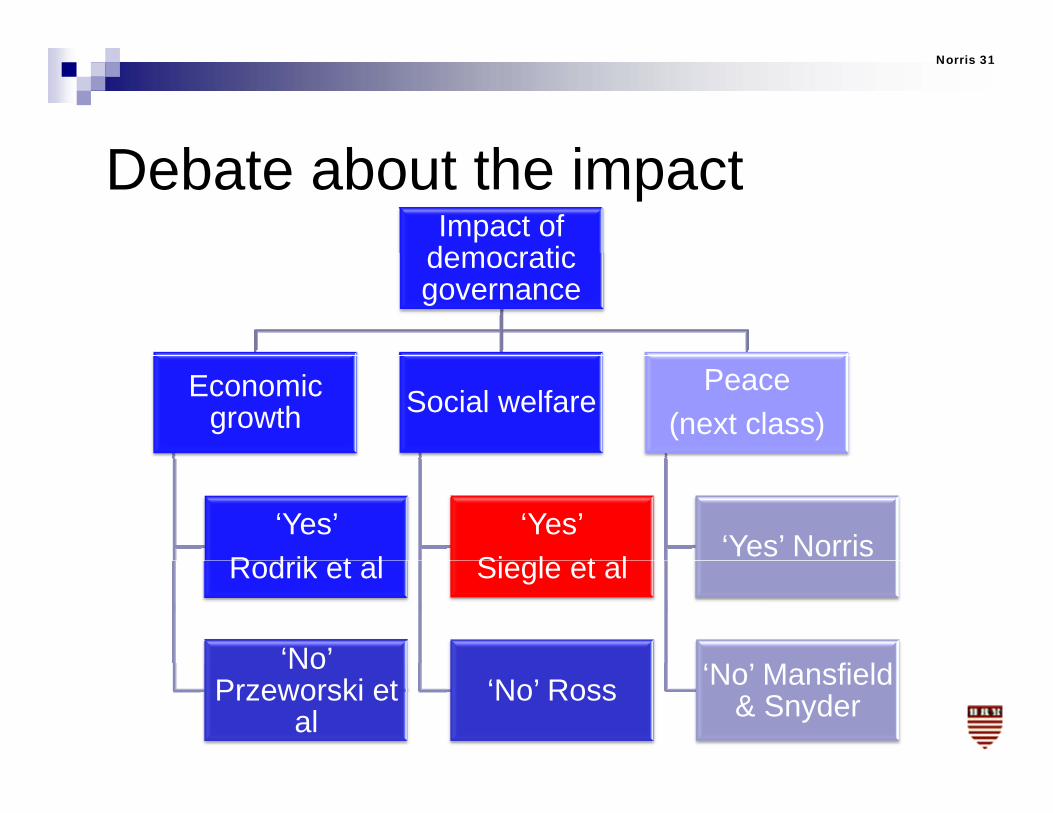
D b t b t th i tDebate about the impactImpact of
democraticdemocratic governance
Economic growth Social welfare
Peace (next class)
‘Yes’ R d ik t l
‘Yes’Si l t l
‘Yes’ NorrisRodrik et al
‘No’
Siegle et al
‘N ’ M fi ldNo Przeworski et
al‘No’ Ross ‘No’ Mansfield
& Snyder

Norris 32
Si l t l ‘Y ’Siegle et al ‘Yes’ From Morton Halperin, Joseph Siegle and Michael Weinstein. 2005.
The Democracy Advantage NY: Routledge Democracies consistently out-perform autocracies in the developing
worldworld Classify regimes by Polity IV index Compare low-income nations (GDP under $2000 constant 1995
dollar terms) World Bank data 1960-2001 No difference found in levels of economic growth Better measures of well-being
Lif t t l t lit h lth i i f t Life expectancy, access to clean water, literacy, health services, infaqnt mortality
Avoid humanitarian crisis and severe economic contractions
Norris 33
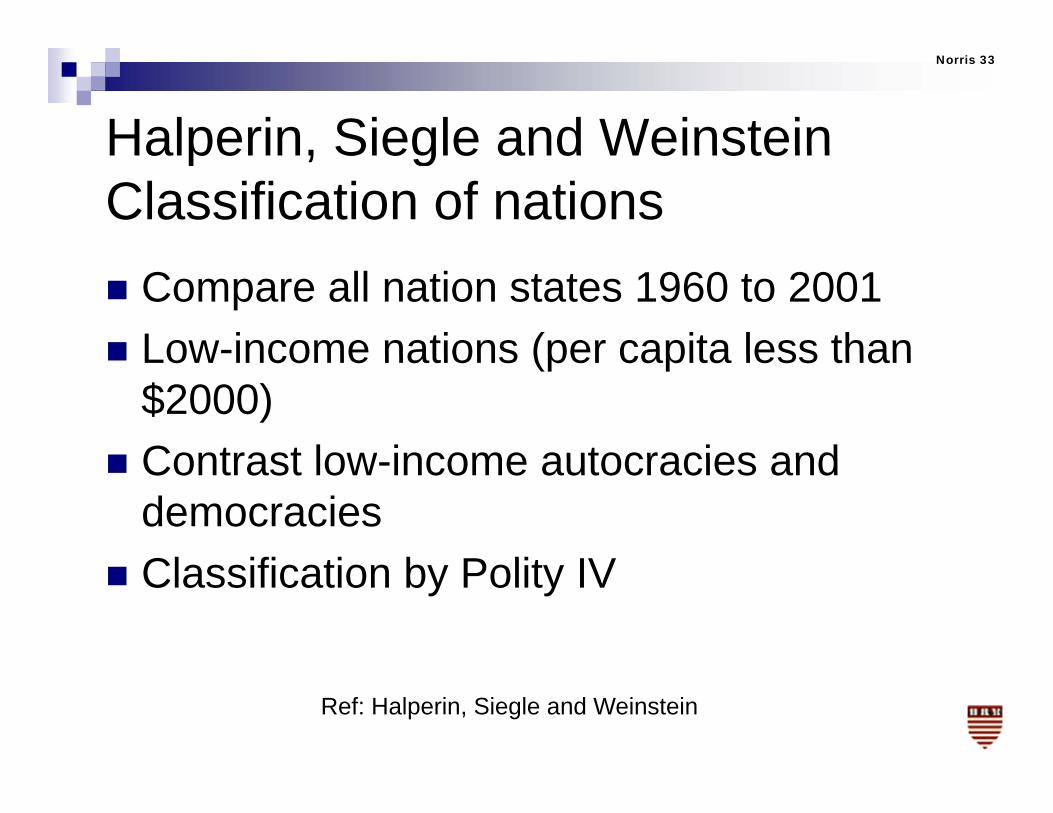
Halperin, Siegle and WeinsteinHalperin, Siegle and WeinsteinClassification of nations Compare all nation states 1960 to 2001 Low-income nations (per capita less than Low income nations (per capita less than
$2000) Contrast low income autocracies and Contrast low-income autocracies and
democraciesCl ifi ti b P lit IV Classification by Polity IV
Ref: Halperin, Siegle and Weinstein
Norris 34
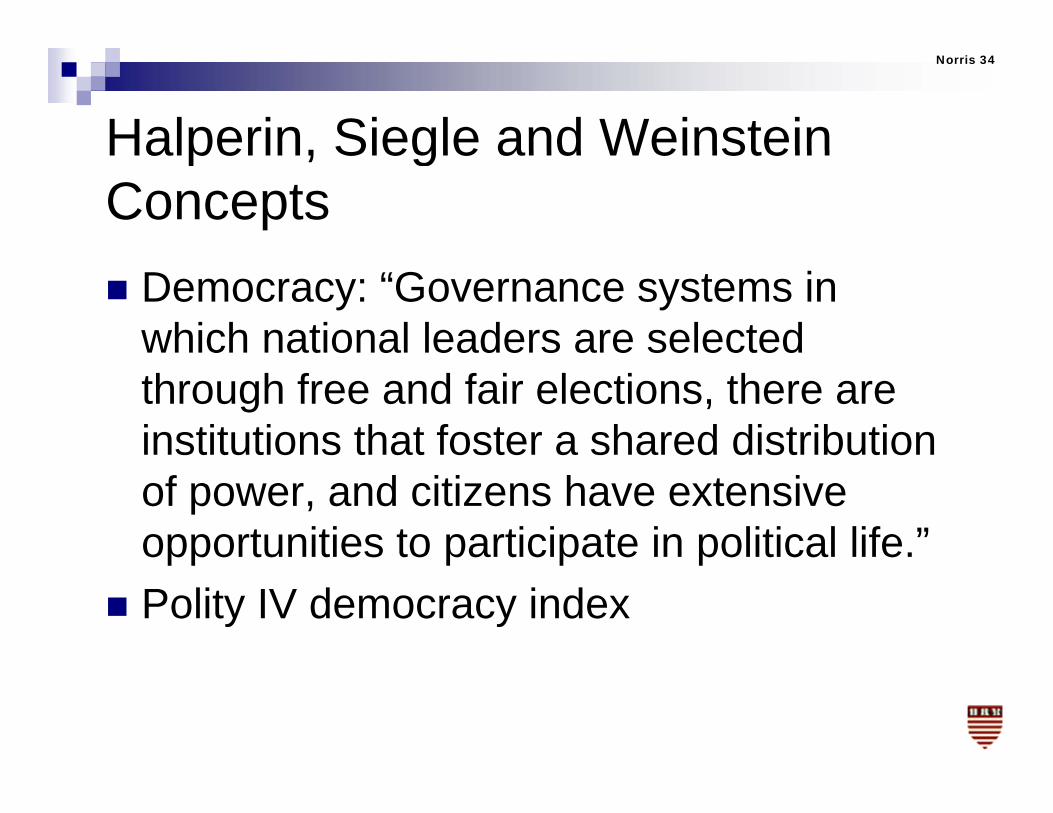
Halperin, Siegle and WeinsteinHalperin, Siegle and WeinsteinConcepts Democracy: “Governance systems in
which national leaders are selected through free and fair elections, there are institutions that foster a shared distribution of power, and citizens have extensive opportunities to participate in political life.”pp p p p
Polity IV democracy index
Norris 35
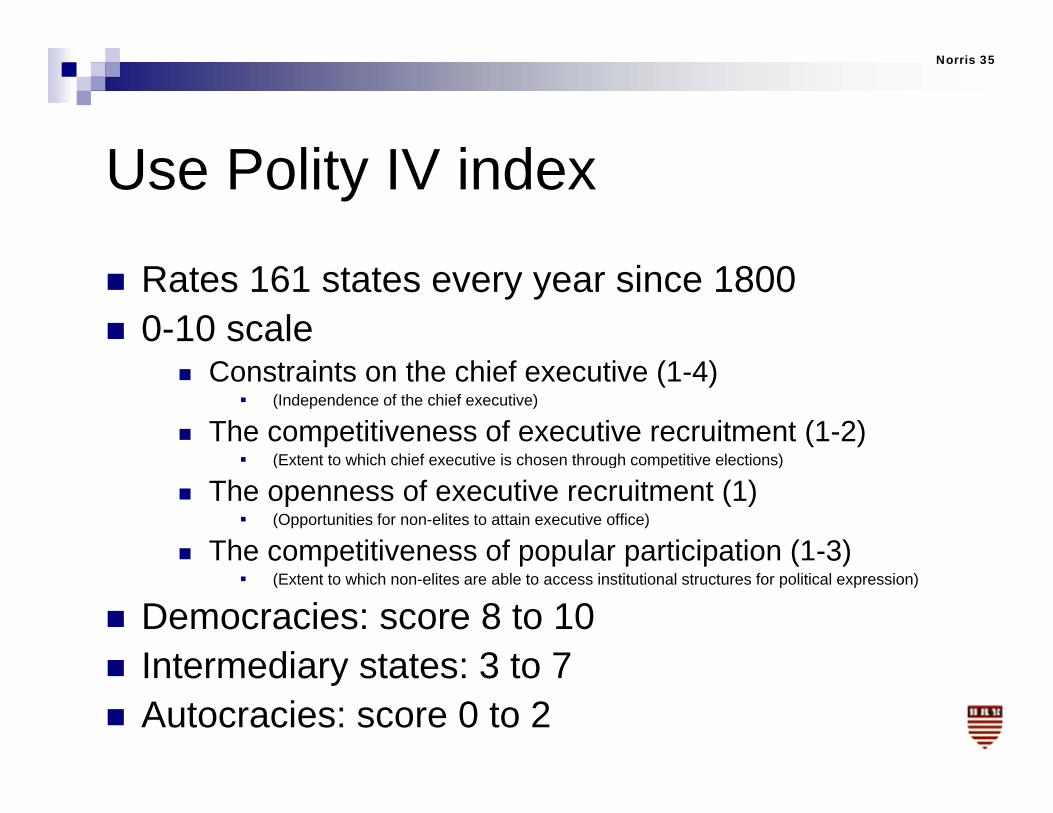
U P lit IV i dUse Polity IV index
Rates 161 states every year since 1800 0-10 scale
Constraints on the chief executive (1-4) (Independence of the chief executive)
The competitiveness of executive recruitment (1-2) (Extent to which chief executive is chosen through competitive elections) (Extent to which chief executive is chosen through competitive elections)
The openness of executive recruitment (1) (Opportunities for non-elites to attain executive office)
The competitiveness of popular participation (1-3)e co pet t e ess o popu a pa t c pat o ( 3) (Extent to which non-elites are able to access institutional structures for political expression)
Democracies: score 8 to 10 Intermediary states: 3 to 7 Intermediary states: 3 to 7 Autocracies: score 0 to 2

Norris 36
Norris 37
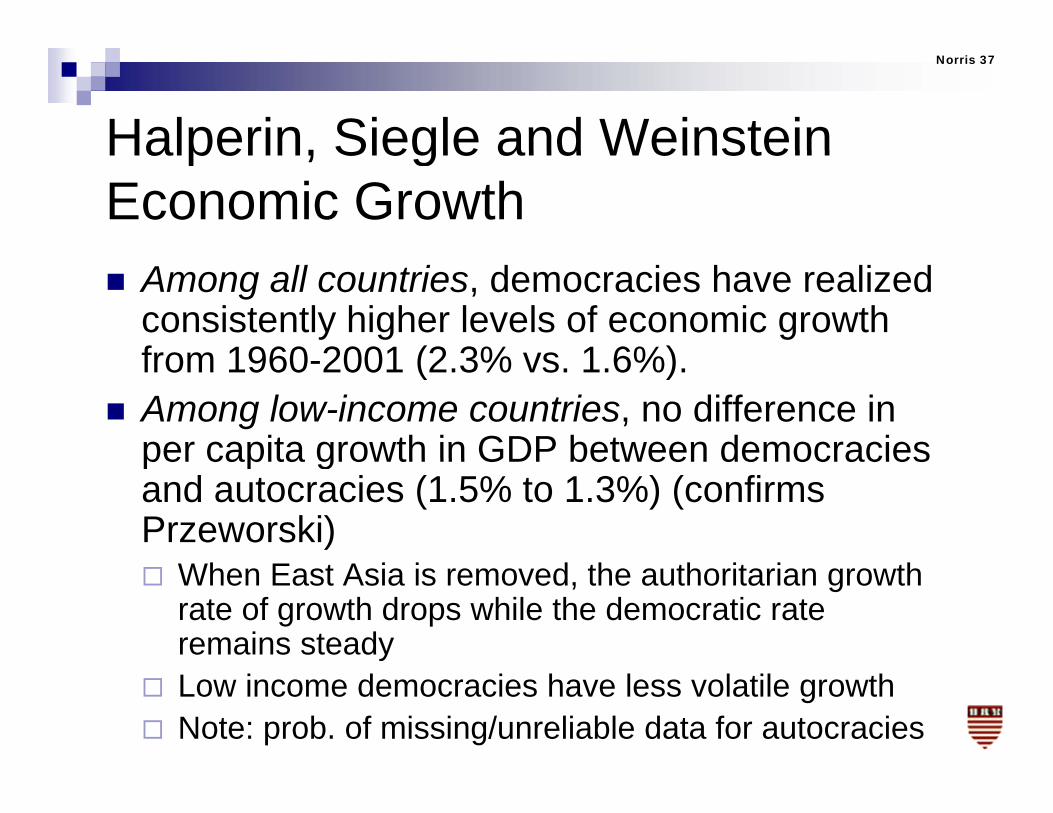
Halperin, Siegle and WeinsteinHalperin, Siegle and WeinsteinEconomic Growth Among all countries, democracies have realized
consistently higher levels of economic growth from 1960 2001 (2 3% vs 1 6%)from 1960-2001 (2.3% vs. 1.6%).
Among low-income countries, no difference in per capita growth in GDP between democraciesper capita growth in GDP between democracies and autocracies (1.5% to 1.3%) (confirms Przeworski) When East Asia is removed, the authoritarian growth
rate of growth drops while the democratic rate remains steady
Low income democracies have less volatile growth Note: prob. of missing/unreliable data for autocracies
Norris 38
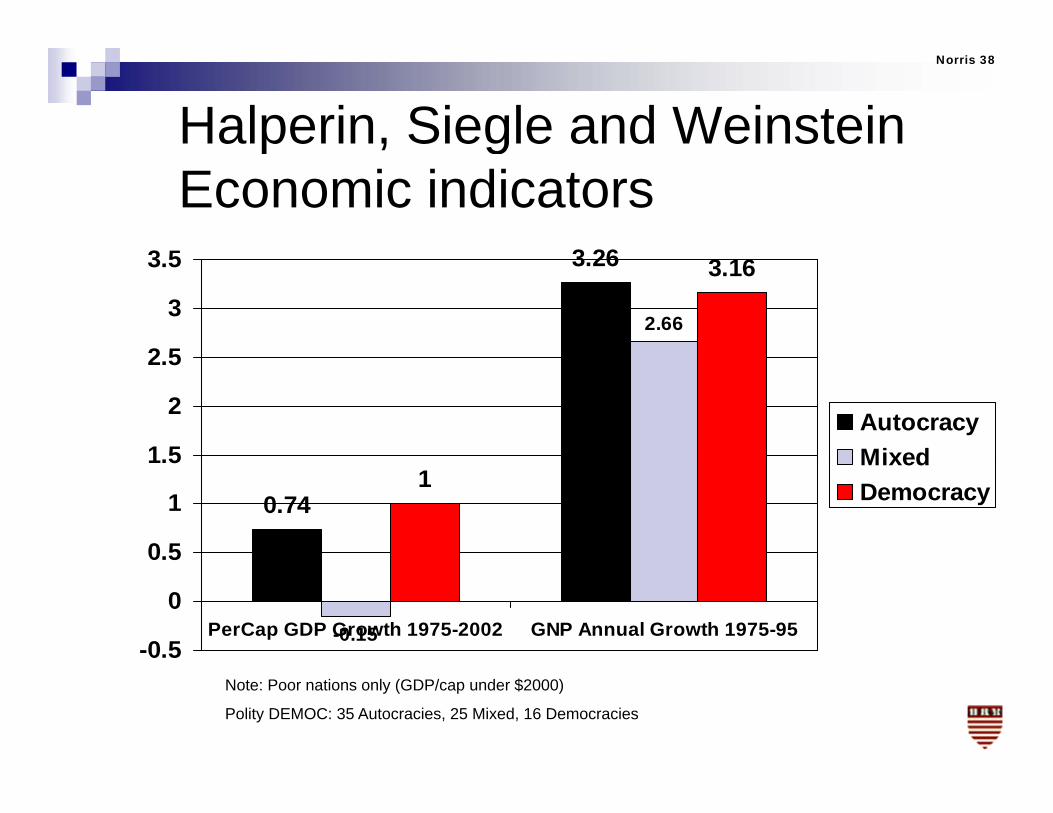
Halperin, Siegle and Weinsteinp , gEconomic indicators
3 263 5 3.26
2.66
3.16
2 5
3
3.5
1 5
2
2.5
AutocracyMixed
0.741
0.5
1
1.5 MixedDemocracy
-0.15-0.5
0PerCap GDP Growth 1975-2002 GNP Annual Growth 1975-95
Note: Poor nations only (GDP/cap under $2000)
Polity DEMOC: 35 Autocracies, 25 Mixed, 16 Democracies
Norris 39
Halperin, Siegle and WeinsteinHalperin, Siegle and WeinsteinEast Asian exceptionalism? What of S. Korea, Taiwan, Singapore,
Vietnam, Indonesia and China? Rapid growth under autocracies. Exceptions. Why?
P it f k t i Pursuit of market economics Access to capital markets Constraints on leaders Constraints on leaders Relative social equality Openness to Western markets Security interests
Also failures (Burma, Cambodia, N. Korea)

Norris 40
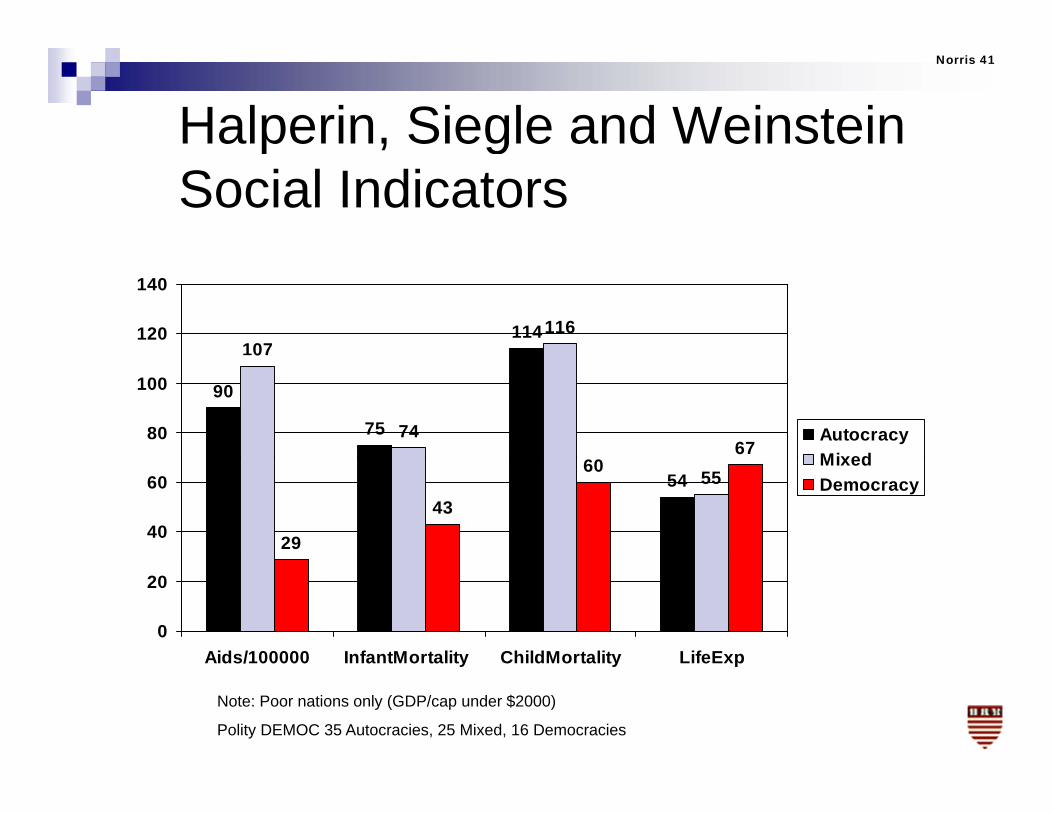
Halperin, Siegle and WeinsteinHalperin, Siegle and WeinsteinSocial indicators On average, low income democracies
consistently have superior levels of welfare across various measures of human developmentacross various measures of human development
Life expectancy Secondary school enrollment Agricultural production Childhood mortality HDI HDI
Growing divergence in recent decades Due to greater effectiveness NOT higher welfareDue to greater effectiveness NOT higher welfare
spending (eg education)
Norris 41
Halperin, Siegle and Weinsteinp , gSocial Indicators
114107
116120
140
90
75
0
7467
80
100
AutocracyMixed
54 55
29
43
60
40
60MixedDemocracy
0
20
Aids/100000 InfantMortality ChildMortality LifeExpAids/100000 InfantMortality ChildMortality LifeExp
Note: Poor nations only (GDP/cap under $2000)
Polity DEMOC 35 Autocracies, 25 Mixed, 16 Democracies

Norris 42
Halperin, Siegle and Weinsteinp , gSocial Indicators
114107
116120
140
90
75
0
7467
80
100
AutocracyMixed
54 55
29
43
60
40
60MixedDemocracy
0
20
Aids/100000 InfantMortality ChildMortality LifeExpAids/100000 InfantMortality ChildMortality LifeExp
Note: Poor nations only (GDP/cap under $2000)
Polity DEMOC 35 Autocracies, 25 Mixed, 16 Democracies

Norris 43
Halperin, Siegle and Weinsteinp , gGovernment expenditure
24.522.925
30
20.2
9
15
20
AutocracyMixed
4 2
9.7 10.5
4 1
10
15 MixedDemocracy
4.22.73.5
24.1
1.63.2
0
5
Central Govnt Educ Military Aid rec'dCentral Govnt Educ Military Aid rec d
Spending & aid as % GDP.
Poor nations only (GDP/cap under $2000)
Polity DEMOC 35 Autocracies, 25 Mixed, 16 Democracies

Norris 44
Wh ? Pl ibl ?Why? Plausible reasons?
Democratic leaders incentives to respond to social needsCh k d b l Checks and balances
Open flow of informationL ti Less corruption
Adaptability and smooth succession Commitment to rule of law Commitment to rule of law Feedback learning, trial-and-error
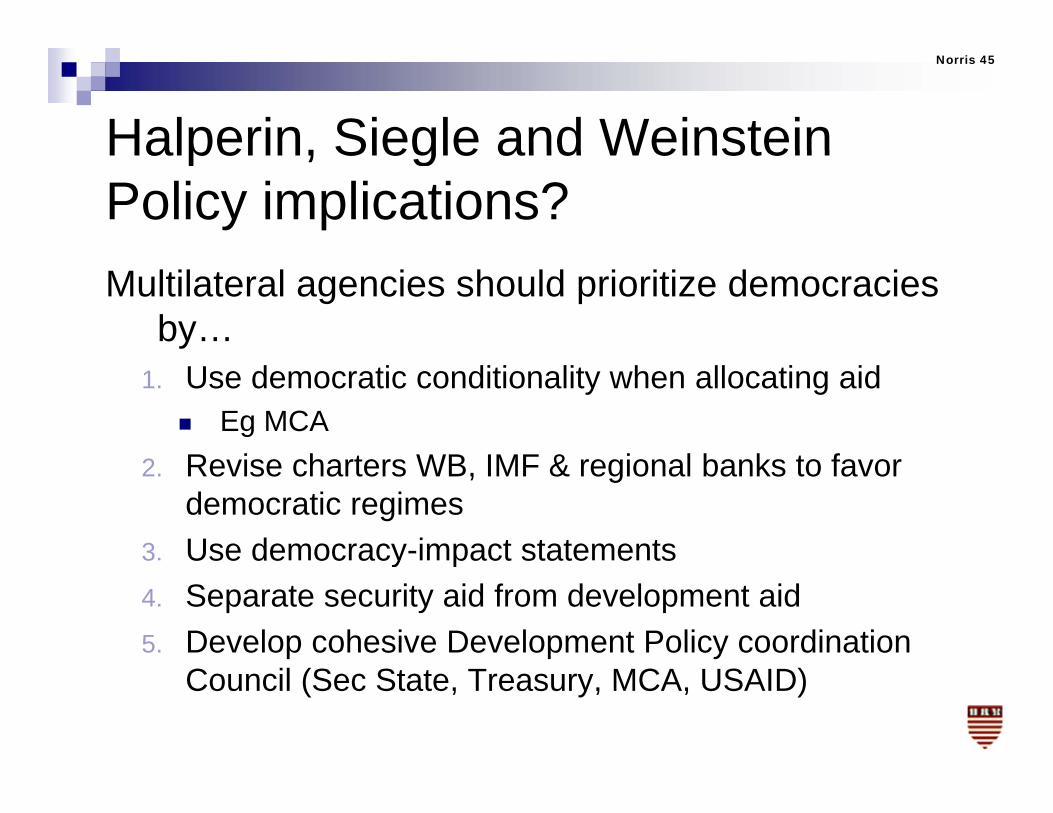
Norris 45
Halperin, Siegle and WeinsteinHalperin, Siegle and WeinsteinPolicy implications?Multilateral agencies should prioritize democracies
by…1. Use democratic conditionality when allocating aid
Eg MCA2 R i h t WB IMF & i l b k t f2. Revise charters WB, IMF & regional banks to favor
democratic regimes3. Use democracy-impact statements3 Use de oc acy pact state e ts4. Separate security aid from development aid5. Develop cohesive Development Policy coordination
Council (Sec State, Treasury, MCA, USAID)

Norris 46
IV. What are the policy implications?

Norris 47
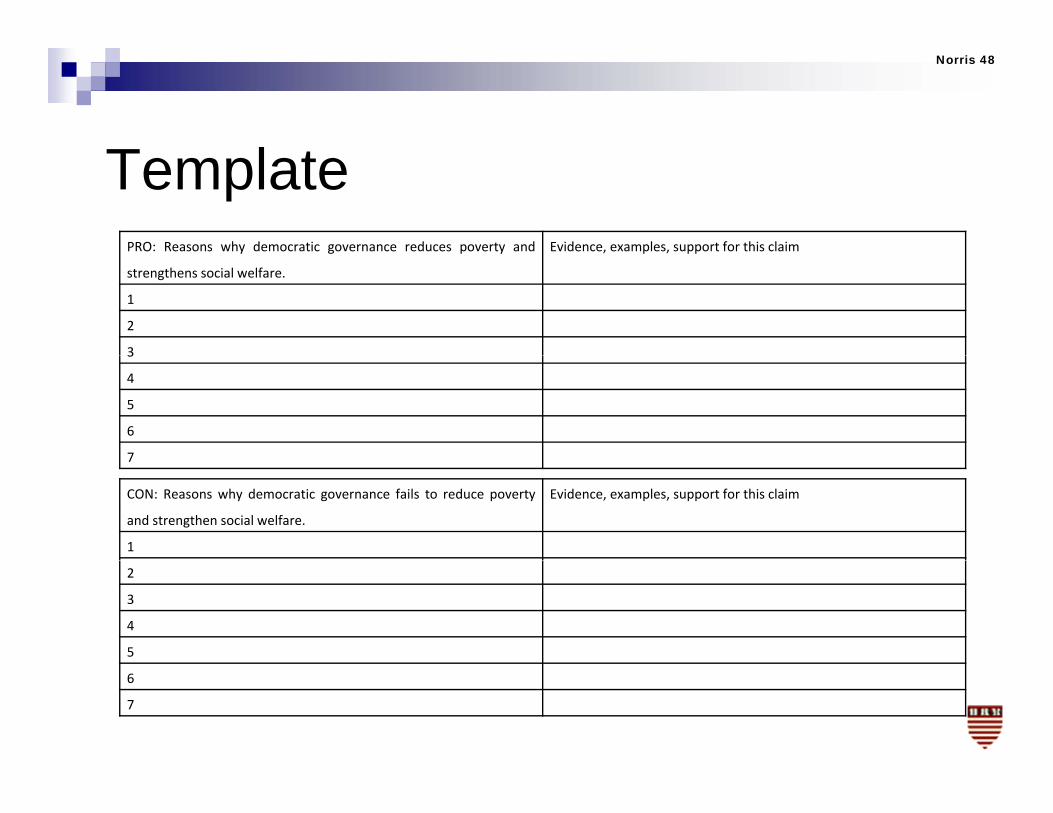
Ad d b tAdvocacy debate: You are asked to break up into discussion pairs. You have 15 minutes allocated for the paired discussions. You are asked to draw upon the readings for this class and your
own arguments and experience. For policy advocacy, you should either argue for or against the
proposition that democratic governance reduces poverty and improves welfare.
Give a series of reasons, ranked in importance using the template overleaf, supported by evidence or case illustrations wherever possible.
After 15 minutes, we will compare the reasons for or against the proposition in plenary, to see if a consensus emerges.
Norris 48
T l tTemplatePRO: Reasons why democratic governance reduces poverty and Evidence, examples, support for this claimy g p y
strengthens social welfare.
, p , pp
1
2
33
4
5
6
77
CON: Reasons why democratic governance fails to reduce poverty
and strengthen social welfare.
Evidence, examples, support for this claim
1
2
3
4
5
6
7
Norris 49
Next classDoes democracy leadDoes democracy lead to a peace dividend?pClass Materials: www.pippanorris.com