the impact of e-commerce on direct selling companies
TRANSCRIPT
California State University, San Bernardino California State University, San Bernardino
CSUSB ScholarWorks CSUSB ScholarWorks
Theses Digitization Project John M. Pfau Library
2001
The impact of E-commerce on direct selling companies The impact of E-commerce on direct selling companies
Shu-Fen Ida Hsu
Follow this and additional works at: https://scholarworks.lib.csusb.edu/etd-project
Part of the E-Commerce Commons
Recommended Citation Recommended Citation Hsu, Shu-Fen Ida, "The impact of E-commerce on direct selling companies" (2001). Theses Digitization Project. 3030. https://scholarworks.lib.csusb.edu/etd-project/3030
This Thesis is brought to you for free and open access by the John M. Pfau Library at CSUSB ScholarWorks. It has been accepted for inclusion in Theses Digitization Project by an authorized administrator of CSUSB ScholarWorks. For more information, please contact [email protected].
THE IMPACT OF E-COMMERCE ON DIRECT SELLING COMPANIES
A Thesis
Presented to the
Faculty of
California State University,
San Bernardino
In Partial Fulfillment
of the Requirements for the Degree
Master of Arts
in
Interdisciplinary Studies
by'
Shu-Fen Ida Hsu
June 2001
THE IMPACT OF E-COMMERCE ON DIRECT SELLING COMPANIES
A Thesis
Presented to the
Faculty ofCalifornia State University,
San Bernardino
byShu-Fen Ida Hsu
June 2001
Approved by:
Kevin/Lamude, Chair, Communication Studies Dare
Donna Simmons, Communication Studies
Nabil Razzouk, Marketing

© 2001 Shu-Fen Ida Hsu
ABSTRACT
•In the United States, direct selling is a major
distribution channel for products and services. In the
direct selling business, products or services are sold
directly to the distributors. In addition, the
distributors themselves are customers. Due to the rapid
development of social structure, there are a variety of
products and services sold through the direct selling
business model.
Due to the improvement of Information Technology,
Electronic Commerce is also growing rapidly around the
world. Shopping on line trough the Internet has become a
new marketing distribution channel and a new business
trading model for most industries and customers. For
example, the direct selling company, Amway, continues to
explore its E-commerce business in well-established
markets.
Business on the Internet has not grown enough for
enterprisers and consumers. E-commerce issues have become
very popular for both industries and customers.
Therefore, this study looks at the impact of
E-commerce on direct selling companies. In addition, the
study will also examine how the direct selling companies
react to the effects of E-commerce business. A
iii
questionnaire was distributed to the members of the Direct
Selling Association as respondents.
The major results are as follows:
1. Most direct selling companies will or have used
E-commerce tools such as e-mail or a website to
communicate with their distributors and
customers.
2. The distributors would like to use e-mail and
websites rather than traditional communications.
3. The direct selling companies' attitudes toward
using E-commerce is generally positive; and they
will develop their E-commerce businesses do
their distributors can purchase online. However,
E-commerce business will not replace the direct
selling business model. Most of the respondents
answered that they will still use the
traditional direct selling business model; only
a part of business will be replaced by the
E-commerce business model.
4. Most direct selling companies are willing to
invest in developing both E-commerce services
and E-commerce technology.
iv

ACKNOWLEDGMENTS
I am grateful and glad to acknowledge Dr. Donna
Simmons and Dr. Kevin Lamude in the Communication Studies
Department and Dr. Nabil Razzouk in the Marketing
Department for their helpful suggestions for improvements
They have always been helpful and courteous.
In addition, I would also like to thank to my
boyfriend, Changting, for giving me support and encourage
at various moments along the way.
v
TABLE OF CONTENTS
ABSTRACT...................-...................... ....................................................................... iii
ACKNOWLEDGMENTS ............................................. ................................................ v
LIST OF TABLES................................................................................................. viii
LIST OF FIGURES............. ............................ .................................................... x
CHAPTER ONE: BACKGROUND
Introduction .......................................................................................... 1
Problem Statement ............................................................................. 3
Research Purposes ............................................................................. 3
Research Objects............................................... •.............................. 4
Results Summary .................................................................................. 4
Key Words.................................................................................. .. 5
CHAPTER TWO: REVIEW OF THE LITERATURE
Introduction .......................................................................................... 7
History of the Direct Selling Industry ......................... 7
Electronic-Commerce Business Umpact ................................. 15
Outlook of Online Usage......................................................... 28
Discussion of Consumers' Purchasing Behaviors Theory....................................................... .. ............................................... 31
Model of Situational Determinants ofConsumer Behavior ............................................................... 32
The Direct Selling Customers' Purchasing Behavior Model ........................................................................ 33
Conclusion............................................................................................... 35
CHAPTER THREE: METHODOLOGY
Purpose of the Study..................................................................... 37
vi
Hypotheses............................................................................................... 38
Questionnaire Design ..................................................................... 39
Respondents............................................................................................ 41
Procedures............................................................................................... 41
Data Entry and Analysis............................................................. 43
CHAPTER FOUR: RESULTS
Respondents' Profile ..................................................................... 45
The Use of the E-commerce Tools (Websites,e-mail, the Internet) .................................................................. 54
Opinions About the Use of E-commerceSolution.................................................................................................... 63
Opinions Regarding the Future Impacts of E-commerce Aspects .......................................................................... 69
Conclusion............................................................................................... 85
CHAPTER FIVE: CONCLUSIONS
Summary of the Results............................................................... 86
Summary of the Hypotheses Testing .................................. 89
Implications and Applications for the Direct Selling Companies Regarding the Impacts of E-commerce............................................................................................... 91
Limitations............................................................................................ 94
APPENDIX A: COMPANIES QUESTIONNAIRE ............................................. 95
APPENDIX B: CROSS TABULATION ................................................................ 100
REFERENCES............................................................................................................... 150
vii
LIST OF TABLES
Table 1. Internet Usage..................................................................................29
Table 2. Types of Sales Dollars Generates ............................... 46
Table 3. Sales/Marketing Strategies ............................................... 47
Table 4. Product Describes.......................................................................... 48
Table 5. Number of Companies Distributors ............................... 54
Table 6. E-mail Used to Communicate withDistributors ..................................................................................... 55
Table 7. Distributors Prefer to Use E-mail.................................57
Table 8. E-mail Reduce Other Communications Mediums ... 58
Table 9. Does Your Business Have A Web Site.............................. 58
Table 10. Usage of Your Web Site by Distributors .............. 60
Table 11. Development of New Customers........................................ 61
Table 12 . Company with an E-commerce Solution...................... 62
Table 13. Important Reason for Using E-commerceBusiness............................................................................................ 64
Table 14. E-commerce Business and Business Plan ................ 65
Table 15. Attitude Toward the use of E-commerce ................ 66
Table 16. Distributors Purchase Your ProductsOnline.................................................................................................. 67
Table 17 . Influenced by Your Web Site........................................... 68
Table 18. Overall Spending on Marketing..................................... 69
Table 19. Marketing E-commerce Services ..................................... 70
Table 20. Marketing Conventional Service Other ThanE-commerce....................................................................................... 71
Table 21. Marketing Over the Internet...........................................72
Table 22. Marketing via Conventional Media ............................. 73
viii
Table 23. Overall Investment.....................................................................74
Table 24. Investment in E-commerce Activities ..................... 75
Table 25. Investment in Conventional Activities ............... 76
Table 26. Range of Goods/Services You Offer.............................77
Table 27. Unit Cost of Providing Goods/Services ............... 78
Table 28. Price Charged to Customers forGoods/Services ............................................................................. 79
Table 29. Profit Margin....................................... ....................................... 80
Table 30. Important Attraction Using E-commerce ................ 81
Table 31. Disadvantage or Obstacle Using E-commerce ... 82
Table 32. Replacing Direct Selling with E-commerceBusiness Model ............................................................................. 83
Table 33. Distributors Purchase Your ProductsOnline.................................................... . ........................................... 8 4
Table 34. Apply to Become Distributor via theInternet............................................................................................ 85
ix
LIST OF FIGURES
Figure 1. A Model of Store Choice............................................. .. 31
Figure 2. Situational Variables and ConsumerBehavior................................................................................................32
Figure 3. Customers' Purchasing Behavior Model .................... 33
Figure 4. New Direct Selling Company Decision-MakingBusiness Model ............................................................................. 92
x
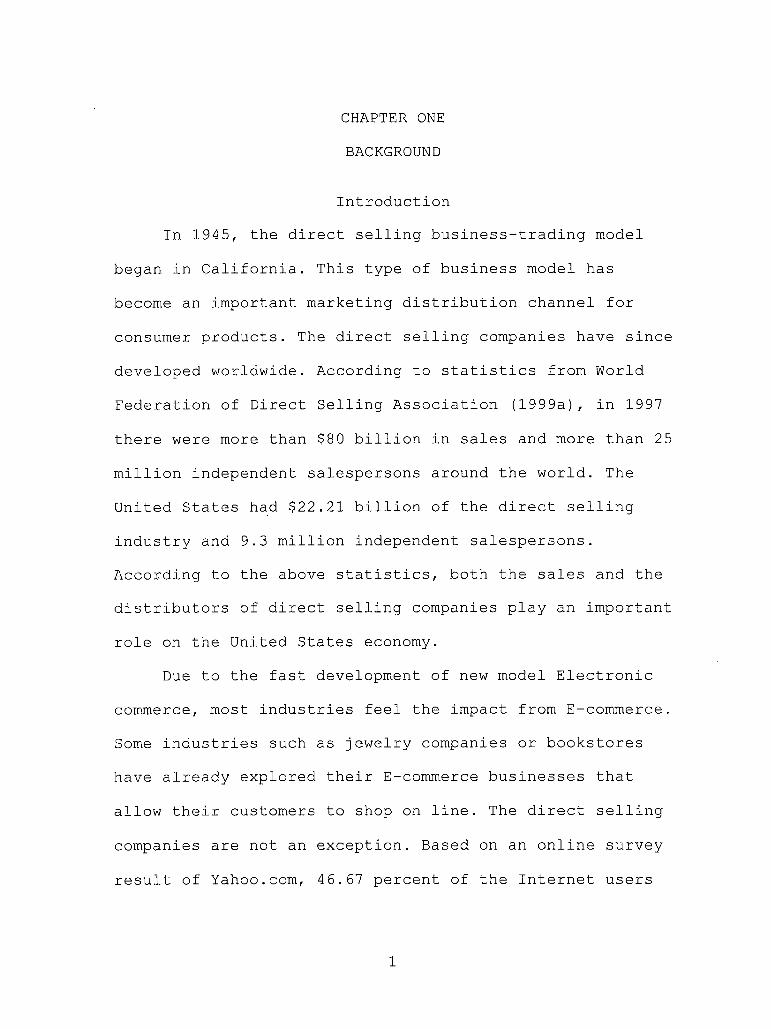
CHAPTER ONE
BACKGROUND
Introduction
In 1945, the direct selling business-trading model
began in California. This type of business model has
become an important marketing distribution channel for
consumer products. The direct selling companies have since
developed worldwide. According to statistics from World
Federation of Direct Selling Association (1999a), in 1997
there were more than $80 billion in sales and more than 25
million independent salespersons around the world. The
United States had $22.21 billion of the direct selling
industry and 9.3 million independent salespersons.
According to the above statistics, both the sales and the
distributors of direct selling companies play an important
role on the United States economy.
Due to the fast development of new model Electronic
commerce, most industries feel the impact from E-commerce.
Some industries such as jewelry companies or bookstores
have already explored their E-commerce businesses that
allow their customers to shop on line. The direct selling
companies are not an exception. Based on an online survey
result of Yahoo.com, 46.67 percent of the Internet users
1
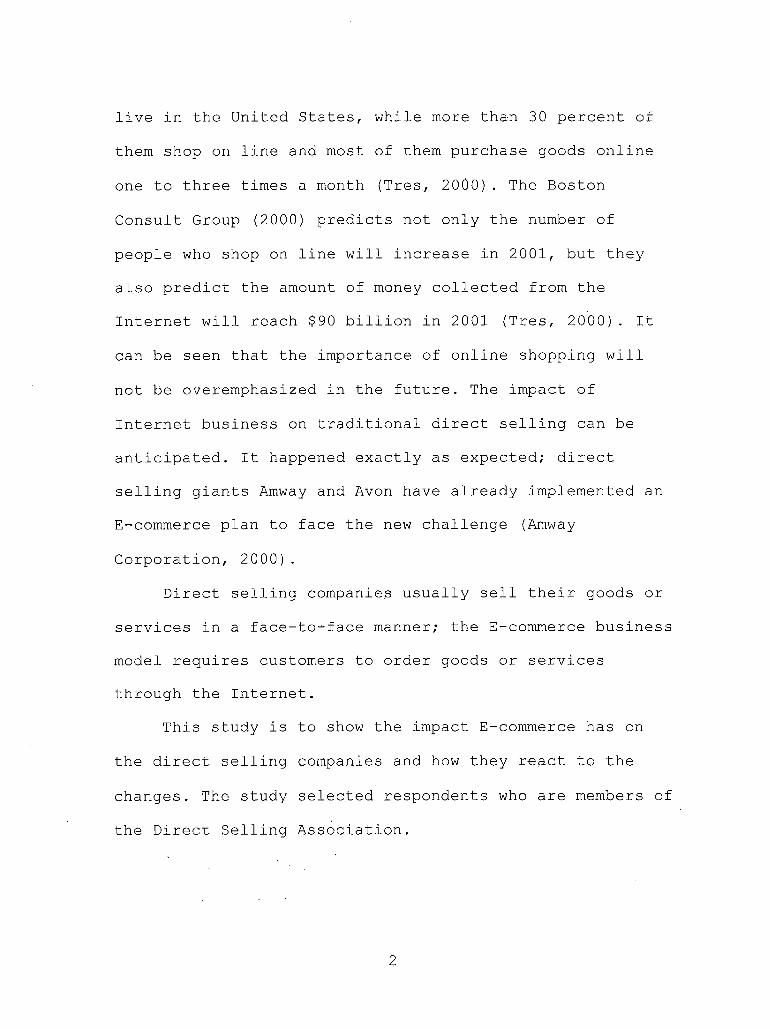
live in the United States, while more than 30 percent of
them shop on line and most of them purchase goods online
one to three times a month (Tres, 2000). The Boston
Consult Group (2000) predicts not only the number of
people who shop on line will increase in 2001, but they
also predict the amount of money collected from the
Internet will reach $90 billion in 2001 (Tres, 2000). It
can be seen that the importance of online shopping will
not be overemphasized in the future. The impact of
Internet business on traditional direct selling can be
anticipated. It happened exactly as expected; direct
selling giants Amway and Avon have already implemented an
E-commerce plan to face the new challenge (Amway
Corporation, 2000).
Direct selling companies usually sell their goods or
services in a face-to-face manner; the E-commerce business
model requires customers to order goods or services
through the Internet.
This study is to show the impact E-commerce has on
the direct selling companies and how they react to the
changes. The study selected respondents who are members of
the Direct Selling Association.
2
Problem Statement
Due to the sprouting population of the Internet in
recent years, more and more companies transformed their
original business models to the new business model, the
electronic-commerce business model. These companies can be
used as examples to show how to deal with the impacts of
E-commerce. The discussions about the impacts of
E-commerce on the direct selling industry are not yet
fully discussed. The direct selling companies, with so
many distributors and global businesses, are facing the
impacts of E-commerce in the near future. The study is
expected to help companies understand the circumstances
and differences of direct selling.
Research Purposes
As mentioned above, this study aims at the impacts of
E-commerce on the direct selling companies. A
guestionnaire was distributed to the respondents asking
them to answer the following questions:
1. How do the companies use E-commerce tools such
as e-mail or websites and the traditional
communications?
3
2. How do the companies' distributors and customers
use their e-mail or websites and the traditional
communications ?
3. What is the companies' attitudes toward using
E-commerce?
4. How do the companies see the E-commerce
impacting different aspects of their business?
(Marketing, Investment, or others)
Research Objects
The purpose of the study is to discover how the
different aspects of E-commerce such as marketing,
investment, or others, impact the direct selling
companies. The study also involved the attitudes of the
respondents toward the E-commerce business model. The
study results and conclusion will be able to offer
reference data for either the direct selling companies or
other related industries that intend to develop E-commerce
or online business as another marketing strategy
Results Summary
The major results are as follows:
1. Most direct selling companies will or have used
E-commerce tools such as e-mail or a website to
4
communicate with their distributors and
customers.
2. The distributors would like to use e-mail and
websites.
3. The direct, selling companies' attitude toward
using E-commerce is generally positive; and they
will develop their E-commerce businesses so
their distributors can purchase online.
E-commerce business will not replace the direct
selling business model. Most of the respondents
answered that they will still use the
traditional direct selling business model; only
a part of their business will be replaced by the
E-commerce business model.
4. Most direct selling companies are willing to
invest in developing both E-commerce services
and E-commerce technology.
Key Words
• The direct selling business model - Direct
selling is a dynamic, vibrant, rapidly expanding
channel of distribution for the marketing of
products and services directly to consumers
5
(World Federation of Direct Selling Association,
2000)
• Electronic commerce - Doing business online,typically via the Web. It is also called
E-business, e-tailing and I-commerce. (The
Computer Language Company Inc, 2000)
• Impacts - the effect or influence that an event,
situation etc has on someone or something
(Longman Dictionary, 1995)
6
CHAPTER TWO
REVIEW OF THE LITERATURE
Introduction
Literature review is divided into four major
sections: the history of the direct selling industry,
electronic-commerce business impact, the outlook of online
usage, and discussion of consumers and purchasing
behaviors theory.
The history of the direct selling industry will
detail the definition of the direct selling business, the
structure of the direct selling business model, provide
survey results about the industry trend, and cite some
examples of the direct selling companies to see how they
face the impacts of E-commerce.
History of the Direct Selling Industry
The direct selling business model began operation by
Mytinger and Casselberry in California in 1945
(Kobagashi,1989). They developed a marketing strategy for
a nutrition food company. The marketing strategy offered
the basic business model of current direct selling
distribution process and distributors system. From 1960 to
the present more and more companies are using the direct
7
selling business model to promote their products and
services (Direct Selling Association, 2000) .
Direct selling is defined by the Direct Selling
Association (2000) as the marketing of products and
services directly to1consumers in a face to face manner,
generally in their homes or the homes of others, at
workplace and other places away from permanent retail
locations. Direct selling can be done by anyone who is
willing to pay the basic start-up cost. The entry fee is
typically very low and the salesperson may be required to
purchase a sales kit or join a particular training
program. There are no gender, education, ethnic, or
previous work experience requirements. The direct selling
industry allows a person to own his/her business without
the typical costs and requirements of most other types of
businesses.
Two major approaches are used in the direct selling
industry. With the direct selling business model, products
are sold either by group presentations (i.e. party plan)
or person-to-person (i.e.. one-to-one) . The Direct Selling
Association (2000) describes these approaches. In a Party
plan approach, the direct salesperson demonstrates
products to a group of guests, invited by a host in whose
home or other location the direct selling demonstration
takes place. By contrast, other direct sellers will often
explain and demonstrate the products they offer to
consumers in the comfort of the consumers' homes, at a
time which is convenient for them.
Direct selling provides a channel of distribution for
the products, Customers select products through personal
demonstration and explanation. The products come to them
though direct selling compared to the customers going to
retail stores. Customers also get home delivery and
satisfaction guarantees. Personal demonstration is a key
to the success of the direct selling industry.
A major structure of the direct selling industry is
called MLM system [Multilevel marketing] (World Federation
of Direct Selling Association, 1999). Multilevel marketing
is a very important, component of the direct selling
industry. It is also referred to as network marketing,
structure marketing, or multilevel direct selling by The
World Federation of Direct Selling Association (1999) . MLM
is one of a variety of methods, such as direct selling or
pyramid schemes of organizing and compensating salespeople
in a direct selling business. The salesperson receives
compensation in two ways. One is from personally selling
goods and services to consumers. They are often identified
in the initial parties or individual demonstration, but
9
choose not to join the distribution network. People who
are shown the plan who do not join it may become retail
customers of the distributor. The other compensation is
from sales made by those persons they have personally
recruited or sponsored into the plan. The sponsor of a
distributor receives a percentage of the sales of the
distributors he or she has sponsored. The company, not the
distributors, usually pays this percentage. The company
earns money by selling products through the people they
recruit. Distributors get commissions on their own sales
and on the sales made by their recruits.
The multilevel marketing system offers opportunities
to make up a deficiency in the employment market.
Housewives, students, and others who do not have full-time
jobs are more able to become MLM distributors. There are
two reasons for the attraction and success of MLM. First,
the system offers people a flexible means, to supplement
their income. Second, it allows businesses with unique or
innovative products or services to bring them to the
market without the enormous expense of mass media
advertising, or having to compete for shelf space in
retail stores.
To sell products or services, distributors focus on
making friends. Multilevel marketing is a word-of-mouth
10
business based on attracting- consumers to be its members.
The most important characteristic of multilevel marketing
is member education. Many effective education programs
such as DMP (Development Motivation Program), AIA
(Adventure In Attitude), and SMI (Self-Motivation4
Institute) are used in MLM to attract new members and
reinforce old member confidence. (Kobagashi, 1989)
These development motivation programs are presented
by using video types or transparencies. The purpose of the
program is to make the attendees have the feeling of
participation and willingness to join the system.
MLMs should pay commissions for the retail sales of
goods or services, but not for recruiting new
distributors. This kind of business model should follow
the Franchise Rule. Franchise Rule means compliance with
the Rule's requirements about disclosing the number and
percentage of existing franchisees that have achieved the
claimed results, as well as cautionary language.
On the contrary, pyramid schemes, one form of
multilevel marketing, are described by the World
Federation of Direct Selling Association (1999) as knowing
that the commissions to its distributors come only from
recruiting new distributors. According to the Direct
Selling Association, pyramid schemes are illegal because
11
of the defective business structure. Once no new
distributors can be recruited, the company would collapse
immediately. Still, Direct Selling Association survey'
results, the outlook of the direct selling industry is
cle^ar and positive.
The growth of direct selling is increasing quickly
with the development of communication technology. More
than 50 direct selling companies use the direct selling
business model. According to the Direct Selling Growth and
Outlook Survey published by the Direct Selling Association
(2000) in 1999, the direct selling industry was
responsible for $24.54 billion in business through the
activities of more than 10.3 million independent
salespersons. This $24.54 billion is over a quarter of the
worldwide retail sales by the direct selling industry of
$80 billion. More than 25 million independent salespersons
operate in direct selling worldwide. The United States is
one of the most important markets for the direct selling
industry in the world.
Based on the same survey by the Direct Selling
Association, the major products sold through direct sales
are home/family care products (33%), personal care
products (24.9%), and services/miscellaneous (17.9 ).
Sixty-six point six percent of the independent
12
salespersons sell products in the home. And 79.9 percent
of these products are sold face-to-face.
The Direct Selling Association (2000) National
Salesforce Survey shows that the typical direct selling
representative has the following characteristics:
1. 43-year-old Caucasian woman who is married, and
has completed some college courses,
2. Uses English as the primary language in their
home,
3. Average annual gross income before taxes from
direct selling activities is $12,000,
4. Most of them sell beauty, grooming and personal
care products (31%),
5. More than half of those interviewed dedicate
less than 10 hours per week to their direct
selling businesses,
6. 80 percent of direct selling still occurs in a
home setting, whether it is the salesperson's
home or the customers' home,
7. The main reason for becoming' a direct sales
representative is additional income,
8. Three-guarters of those surveyed indicate that
one-on-one selling is the .primary method used to
sell a product or service, while party plan
13
selling was mentioned as the primary method by
15 percent of the respondents. And 10.0 percent
of those surveyed said that customers direct
order was the primary way to sell products and
services.
Some examples will be cited in the following to show
how these direct selling companies face the impacts of
E-commerce.
According to the Direct Selling Association (2000)
National Salesforce Survey, 10 percent of the respondents
said that a customer direct order was the major method to
sell a product or service. In contrast in the survey in
1998, only 1.6 percent of the respondents said customer's
direct order were the primary way to sell products or
services. In short, the increase of customers direct order
has significantly increased in the direct selling
industry.
Some direct selling companies have common consensus
to modify their current marketing strategies. The most
significant way is to change or increase their current
distribution channels. For example, some direct selling
companies such as Tupperware Corporation recently
announced its new E-commerce website to keep up with the
new E-commerce trend. The president of Tupperware LJ.S.,
14
we areBetty Pale, identified Tupperware's goal, "
committed to defining the direct selling industry in the
21st century to the same degree we helped define in the
20th century (Conlin, 2000)
Besides, she continued, "Our party-plan platform
remains our core selling method. The Internet, our mail
kiosk program and the new venture with Home Shopping
Network are part of our integrated direct access
strategy." Tupperware still faces the problem of how much
online sales will hurt the company's approximately 950,000
worldwide independent salespeople. To solve the problem,
the company hopes to create a database of its distributor
locations and allow people to punch in a zip code and find
their closest distributor (Conlin, 2000) .
Electronic-Commerce Business Impact
In this section, E-commerce information and aspects
will be discussed. The section includes the discussion of
the impact of E-commerce on organizations, the trend of
future E-commerce business model, and how the use of
E-commerce business changes advertising tools and customer
relationship management (CRM), and a related discussion
about channel conflict theory.
15
It is clear that the Internet plays a starring role
in business today. Customers can shop online everywhere,
anytime, with just the click of a mouse.
Electronic-business has an advantage over retail
because it can handle the huge variances in customers'
demands. J. T. Chambers, President and Chief Executive
Officer of CISCO Systems, Inc and other executive members
of CISCO Systems created what they called the Network
Effect theory. They believed that there was a direct
correlation between the strength of the current E-commerce
economy and the current unprecedented productivity gains
in the world. The Network Effect suggests that using
Internet technology to re-engineer business processes can
help a company to gain competitive advantage by quickly
detecting and responding to situations such as real-time
changes in customer demand. The Internet Revolution has
the potential to unite everyone by combining the strength
of the Internet and education. Through Internet
technology, a company can get more information about its
customers and develop its own database marketing by
accessing the Internet. The customers can get more
information through accessing the company's own website.
In this way, the way to communicate with the company and
16
the customers might change because of the technology of
the Internet.
"Ongoing success is highly dependent on a company's
ability to provide sustained performance" (BusinessWeek,
2000, p. 28). According to Intira's netsourcing solutions,
Global 1000 corporations and dotcoms want new-and-improved
options for harnessing and leveraging the power of the
Internet. Most companies not only want to expand their
business into the Internet, but they also want to improve
their ability to compete the Internet.
E-commerce business moves business from the corner
store to the online store, from the concrete store to the
virtual store. It means that moving from a
bricks-and-mortar retailer to an equally clicks-and-mortar
strategy is a brand new idea for many traditional
industries. The amazing interest for the companies is that
the company can do business with anyone in the world
without a retail store. Studies from the University of
Texas and the U.S. Department of Commerce predict that
E-commerce will comprise only 4.4 percent of the U.S.
gross domestic product-by 2002. Still, E-commerce will
play a more and more_important role in the U.S. economy in
the near future.
17
Another E-commerce concept is the business from just-
in-time to real time. That means companies implement a
virtual supply-chain system of their business. More and
more companies take, the advantage of Internet to create
electronic marketplaces where customers, suppliers, and
business partners collaborate with real-time results.
Customers can order goods, get an immediate response, and
search any information about the company or the goods and
services anytime through Internet and e-mail. The. company
also can understand what the customers need and deal with
the customers direct order anytime through Internet. In
this way, the Internet and E-commerce provide fast -
communication between customers and the E-commerce
companies.
With the development of E-commerce, a company that
would like to transform the bricks-and-mortar organization
into an E-commerce organization does not just establish a
website and begin its online business. It should rethink
its entire business from the inside out and make
investments in an Internet technology portfolio to get the
best return. (E-commerce Times: break news [on line] 1999)
Transferring to an E-commerce business model impacts
groups across the entire organization, changing the way-
companies work internally and how they work with their
18
customers, partners, suppliers, and employees. If a
company wants to start its E-commerce business, it should
think about how to deal with its internal organization
structure first. A study from CISCO Systems Inc in the
future suggests that a business not on the Internet will
not be in business (Cisco System, 2000).
E-commerce also offers a vehicle for education. This
Internet education is called e-learning. The direct
selling industry, which spends a significant amount of
resources on education and training distributors, use
e-learning to train their distributors online anywhere,
anytime. The direct selling industry also can educate
their customers and reply to their customers' questions
online. It is a faster way to satisfy their customers. A
study to measure the effectiveness of a Virtual University
is to train a sales group on the new e-learning system and
traditional system. The study shows that the e-learning
system makes distributors first sale 25 percent faster
than the traditional group who do not participate in the
e-learning training (Macaluso, 2000).
A survey can be discussed to see the trend of
E-commerce. "E-commerce impact reaches well beyond'
purchasing and selling activities. A large number of firms
report that the Internet is reshaping their organizational
19
structure as well as their entire business strategy"
(Macaluso, 2000). According to the Special Survey on
E-commerce conducted by National Association of Business
Economics, E-commerce business will continue to have a
significant impact on most industries. The survey
indicated the following:
1. The widespread usage of E-commerce for either
purchasing or selling activities: four of five
firms reporting that they intend to use
e-commerce, and three of five firms are already
doing E-commerce business.
2. Most of the firms think that the impact of
E-commerce is largely positive or neutral.
3. Firms who plan to use E-commerce for purchasing
functions'outnumber those planning to use
E-commerce for selling activities by 10 percent
4. The majority of firms who use the Internet for
purchasing activities do this either through
other firms sites or are establishing their own
purchasing sites.
5. One of four firms report that the shift to
e-commerce-based technologies is having a major
impact on organizational structure, and one in
20
five report that it has caused them to reshape
their business strategies.
6. Thirty-one percent of the respondents said that
E-commerce would make’ their particular
industries more competitive.
Another survey by the National Association of
Manufacturers (NAM), found that 80 percent of
manufacturers are interested in getting into E-commerce,
but many of them are unsure about the logistics. There are
problems associated with E-commerce business; many
companies are interesting in using the E-commerce business
model. The point is, the companies should prepare to pay
technology investment up front before reaping the
benefits. From the survey we found that the use of
E-commerce should be a trend in the near future for most
industries. For the industries, the investment in start-up
costs of E-commerce might be a big problem when thinking
about setting up an E-commerce solution.
According to a new study by Forrester Research, Inc.,
the traditional media is not enough to attract customers.
Traditionally, the direct selling industry has used
personal distributors .to sell their products. In the
distributors system, word of mouth and education training
programs are the normal ways to introduce products to
21
customers. Sometimes direct selling companies will- use
traditional media such as TV ads or print ads to establish
brand name awareness. The traditional advertising
campaigns of the direct selling industry seem to face the
biggest impact. The widespread usage of online users
one-third, or 39 million U.S. households, is online and an
additional 5 million more will be added between 1999 and
2000. According to Forrester Research Inc. Customers are
seeking faster and more convenient services than before.
According to the same report by Forrester, "attracted by
the direct selling on the Net, traditional marketers will
shift $10 billion from traditional media spending on the
Internet (Demeck, 1999,.on-line)."
The experts from Forrester Research Inc also predict
that more than $500 million will be shifted from
traditional advertising to Internet advertising in the
next five years. According to the "E-commerce Times", the
increase of Internet advertising will have, a major impact
on other advertising, and they predict an 18 percent
decrease in newspapers ads, 17 percent decrease in of
direct mail, and 11 percent decrease in magazines
advertising. Meanwhile, TV and radio ads will become the
function of guides and interactive ads about E-commerce
websites (Demeck, 1999).
22
E-commerce is an easy-to-use business model. IQVC's
survey found that 50 percent of customers went directly to
the search button to find products (Liveperson, 2000).
E-commerce companies put their products in the most
popular search engine websites in order to take advantage
of how customers search on the Internet. With e-commerce,
more and more companies are cutting their costly TV ads,
print ads, and other expensive media advertising. They are
using many low-cost Internet tools such as e-mail or
on-line banner ads in place of more costly advertising. An
on-line teen clothing company, Alloy.com, says it saves
more than 33 percent of its advertising budget per year
because of on-line advertising tools.
In the direct selling industry business model,
multilevel marketing is used to establish relationships
with current distributors and attract new distributors.
Attracting new customers and keeping customers' loyalty
are the main requirements for an industry to survive. With
E-commerce technology, a new CRM (customer relationship
management) system emerges. The traditional CRM strategy
is to use all possible channels to collect customers'
information and analyze the data on customers and then
establish a complete database in order to establish a
company's relationship with its customers. This kind of
23
CRM communication was one-way and passive.. The
effectiveness of CRM is not only the analysis of
customers' purchasing power and purchasing behaviors, but
it also can deal with the orders, shipping, marketing, and
customers services from the Internet automatically. CRM
includes management of the company's relationships with
customers, customers' loyalty management, competition
information, and multi-channels system. Customer data will
be collected from customers' e-mail addresses, phone
survey centers, or other retail stores to be analyzed by
the technology of data warehousing/data mining. That means
the software or the computer system can collect and
analyze the data. If the direct selling industry would
develop its CRM, it would have more complete customer
information because of its strong distributors system.
If a company operates supply circle management (SCM)
that supplements resources and the CRM as well, the
company would have more success in business. The
development of E-commerce business makes,it necessary for
an industry to develop effective strategies to maintain
good relationships among business partners, suppliers, and
customers to survive in the competitive business world. A
CRM system can be predicted to be very popular and used in
many industries in the near future.
24
E-commerce business does business with customers
based on a personal shopping experience. Amazon offers a
recommended reading or music list based on past purchases.
A famous leather manufacture, Coach, allows its online
customers to choose color, style, and collection if they
want. The direct selling cosmetic company Avon helps its
online customers select the cosmetic or skin care products
which are suited for the specific customer.
Greenberg discussed a new theory called Channel
Conflict in E-commerce Times on January 7, 2000. He noted,
"one of the great questions of E-commerce is whether
manufacturers can use the Internet to bypass their
traditional distribution channels. If they can, it raises
the specter of no longer needing their distributors."
Through the E-commerce business model, the manufacture may
sell its products either from its own website or from
major online stores such as amazon.com or ebay.com. The
reports also indicated that the traditional distributors
system could be destroyed by E-commerce.
Multilevel marketing is the main structure that
supports the direct selling industry. The direct selling
industry would not exist without its distributor system.
With the rapid growth of E-commerce business, shopping
online could replace the traditional distributors system.
25
Customers do not need to get the goods from distributors;
instead, they can get fast and convenient information and
services through the Internet.
As the direct selling industry moves to E-commerce,
it will need to come up with a new E-commerce business
model to establish its E-commerce business. Because the
direct selling companies are vendors, they will need to
sell their products on other popular E-commerce retailer
sites such as Amazon, Buy.com, or Ebay. This way, they
will have the opportunity to do business with their
competitors at the same website. It also means that one
direct selling company's goods may be sold on different
websites at the same time.
Channel conflict also raises the issue of pricing.
Presently, direct selling distributors can sell their
goods at a variety of prices. Since they purchase the
goods from the direct selling company, they get certain
discounts. Once they have the product, they can price it
themselves. If the direct selling company uses the
E-commerce business model, it will establish a suggested
retail price or a fixed price online.
Paul A. Greenberg (2000) of E-commerce Times noted,
"regardless of how difficult it (E-commerce) has been for
some manufacturers to sell online, there may be ways to
26
sell directly to customers without offending suppliers in
the distribution channel." He also predicted, "without
retailers to sell their products online, some
manufacturers might end up counting themselves among the
early victims of E-commerce." This shows that E-commerce
has affected directly or indirectly retailers' marketing
strategy and manufacturers. It is possible that the direct
selling distributor system might have been influenced
directly or indirectly by E-commerce.
E-commerce also creates a new trading environment,
Digital marketplaces. Digital marketplaces are composed of
many electronic trading communities, virtual marketplaces,
and virtual companies (Mougayar, 1998). There is no
significant difference between the traditional business
done by retailers and Internet-based business model in
which the transaction id processed in the digital
marketplace.
After discussing the impacts of E-commerce, it is
necessary to understand the reasons for developing
E-commerce. The following section introduces the outlook
for online usage. Some important survey results or
statistics will be cited to show the trend of online
usage.
27
Outlook of Online Usage
In this section, the characteristics of the online
users and their concerns when shopping on line will be
Discussed. Online users are the potential customers for
the E-commerce business. The importance of their roles
should not be ignored.
Internet usage in the world is increasing at a steady
rate. The U.S. has the highest percent of people shopping
online around the world. The following survey conducted by
the Industry Standard Computer Industry Almanac Central
Intelligence Agency in July 1999 shows the Internet usage
in the top 11 countries (as cited in Zemke & Lonnellan,
2000).
28
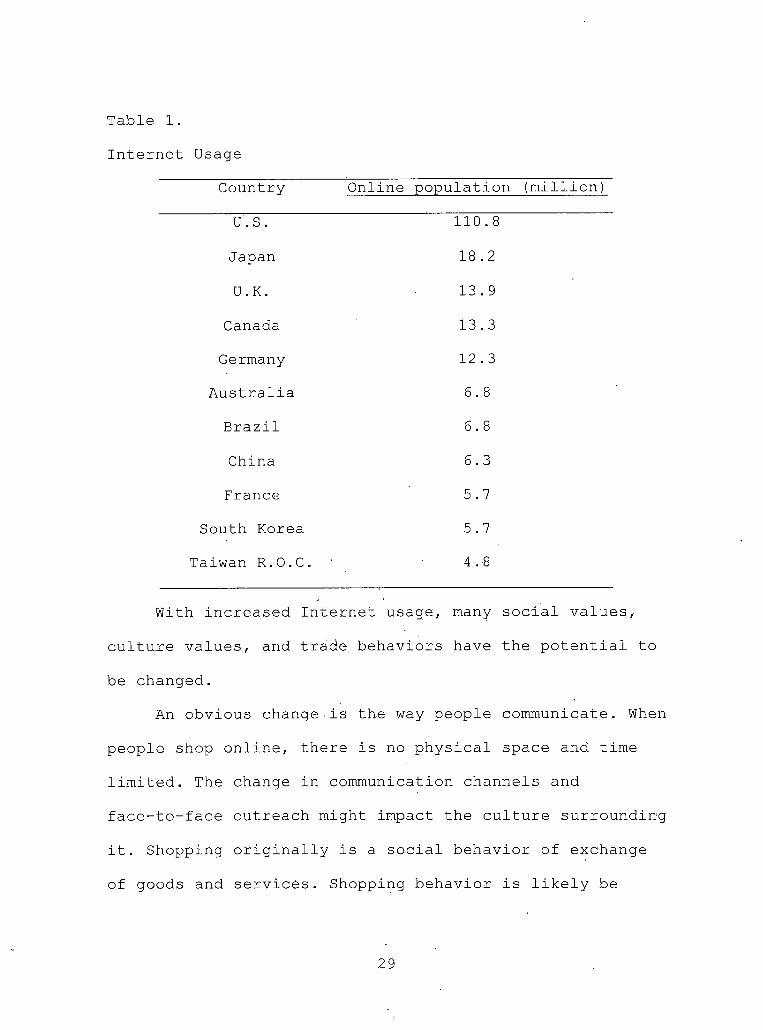
Table 1.
Internet Usage
Country Online population (million)
U.S. 110.8
Japan 18.2
U.K. 13.9
Canada 13.3
Germany 12.3
Australia 6.8
Brazil 6.8
China 6.3
France 5.7
South Korea 5.7
Taiwan R.O.C. 4 . 8
With increased Internet usage, many social values,
culture values, and trade behaviors have the potential to
be changed.
An obvious change.is the way people communicate. When
people shop online, there is no physical space and time
limited. The change in communication channels and
face-to-face outreach might impact the culture surrounding
it. Shopping originally is a social behavior of exchange
of goods and services. Shopping behavior is likely be
29
changed because of the development of e-commerce. People
in the future will get used to shopping online. People
just need a little effort or time to go to a website, then
log on, point, and click to get the goods or services they
want. They do not have to worry about the traffic,
parking, weather, or even stores closing times. (Zemke &
Lonnellan, 2000)
Based on an Internet survey from CNET.com, most of
the online users worry that most of the E-commerce
companies are lacking more professional integrated
planning. Lots of online users worry about the security of
E-commerce business. Many people will check to see if the
E-commerce company uses a legal security system before
they give a credit card number. Some people think that
online companies do not reply to customers' e-mail as soon
as possible. Another study from a software company,
Brightware, Inc, showed that two-thirds of the country's
100 largest companies did not reply to e-mail questions
from online users. Only 15 percent answer customers'
questions (Wolf & Zee, 2000).
In November 1999, Jupiter Communication announced
that their study indicated that 42 percent of top-ranked
websites took longer than 5 days to answer customers'
questions. The study also showed most customers want to
30
receive a final response within 24-26 hours (Wolf & Zee,
2000) .
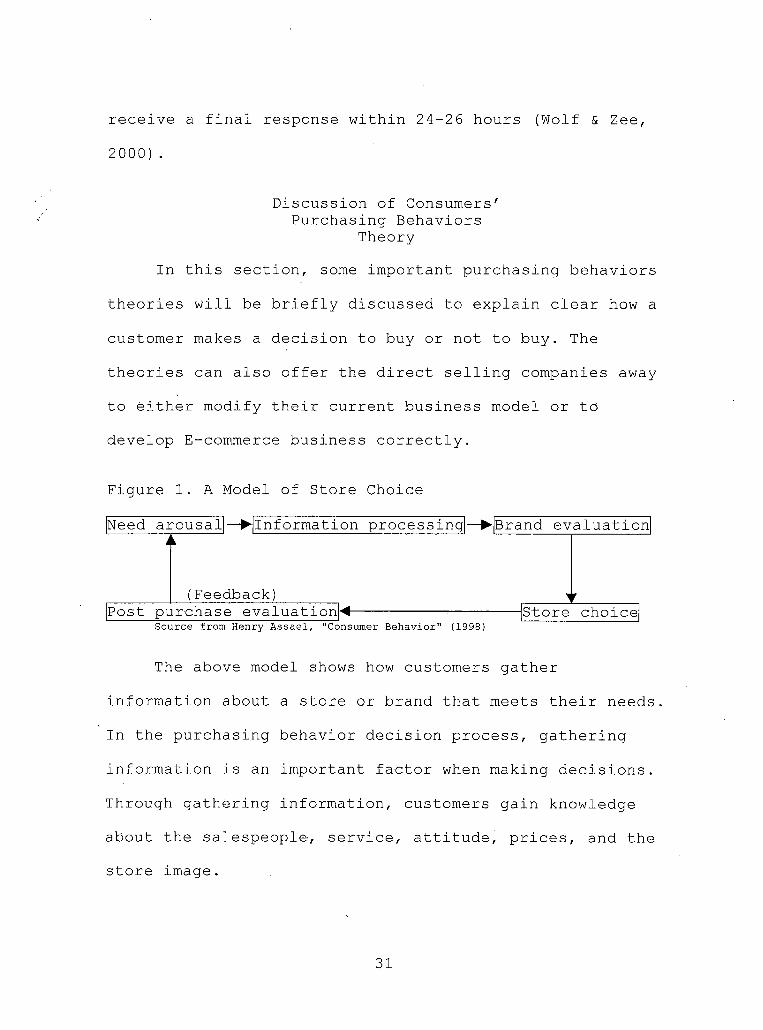
Discussion of Consumers'Purchasing Behaviors
Theory-
In this section, some important purchasing behaviors
theories will be briefly discussed to explain clear how a
customer makes a decision to buy or not to buy. The
theories can also offer the direct selling companies away
to either modify their current business model or to
develop E-commerce business correctly.
Figure 1. A Model of Store Choice
The above model shows how customers gather
information about a store or brand that meets their needs.
In the purchasing behavior decision process, gathering
information is an important factor when making decisions.
Through gathering information, customers gain knowledge
about the salespeople, service, attitude, prices, and the
store image.
31
E-commerce shoppers also make decisions through a
similar process. One difference is that E-commerce
shoppers use the Internet to search for the products they
want. The website.image becomes just like the store image,
which can determine a customer's purchasing decision.
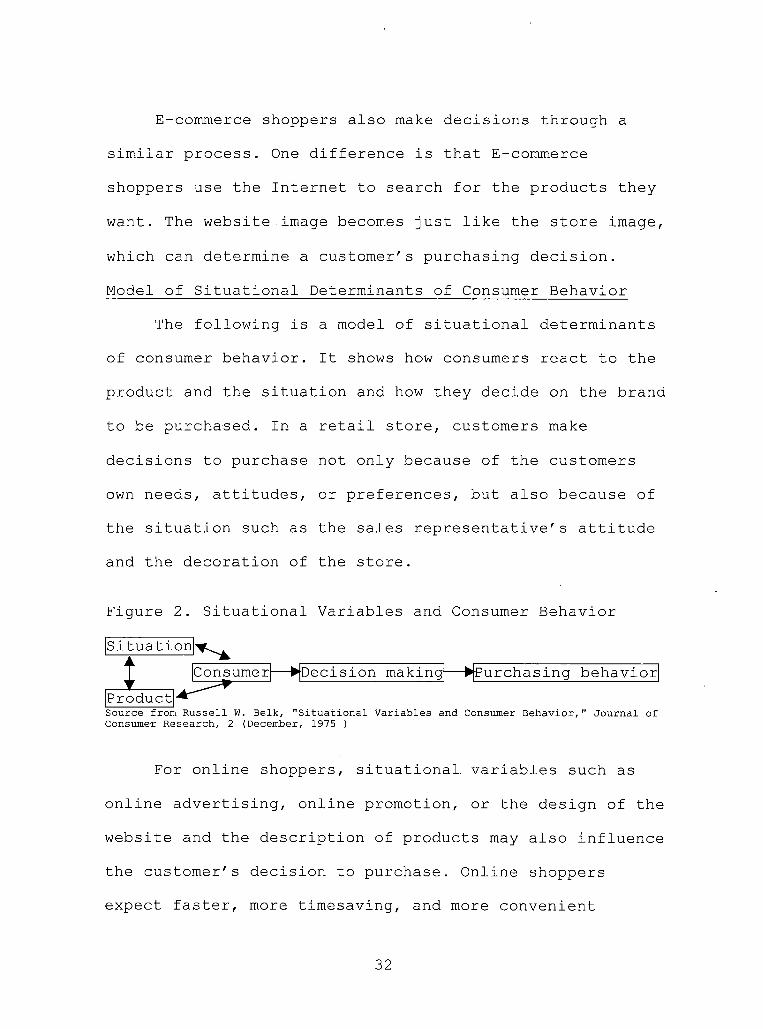
Model of Situational Determinants of Consumer Behavior
The following is a model of situational determinants
of consumer behavior. It shows how consumers react to the
product and the situation and how they decide on the brand
to be purchased. In a retail store, customers make
decisions to purchase not only because of the customers
own needs, attitudes, or preferences, but also because of
the situation such as the sales representative's attitude
and the decoration of the store.
Figure 2. Situational Variables and Consumer Behavior
Source from Russell W. Belk, "Situational Variables and Consumer Behavior," Journal of Consumer Research, 2 (December, 1975 )
For online shoppers, situational variables such as
online advertising, online promotion, or the design of the
website and the description of products may also influence
the customer's decision to purchase. Online shoppers
expect faster, more timesaving, and more convenient
32
service than traditional retail customers. E-commerce
companies can not give the customers the opportunities to
feel, see, inspect, and use products before buying.
"To see is to believe" is a good strategy to convince
customers to purchase in retail stores. In the real trade
process, people can feel and see.the products and will be
persuaded by sales representatives. Sales representatives
play the important role of catalytic agents in the process
of trade (Kobagashi, 1989) .
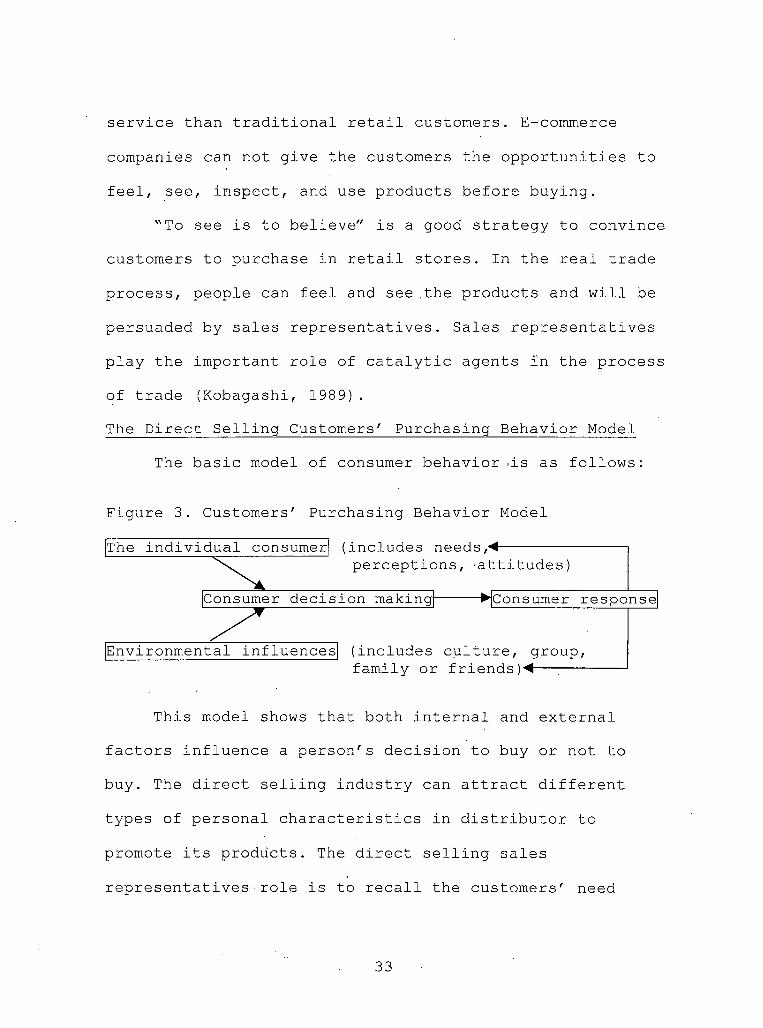
The Direct Selling Customers' Purchasing Behavior Model
The basic model of consumer behavior ,is as follows:
Figure 3. Customers' Purchasing Behavior Model
|The individual consumer (includes needs,◄------------------------perceptions, attitudes)
|Consumer decision making|--------- ►|Consumer response|
Environmental influences (includes culture, group, family or friends)◄----- :-----
This model shows that both internal and external
factors influence a person's decision to buy or not to
buy. The direct selling industry can attract different
types of personal characteristics in distributor to
promote its products. The direct selling sales
representatives - role is to recall the customers' need
33
arousal and use many personal demonstrations to enforce
the customers' motivation to buy the products. Sales
distributors also use group meetings or parties to bring
the customers to the direct selling group. A direct
selling distributor succeeds in creating the internal and
external conditions for the customers to purchase. Direct
sales distributors are very enthusiastic and can respond
to any questions from customers. The multilevel marketing
model is a very successful model to create customers'
purchasing motivation. The customers' loyalty is
established.
In contrast, E-commerce businesses use both TV ads
and banner ads on the Internet to increase the awareness
of websites. The more online users go to the Internet, the
more possibilities for them to see the ads. With more and
more online users, online shopping is becoming a
lifestyle. People will get information from the Internet
anytime, anywhere. Online customers' perceptions and
attitudes toward shopping are changing. Online shopping is
a good example of how a technology can change lifestyle
structure and purchasing behaviors. The direct selling
distributors system represents "traditional" customers
purchasing decision-making; E-commerce business creates a
new customer purchasing decision-making model.
34
Conclusion
Applicable points to both E-commerce business and the
direct selling industry are as follows:
1. Both of them do not need the enormous expense of
mass media advertising,
2. Both of them do not need to compete for shelf
space in retail stores,
3. Both of them are not restricted by the time
constraints of retail stores.
Many companies such as Dell Computer Corporation
succeed using E-commerce business. More and more
traditional retailers such as Home Depot and Levis Jeans
are adopting E-commerce business in 2000 (Greenberg,
2000). There are still some companies, such as Compaq
Computer who adopt a wait-and-see attitude and adopt
direct online sales and traditional distribution at the
same .
The direct selling industry represents the
traditional American business model. Some direct selling
companies have felt the impact of E-commerce business.l -~-
Some big e-retailers such as\Amarzon or Ebay offer cheaper
and faster services to online customers. The attitudes of
the direct selling companies to the impact of E-commerce
might be varied. Some may shift their multilevel marketing
35

system to an E-commerce business model; some will continue
to practice multilevel marketing; still some may operate
their business using multilevel marketing and E-commerce.
36
CHAPTER THREE
METHODOLOGY
Purpose of the Study
As discussed in the literature review, the direct
selling business model started in 1945. In the direct
selling business model, the distributors are the
customers, and they can purchase goods and services
directly. Purchasing directly is the key point and
advantage for the direct selling industry.
In the beginning of the 1990s, the U.S. government
revoked the restrictions which prohibited companies from
doing business through the Internet. Some companies found
an advantages to doing business through the Internet, and ,
they started to develop Electronic Commerce technology and
strategies. In September 1993, President Clinton announced
the National Information Infrastructure, (Nil) to help to
develop Information Technology (IT) and the practice of
business application on the Internet. Many other countries
have become concerned about the application of business
through the Internet.
As a result of Internet technology, more and more
customers are shopping and purchasing on line. This study
was conducted to find out how direct selling companies see
37
the development of E-commerce and to answer the following
questions.
1. How do the companies use E-commerce tools such
as e-mail or websites and traditional
communications ?
2. How do the companies' distributors and customers
use their e-mail or websites and traditional
communications ?
3. What are the respondents' attitudes toward using
e-commerce?
4. How do the respondents see E-commerce impacting
different aspects of their business? (Marketing,
Investment, or others )
The
based on
1.
2 .
Hypotheses
following hypotheses were used for the study
the review of the literature.
Most direct selling companies will or have used
E-commerce tools such as e-mail or website to
communicate with their distributors and
customers.
The distributors would prefer to use e-mail and
websites rather than traditional communications.
38
3. The direct selling companies' attitudes toward
using E-commerce should be positive; they will
develop their E-commerce business so their
distributors can purchase online. However,
E-commerce business will not replace the entire
direct selling business model.
4. Most direct selling companies will be willing to
invest in developing both E-commerce services
and E-commerce technology.
Questionnaire Design
Based on the purpose of the study, the questionnaire
was designed to understand how the direct selling
companies see the growth of E-commerce and how they deal
with the E-commerce impact on their businesses. The
questionnaire consisted of Yes-and-No, open-ended, and
scaled-response questions and was divided into five
sections. They were general information, information about
the direct selling companies' organization and E-commerce,
impact, the companies' attitudes toward e-commerce, and
influences on their customers because of the impact from
E-commerce.
The topics included in the questionnaire was not only
based on the literature review, but also based on
39
information from the Direct Selling Association and
anecdotal reports from websites. Section III of the
guestionnaire was also developed using the E-commerce
guestionnaire results from the Internet.
In section I the respondents were asked to provide
information about their companies. In section II the
respondents were asked to answer some Yes or No screening
guestions and then continue to answer more related
guestions in detail. Some guestions were designed with a
scale from very often to never and we don't have
e-mail/website. Some guestions offered some
answers/assumptions for the respondents. There was an open
question for the respondents to write their opinions about
any influence of their website on their business.
In section III a five-point scale from significant
increase to significant decrease was designed to obtain
the respondents' opinions to rate E-commerce impacts on
their marketing strategies, investment plan, and other
aspects of the business.
In the last section, the direct selling companies
were asked what they think.about their potential customers
if they offered E-commerce business. In this section a
simple Yes and No answer was given.
40
Respondents
The samples were selected from the membership list of
the Direct Selling Association based on the number from
one to 110. The total number of companies selected was
110. Seventy questionnaires were sent by e-mail. All
addresses were obtained from the 70 direct selling
companies' websites listed on the Direct Selling
Association website. Another 40 questionnaires were sent
by mail. Because the■questionnaire was designed to obtain
the respondents' opinions about marketing strategy, the
questionnaires were sent to the Marketing Department of
the organizations.
Procedures
Before designing the questionnaire, similar
questionnaires related to E-commerce or direct selling
companies' distributors system were referenced. During the
design of the questionnaire, two communication department
professors were consulted to make sure that the
respondents could understand the questionnaire clearly and
easily and would not misinterpret the questions.
Seventy of the 110 questionnaires were sent by e-mail
to the direct selling companies marketing departments
whose websites were offered by the Direct Selling
41
Association on November 15, 2000. A brief statement of the
purposes of the study and contact information was sent via
e-mail and the questionnaires were attached. The
respondents could return the completed questionnaire by
e-mail.
Forty questionnaires were also sent by mail onNovember 15, 2000. Two of the 40 questionnaires were sent
to Canada. The mail envelopes were sent by the Marketing
Department of California State University in order to
indicate the survey was academic research, not businessresearch. A cover letter described the purposes of thestudy, contact information, suggested return date. A postage paid return envelope was enclosed in the mail
envelopes.The respondents who were sent the questionnaires both
by the mail and e-mail were asked to return thequestionnaires before November 28, 2000. Because thereturn rate was low on November 28, 2000, a reminderletter was sent by e-mail to those who did not return thequestionnaires. On November 28, 2000, only 10
questionnaires were returned by the postage return mails,
and 15 questionnaires were returned by e-mails.From November 15, 2000 to January 31, 2001, four
reminder letters were sent out by e-mail to those who did
42
not respond. No reminder letters were sent out by mail at
that time.
. Final return rate statistic results are as follows:
1. Total number questionnaires sent either by mail
or by e-mail: 110
2. Total returned: 34
3. Total reject number: 7 (all rejected by e-mail,
the reasons were "the company does not have an
E-commerce solution and is not able to answer
the questionnaire" "our company is too small to
answer the questionnaire" "my company is not
important enough to answer the questionnaire"
4. Total wrong address number: 9 (note: two of 9
were because of wrong e-mail addresses; seven of
9 were because addresses could not be found.)
5. No response number: 60 (five of the 60 answered
that they would transfer the questionnaire to
the appropriate department; however, during the
survey, there were still no response from the
companies).
Data Entry and Analysis
After collecting all returned and completed
questionnaires, the data was entered into the Statistical
43
Program of Social Sciences (SPSS) statistical software
10.0. Frequencies and cross tabulations were conducted and
were used to analyze the data. The basic statistical
function frequency from each question offered percentages
to compare the differences among all answers with a
pictorial view. Cross tabulation was' used in further
analysis to describe the relationship between the impact
of utilization of E-commerce tools such as e-mail and the
websites on the direct selling companies business.
44
CHAPTER FOUR
RESULTS
The collected questionnaire data was analyzed by SPSS
statistical software 10.0. The Final response rate after
reminder letters were sent out was 30.9% (34/110) . The
results were analyzed by the function frequency of the
SPSS. Cross tabulation analysis was also conducted to
analyze some data that needed further analysis. The
frequency tables are attached after the analysis and the
cross tabulation tables are attached in the appendix due
to the large size of pictures for reference.
Respondents' Profile
The respondents were asked several general
information questions about their direct selling
companies. When they were asked which of the following
types of sales dollars generates the largest amount for
your company, ninety one point two (91.2) percent of the
respondents answered that face-to-face selling was most
widely used to generate the largest amount for their
companies.
• V
45
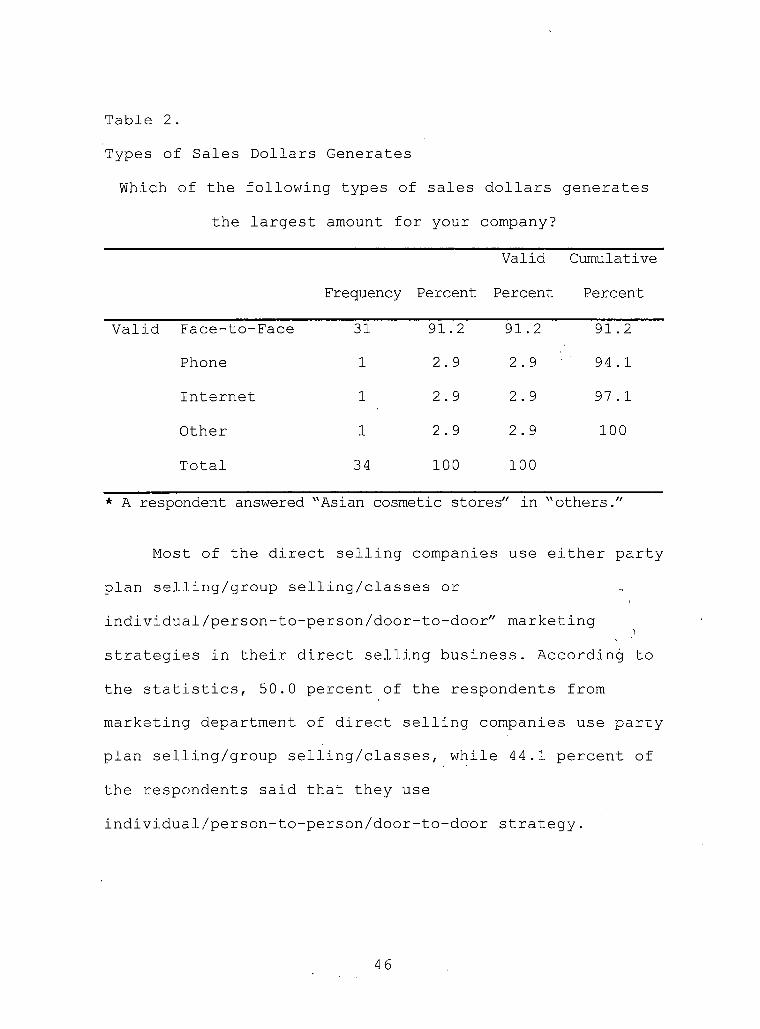
Table 2.
Types of Sales Dollars Generates
Which of the following types of sales
your
dollars
company?
generates
the largest amount for
Valid Cumulative
Frequency Percent Percent Percent
Valid Face-to-Face 31 91.2 91.2 91.2
Phone 1 2.9 2.9 94.1
Internet 1 2.9 2.9 97.1
Other 1 2.9 2.9 100
Total 34 100 100
* A respondent answered "Asian cosmetic stores" in "others."
Most of the direct selling companies use either party
plan selling/group selling/classes or
individual/person-to-person/door-to-door" marketing
strategies in their direct selling business. According to
the statistics, 50.0 percent of the respondents from
marketing department of direct selling companies use party
plan selling/group selling/classes, while 44.1 percent of
the respondents said that they use
individual/person-to-person/door-to-door strategy.
46
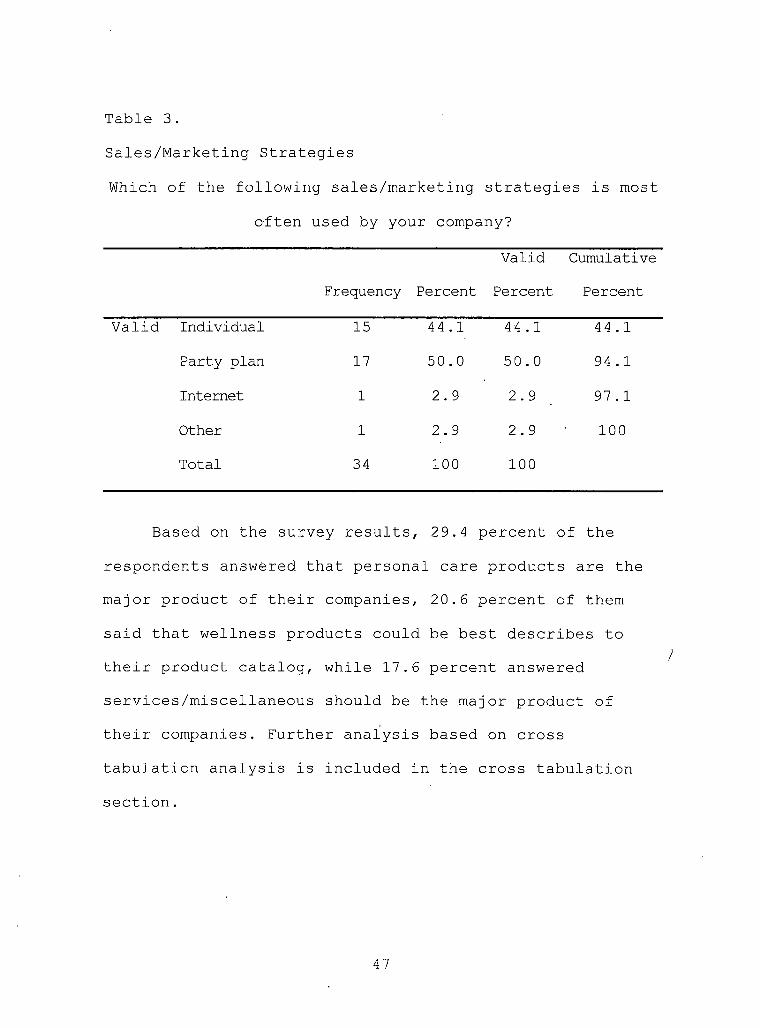
Table 3.
Sales/Marketing Strategies
Which of the following sales/marketing strategies is most
often used by your company?
Frequency Percent
Valid
Percent
Cumulative
Percent
Valid Individual 15 44.1 44.1 44 . 1
Party plan 17 50.0 50.0 94.1
Internet 1 2.9 2.9 97.1
Other 1 2.9 2.9 100
Total 34 100 100
Based on the survey results , 29.4 percent of the
respondents answered that personal care products are the
major product of their companies , 20.6 percent of them
said that wellness products could be best describes to
their product catalog, while 17.6 percent answered
services/miscellaneous should be the major product of
their companies. Further analysis based on cross
tabulation analysis is included in the cross tabulation
section.
47
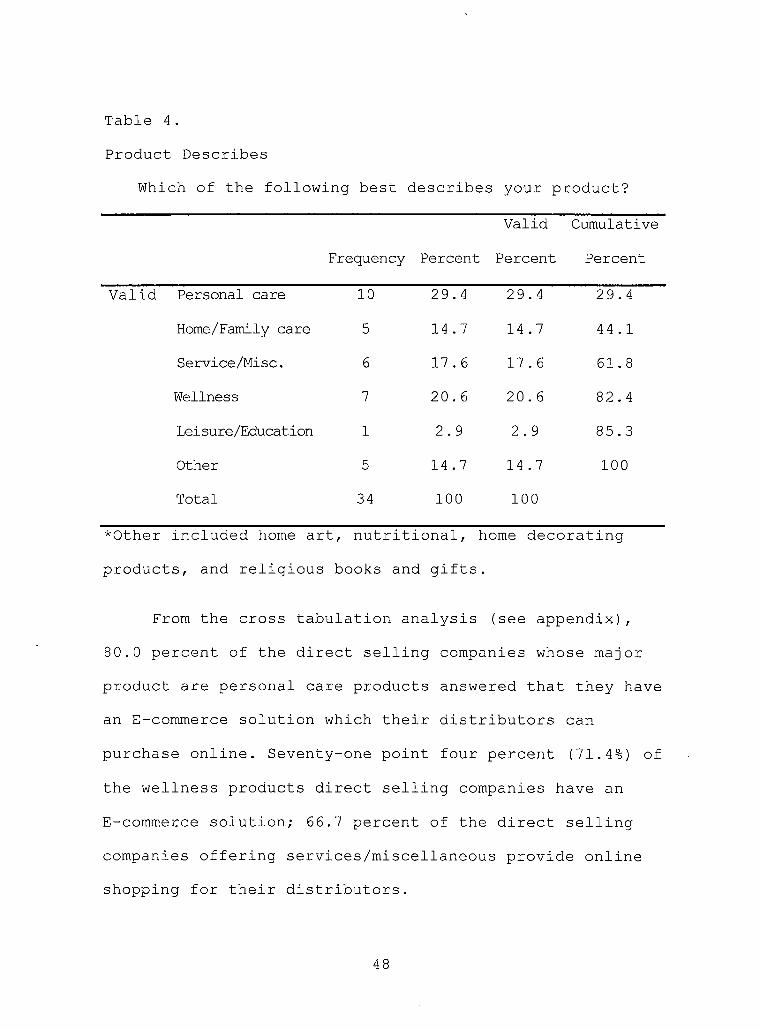
Table 4.
Product Describes
Which of the following best describes your product?
Frequency Percent
Valid
Percen'
Cumulative
t Percent
Valid Personal care 10 29.4 29.4 29.4
Home/Family care 5 14.7 14.7 44.1
Service/Misc. 6 17.6 17.6 61.8
Wellness 7 20.6 20.6 82.4
Lei sure/Education 1 2.9 2.9 85.3
Other 5 14.7 14.7 100
Total 34 100 100
*Other included home art, nutritional, home decorating
products, and religious books and gifts.
From the cross tabulation analysis (see appendix),
80.0 percent of the direct selling companies whose major
product are personal care products answered that they have
an E-commerce solution which their distributors can
purchase online. Seventy-one point four percent (71.4%) of
the wellness products direct selling companies have an
E-commerce solution; 66.7 percent of the direct selling
companies offering services/miscellaneous provide online
shopping for their distributors.
48
When compared, which of the following best describes
your product? And what is your company's attitude toward
the use of E-commerce in the future?, 88.9 percent of the
personal care products direct selling companies responded
that they have already planned to use E-commerce within 2
years. Only 11.1 percent of the personal care products
companies said that they will never use E-commerce in the
future. 83.3 percent of the wellness products direct
selling companies said, that they have also planned to use
E-commerce within two years.
Based on the cross tabulation analysis, 44.4 percent
of the personal care products direct selling companies
said that 31.0 percent to 50.0 percent of their
distributors purchase their products online. Fifty seven
point one percent of the wellness products companies'
distributors purchase their products online.
According to the cross tabulation analysis, 70.0
percent of the respondents who sell personal care products
said that their website has influenced their direct
selling company. Eighty three point three percent of the
direct selling companies which offer
services/miscellaneous agreed that their website also have
influenced on their companies. Fifty seven point one of
49
the wellness products companies also agreed that fheir
companies have influenced by their website.
When compared to "Which of the following best
describes your product?" and "Do your distributors like to
purchase your products or goods online?", 90.0 percent of
the direct selling companies that sell personal care
products said that their distributors like to purchase
their products or goods online. Eightyrthree point three
percent (83.3%) of the services/miscellaneous companies
answered that their distributors like to purchase their
products online. Seventy-one point 4 percent (71.4%) of
wellness products companies answered in the same way. When
the respondents were asked, "Can' anyone apply to become a
new distributor via the Internet?", 70.0 percent of the
personal care products companies said that anyone can
apply to become a new .distributor via the Internet.
Seventy-one point four percent (71.4%) of the wellness
products companies answered the same way.
As for e-mail, 60.0 percent of the direct selling
companies whose major products are personal care products
said that they regularly use e-mail to communicate with
their distributors. Eighty-five point seven (85.7) of the
wellness products companies said that they use. e-mail to
contact with their customers; 83.3 percent of the
50
companies that offer services/miscellaneous answered in ■
the same way.
When comparing to "Which of the following best
describes your product?" and "How do you see the growth in
E-commerce affecting different aspects of your business?",
the following cross tabulation analysis were identified.
Seventy percent of the personal care products direct
selling companies, 66.7 percent of the
services/miscellaneous providers, and 57.2 percent of the
wellness products companies answered that they will
increase their investment on overall marketing of
E-commerce business.
Eighty point zero percent (80.0%) of the personal
care products companies, 100 percent of the
services/miscellaneous direct selling companies, and 57.1
percent of the wellness products companies will increase
their E-commerce services. Eighty point zero percent
(80.0%) of the direct selling companies that sell personal
care products think their marketing on the Internet will
increase because of the use of E-commerce. Eighty-three
point three percent (83.3%) of the services/miscellaneous
companies and 85.7 percent of the wellness products
companies also think their marketing on the Internet will
increase.
51
Ninety percent of the personal care products
companies believed that their investment in E-commerce
activities would increase. 83.3 percent of the direct
selling companies that provide services/miscellaneous and
71.4 percent of the wellness products companies also
believed investment in E-commerce would increase. Seventy
point zero percent (70.0%) of the personal care products
companies think they will increase their range of goods or
services because of the use of E-commerce. One hundred
percent of the services/miscellaneous companies think so.
71.4 percent of the direct selling companies which offer
wellness products said there would be no change on the
range of goods or services because of the use of
E-commerce. As for the unit cost of providing goods and
services, these three types of direct selling companies
answered that the unit cost of providing goods and
services will either not change or decrease. Most of these
types of direct selling companies said that the price
charged to customers for goods and services will not
change.
When asked-if E-commerce would replace the current
direct selling business model, based on the cross
tabulation analysis, 50.0 percent of the personal care
products companies said that most of their business would
52
continue to use the traditional direct selling business
model and a part of business either uses or will use
e-commerce, 40.0 percent of the personal care companies
said most of their business either uses or will use
E-commerce and a part of their business will still use the
traditional direct selling business model. 66.7 percent of
the services/miscellaneous direct selling companies and
57.1 percent of the wellness products companies answered
that most of their business will still use traditional
direct selling business model and only a part of their
business would use e-commerce. However, 42.9 percent of
the wellness products companies and 33.3 percent of the
services/miscellaneous providers answered the apposite.
They either used or would use E-commerce for most of their
business and only a small part of the business would
continue to use the traditional direct selling business
model. In short, most of the direct selling companies will
use both E-commerce and the traditional direct selling
business models.
Forty four point one (44.1%) percent of the direct
selling companies have under 5,000 distributors; 35.3
percent of the respondents said that they have 20,000 and
above distributors.
53
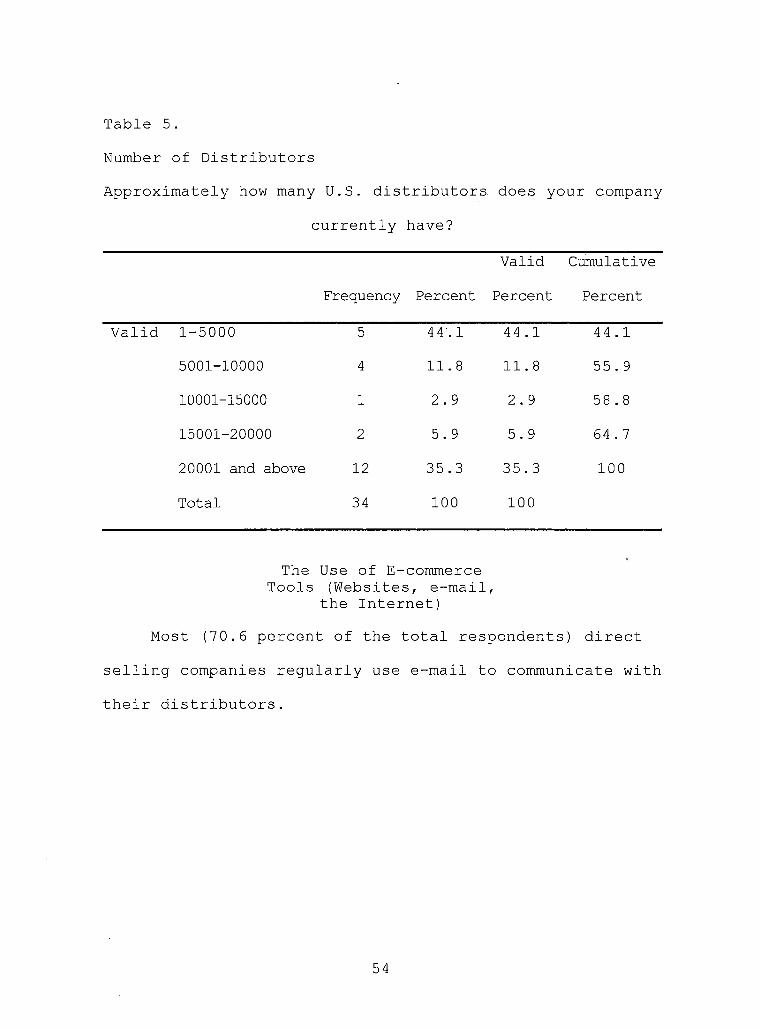
Table 5.
Number of Distributors
Approximately how many U.S. distributors does your company
currently have?
Frequency Percent
Valid
Percent
Cumulative
Percent
Valid 1-5000 5 44? 1 44.1 44.1
5001-10000 4 11.8 11.8 55.9
10001-15000 1 2.9 2.9 58.8
15001-20000 2 5.9 5.9 64.7
20001 and above 12 35.3 35.3 100
Total 34 100 100
The Use of E-commerce Tools (Websites, e-mail,
the Internet)
Most (70.6 percent of the total respondents) direct
selling companies regularly use e-mail to communicate with
their distributors.
54
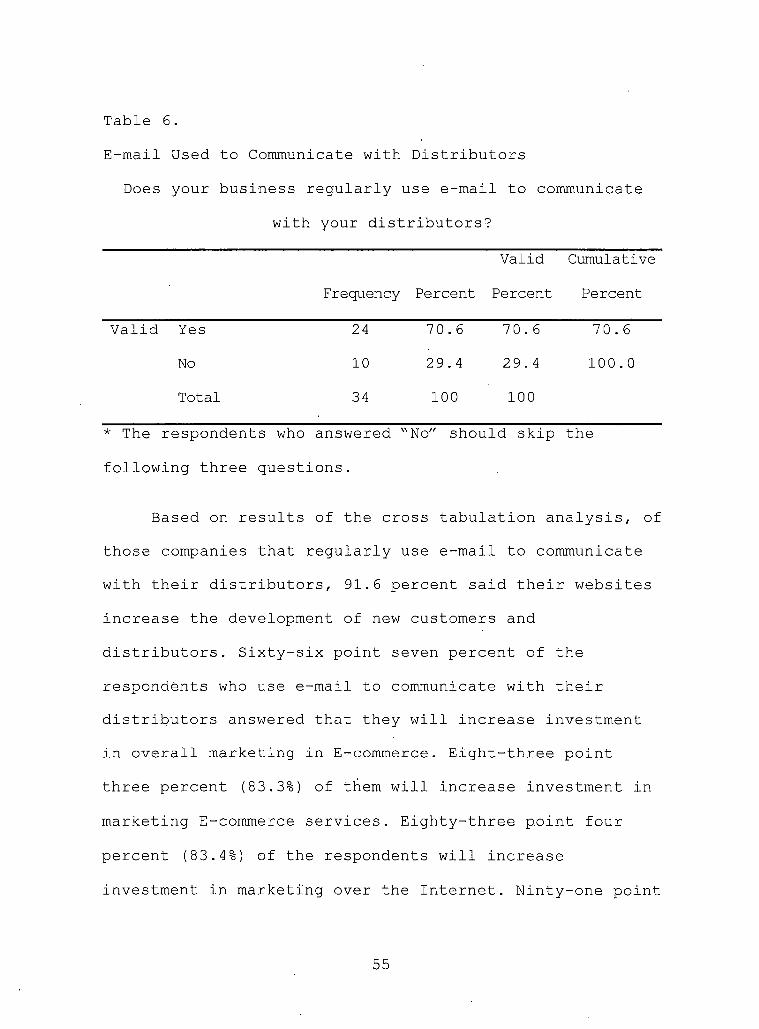
Table 6.
E-mail Used to Communicate with Distributors
Does your business regularly use e-mail to communicate
with your distributors?
Frequency Percent
Valid
Percent
Cumulative
Percent
Valid Yes 24 70.6 70.6 70.6
No 10 29.4 29.4 100.0
Total 34 100 100
* The respondents who answered "No" should skip the
following three questions.
Based on results of the cross tabulation analysis, of
those companies that regularly use e-mail to communicate
with their distributors, 91.6 percent said their websites
increase the development of new customers and
distributors. Sixty-six point seven percent of the
respondents who use e-mail to communicate with their
distributors answered that they will increase investment
in overall marketing in E-commerce. Eight-three point
three percent (83.3%) of them will increase investment in
marketing E-commerce services. Eighty-three point four
percent (83.4%) of the respondents will increase
investment in marketing over the Internet. Ninty-one point
55
seven percent (91.7%) will increase investment in
E-commerce activities. Seventy-five point zero percent
(75.0%) of the respondents who use e-mail regularly in
business answered that their profit margins increased.
Fifty-four point two of the respondents using e-mail to
contact their customers think the ability to reach more
customers was the best reason to use E-commerce, 33.3
percent of them think improving service levels to
customers is the main reason to use E-commerce. Sixty
point nine percent (60.9%) of the companies which use
e-mail to communicate with their distributors said that
they will reduce the use of other communications mediums.
When the companies who use e-mail regularly to
communicate with their customers were asked, "Does your
company or will your company use E-commerce to replace
your current direct selling business model?", 54.2 percent
of them think most of their business will still use the
traditional direct selling business model. Forty-one point
seven percent (41.7%) of the respondents answered that
most of their business will be replaced by E-commerce
business. Eighty-seven point five of the companies using
e-mail regularly in business said that their distributors
like to purchase their products or goods online.
Sixty-three point six percent (63.6%) of these companies
56
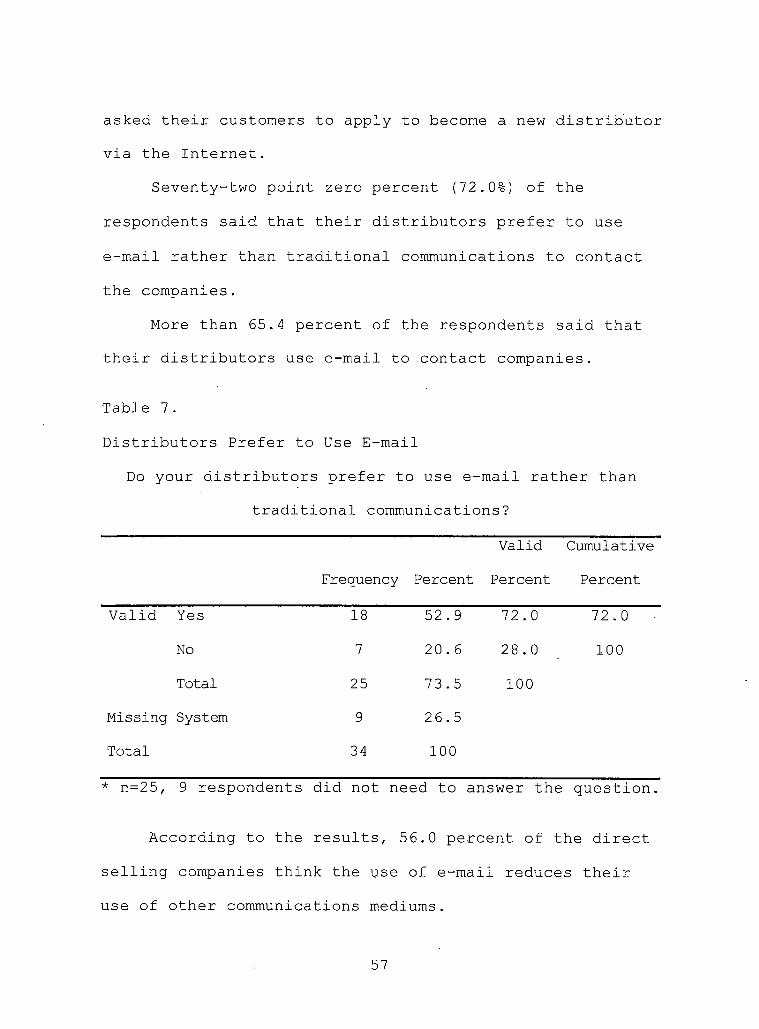
asked their customers to apply to become a new distributor
via the Internet.
Seventy-two point zero percent (72.0%) of the
respondents said that their distributors prefer to use
e-mail rather than traditional communications to contact
the companies.
More than 65.4 percent of the respondents said that
their distributors use e-mail to contact companies.
Table 7.
Distributors Prefer to Use E-mail
Do your distributors prefer to use e-mail rather than
traditional communications?
Frequency Percent
Valid
Percent
Cumulative
Percent
Valid Yes 18 52.9 72.0 72.0
No 7 20.6 28.0 100
Total 25 73.5 100
Missing System 9 26.5
Total 34 100
* n=25, 9 respondents did not need to answer the question.
According to the results, 56.0 percent of the direct
selling companies think the use of e-mail reduces their
use of other communications mediums.
57
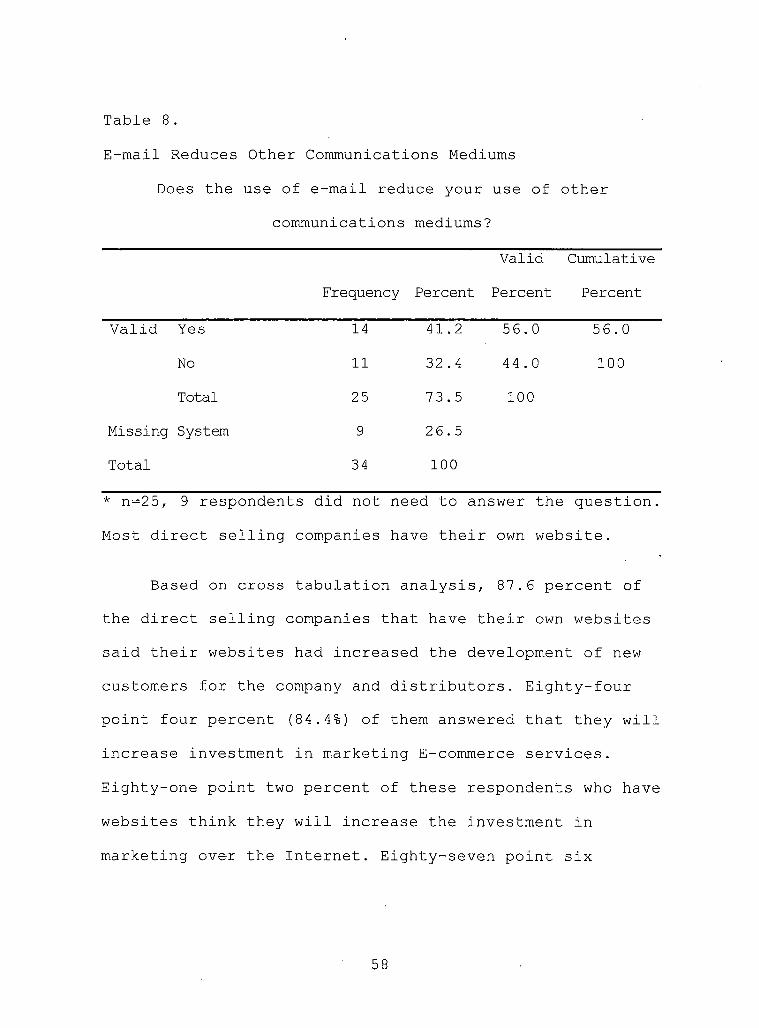
Table 8.
E-mail Reduces Other Communications Mediums
Does the use of e-mail reduce your use of othercommunications mediums?
Frequency Percent
Valid
Percent
Cumulative
Percent
Valid Yes 14 41.2 56.0 56.0No 11 32.4 44.0 100Total 25 73.5 100
Missing System 9 26.5
Total 34 100
* n=25, 9 respondents did not need to answer the question.Most direct selling companies have their own website.
Based on cross tabulation analysis, 87.6 percent ofthe direct selling companies that have their own websitessaid their websites had increased the development of new customers for the company and distributors. Eighty-four point four percent (84.4%) of them answered that they willincrease investment in marketing E-commerce services.
Eighty-one point two percent of these respondents who have
websites think they will increase the investment inmarketing over the Internet. Eighty-seven point six
58
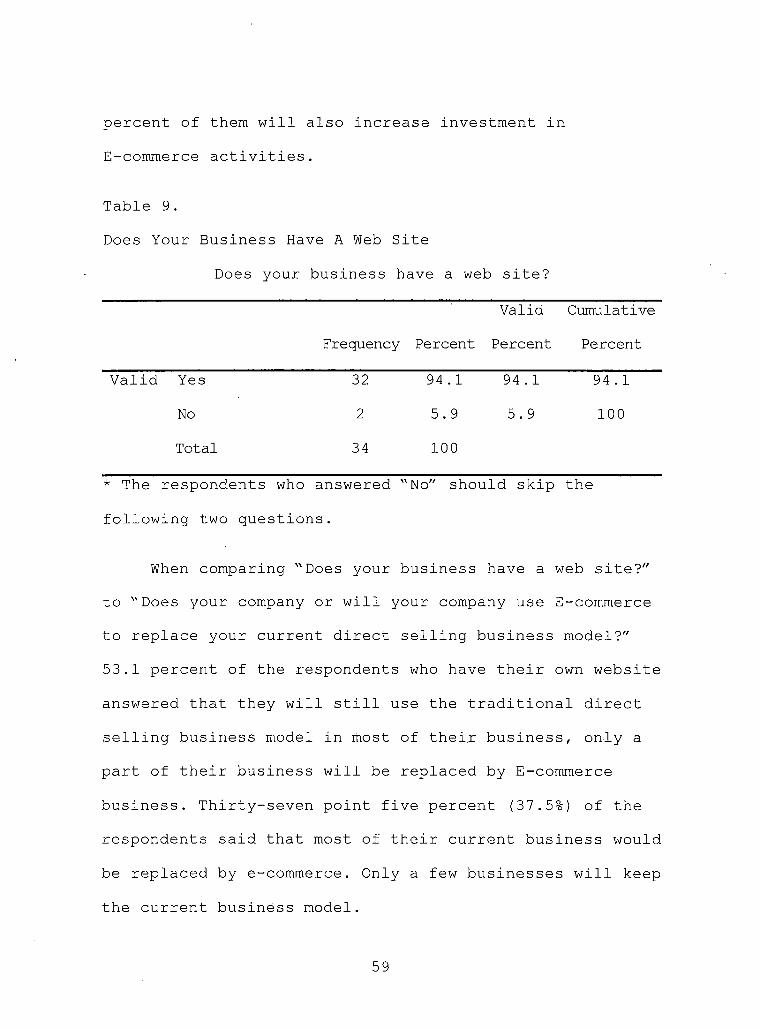
percent of them will also increase investment in
E-commerce activities.
Table 9.
Does Your Business Have A Web Site
Does your business have a web site?
Frequency Percent
Valid
Percent
Cumulative
Percent
Valid Yes 32 94 .1 94.1 94 . 1
No 2 5.9 5.9 100
Total 34 100
* The respondents who answered "No" should skip the
following two questions.
When comparing "Does your business have a web site?"
to "Does your company or will your company use E-commerce
to replace your current direct selling business model?"
53.1 percent of the respondents who have their own website
answered that they will still use the traditional direct
selling business model in most of their business, only a
part of their business will be replaced by E-commerce
business. Thirty-seven point five percent (37.5%) of the
respondents said that most of their current business would
be replaced by e-commerce. Only a few businesses will keep
the current business model.
59
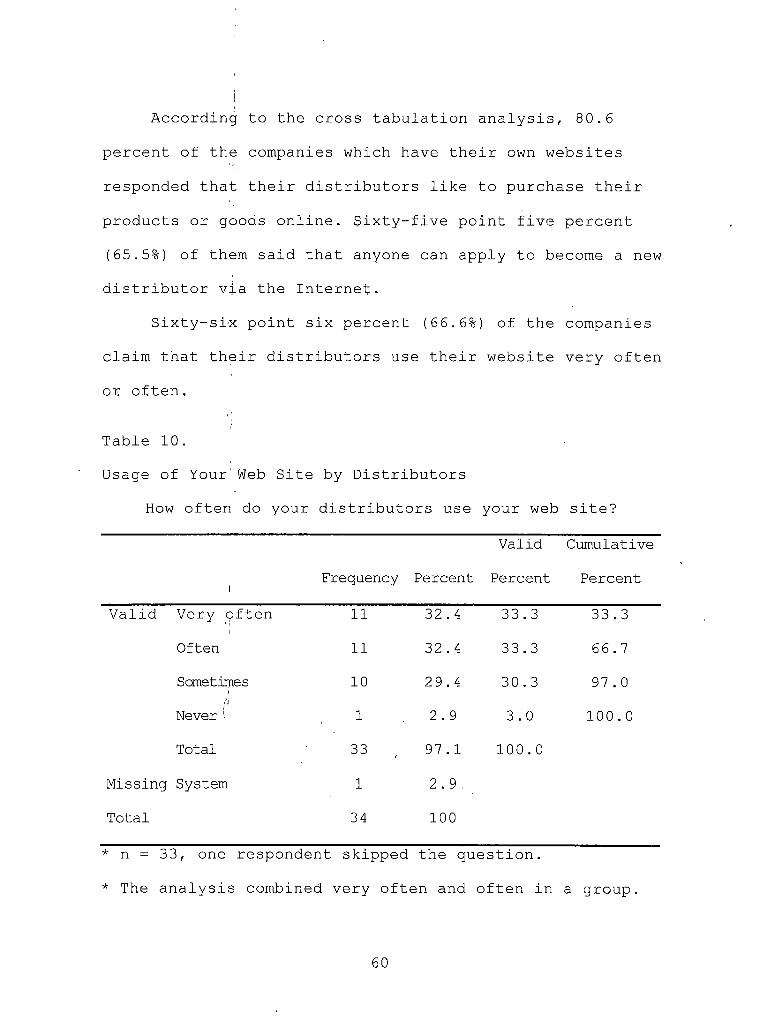
According to the cross tabulation analysis, 80.6
percent of the companies which have their own websites
responded that their distributors like to purchase their
products or goods online. Sixty-five point five percent
(65.5%) of them said that anyone can apply to become a new
distributor via the Internet.
Sixty-six point six percent (66.6%) of the companies
claim that their distributors use their website very often
or often.
Table 10.
Usage of Your'Web Site by Distributors
How often do your distributors use your web site?
Valid Cumulative
Frequency Percent Percent Percent
Valid Very often 11 32.4 33.3 33.3
Often 11 32.4 33.3 66.7
Sometimes 10 29.4 30.3 97.0S'
Never i 1 2.9 3.0 100.0
Total 33 97.1 100.0
Missing System 1 2.9.
Total 34 100
* n = 33, one respondent skipped the question.
* The analysis combined very often and often in a group.
60
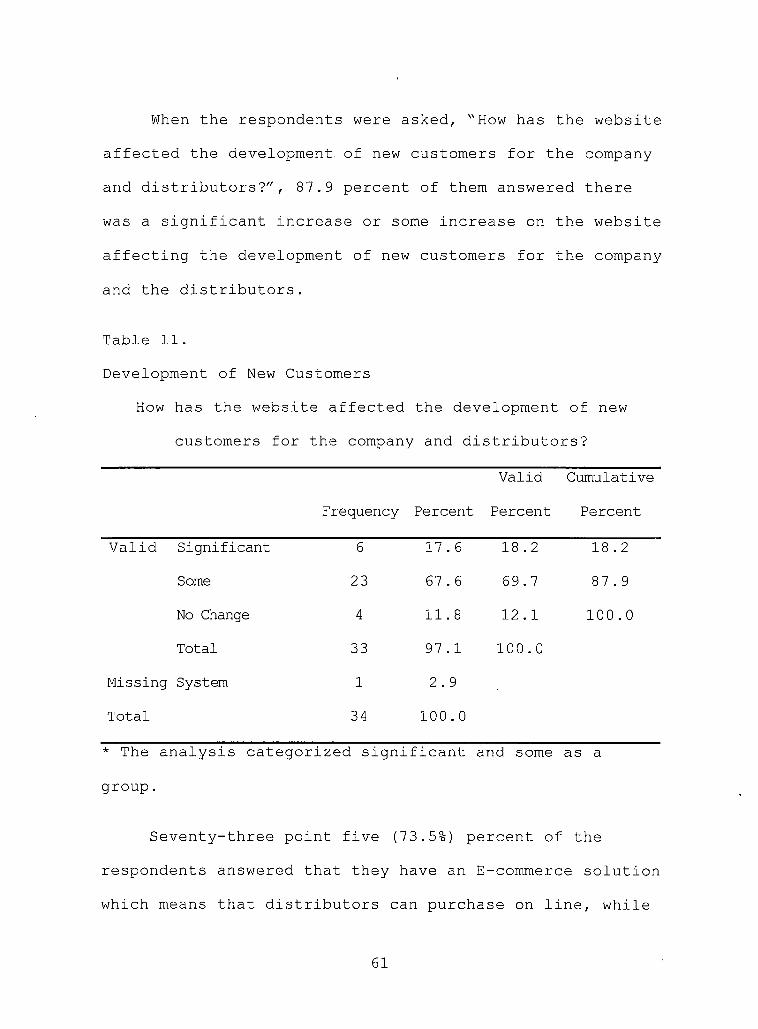
When the respondents were asked, "How has the website
affected the development, of new customers for the company
and distributors?", 87.9 percent of them answered there
was a significant increase or some increase on the website
affecting the development of new customers for the company
and the distributors.
Table 11.
Development of New Customers
How has the website affected the development of new
customers for the company and distributors?
Frequency Percent
Valid
Percent
Cumulative
Percent
Valid Significant 6 17.6 18.2 18.2
Some 23 67.6 69.7 87.9
No Change 4 11.8 12.1 100.0
Total 33 97.1 100.0
Missing System 1 2.9
Total 34 100.0
* The analysis categorized significant and some as a
group.
Seventy-three point five (73.5%) percent of the
respondents answered that they have an E-commerce solution
which means that distributors can purchase on line, while
61
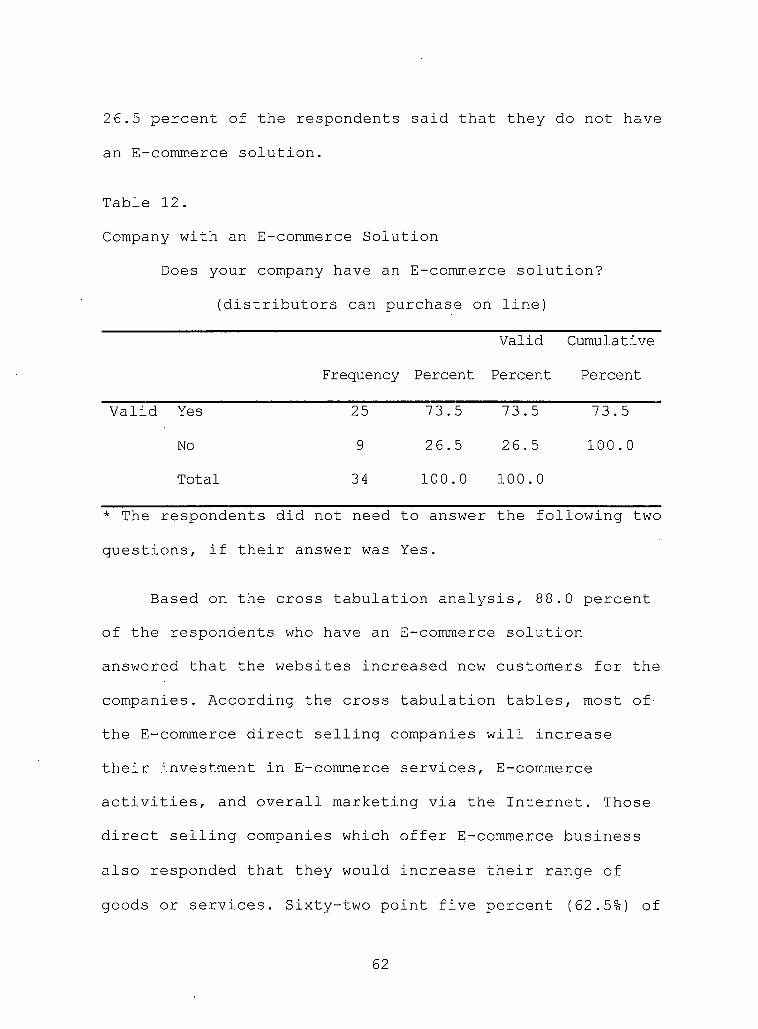
26.5 percent of the respondents said that they do not have
an E-commerce solution.
Table 12.
Company with an E-commerce Solution
Does your company have an E-commerce solution?
(distributors can purchase on line)
Frequency Percent
Valid
Percent
Cumulative
Percent
Valid Yes 25 73.5 73.5 73.5
No 9 26.5 26.5 100.0
Total 34 100.0 100.0
* The respondents did not need to answer the following two
questions, if their answer was Yes.
Based on the cross tabulation analysis, 88.0 percent
of the respondents who have an E-commerce solution
answered that the websites increased new customers for the
companies. According the cross tabulation tables, most of-
the E-commerce direct selling companies will increase
their investment in E-commerce services, E-commerce
activities, and overall marketing via the Internet. Those
direct selling companies which offer E-commerce business
also responded that they would increase their range of
goods or services. Sixty-two point five percent (62.5%) of
62
the direct selling companies whose their distributors can
shop online said that no extra price was charged to
customers because of the use of e-commerce. Seventy-eight
point two percent of the respondents who have an
E-commerce solution said that their profit margin
increased because of the use of E-commerce.
When the direct selling companies that offer
E-commerce services were asked "does your company or will
your company use E-commerce to replace your current direct
selling business model?," 52.0 percent of them said most
of their current traditional direct selling business model
will still be used. Forty point zero percent (40.0%) of
the E-commerce direct selling companies said they will use
E-commerce to replace their traditional direct selling
business in the future. In another cross tabulation, 96.0
percent of the direct selling companies which provide
E-commerce solutions said that their distributors like to
purchase products online. Sixty-six point seven (66.7%) of
the respondents said anyone can apply to become a new
distributor via the Internet.
Opinions About the Use of E-commerce Solution
The most important reason why companies do not use
E-commerce business are the cost in human resources to
63
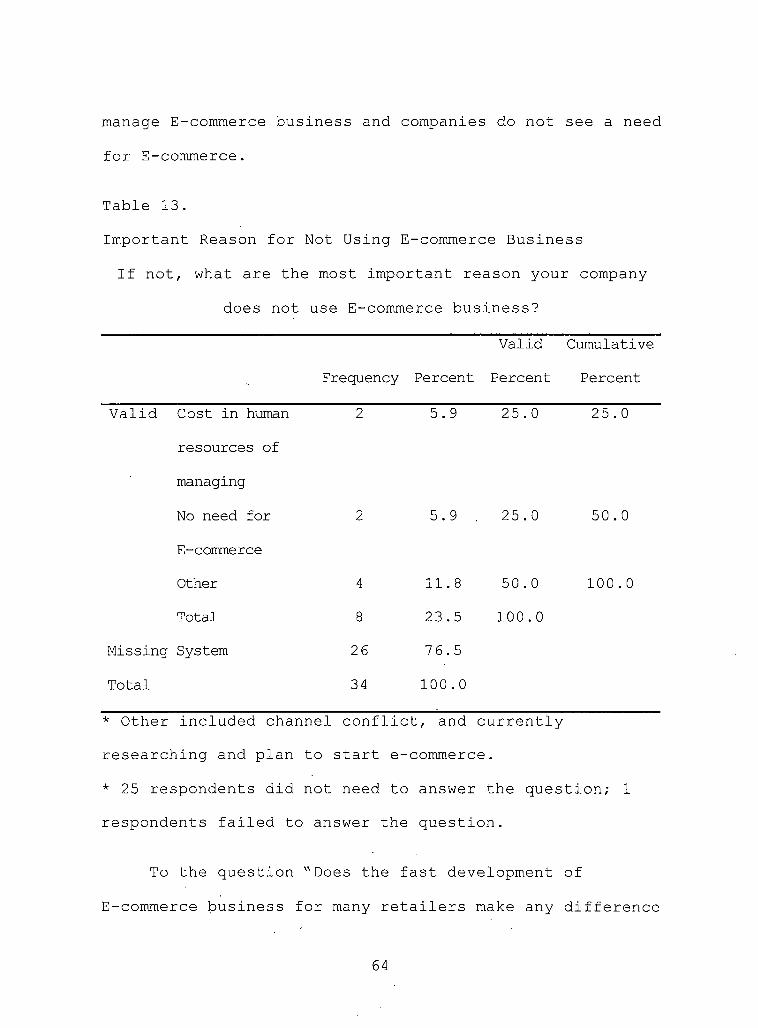
manage E-commerce business and companies do not see a need
for E-commerce.
Table 13.
Important Reason for Not Using E-commerce Business
If not, what are the most important reason your company
does not use E-commerce business?
Frequency Percent
Valid
Percent
Cumulative
Percent
Valid Cost in human 2 5.9 25.0 25.0
resources of
managing
No need for
E-commerce
2 5.9 . 25.0 50.0
Other 4 11.8 50.0 100.0
Total 8 23.5 100.0
Missing
Total
System 26
34
76.5
100.0
* Other included channel conflict, and currently
researching and plan to start e-commerce.
* 25 respondents did not need to answer the question; 1
respondents failed to answer the question.
To the question "Does the fast development of
E-commerce business for many retailers make any difference
64
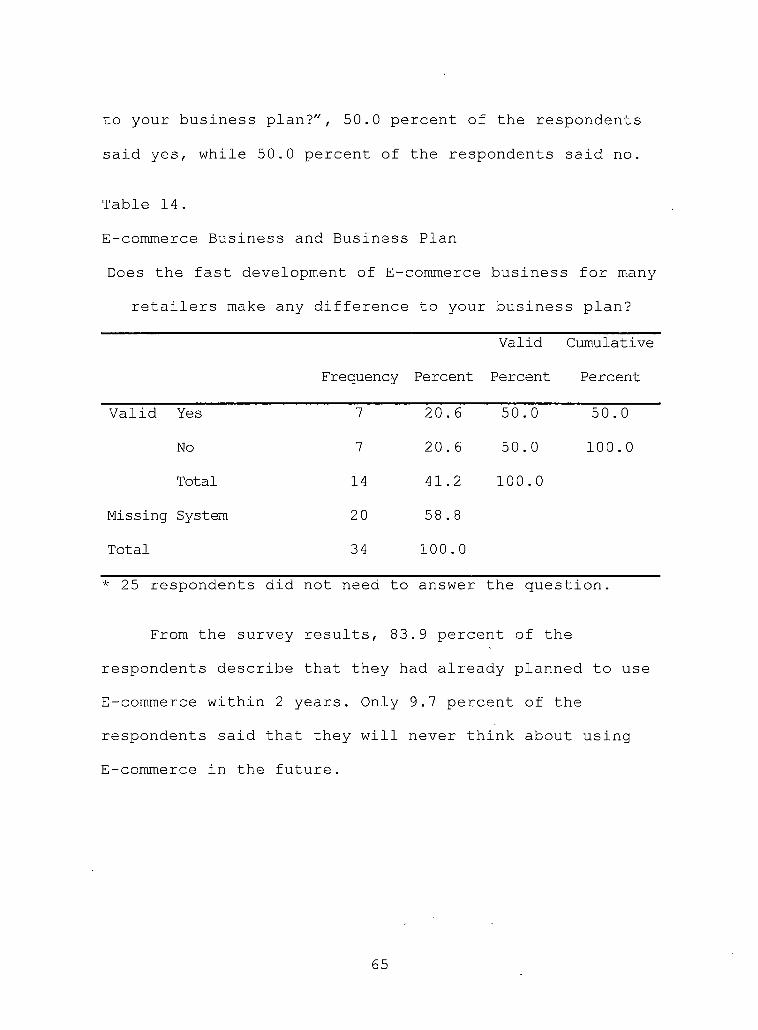
to your business plan?", 50.0 percent of the respondents
said yes, while 50.0 percent of the respondents said no.
Table 14 .
E-commerce Business and Business Plan
Does the fast development of E-commerce business for many
retailers make any difference to your business plan?
Frequency Percent
Valid
Percent
Cumulative
Percent
Valid Yes 7 20.6 50.0 50.0
No 7 20.6 50.0 100.0
Total 14 41.2 100.0
Missing System 20 58.8
Total 34 100.0
* 25 respondents did not need to answer the question.
From the survey results, 83.9 percent of the
respondents describe that they had already planned to use
E-commerce within 2 years. Only 9.7 percent of the
respondents said that they will never think about using
E-commerce in the future.
65
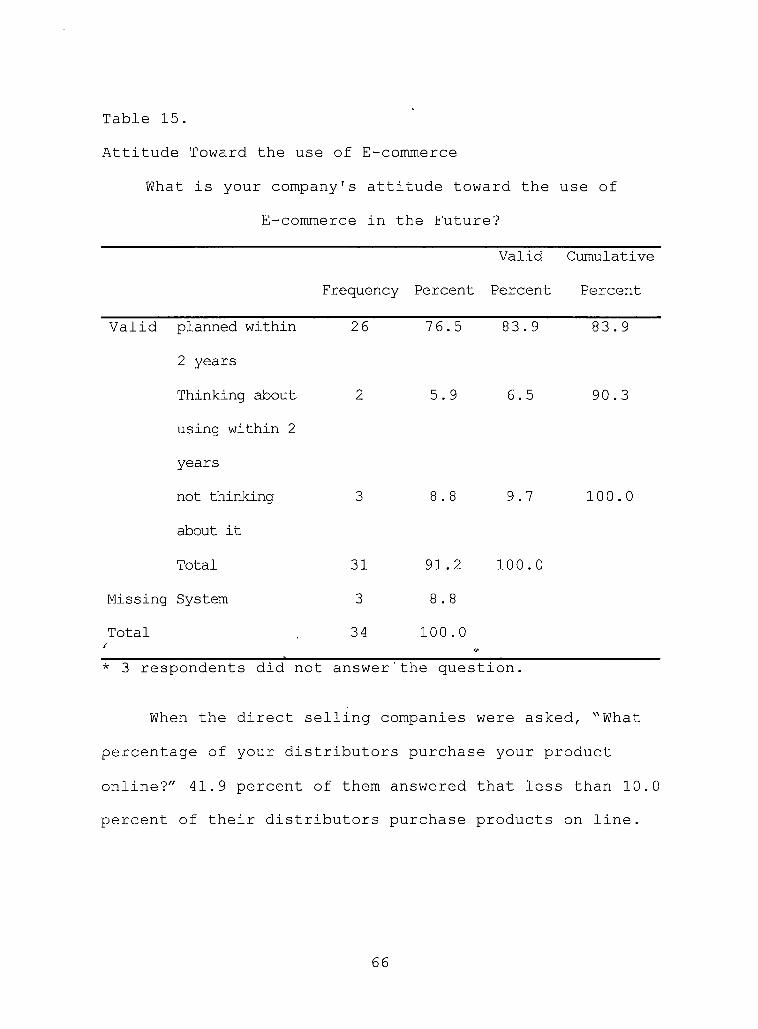
Table 15.
Attitude Toward the use of E-commerce
What is your company's attitude toward the use of
E-commerce in the Future?
Frequency Percent
Valid
Percent
Cumulative
Percent
Valid planned within 26 76.5 83.9 83.9
2 years
Thinking about 2 5.9 6.5 90.3
using within 2
years
not thinking 3 8 . 8 9.7 100.0
about it
Total 31 91.2 100.0
Missing System 3 8.8
Total 34 100.0
* 3 respondents did not answer’the question.
When the direct selling companies were asked, "What
percentage of your distributors purchase your product
online?" 41.9 percent of them answered that less than 10.0
percent of their distributors purchase products on line.
66
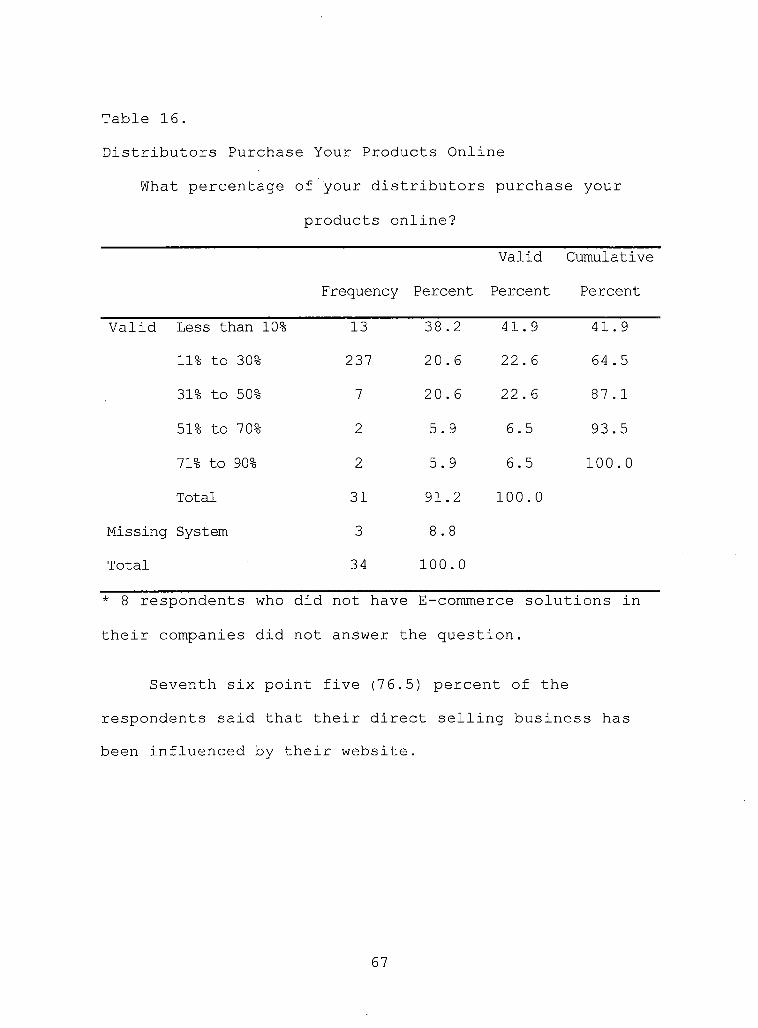
Table 16.
Distributors Purchase Your Products Online
What percentage of your■distributors purchase your
products online?
Valid Cumulative
Frequency Percent Percent Percent
Valid Less than 10% 13 38.2 41.9 41.9
11% to 30% 237 20.6 22.6 64.5
31% to 50% 7 20.6 22.6 87.1
51% to 70% 2 5.9 6.5 93.5
71% to 90% 2 5.9 6.5 100.0
Total 31 91.2 100.0
Missing System 3 8 . 8
Total 34 100.0
* 8 respondents who did not have E-commerce solutions in
their companies did not answer the question.
Seventh six point five (76.5) percent of the
respondents said that their direct selling business has
been influenced by their website.
67
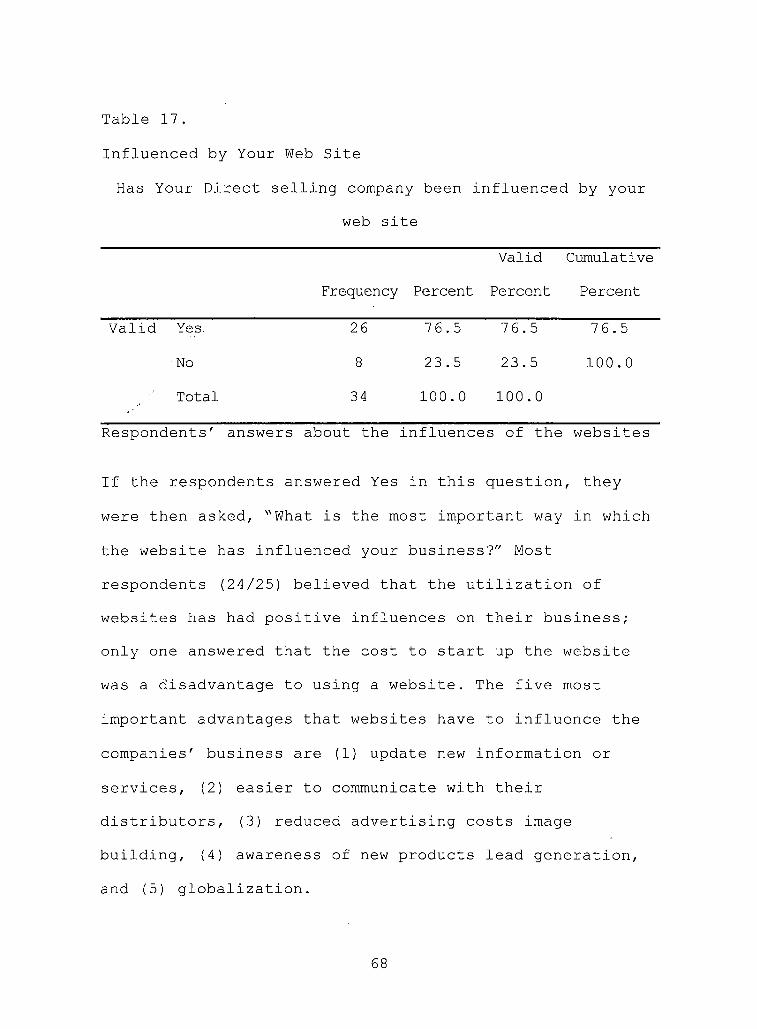
Table 17.
Influenced by Your Web Site
Has Your Direct selling company been influenced by your
web site
Frequency Percent
Valid
Percent
Cumulative
Percent
Valid Yes. 26 76.5 76.5 76.5
■ No 8 23.5 23.5 100.0
Total 34 100.0 100.0
Respondents' answers about the influences of the websites
If the respondents answered Yes in this question, they
were then asked, "What is the most important way in which
the website has influenced your business?" Most
respondents (24/25) believed that the utilization of
websites has had positive influences on their business;
only one answered that the cost to start up the website
was a disadvantage to using a website. The five most
important advantages that websites have to influence the
companies' business are (1) update new information or
services, (2) easier to communicate with their
distributors, (3) reduced advertising costs image
building, (4) awareness of new products lead generation,
and (5) globalization.
68
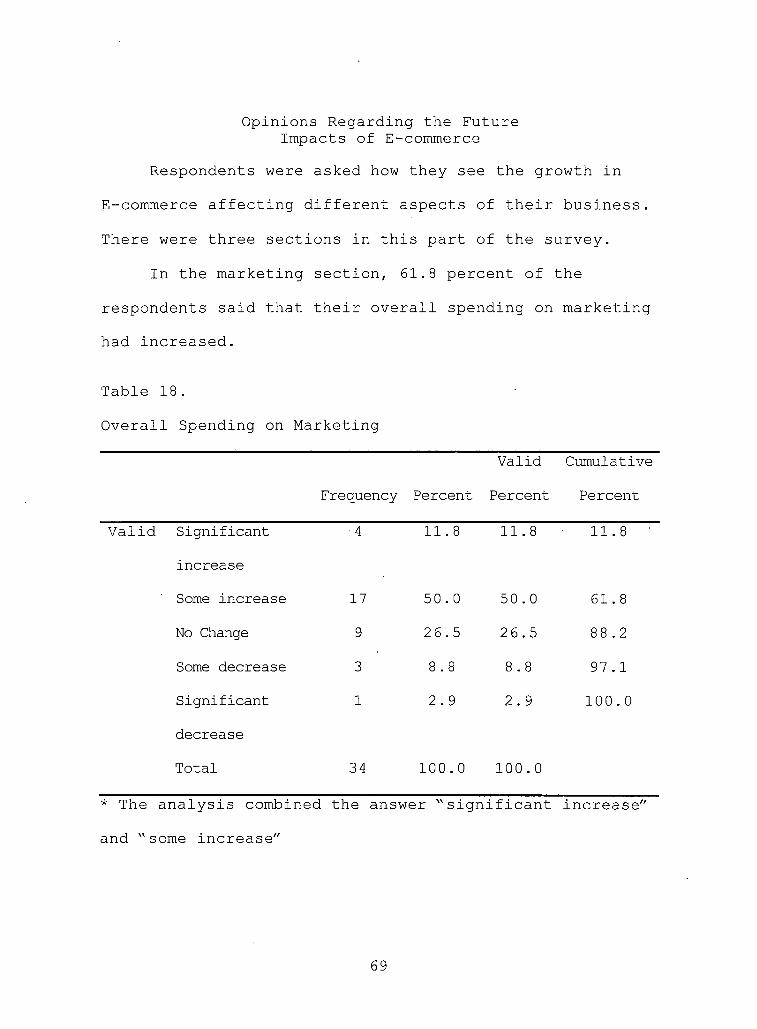
Opinions Regarding the Future Impacts of E-commerce
Respondents were asked how they see the growth in
E-commerce affecting different aspects of their business.
There were three sections in this part of the survey.
In the marketing section, 61.8 percent of the
respondents said that their overall spending on marketing
had increased.
Table 18.
Overall Spending on Marketing
Frequency Percent
Valid
Percent
Cumulative
Percent
Valid Significant ■4 11.8 11.8 11.8
increase
Some increase 17 50.0 50.0 61.8
No Change 9 2 6.5 26.5 88.2
Some decrease 3 8.8 8 . 8 97,1
Significant 1 2.9 2.9 100.0
decrease
Total 34 100.0 100.0
* The analysis combined the answer "significant increase"
and "some increase"
69
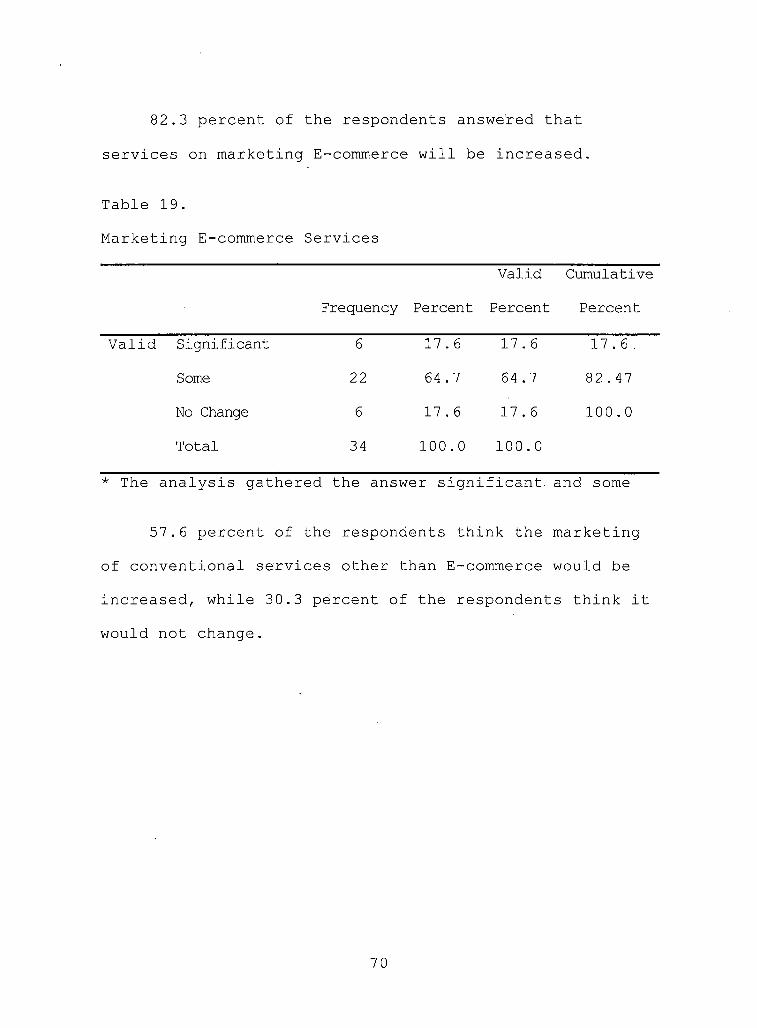
82.3 percent of the respondents answered that
services on marketing E-commerce will be increased.
Table 19.
Marketing E-commerce Services
Frequency Percent
Valid
Percent
Cumulative
Percent
Valid Significant 6 17.6 17.6 17.6.
Some 22 64.7 64.7 82.47
No Change 6 17.6 17.6 100.0
Total 34 100.0 100.0
* The analysis gathered the answer significant, and some
57.6 percent of the respondents think the marketing
of conventional services other than E-commerce would be
increased, while 30.3 percent of the respondents think it
would not change.
70
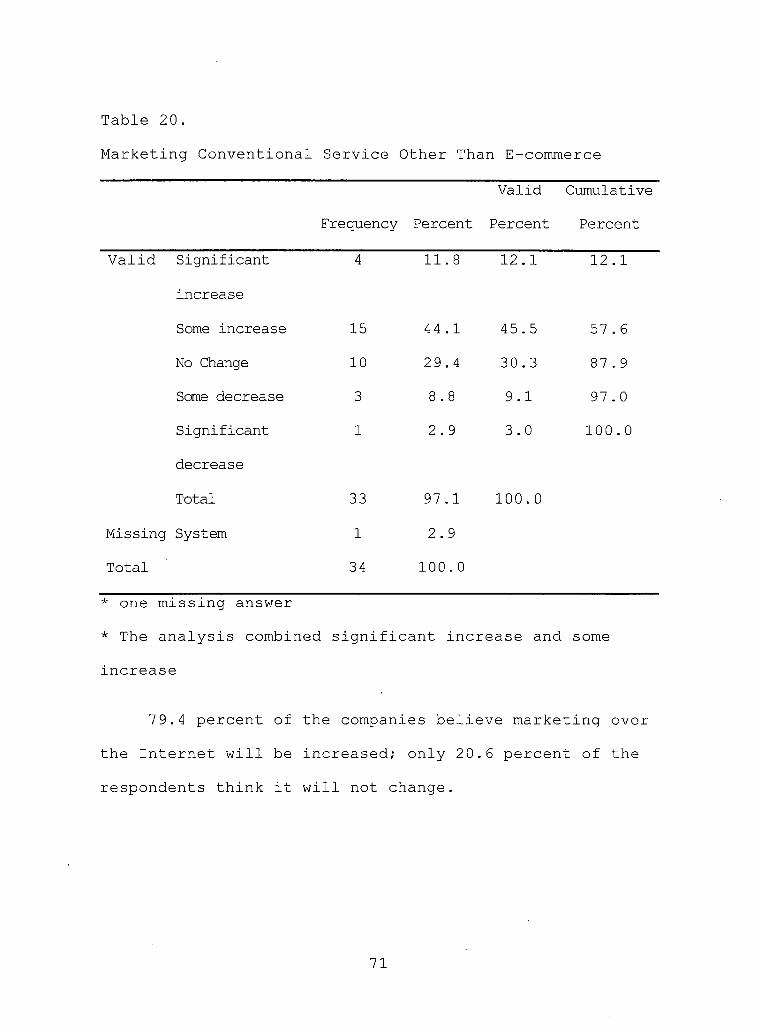
Table 20.
Marketing Conventional Service Other Than E-commerce
Frequency Percent
Valid
Percent
Cumulative
Percent
Valid Significant 4 11.8 12.1 12.1
increase
Some increase 15 44.1 45.5 57.6
No Change 10 29.4 30.3 87 . 9
Some decrease 3 8 . 8 9.1 97.0
Significant 1 2.9 3.0 100.0
decrease
Total 33 97.1 100.0
Missing System 1 2.9
Total 34 100.0
* one missing answer
* The analysis combined significant increase and some
increase
79.4 percent of the companies believe marketing over
the Internet will be increased; only 20.6 percent of the
respondents think it will not change.
71
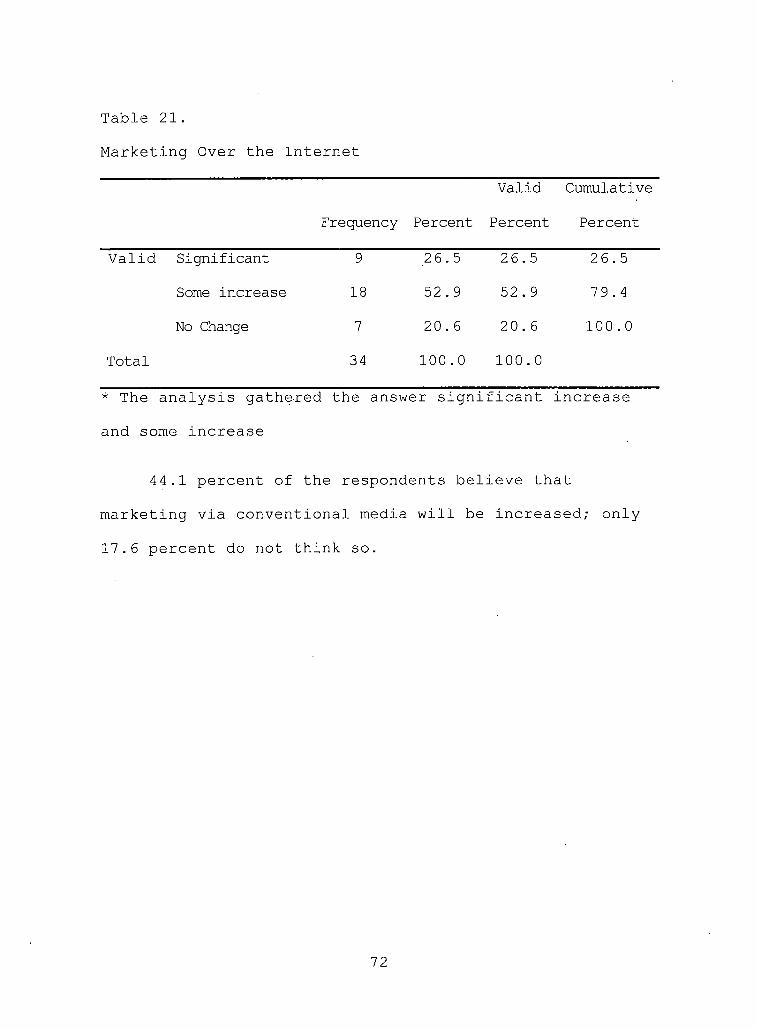
Table 21.
Marketing Over the Internet
Frequency Percent
Valid
Percent
Cumulative
Percent
Valid Significant 9 2 6.5 26.5 26.5
Some increase 18 52.9 52.9 79.4
No Change 7 20.6 20.6 100.0
Total 34 100.0 100.0
* The analysis gathered the answer significant increase
and some increase
44.1 percent of the respondents believe that
marketing via conventional media will be increased; only
17.6 percent do not think so.
72
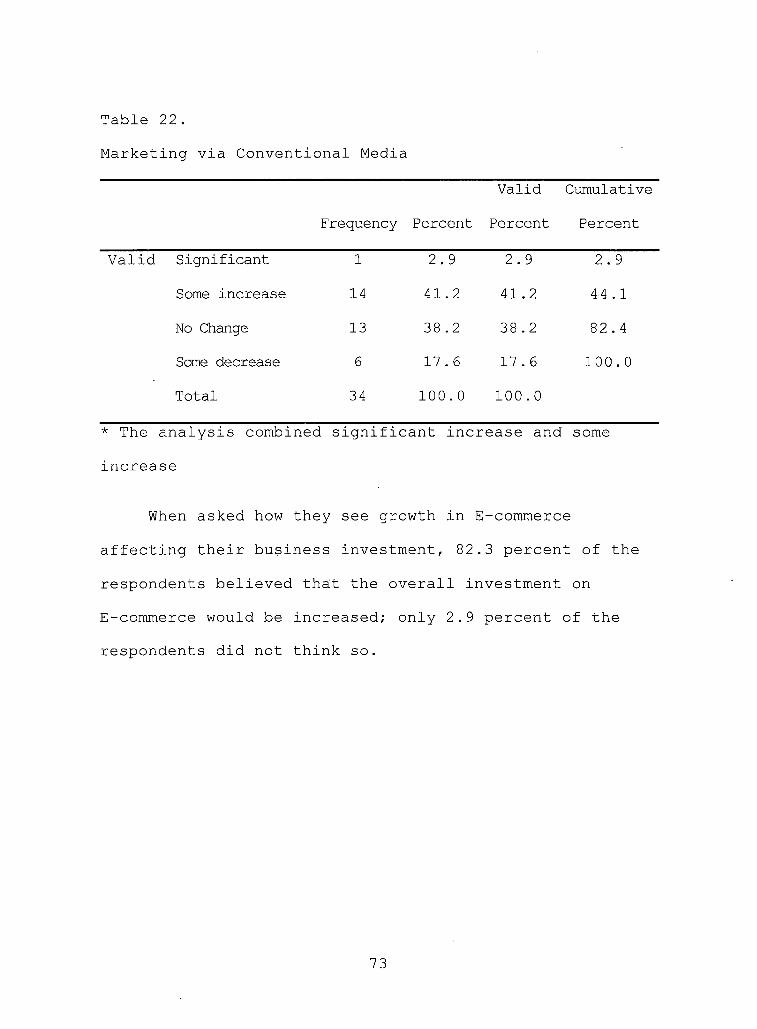
Table 22.
Marketing via Conventional Media
Frequency Percent
Valid
Percent
Cumulative
Percent
Valid Significant 1 2.9 2.9 2.9
Some increase 14 41.2 41.2 4-4.1
No Change 13 38.2 38.2 82.4
Some decrease 6 17.6 17.6 100.0
Total 34 100.0 100.0
* The analysis combined significant increase and some
increase
When asked how they see growth in E-commerce
affecting their business investment, 82.3 percent of the
respondents believed that the overall investment on
E-commerce would be increased; only 2.9 percent of the
respondents did not think so.
73
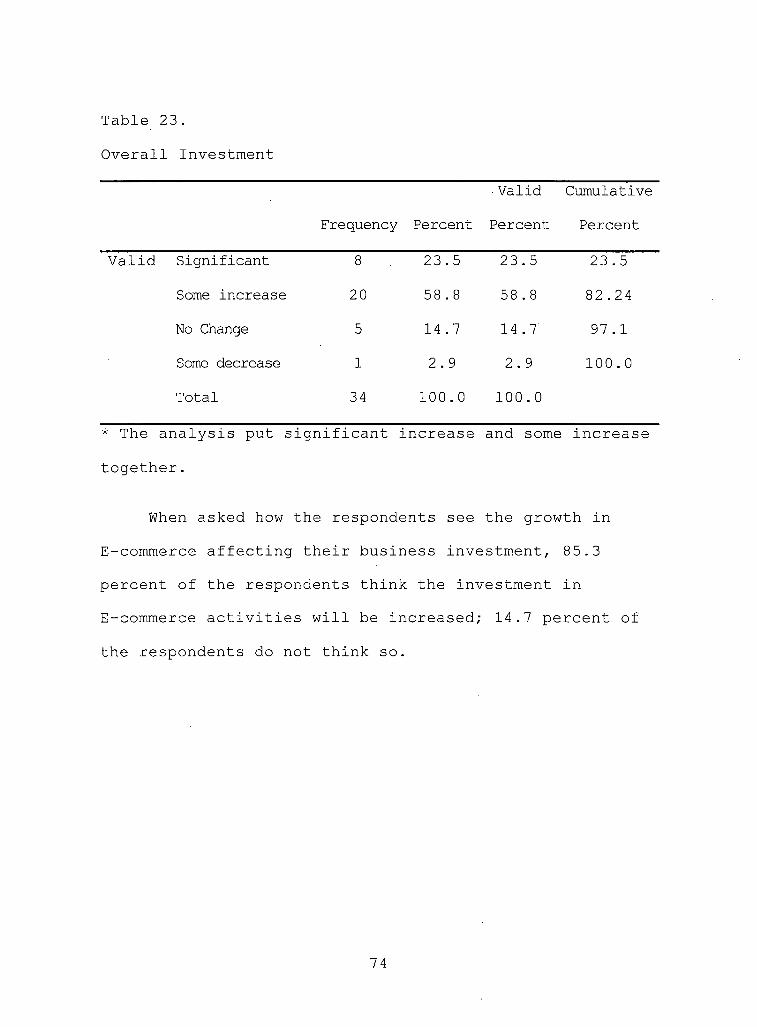
Table 23.
Overall Investment
Frequency Percent
■ Valid
Percent
Cumulative
Percent
Valid Significant 8 23.5 23.5 23.5
Some increase 20 58.8 58.8 82.24
No Change 5 14.7 14.7 97.1
Some decrease 1 2.9 2.9 100.0
Total 34 100.0 100.0
* The analysis put significant increase and some increase
together.
When asked how the respondents see the growth in
E-commerce affecting their business investment, 85.3
percent of the respondents think the investment in
E-commerce activities will be increased; 14.7 percent of
the respondents do not think so.
7 4
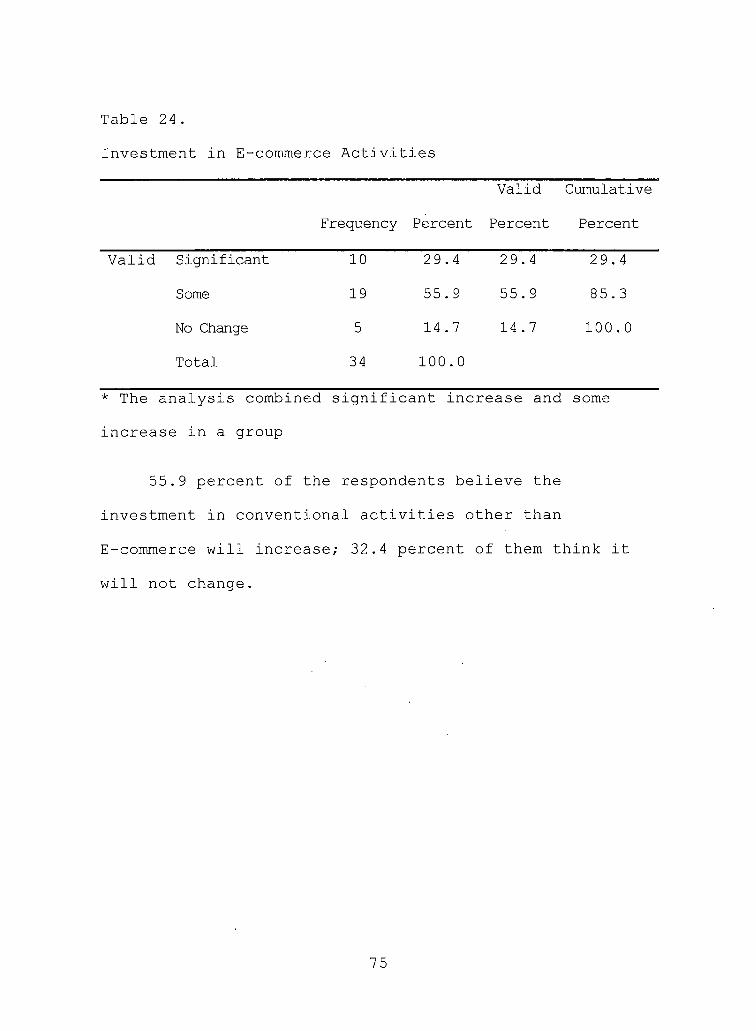
Table 24.
Investment in E-commerce Activities
Frequency Percent
Valid
Percent
Cumulative
Percent
Valid Significant 10 29.4 29.4 29.4
Some 19 55.9 55.9 85.3
No Change 5 14.7 14.7 100.0
Total 34 100.0
* The analysis combined significant increase and some
increase in a group
55.9 percent of the respondents believe the
investment in conventional activities other than
E-commerce will increase; 32.4 percent of them think it
will not change.
75
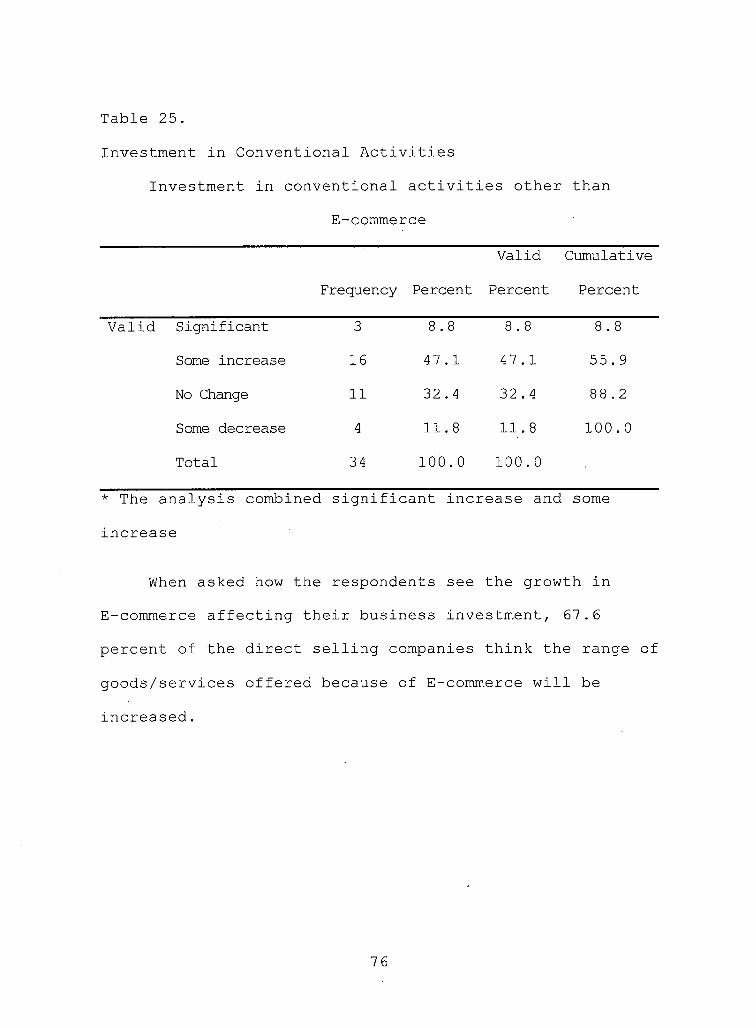
Table 25.
Investment in Conventional Activities
Investment in conventional activities other than
E-commerce
Frequency Percent
Valid
Percent
Cumulative
Percent
Valid Significant 3 8 . 8 8.8 8.8
Some increase 16 47.1 47.1 55.9
No Change 11 32.4 32.4 88.2
Some decrease 4 11.8 11.8 100.0
Total 34 100.0 100.0
* The analysis combined significant increase and some
increase
When asked how the respondents see the growth in
E-commerce affecting their business investment, 67.6
percent of the direct selling companies think the range of
goods/services offered because of E-commerce will be
increased.
76
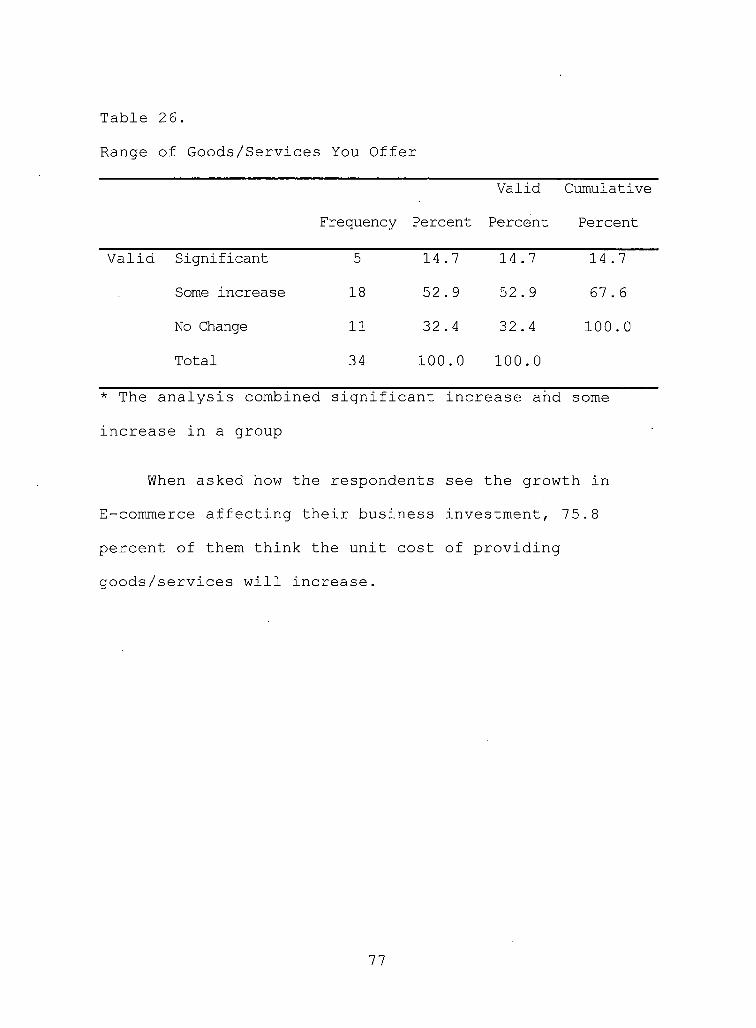
Table 26.
Range of Goods/Services You Offer
Frequency Percent
Valid
Percent
Cumulative
Percent
Valid Significant 5 14.7 14.7 14.7
Some increase 18 52.9 52.9 67.6
No Change 11 32.4 32.4 100.0
Total 34 100.0 100.0
* The analysis combined significant increase and some
increase in a group
When asked how the respondents see the growth in
E-commerce affecting their business investment, 75.8
percent of them think the unit cost of providing
goods/services will increase.
77
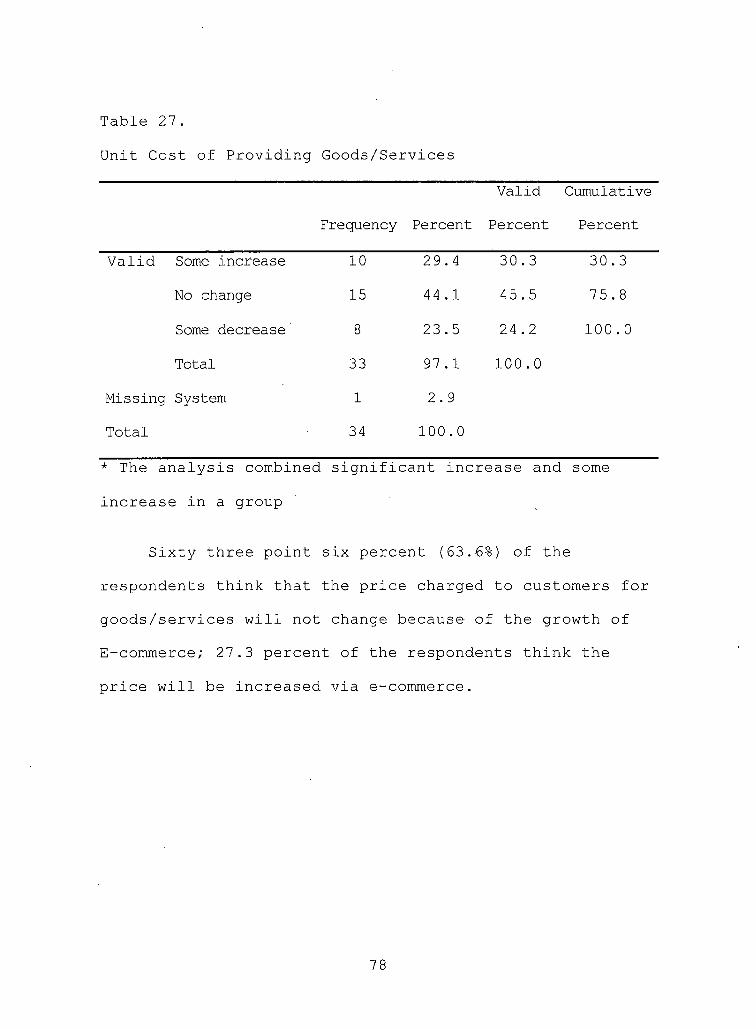
Table 27.
Unit Cost of Providing Goods/Services
Frequency Percent
Valid
Percent
Cumulative
Percent
Valid Some increase 10 29.4 30.3 30.3
No change 15 44.1 45.5 75.8
Some decrease 8 23.5 24.2 100.0
Total 33 97.1 100.0
Missing System 1 2.9
Total 34 100.0
* The analysis combined significant increase and some
increase in a group
Sixty three point six percent (63.6%) of the
respondents think that the price charged to customers for
goods/services will not change because of the growth of
E-commerce; 27.3 percent of the respondents think the
price will be increased via e-commerce.
78
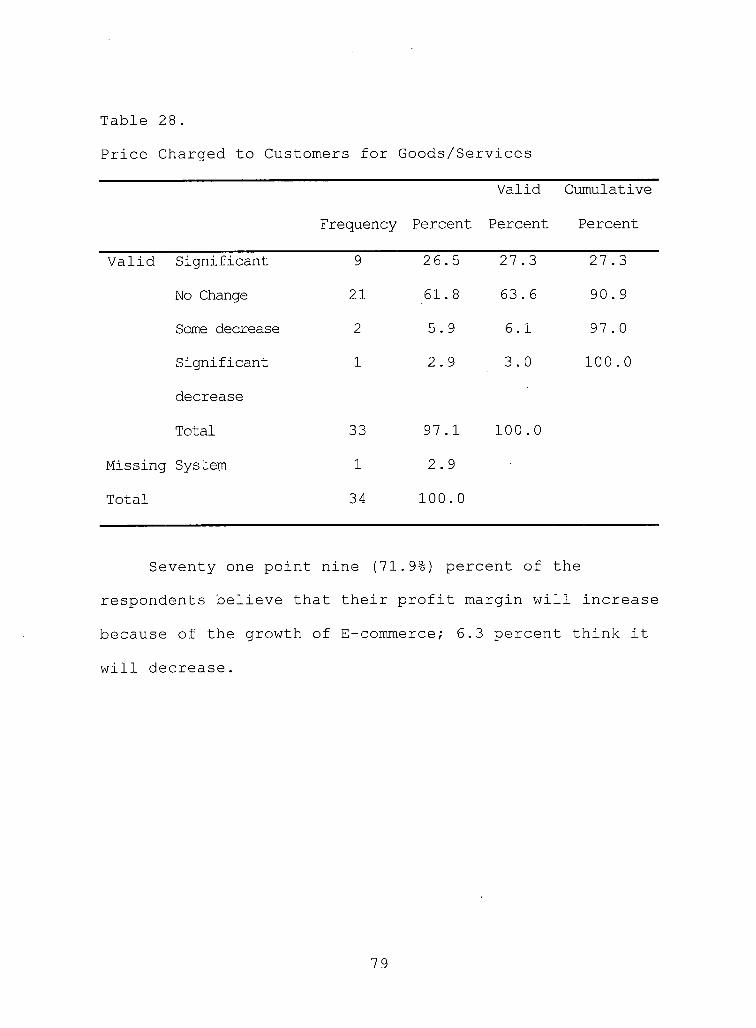
Table 28.
Price Charged to Customers for Goods/Services
Frequency Percent
Valid
Percent
Cumulative
Percent
Valid Significant 9 26.5 27.3 27.3
No Change 21 61.8 63.6 90.9
Some decrease 2 5.9 6.1 97.0
Significant 1 2.9 3.0 100.0
decrease
Total 33 97.1 100.0
Missing System 1 2.9
Total 34 100.0
Seventy one point nine (71.9%) percent of the
respondents believe that their profit margin will increase
because of the growth of E-commerce; 6.3 percent think it
will decrease.
79
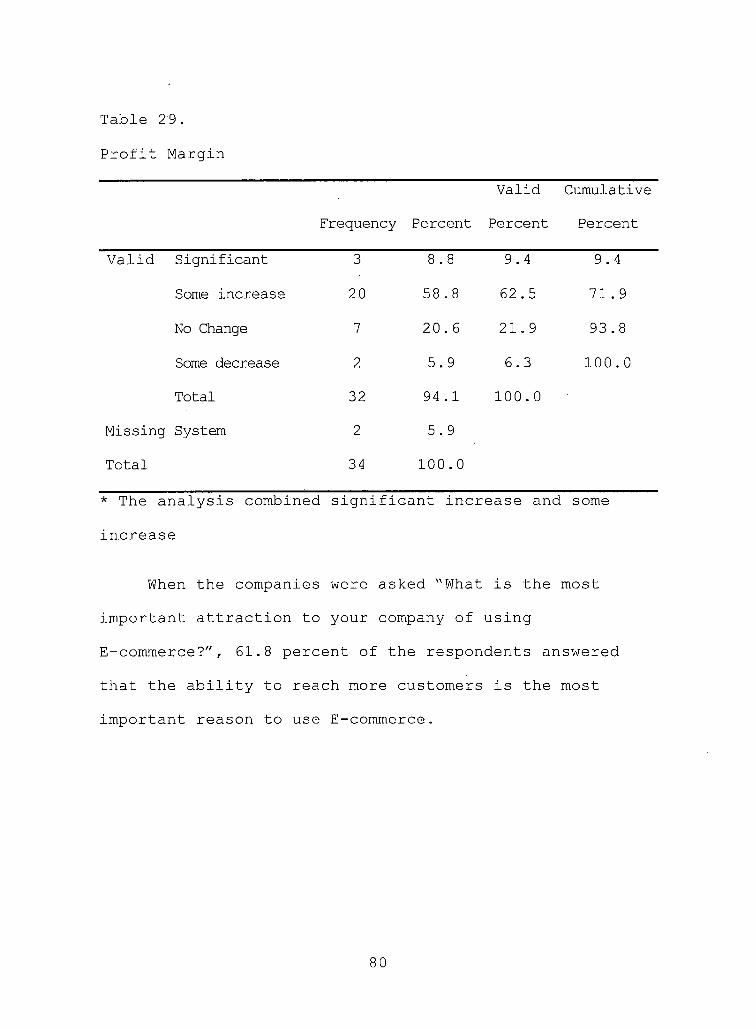
Table 29.
Profit Margin
Frequency Percent
Valid
Percent
Cumulative
Percent
Valid Significant 3 8 . 8 9.4 9.4
Some increase 2 0 58.8 62.5 71.9
No Change 7 20.6 21.9 93.8
Some decrease 2 5.9 6.3 100.0
Total 32 94.1 100.0
Missing System 2 5.9
Total 34 100.0
* The analysis combined significant increase and some
increase
When the companies were asked "What is the most
important attraction to your company of using
E-commerce?", 61.8 percent of the respondents answered
that the ability to reach more customers is the most
important reason to use E-commerce.
80
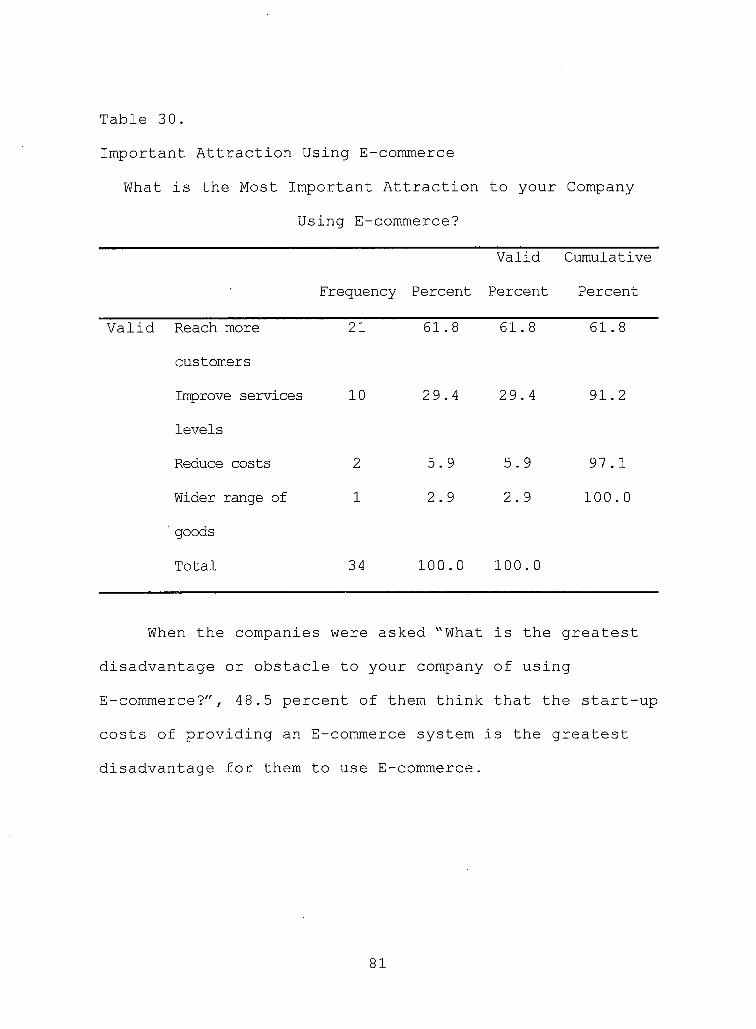
Table 30.
Important Attraction Using E-commerce
What is the Most Important Attraction to your Company
Using E-commerce?
Frequency Percent
Valid
Percent
Cumulative
Percent
Valid Reach more 21 61.8 61.8 61.8
customers
Improve services 10 29.4 29.4 91.2
levels
Reduce costs 2 5.9 5.9 97.1
Wider range of 1 2.9 2.9 100.0
' goods
Total 34 100.0 100.0
When the companies were asked "What is the greatest
disadvantage or obstacle to your company of using
E-commerce?", 48.5 percent of them think that the start-up
costs of providing an E-commerce system is the greatest
disadvantage for them to use E-commerce.
81
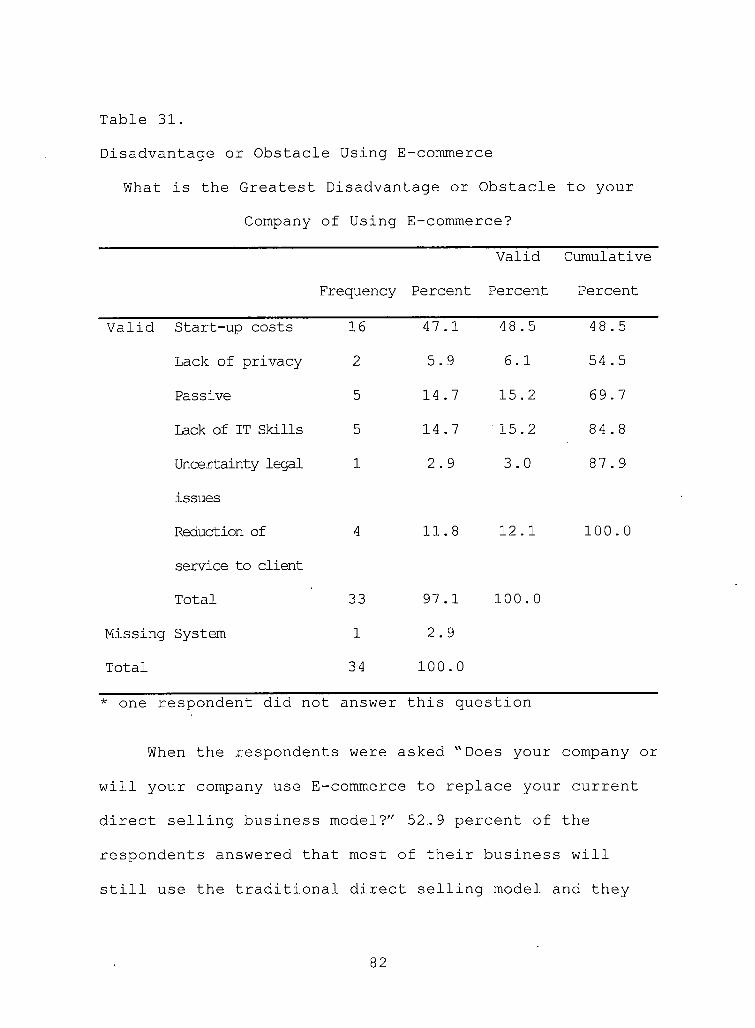
Table 31.
Disadvantage or Obstacle Using E-commerce
What is the Greatest Disadvantage or Obstacle to your
Company of Using E-commerce?
Frequency Percent
Valid
Percent
Cumulative
Percent
Valid Start-up costs 16 47.1 48.5 48.5
Lack of privacy 2 5.9 6.1 54.5
Passive 5 14.7 15.2 69.7
Lack of IT Skills 5 14.7 15.2 84 . 8
Uncertainty leqal 1 2.9 3.0 87.9
issues
Reduction of 4 11.8 12.1 100.0
service to client
Total 33 97.1 100.0
Missinq System 1 2.9
Total 34 100.0
* one respondent did not answer this question
When the respondents were asked "Does your company or
will your company use E-commerce to replace your current
direct sellinq business model?" 52.. 9 percent of the
respondents answered that most of their business will
still use the traditional direct sellinq model and they
82
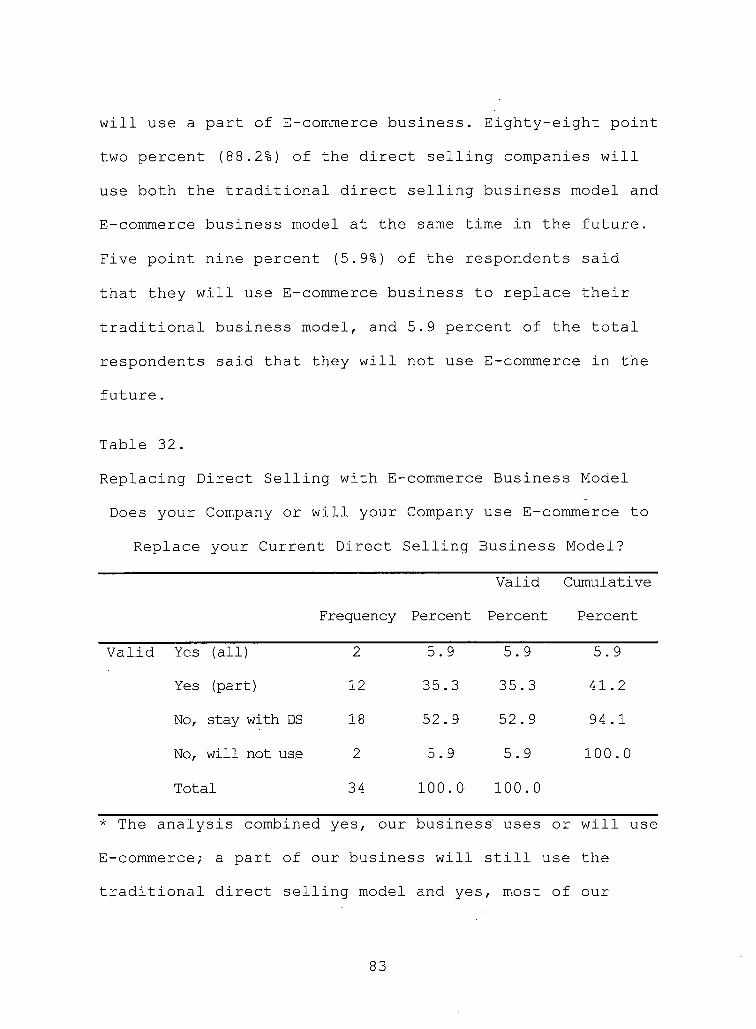
will use a part of E-commerce business. Eighty-eight point
two percent (88.2%) of the direct selling companies will
use both the traditional direct selling business model and
E-commerce business model at the same time in the future.
Five point nine percent (5.9%) of the respondents said
that they will use E-commerce business to replace their
traditional business model, and 5.9 percent of the total
respondents said that they will not use E-commerce in the
future.
Table 32.
Replacing Direct Selling with E-commerce Business Model
Does your Company or will your Company use E-commerce to
Replace your Current Direct Selling Business Model?
Valid Cumulative
Frequency Percent Percent Percent
Valid Yes (all) 2 5.9 5.9 5.9
Yes (part) 12 35.3 35.3 41.2
No, stay with DS 18 52.9 52.9 94.1
No, will not use 2 5.9 5.9 100.0
Total 34 100.0 100.0
* The analysis combined yes, our business' uses or will use
E-commerce; a part of our business will still use the
traditional direct selling model and yes, most of our
83
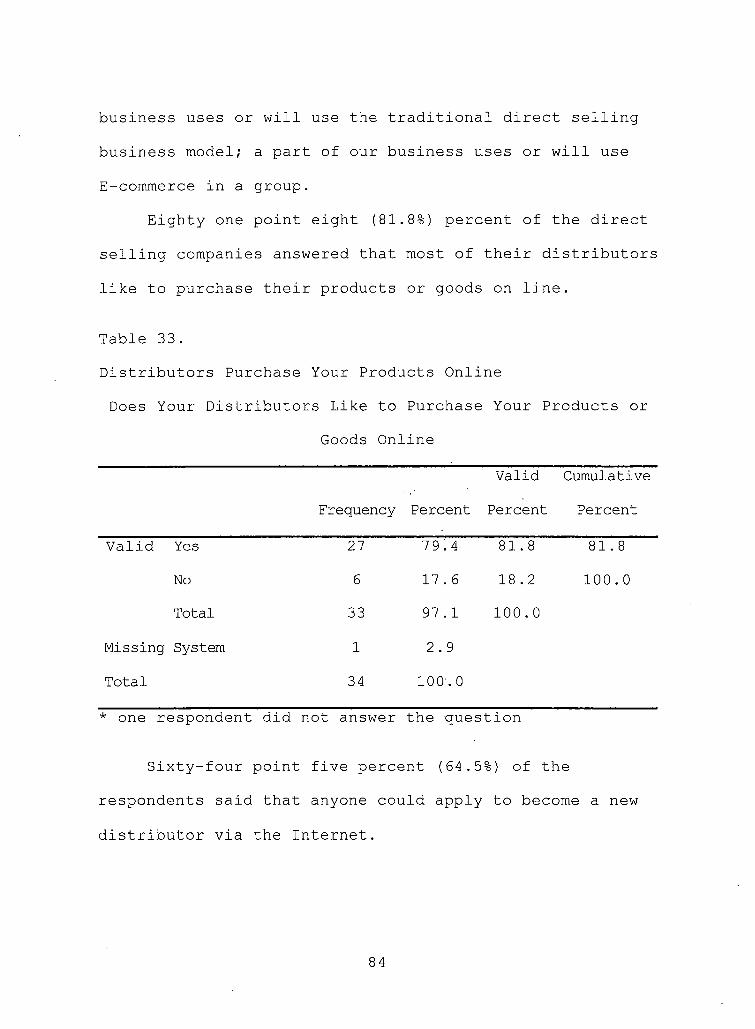
business uses or will use the traditional direct selling
business model; a part of our business uses or will use
E-commerce in a group.
Eighty one point eight (81.8%) percent of the direct
selling companies answered that most of their distributors
like to purchase their products or goods on line.
Table 33.
Distributors Purchase Your Products Online
Does Your Distributors Like to Purchase Your Products or
Goods Online
Frequency Percent
Valid
Percent
Cumulative
Percent
Valid Yes 27 79.4 81.8 81.8
No 6 17.6 18.2 100.0
Total 33 97.1 100.0
Missing System 1 2.9
Total 34 100.0
* one respondent did not answer the question
Sixty-four point five percent (64.5%) of the
respondents said that anyone could apply to become a new
distributor via the Internet.
84
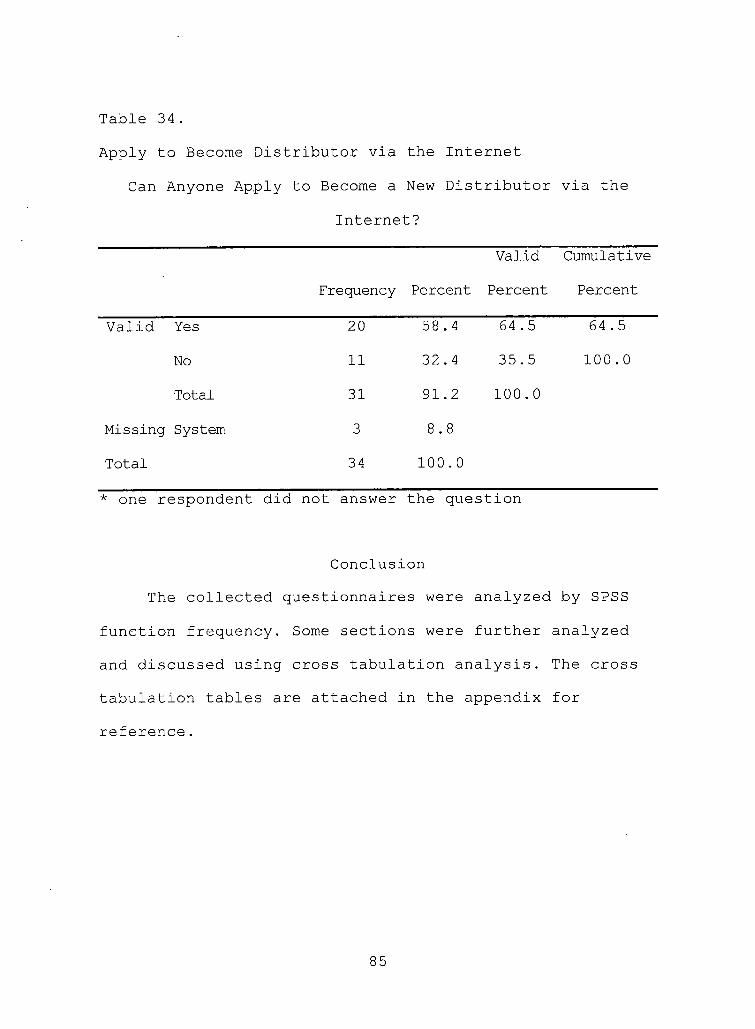
Table 34.
Apply to Become Distributor via the Internet
Can Anyone Apply to Become a New Distributor via the
Internet?
Frequency Percent
Valid
Percent
Cumulative
Percent
Valid Yes 20 58.4 64.5 64.5
No 11 32.4 35.5 100.0
Total 31 91.2 100.0
Missing System 3 8.8
Total 34 100.0
* one respondent did not answer the question
Conclusion
The collected questionnaires were analyzed by SPSS
function frequency. Some sections were further analyzed
and discussed using cross tabulation analysis. The cross
tabulation tables are attached in the appendix for
reference.
85
CHAPTER FIVECONCLUSIONS
Summary of the Results
Face-to-face selling is widely used in the direct
selling business model. Face-to-face selling is usually
presented two ways. One way is door-to-door or
person-to-person to sell the products or services. Another
way is to sell products through a group or class. Tangible
goods or intangible services are sold using the direct
selling business model. Based on the results of the
survey, the most common products or services that the
direct selling companies sell are personal care products,
wellness products, and services/miscellaneous. Most of
these companies have already planned to use E-commerce
within 2 years. Most of these direct selling companies'
distributors regularly use e-mail to communicate with
them, use the companies' websites often, and like to
purchase their products or services online.
When it comes to a discussion of the use of
E-commerce tools such as e-mail and website, those direct
selling companies which either regularly use e-mail to
communicate with their distributors or have their own
websites said that their distributors like to use
86
E-commerce tools to contact them and search information orpurchase online through their websites. The respondents
answered that the websites did increase the development of
recruiting new distributors. The ability to reach morecustomers is the main reason direct selling companies
develop their E-commerce business. However, start-up costs of providing E-commerce is an important reason for keeping them from developing E-commerce business.
Based on the survey results, fewer than fifty percent
of the total sales of direct selling companies that use E-commerce were a result of E-commerce. In this way, the
development of E-commerce in the direct selling industryis not fully developed yet. Direct selling companies thathave an E-commerce solution are more willing to increaseinvestment in marketing on E-commerce activities and in
other related areas. They believed that their profit
margins will increase because of the development ofE-commerce business. Those who do not allow theirdistributors to purchase online are afraid of causingchannel conflict, but they still have a positive attitude
toward the development of E-commerce business.
Most of the direct selling companies have planned to
develop their E-commerce business in the near future toattract more customers. Most of the companies think that
87
their distributors like to purchase their products or
.services online. Most of the companies that would like to
develop E-commerce business think this would increase the
range of goods and would not increase prices charged to
customers. Once they increase their E-commerce business,
they will allow their customers not 'only to purchase
online, but anyone can apply to become a new member-via
the Internet. Respondents are confident regarding
E-commerce business.
When the direct selling companies agree to develop
E-commerce business or to maintain the current traditional
direct selling business model, the advantages and
disadvantages of both models are of concern. To determine
the efficacy of E-commerce, companies will need to compare
sales prior to and after the implementation of E-'commerce.
Customers' needs come first for the direct selling
companies.
There are two major results of the survey. One is
most of the direct selling companies are confident about
the future trend of the development of E-commerce and are
planning to increase their E-commerce business. Another
major finding is that most respondents feel that most of
their business will still operate using traditional direct
selling model. This is maybe because the E-commerce
88
business is not fully developed currently in the direct
selling industry. Only a few businesses will replace with
an E-commerce business model. Most direct selling
companies will use the two business models in the future.
Summary of the Hypotheses Testing
Four hypotheses were used in the study. Below the
survey results are examined to test the hypotheses.
1. Most direct selling companies will or have used
E-commerce tools such as e-mail or websites to
communicate with their distributors and
customers. According to the results, 70.6
percent of the respondents answered that they
regularly use e-mail to communicate with their
distributors, and 72.0 percent of the
respondents said that their distributors prefer
to use e-mail rather than traditional
communications. In addition, 94.1 percent of the
direct selling companies have their own
websites, and 66.6 percent of the respondents
said that their distributors often use their
website. In addition, 76.5 percent of the
respondents said that their businesses have been
influenced by their websites, and 73.5 percent
89
of the respondents answered that the use of the
websites had increased the development of new
customers for the company and the distributors.
2. The distributors would prefer to use e-mail and
websites rather than traditional communications.
Based on the results, there is a high use of
e-mail, and 56.0 percent of the respondents
answered that they have reduced their use of
other communications mediums. When the
respondents were asked about how they see the
future of the growth of e-commerce, 79.4 percent
of the respondents think they would increase
investment in marketing over the Internet that
includes investment in advertising via the
Internet.
3. Direct selling companies' attitudes toward using
E-commerce should be positive; and they will
develop their E-commerce business. So their
distributors can purchase online. However, the
E-commerce business will not replace the whole
direct selling business model. Most respondents
were confident of the future of E-commerce
business. For example, 71.9 percent of the
respondents believed that their profit margins
90
will increase because of the development of
E-commerce business.
4. Most direct selling companies will be willing to
invest in developing both E-commerce services
and E-commerce technology. Based on the
frequency analysis, 82.3 percent of the
respondents are willing to investment in
marketing E-commerce services; 79.4 percent of
the direct selling companies will increase
investment in marketing over the Internet. In
addition, 85.3 percent of the respondents said
that they would increase the investment in
E-commerce activities. Obviously, these
respondents think that investment in the
E-commerce services and technology is worth.
Implications and Applications for the Direct Selling
■ Companies Regarding the Impacts of
E-commerce
The following decision model may help the industry to
assess its concerns and assist in making decisions to
whether to develop an E-commerce solution, maintain the
current traditional direct selling model, or how to
91
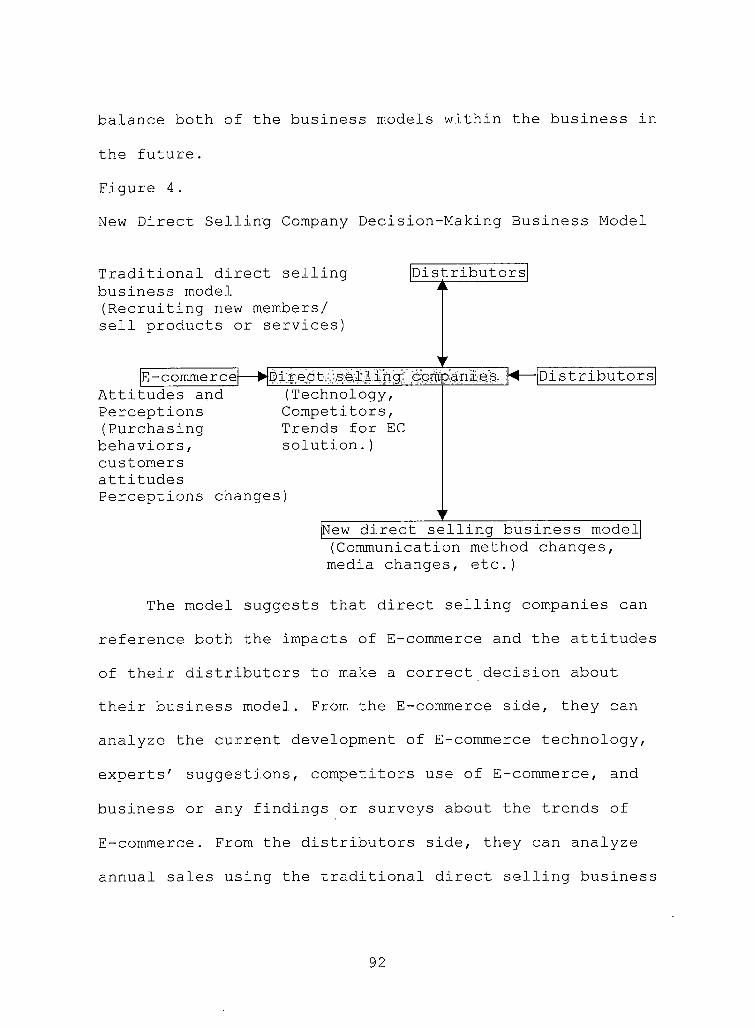
balance both of the business models within the business in
the future.
Figure 4.
New Direct Selling Company Decision-Making Business Model
Traditional direct selling business model (Recruiting new members/ sell products or services)
Distributors----- fc----------------
vE-commerce—► panies
Attitudes and (Technology,Perceptions Competitors,(Purchasing Trends for ECbehaviors, solution.)customersattitudesPerceptions changes)
Distributors
New direct selling business model (Communication method changes, media changes, etc.)
The model suggests that direct selling companies can
reference both the impacts of E-commerce and the attitudes
of their distributors to' make a correct decision about
their business model. From the E-commerce side, they can
analyze the current development of E-commerce technology,
experts' suggestions, competitors use of E-commerce, and
business or any findings or surveys about the trends of
E-commerce. From the distributors side, they can analyze
annual sales using the traditional direct selling business
92
model. Most importantly, they should keep in mind the
needs and attitudes of their distributors.
Based on the results of the survey, another
suggestion is that the industry might combine the
E-commerce business model and the traditional business
model. There are advantages to using both of the models.
With the development of E-commerce business, direct
selling companies can respond to customers' descries to
shop via the Internet. Companies can attract more
customers, not only from the United States, but from other
countries via the Internet. They can sell their products
and gain awareness worldwide via E-commerce business.
The use of E-commerce can maintain the companies lead >
position in the industry. Sales and reputation would be
increased because of E-commerce business. Companies can
update their products via the Internet and communicate
with their customers via e-mail anytime. This is
time-saving and more convenient communication. They can
reduce money on advertising via conventional mediums.
Finally, a combined model supports multi-level
marketing. MLM is the main structure of the direct selling
companies, and E-commerce technology assists and enhances
this structure.
93
Limitations
One major limitation to the study may be sample size.
The sample was relatively small which might present issues
of reliability. The list of members of the Direct Selling
Association was used for this survey. There were 110
companies on the survey list. Although 5 reminder letters
were sent, only thirty-four surveys were returned.
94

APPENDIX A
COMPANIES QUESTIONNAIRE
95
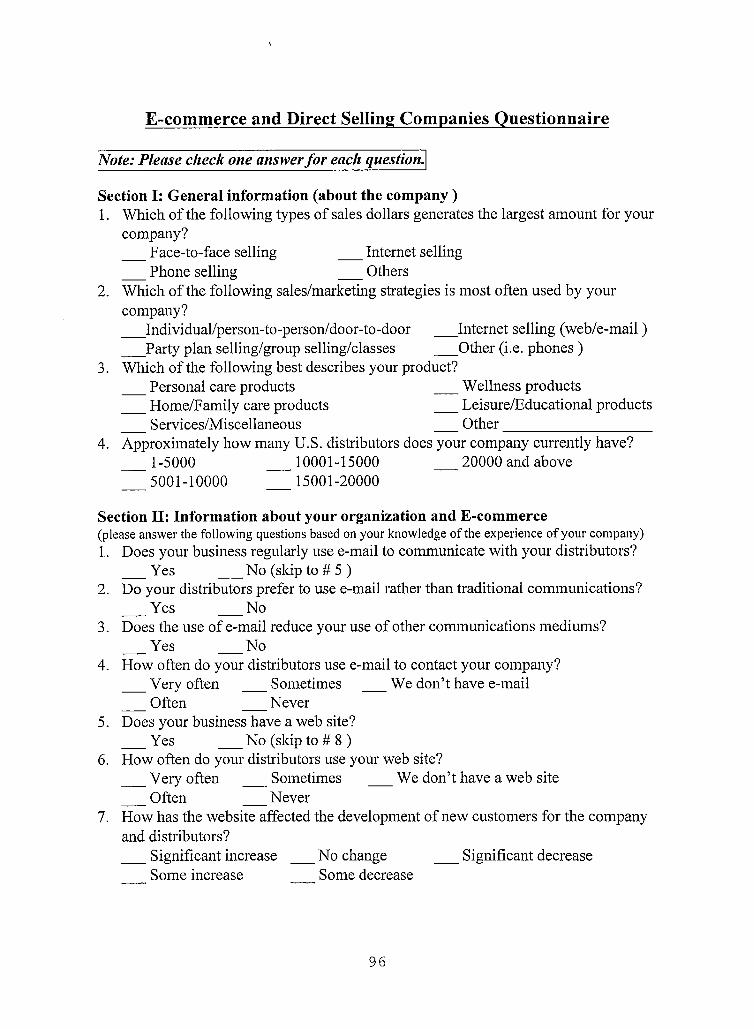
E-commerce and Direct Selling Companies Questionnaire
Note: Please check one answer for each question.
Section I: General information (about the company )1. Which of the following types of sales dollars generates the largest amount for your
company?___Face-to-face selling ___Internet selling___Phone selling ___Others
2. Which of the following sales/marketing strategies is most often used by your company?__ _Individual/person-to-person/door-to-door ___Internet selling (web/e-mail)___Party plan selling/group selling/classes ___Other (i.e. phones )
3. Which of the following best describes your product?___Personal care products ___Wellness products___Home/Family care products ___Leisure/Educational products___Services/Miscellaneous ___Other___________________
4. Approximately how many U.S. distributors does your company currently have?___ 1-5000 ___ 10001-15000 ___20000 and above___5001-10000 ___ 15001-20000
Section II: Information about your organization and E-commerce(please answer the following questions based on your knowledge of the experience of your company)1. Does your business regularly use e-mail to communicate with your distributors?
___Yes ___ No (skip to # 5 )2. Do your distributors prefer to use e-mail rather than traditional communications?
___Yes ___ No3. Does the use of e-mail reduce your use of other communications mediums?
Yes ___No4. How often do your distributors use e-mail to contact your company?
___Very often ___ Sometimes ___ We don’t have e-mail___Often ___Never
5. Does your business have a web site?___Yes ___ No (skip to # 8 )
6. How often do your distributors use your web site?___Very often ___ Sometimes ___ We don’t have a web site___Often ___Never
7. How has the website affected the development of new customers for the company and distributors?___Significant increase ___ No change __ _ Significant decrease
Some increase Some decrease
96
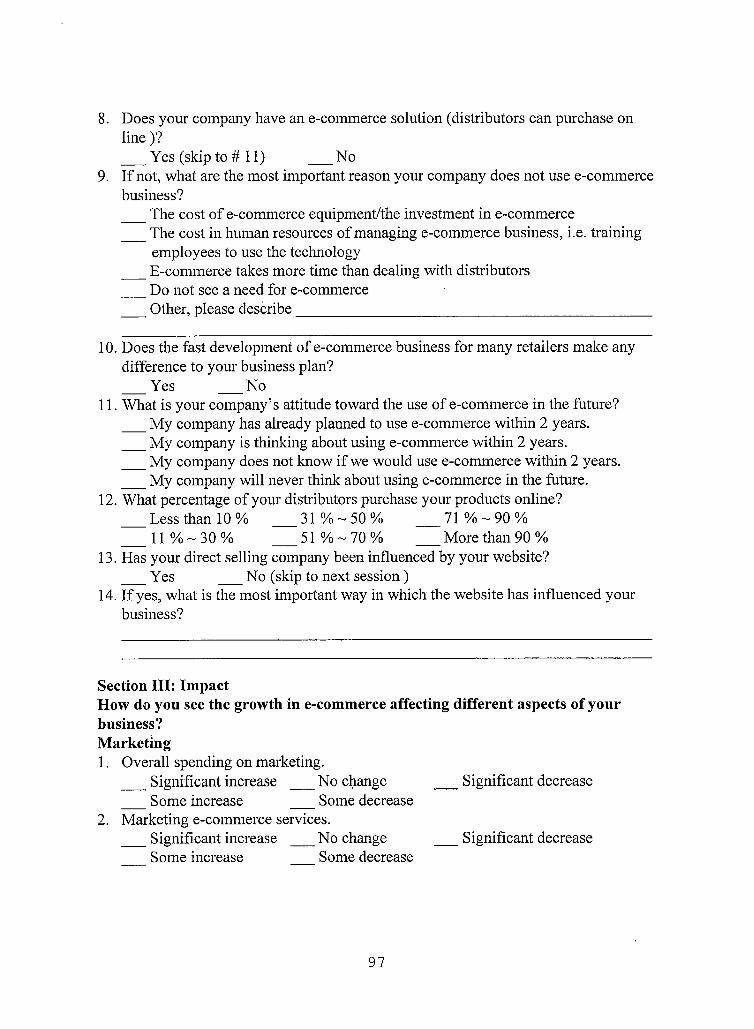
8. Does your company have an e-commerce solution (distributors can purchase on line)?___Yes (skip to # 11) ___No
9. If not, what are the most important reason your company does not use e-commerce business?___The cost of e-commerce equipment/the investment in e-commerce___The cost in human resources of managing e-commerce business, i.e. training
employees to use the technology___E-commerce takes more time than dealing with distributors___Do not see a need for e-commerce___Other, please describe_____________________________________________
10. Does the fast development of e-commerce business for many retailers make any difference to your business plan?___Yes ___ No
11. What is your company’s attitude toward the use of e-commerce in the future?___My company has already planned to use e-commerce within 2 years.___My company is thinking about using e-commerce within 2 years.___My company does not know if we would use e-commerce within 2 years.___My company will never think about using e-commerce in the future.
12. What percentage of your distributors purchase your products online?___LessthanlO% ___ 31%~50% ___71%~90%___11 % ~ 30 % ___51 %~70% ___More than 90%
13. Has your direct selling company been influenced by your website?___Yes ___ No (skip to next session )
14. If yes, what is the most important way in which the website has influenced your business?
Section III: ImpactHow do you see the growth in e-commerce affecting different aspects of your business?Marketing1. Overall spending on marketing.
___Significant increase ___ No change ___ Significant decrease___Some increase __ _ Some decrease
2. Marketing e-commerce services.___Significant increase ___ No change ___ Significant decrease
Some increase Some decrease
97
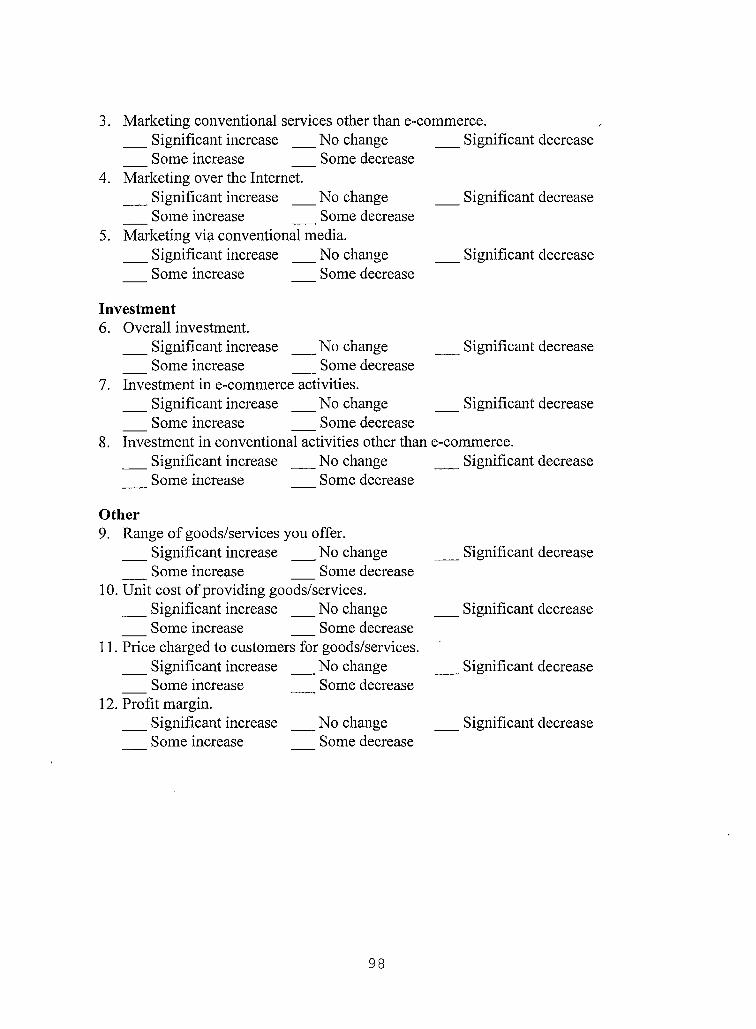
3. Marketing conventional services other than e-commerce.___Significant increase ___ No change ___ Significant decrease___Some increase ___ Some decrease
4. Marketing over the Internet.___Significant increase ___ No change ___ Significant decrease___Some increase ___ Some decrease
5. Marketing via conventional media.___Significant increase ___ No change ___ Significant decrease___Some increase ___ Some decrease
Investment6. Overall investment.
___Significant increase ___ No change ___ Significant decrease___Some increase ___ Some decrease
7. Investment in e-commerce activities.___Significant increase __ No change ___ Significant decrease___Some increase ___ Some decrease
8. Investment in conventional activities other than e-commerce.___Significant increase ___ No change ___ Significant decrease
Some increase Some decrease
Other9. Range of goods/services you offer.
___Significant increase ___ No change___Some increase ___ Some decrease
10. Unit cost of providing goods/services.___Significant increase ___ No change___Some increase ___ Some decrease
11. Price charged to customers for goods/services.___Significant increase ___ No change___Some increase ___ Some decrease
12. Profit margin.___Significant increase ___ No change
Some increase Some decrease
Significant decrease
Significant decrease
Significant decrease
Significant decrease
98
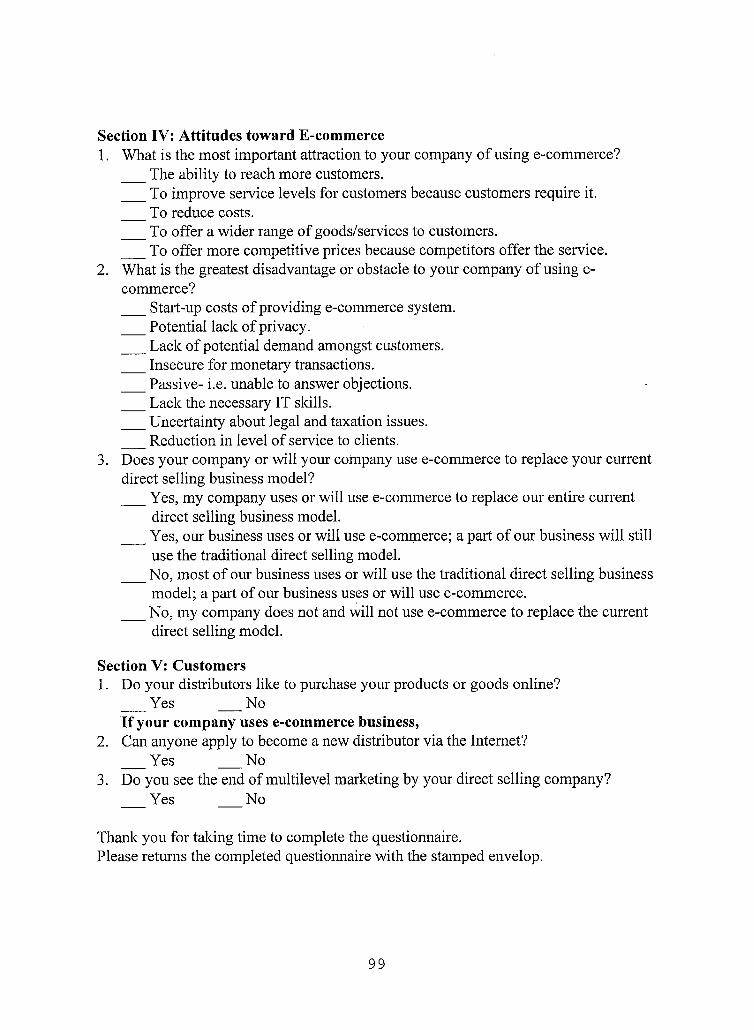
Section IV: Attitudes toward E-commerce1. What is the most important attraction to your company of using e-commerce?
___The ability to reach more customers.___To improve service levels for customers because customers require it.___To reduce costs.___To offer a wider range of goods/services to customers.___To offer more competitive prices because competitors offer the service.
2. What is the greatest disadvantage or obstacle to your company of using e- commerce?___Start-up costs of providing e-commerce system.___Potential lack of privacy.___Lack of potential demand amongst customers.___Insecure for monetary transactions.___Passive- i.e. unable to answer objections.___Lack the necessary IT skills.___Uncertainty about legal and taxation issues.___Reduction in level of service to clients.
3. Does your company or will your company use e-commerce to replace your current direct selling business model?___Yes, my company uses or will use e-commerce to replace our entire current
direct selling business model.___Yes, our business uses or will use e-commerce; a part of our business will still
use the traditional direct selling model.___No, most of our business uses or will use the traditional direct selling business
model; a part of our business uses or will use e-commerce.___No, my company does not and will not use e-commerce to replace the current
direct selling model.
Section V: Customers1. Do your distributors like to purchase your products or goods online?
___Yes ___ NoIf your company uses e-commerce business,
2. Can anyone apply to become a new distributor via the Internet?___Yes ___ No
3. Do you see the end of multilevel marketing by your direct selling company?___Yes ___ No
Thank you for talcing time to complete the questionnaire.Please returns the completed questionnaire with the stamped envelop.
99

APPENDIX B
CROSS TABULATION
100

Which of the following best describes your product? *Does your company have anE-commerce solution? (distributors can purchase on line) Cross tabulation
Does your company have an E-oommerce solution? (distributors can purchase on line)?
TotalYes NoWhich of the Personal Care Products Count 8 2 10following best describes your
% within Which of the following best describes your product? 80.0% 20.0% 100.0%
products? % within Does your company have an E-commerce solution? (distributors can purchase on line)?
32.0% 22.2% 29.4%
% of Total 23.5% 5.9% 29.4%Home/Family Care Products Count 4 1 5
% within Which of the following best describes your product? 80.0% 20.0% 100.0%
% within Does your company have an E-commerce solution? (distributors can purchase on line)?
16.0% 11.1% 14.7%
% of Total 11.8% 2.9% 14.7%Services/Miscellaneous Count 4 2 6
% within Which of the following best describes your product? 66.7% 33.3% 1.00.0%
% within Does your company have an E-commerce solution? (distributors can purchase on line)?
16.0% 22.2% 17.6%
% of Total 11.8% 5.9% 17.6%Wellness Products Count 5 2 7
% within Which of the following best describes your product? 71.4% 28.6% 100.0%
% within Does your company have an E-commerce solution? (distributors can purchase on line)?
20.0% 22.2% 20.6%
% of Total 14.7% 5.9% 20.6%Leisure/Educational Products Count
% within Which of the following best describes your product?% within Does your company have an
1
100.0%
1
100.0%
E-commerce solution? (distributors can purchase on line)?
4.0% 2.9%
% of Total 2.9% 2.9%Other Count 3 2 5
% within Which of the following best describes your product? 60.0% 40.0% 100.0%
% within Does your company have an E-commerce solution? (distributors can purchase on line)?
12.0% 22.2% 14.7%
% of Total 8.8% 5.9% 14.7%Total Count 25 g 34
% within Which of the following best describes your product?% within Does your company have an
73.5% 26.5% 100.0%
E-commerce solution? (distributors can purchase on line)?
100.0% 100.0% 100.0%
% of Total 73.5% 26.5% 100.0%
101
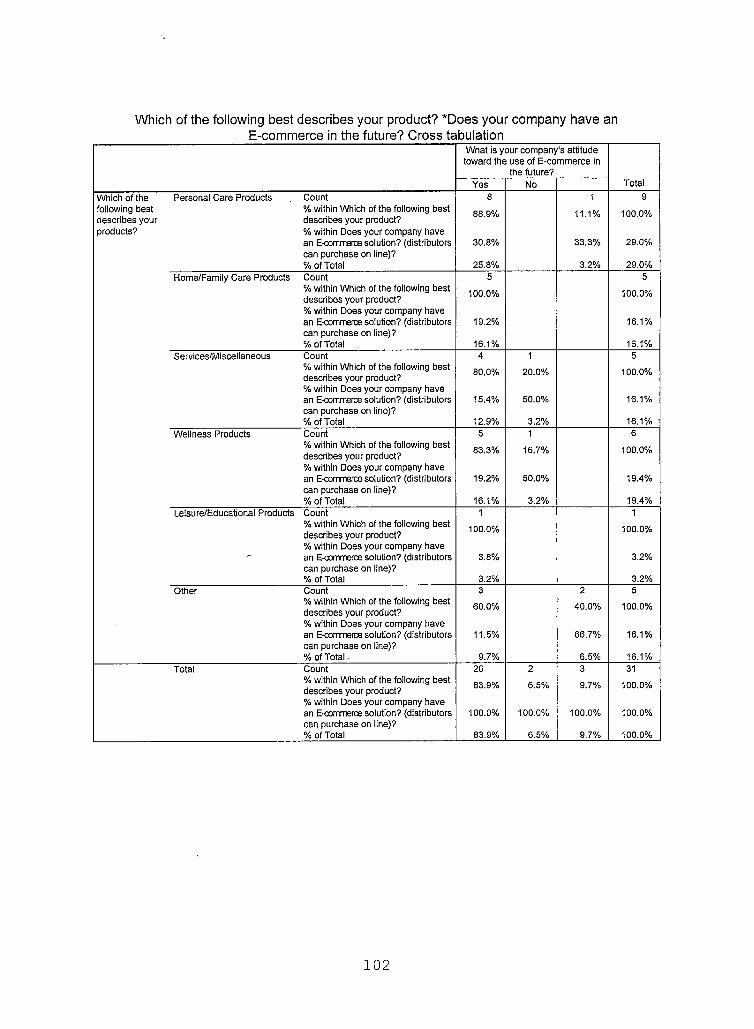
Which of the following best describes your product? *Does your company have anE-commerce in the future? Cross tabulation
What is your company's attitude toward the use of E-commerce in
the future?TotalYes No
Which of the Personal Care Products Count 8 1 gfollowing best % within Which of the following best 88.9% 11.1% 100.0%describes your describes your product?products? % within Does your company have
an E-commerce solution? (distributors 30.8% 33.3% 29.0%can purchase on line)?% of Total 25.8% 3.2% 29.0%
Home/Family Care Products Count% within Which of the following best describes your product?
5
100.0%
5
100.0%
% within Does your company have an E-commerce solution? (distributors 19.2% 16.1%can purchase on line)?% of Total 16.1% 16.1%
Services/Miscellaneous Count 4 1 5% within Which otthe following best describes your product?% within Does your company have
80.0% 20.0% 100.0%
an E-commerce solution? (distributors can purchase on line)?
15.4% 50.0% 16.1%
% of Total 12.9% 3.2% 16.1%Wellness Products Count 5 1 6
% within Which otthe following best describes your product? 83.3% 16.7% 100.0%
% within Does your company have an E-commerce solution? (distributors 19.2% 50.0% 19.4%can purchase on line)?% of Total 16.1% 3.2% 19.4%
Leisure/Educational Products Count 1 1% within Which of the following best describes your product?% within Does your company have
100.0% 100.0%
an E-commerce solution? (distributors can purchase on line)?
3.8% 3.2%
% of Total 3.2% 3.2%Other Count 3 2 5
% within Which of the following best describes your product?% within Does your company have
60.0% 40.0% 100.0%
an E-commerce solution? (distributors can purchase on line)?
11.5% 66.7% 16.1%
% of Total • 9.7% 6.5% 16.1%Total Count 26 2 3 31
% within Which of the following best describes your product?% within Does your company have
83.9% 6.5% 9.7% 100.0%
an E-commerce solution? (distributors can purchase on line)?
100.0% 100.0% 100.0% 100.0%
% of Total 83.9% 6.5% 9.7% 100.0%
102
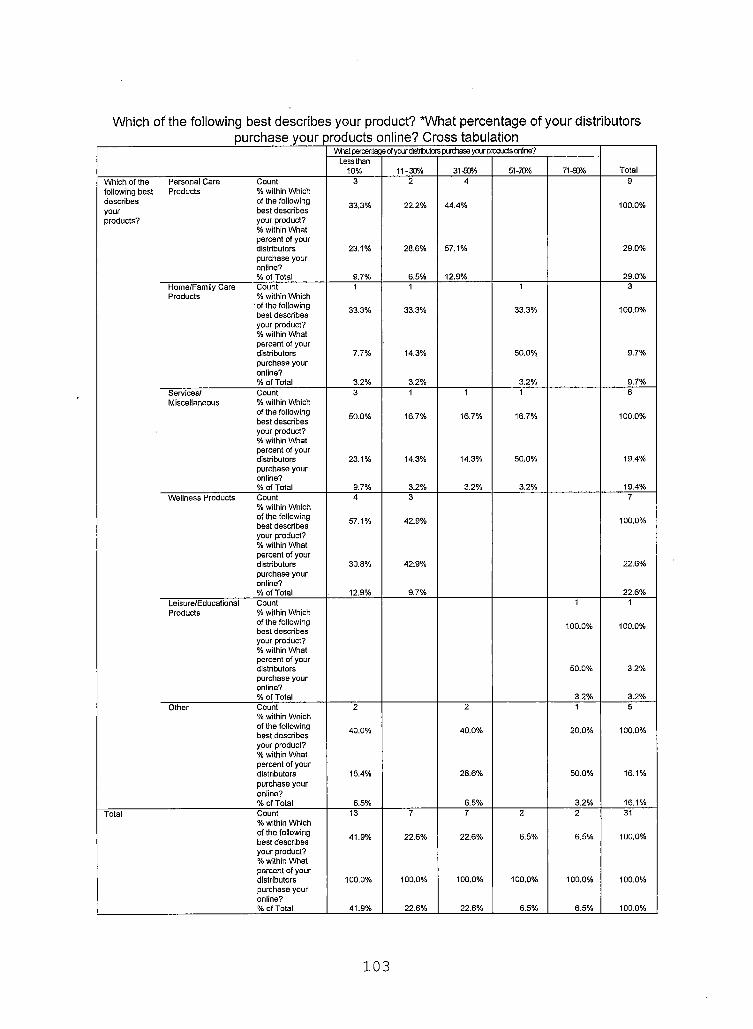
Which of the following best describes your product? *What percentage of your distributorspurchase your products online? Cross tabulation
Wiat percentage of your distributors purchase your products onfne?
TotalLess than
10% 11-30% 31-50% 51-70% 71-90%Which of the Personal Care Count 3 2 4 9following best Products % within Whichdescribes of the following 33.3% 22.2% 44.4% 100.0%your best describesproducts? your product?
% within Whatpercent of your distributors 23.1% 28.6% 57.1% 29.0%purchase your online?% of Total 9.7% 6.5% 12.9% 29.0%
Home/Family Care Count 1 1 1 3Products % within Which
of the following best describes 33.3% 33.3% 33.3% 100.0%
your product?% within Whatpercent of your distributors purchase your online?
7.7% 14.3% 50.0% 9.7%
% of Total 3.2% 3.2% 3.2% 9.7%Services/ Count 3 1 1 1 6Miscellaneous % within Which
of the following best describes 50.0% 16.7% 16.7% 16.7% 100.0%
your product?% within What percent of your distributors 23.1% 14.3% 14.3% 50.0% 19.4%purchase your online?% of Total 9.7% 3.2% 3.2% 3.2% 19.4%
Wellness Products Count% within Which of the following best describes
4
57.1%
3
42.9%
7
100.0%
your product?% within What percent of your distributors purchase your online?
30.8% 42.9% 22.6%
% of Total 12.9% 9.7% 22.6%Leisure/Educational Count 1 1Products % within Which
of the following best describes 100.0% 100.0%
your product?% within Whatpercent of your distributors 50.0% 3.2%purchase your online?% of Total 3;2% 3.2%
Other Count% within Which of the following best describes your product?% within What
2
40.0%
2
40.0%
1
20.0%
5
100.0%
percent of your distributors 15.4% 28.6% 50.0% 16.1%purchase your online?% of Total 6.5% 6.5% 3.2% 16.1%
Total Count% within Which
13 7 7 2 2 31
of the following best describes 41.9% 22.6% 22.6% 6.5% 6.5% 100.0%
your product?% within What percent of your distributors 100.0% 100.0% 100.0% 100.0% 100.0% 100.0%purchase your online?% of Total 41.9% 22.6% 22.6% 6.5% 6.5% 100.0%
103
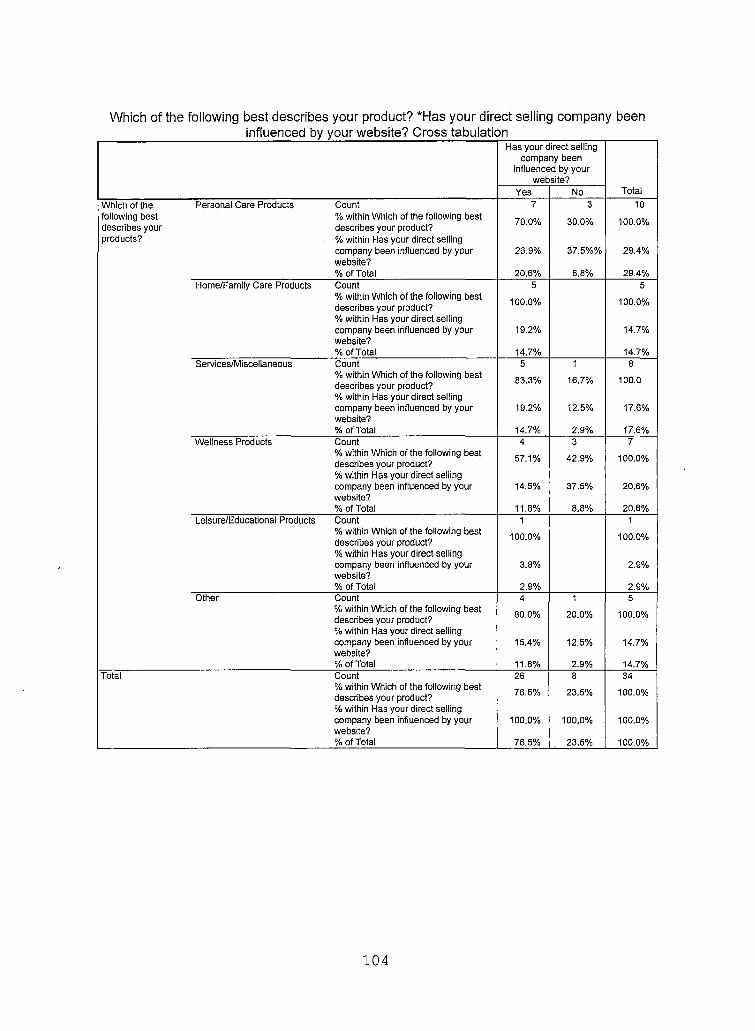
Which ofthe following best describes your product? *Has your direct selling company beeninfluenced by your website? Cross tabulation
Has your direct selling company been
influenced by your website?
TotalYes NoWhich of the Personal Care Products Count 7 3 10following best % within Which ofthe following best 70.0% 30.0% 100.0%describes your describes your product?products? % within Has your direct selling
company been influenced by your 26.9% 37.5%% 29.4%website?% of Total 20.6% 8.8% 29.4%
Home/Family Care Products Count 5 5% within Which of the following best describes your product?% within Has your direct selling
100.0% 100.0%
company been influenced by your website?
19.2% 14.7%
% of Total 14.7% 14.7%Services/Miscellaneous Count
% within Which ofthe following best describes your product?% within Has your direct selling
5
83.3%
1
16.7%
8
100.0
company been influenced by your website?
19.2% 12.5% 17.6%
% of Total 14.7% 2.9% 17.6%Wellness Products Count
% within Which ofthe following best describes your product?% within Has your direct selling
4
57.1%
3
42.9%
7
100.0%
company been influenced by your 14.5% 37.5% 20.6%website?% of Total 11.8% 8.8% 20.6%
Leisure/Educational Products Count 1 1% within Which of the following best describes your product?% within Has your direct selling
100.0% 100.0%
company been influenced by your website?
3.8% 2.9%
% of Total 2.9% 2.9%Other Count 4 1 5
% within Which ofthe following best describes your product?% within Has your direct selling
80.0% 20.0% 100.0%
company been influenced by your website?
15.4% 12.5% 14.7%
% of Total 11.8% 2.9% 14.7%Total Count 26 8 34
% within Which ofthe following best describes your product? 76.5% 23.5% 100.0%
% within Has your direct selling company been influenced by your 100.0% 100.0% 100.0%website?% of Total 76.5% 23.5% 100.0%
104
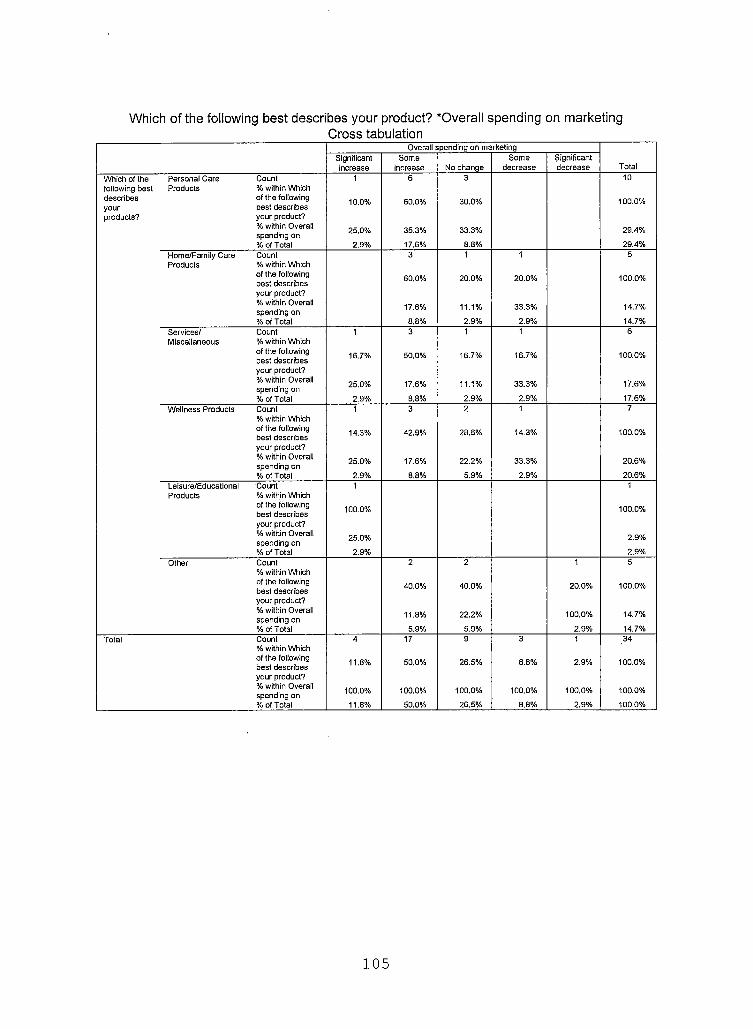
Which of the following best describes your product? ‘Overall spending on marketingCross tabulation
Overall spending on marketing
TotalSignificantincrease
Someincrease No change
Somedecrease
Significantdecrease
Which of the Personal Care Count 1 6 3 10following best Products % within Whichdescribes of the following 10.0% 60.0% 30.0% 100.0%your best describesproducts? your product?
% within Overall spending on 25.0% 35.3% 33.3% 29.4%
% of Total 2.9% 17.6% 8.8% 29.4%Home/Family Care Count 3 1 1 5Products % within Which
of the following best describes 60.0% 20.0% 20.0% 100.0%
your product?% within Overall spending on 17.6% 11.1% 33.3% 14.7%
% of Total 8.8% 2.9% 2.9% 14.7%Services/ Count 1 3 1 1 6Miscellaneous % within Which
of the following best describes your product?
16.7% 50.0% 16.7% 16.7% 100.0%
% within Overall spending on 25.0% 17.6% 11.1% 33.3% 17.6%
% of Total 2.9% 8.8% 2.9% 2.9% 17.6%Wellness Products Count
% within Which1 3 2 1 7
of the following best describes 14.3% 42.9% 28.6% 14.3% 100.0%
your product?% within Overall 25.0% 17.6% 22.2% 33.3% 20.6%spending on% of Total 2.9% 8.8% 5.9% 2.9% 20.6%
Leisure/Educational Count 1 1Products % within Which
of the following best describes 100.0% 100.0%
your product?% within Overall spending on 25.0% 2.9%
% of Total 2.9% 2.9%Other Count
% within Which2 2 1 5
of the following best describes 40.0% 40.0% 20.0% 100.0%
your product?% within Overall spending on 11.8% 22.2% 100.0% 14.7%
% of Total 5.9% 5.9% 2.9% 14.7%Total Count
% within Which4 17 9 3 1 34
of the following best describes your product?
11.8% 50.0% 26.5% 8.8% 2.9% 100.0%
% within Overall spending on % of Total
100.0% 100.0% 100.0% 100.0% 100.0% 100.0%
11.8% 50.0% 26.5% 8.8% 2.9% 100.0%
105
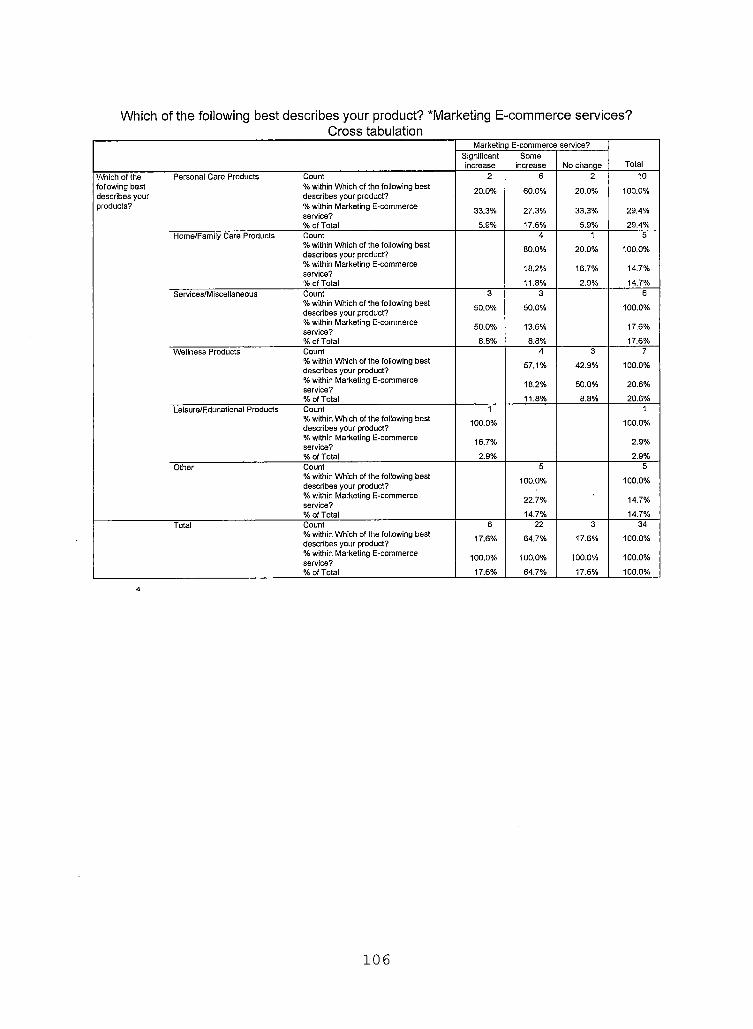
Which of the following best describes your product? "Marketing E-commerce services?Cross tabulation
Marketing E-commerce service?
TotalSignificantincrease
Someincrease No change
Which of the following best describes your products?
Personal Care Products Count% within Which of the following best describes your product?% within Marketing E-commerce service?% of Total
2
20.0%
33.3%
5.9%
6
60.0%
27.3%
17.6%
2
20.0%
33.3%
5.9%
10
100.0%
29.4%
29.4%Home/Family Care Products Count
% within Which of the following best describes your product?% within Marketing E-commerce service?% of Total
4
80.0%
18.2%
11.8%
1
20.0%
16.7%
2.9%
5
100.0%
14.7%
14.7%Services/Miscellaneous Count
% within Which of the following best describes your product?% within Marketing E-commerce service?% of Total
3
50.0%
50.0%
8.8%
3
50.0%
13.6%
8.8%
6
100.0%
17.6%
17.6%Wellness Products Count
% within Which of the following best describes your product?% within Marketing E-commerce service?% of Total
4
57.1%
18.2%
11.8%
3
42.9%
50.0%
8.8%
7
100.0%
20.6%
20.6%Leisure/Educational Products Count
% within Which of the following best describes your product?% within Marketing E-commerce service?% of Total
1
100.0%
16.7%
2.9%
1
100.0%
2.9%
2.9%Other Count
% within Which of the following best describes your product?% within Marketing E-commerce service?% of Total
5
100.0%
22.7%
14.7%
5
100.0%
14.7%
14.7%Total Count
% within Which of the following best describes your product?% within Marketing E-commerce service?% of Total
6
17.6%
100.0%
17.6%
22
64.7%
100.0%
64.7%
3
17.6%
100.0%
17.6%
34
100.0%
100.0%
100.0%
4
106
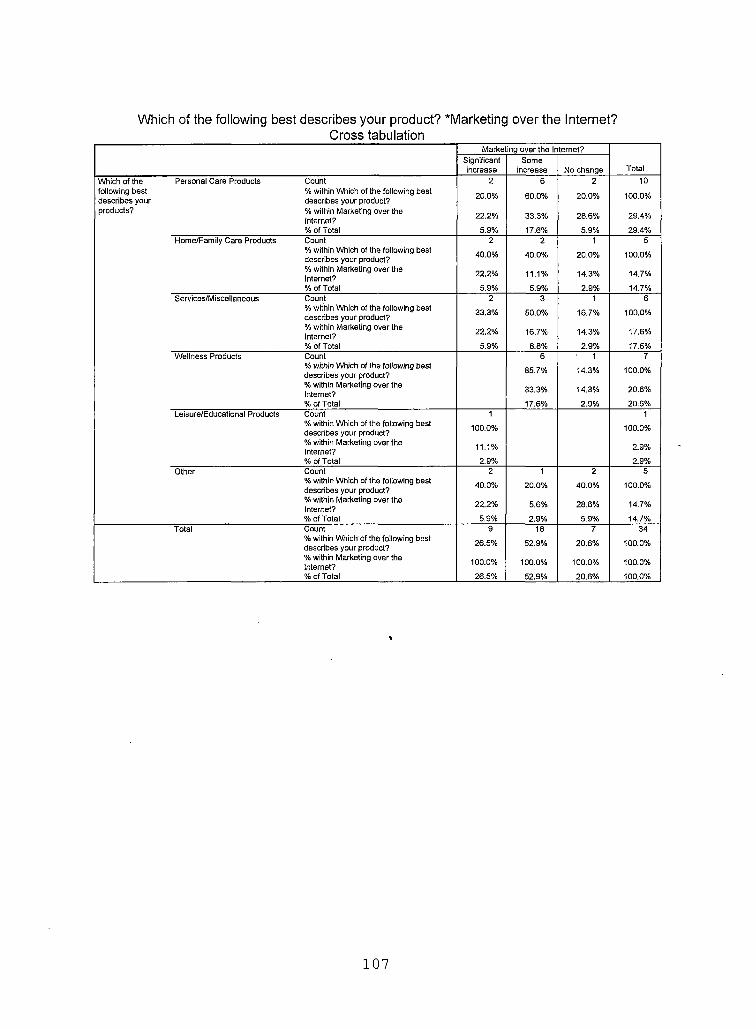
Which of the following best describes your product? *Marketing over the Internet?Cross tabulation
Marketing over the Internet?
TotalSignificantincrease
Someincrease No change
Which of the Personal Care Products Count 2 6 2 10following best describes your
% within Which of the following best describes your product? 20.0% 60.0% 20.0% 100.0%
products? % within Marketing over theInternet? 22.2% 33.3% 28.6% 29.4%
% of Total 5.9% 17.6% 5.9% 29.4%Home/Family Care Products Count 2 2 1 5
% within Which of the following best describes your product? 40.0% 40.0% 20.0% 100.0%
% within Marketing over theInternet? 22.2% 11.1% 14.3% 14.7%
% of Total 5.9% 5.9% 2.9% 14.7%Services/Miscellaneous Count 2 3 1 6
% within Which of the following best describes your product? 33.3% 50.0% 16.7% 100.0%
% within Marketing over theInternet? 22.2% 16.7% 14.3% 17.6%
% of Total 5.9% 8.8% 2.9% 17.6%Wellness Products Count 6 1 7
% within Which of the following best describes your product? 85.7% 14.3% 100.0%
% within Marketing over theInternet? 33.3% 14.3% 20.6%
% of Total 17.6% 2.9% 20.6%Leisure/Educational Products Count 1 1
% within Which of the following best describes your product? 100.0% 100.0%
% within Marketing over theInternet? 11.1% 2.9%
% of Total 2.9% 2.9%Other Count
% within Which of the following best describes your product?
2
40.0%
1
20.0%
2
40.0%
5
100.0%
% within Marketing over theInternet? 22.2% 5.6% 28.6% 14.7%
% of Total 5.9% 2.9% 5.9% 14.7%Total Count 9 18 7 34
% within Which of the following best describes your product? 26.5% 52.9% 20.6% 100.0%
% within Marketing over theInternet? 100.0% 100.0% 100.0% 100.0%
% of Total 26.5% 52.9% 20.6% 100.0%
107
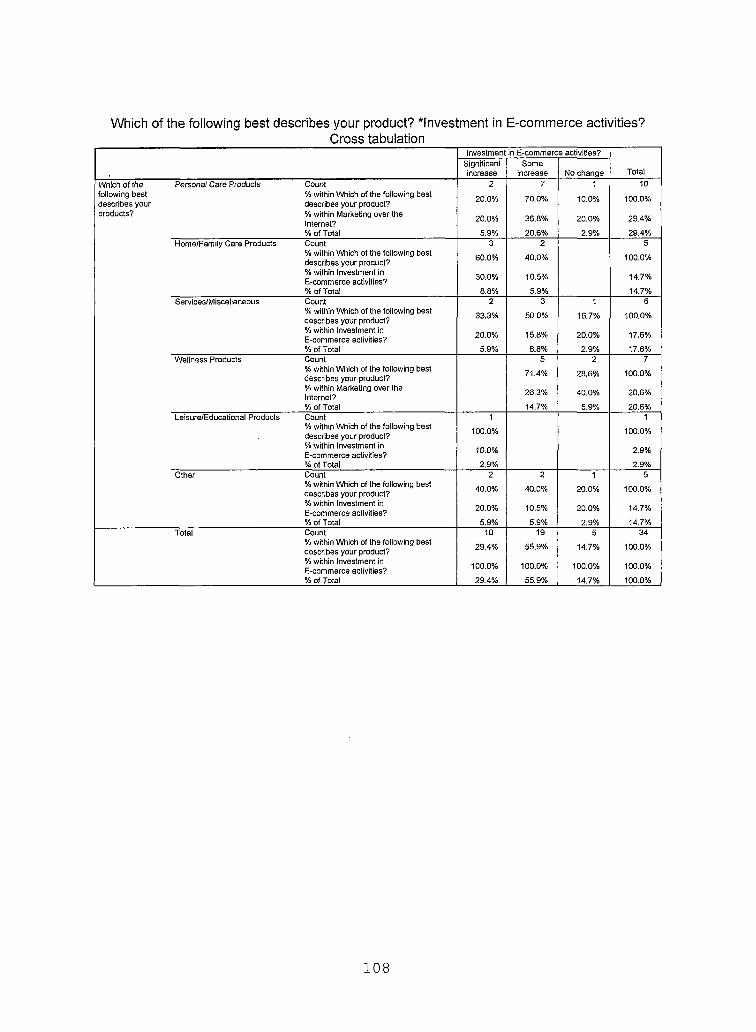
Which of the following best describes your product? ‘Investment in E-commerce activities?Cross tabulation
Investment in E-commerce activities?
TotalSignificantincrease
Someincrease No change
Which of the Personal Care Products Count 2 7 1 10following best % within Which of the following best 20.0% 70.0% 10.0% 100.0%describes your describes your product?products? % within Marketing over the
Internet? 20.0% 36.8% 20.0% 29.4%
% of Total 5.9% 20.6% 2.9% 29.4%Home/Family Care Products Count 3 2 5
% within Which of the following best describes your product? 60.0% 40.0% 100.0%
% within Investment inE-commerce activities? 30.0% 10.5% 14.7%
% of Total 8.8% 5.9% 14.7%Services/Miscellaneous Count
% within Which of the following best describes your product?
2
33.3%
3
50.0%
1
16.7%
6
100.0%
% within Investment inE-commerce activities? 20.0% 15.8% 20.0% 17.6%
% of Total 5.9% 8.8% 2.9% 17.6%Wellness Products Count 5 2 7
% within Which of the following best describes your product? 71.4% 28.6% 100.0%
% within Marketing over theInternet? 26.3% 40.0% 20.6%
% of Total 14.7% 5.9% 20.6%Leisure/Educational Products Count
% within Which of the following best describes your product?% within Investment inE-commerce activities?
1
100.0%
10.0%
1
100.0%
2.9%
% of Total 2.9% 2.9%Other Count
% within Which of the following best describes your product?
2
40.0%
2
40.0%
1
20.0%
5
100.0%
% within Investment inE-commerce activities? 20.0% 10.5% 20.0% 14.7%
% of Total 5.9% 5.9% 2.9% 14.7%Total Count
% within Which of the following best describes your product?
10
29.4%
19
55.9%
5
14.7%
34
100.0%
% within Investment inE-commerce activities? 100.0% 100.0% 100.0% 100.0%
% of Total 29.4% 55.9% 14.7% 100.0%
108
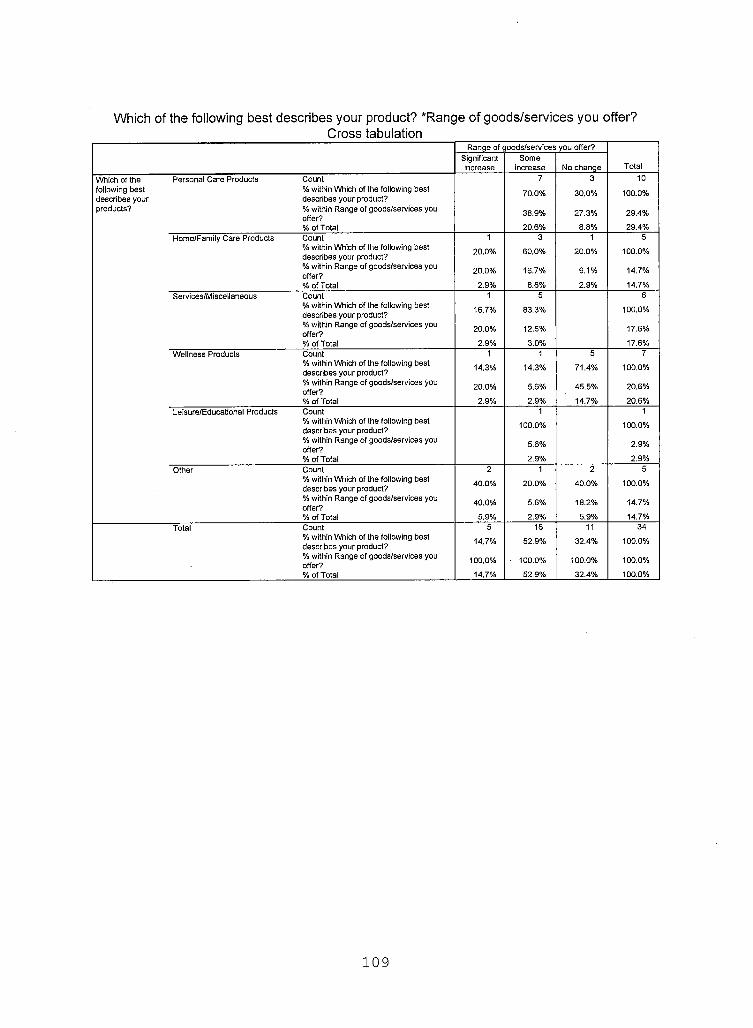
Which of the following best describes your product? *Range of goods/services you offer?Cross tabulation
Range of goods/services you offer?
TotalSignificantincrease
Someincrease No change
Which of the Personal Care Products Count 7 3 10following best % within Which of the following best 70.0% 30.0% 100.0%describes your describes your product?products? % within Range of goods/services you 38.9% 27.3% 29.4%
% of Total 20.6% 8.8% 29.4%Home/Family Care Products Count 1 3 1 5
% within Which of the following best describes your product?
20.0% 60.0% 20.0% 100.0%
% within Range of goods/services you 20.0% 16.7% 9.1% 14.7%
% of Total 2.9% 8.8% 2.9% 14.7%Services/Miscellaneous Count
% within Which of the following best describes your product?
1
16.7%
5
83.3%
6
100.0%
% within Range of goods/services you offer? 20.0% 12.5% 17.6%
% of Total 2.9% 3.0% 17.6%Wellness Products Count 1 1 5 7
% within Which of the following best describes your product? 14.3% 14.3% 71.4% 100.0%
% within Range of goods/services you 20.0% 5.6% 45.5% 20.6%
% of Total 2.9% 2.9% 14.7% 20.6%Leisure/Educational Products Count
% within Which of the following best describes your product?% within Range of goods/services you offer?
1
100.0%
5.6%
1
100.0%
2.9%
% of Total 2.9% 2.9%Other Count 2 1 2 5
% within Which of the following best describes your product? 40.0% 20.0% 40.0% 100.0%
% within Range of goods/services you offer?
40.0% 5.6% 18.2% 14.7%
% of Total 5.9% 2.9% 5.9% 14.7%Total Count 5 18 11 34
% within Which of the following best describes your product? 14.7% 52.9% 32.4% 100.0%
% within Range of goods/services you offer? 100.0% ■ 100.0% 100.0% 100.0%
% of Total 14.7% 52.9% 32.4% 100.0%
109
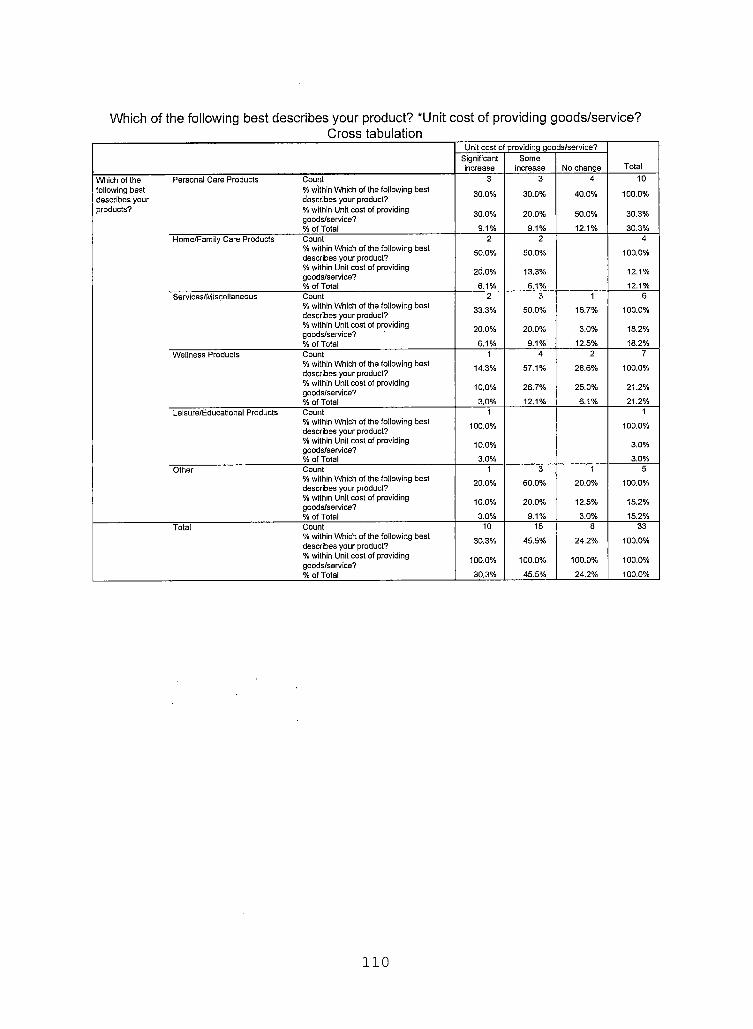
Which ofthe following best describes your product? *Unit cost of providing goods/service?Cross tabulation
Unit cost of providing goods/service?
TotalSignificantincrease
Someincrease No change
Which of the following best describes your products?
Personal Care Products Count% within Which of the following best describes your product?% within Unit cost of providing goods/service?% of Total
3
30.0%
30.0%
9.1%
3
30.0%
20.0%
9.1%
4
40.0%
50.0%
12.1%
10
100.0%
30.3%
30.3%Home/Family Care Products Count
% within Which of the following best describes your product?% within Unit cost of providing goods/service?% of Total
2
50.0%
20.0%
6.1%
2
50.0%
13.3%
6.1%
4
100.0%
12.1%
12.1%Services/Miscellaneous Count
% within Which of the following best describes your product?% within Unit cost of providing goods/service?% of Total
2
33.3%
20.0%
6.1%
3
50.0%
20.0%
9.1%
1
16.7%
3.0%
12.5%
6
100.0%
18.2%
18.2%Wellness Products Count
% within Which of the following best describes your product?% within Unit cost of providing goods/service?% of Total
1
14.3%
10.0%
3.0%
4
57.1%
26.7%
12.1%
2
28.6%
25.0%
6.1%
7
100.0%
21.2%
21.2%Leisure/Educational Products Count
% within Which of the following best describes your product?% within Unit cost of providing goods/service?% of Total
1
100.0%
10.0%
3.0%
1
100.0%
3.0%
3.0%Other Count
% within Which of the following best describes your product?% within Unit cost of providing goods/service?% of Total
1
20.0%
10.0%
3.0%
3
60.0%
20.0%
9.1%
1
20.0%
12.5%
3.0%
5
100.0%
15.2%
15.2%Total Count
% within Which of the following best describes your product?% within Unit cost of providing goods/service?% of Total
10
30.3%
100.0%
30.3%
15
45.5%
100.0%
45.5%
8
24.2%
100.0%
24.2%
33
100.0%
100.0%
100.0%
110
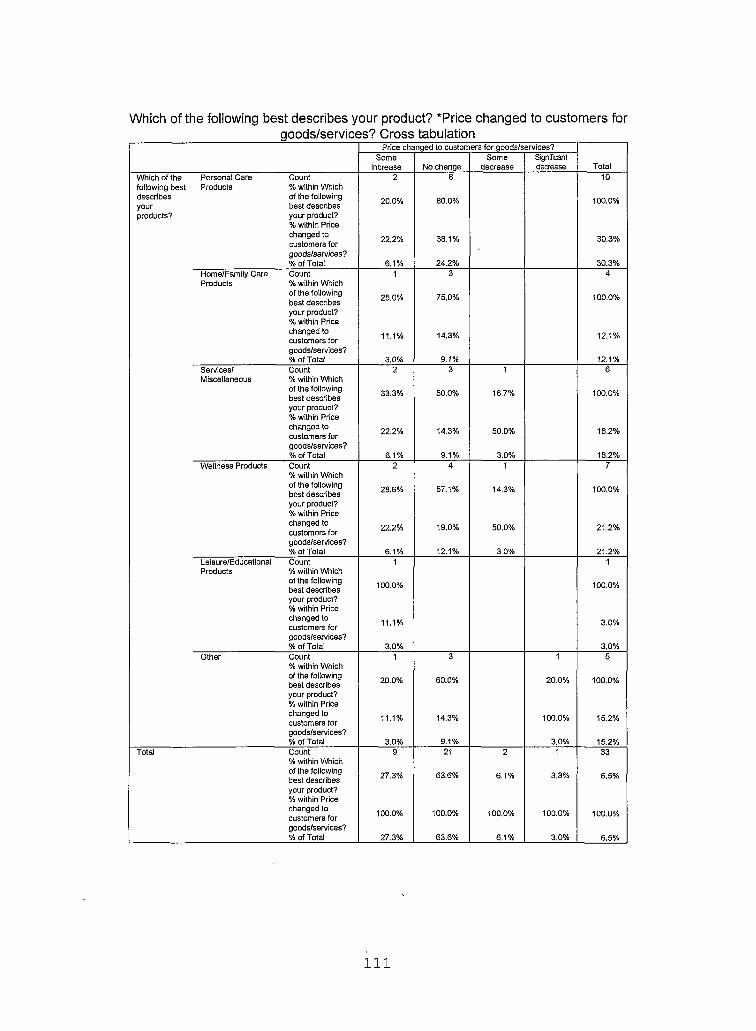
Which of the following best describes your product? ‘Price changed to customers forgoods/services? Cross tabulation
Price changed to customers for goods/services?
TotalSome
increase No changeSome
decreaseSignificantdecrease
Which of the Personal Care Count 2 8 10following best Products % within Whichdescribes of the following 20.0% 80.0% 100.0%your best describesproducts? your product?
% within Price changed to customers for goods/services?% of Total
22.2% 38.1% 30.3%
6.1% 24.2% 30.3%Home/Family Care Count 1 3 4Products % within Which
of the following best describes your product?% within Price
25.0% 75.0% 100.0%
changed to customers for 11.1% 14.3% 12.1%
goods/services?% of Total 3.0% 9.1% 12.1%
Services/ Count 2 3 1 6Miscellaneous % within Which
of the following best describes your product?% within Price changed to customers for goods/services?
33.3% 50.0% 16.7% 100.0%
22.2% 14.3% 50.0% 18.2%
% of Total 6.1% 9.1% 3.0% 18.2%Wellness Products Count
% within Which2 4 1 7
of the following best describes 28.6% 57.1% 14.3% 100.0%
your product?% within Price changed to customers for 22.2% 19.0% 50.0% 21.2%
goods/services?% of Total 6.1% 12.1% 3.0% 21.2%
Leisure/Educational Count 1 1Products % within Which
of the following best describes 100.0% 100.0%
your product?% within Price changed to customers for 11.1% 3.0%
goods/services?% of Total 3.0% 3.0%
Other Count% within Which
1 3 1 5
of the following best describes 20.0% 60.0% 20.0% 100.0%
your product?% within Price changed to customers for goods/services?
11.1% 14.3% 100.0% 15.2%
% of Total 3.0% 9.1% 3.0% 15.2%Total Count
% within Which9 21 2 1 33
of the following best describes your product?% within Price
27.3% 63.6% 6.1% 3.3% 6.5%
changed to customers for 100.0% 100.0% 100.0% 100.0% 100.0%
goods/services?% of Total 27.3% 63.6% 6.1% 3.0% 6.5%
111
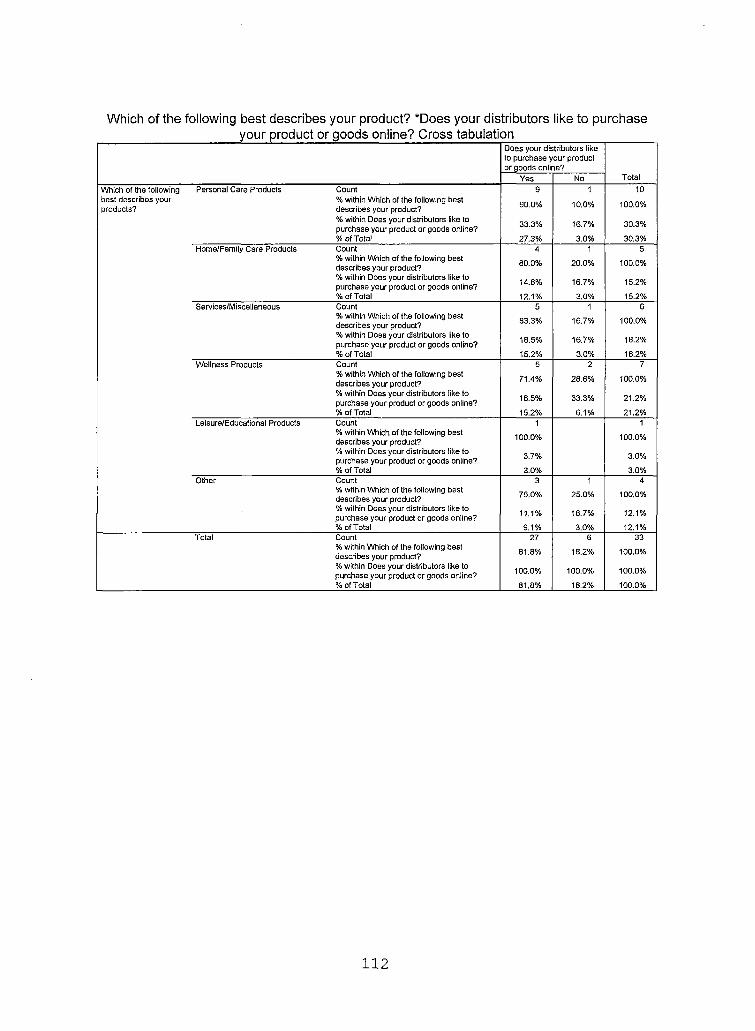
Which of the following best describes your product? "Does your distributors like to purchaseyour product or goods online? Cross tabulation
Does your distributors like to purchase your product or goods online?
TotalYes NoWhich of the following Personal Care Products Count 9 1 10best describes your products?
% within Which of the following best describes your product? 90.0% 10.0% 100.0%
% within Does your distributors like to purchase your product or goods online? 33.3% 16.7% 30.3%
% of Total 27.3% 3.0% 30.3%Home/Family Care Products Count 4 1 5
% within Which of the following best describes your product? 80.0% 20.0% 100.0%
% within Does your distributors like to purchase your product or goods online? 14.8% 16.7% 15.2%
% of Total 12.1% 3.0% 15.2%Services/Miscellaneous Count 5 1 6
% within Which of the following best describes your product? 83.3% 16.7% 100.0%
% within Does your distributors like to purchase your product or goods online? 18.5% 16.7% 18.2%
% of Total 15.2% 3.0% 18.2%Wellness Products Count 5 2 7
% within Which of the following best describes your product? 71.4% 28.6% 100.0%
% within Does your distributors like to purchase your product or goods online? 18.5% 33.3% 21.2%
% of Total 15.2% 6.1% 21.2%Leisure/Educational Products Count 1 1
% within Which of the following best describes your product? 100.0% 100.0%
% within Does your distributors like to purchase your product or goods online? 3.7% 3.0%
% of Total 3.0% 3.0%Other Count 3 1 4
% within Which of the following best describes your product? 75.0% 25.0% 100.0%
% within Does your distributors like to purchase your product or goods online? 11.1% 16.7% 12.1%
% of Total 9.1% 3.0% 12.1%Total Count 27 6 33
% within Which of the following best describes your product? 81.8% 18.2% 100.0%
% within Does your distributors like to purchase your product or goods online? 100.0% 100.0% 100.0%
% of Total 81.8% 18.2% 100.0%
112
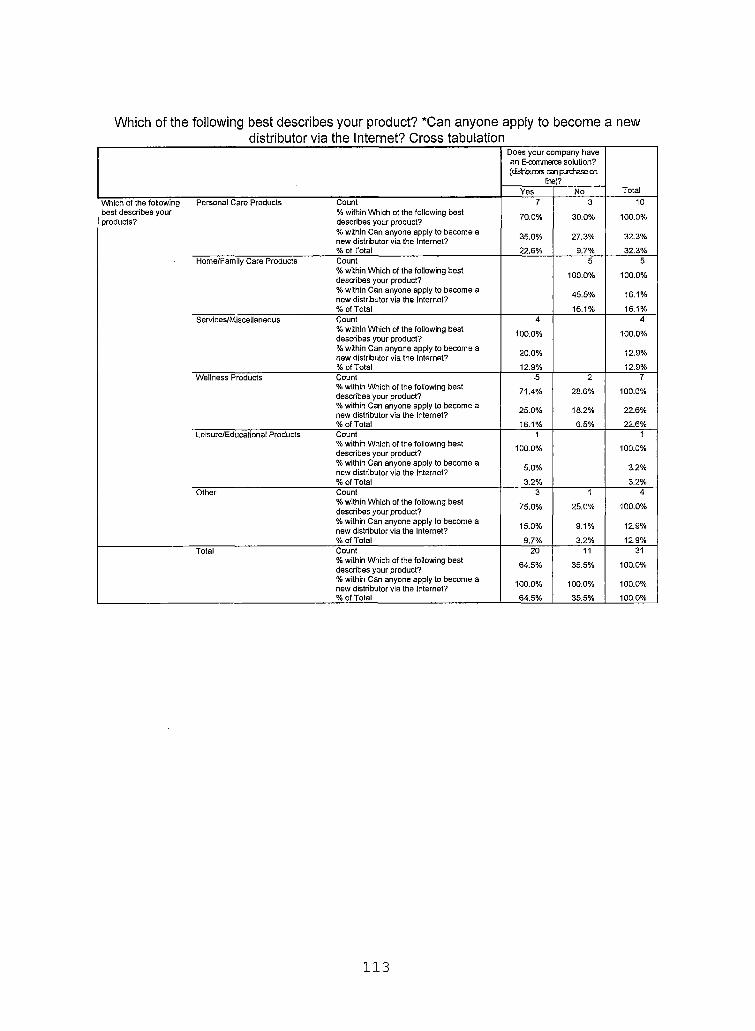
Which of the following best describes your product? *Can anyone apply to become a newdistributor via the Internet? Cross tabulation
Does your company have an E-commerce solution? (distributors can puchase on
Gne)?TotalYes No
Which of the following best describes your products?
Personal Care Products Count% within Which of the following best describes your product?% within Can anyone apply to become a new distributor via the Internet?% of Total
7
70.0%
35.0%
22.6%
3
30.0%
27.3%
9.7%
10
100.0%
32.3%
32.3%Home/Family Care Products Count
% within Which of the following best describes your product?% within Can anyone apply to become a new distributor via the Internet?% of Total
5
100.0%
45.5%
16.1%
5
100.0%
16.1%
16.1%Services/Miscellaneous Count
% within Which of the following best describes your product?% within Can anyone apply to become a new distributor via the Internet?% of Total
4
100.0%
20.0%
12.9%
4
100.0%
12.9%
12.9%Wellness Products Count
% within Which of the following best describes your product?% within Can anyone apply to become a new distributor via the Internet?% of Total
5
71.4%
25.0%
16.1%
2
28.6%
18.2%
6.5%
7
100.0%
22.6%
22.6%Leisure/Educational Products Count
% within Which of the following best describes your product?% within Can anyone apply to become a new distributor via the Internet?% of Total
1
100.0%
5.0%
3.2%
1
100.0%
3.2%
3.2%Other Count
% within Which of the following best describes your product?% within Can anyone apply to become a new distributor via the Internet?% of Total
3
75.0%
15.0%
9.7%
1
25.0%
9.1%
3.2%
4
100.0%
12.9%
12.9%Total Count
% within Which of the following best describes your product?% within Can anyone apply to become a new distributor via the Internet?% of Total
20
64.5%
100.0%
64.5%
11
35.5%
100.0%
35.5%
31
100.0%
100.0%
100.0%
113
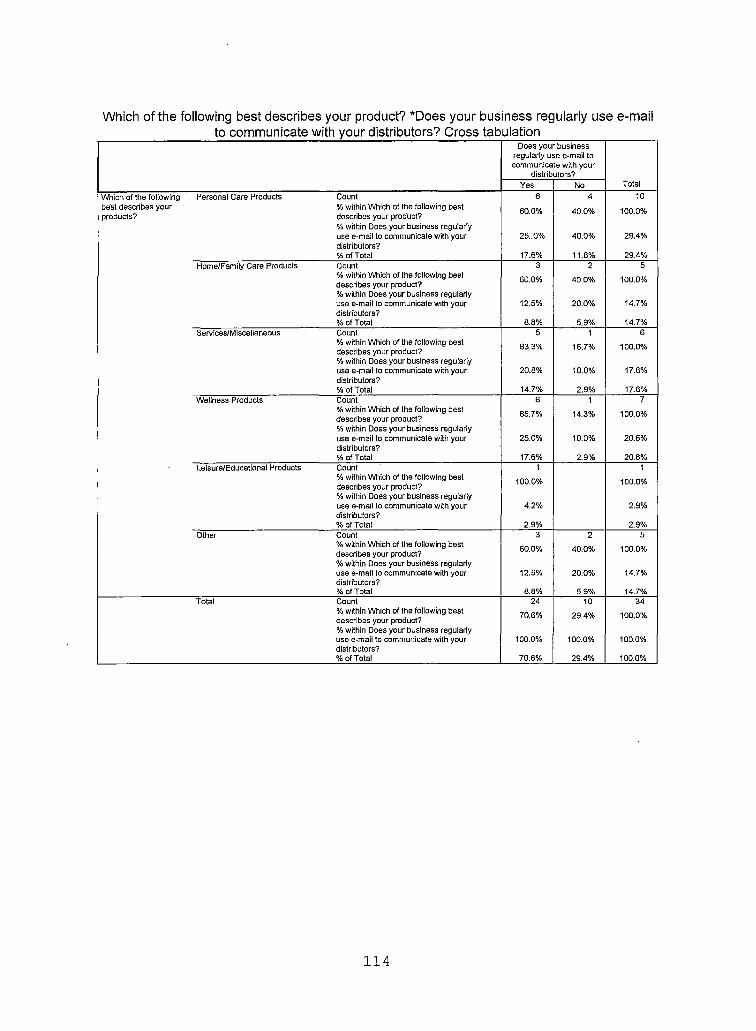
Which ofthe following best describes your product? *Does your business regularly use e-mailto communicate with your distributors? Cross tabulation
Does your business regularly use e-mail to communicate with your
distributors?TotalYes No
Which of the following Personal Care Products Count 6 4 10best describes your % within Which of the following best 60.0% 40.0% 100.0%products? describes your product?
% within Does your business regularly use e-mail to communicate with your distributors?% of Total
25..0% 40.0% 29.4%
17.6% 11.8% 29.4%Home/Family Care Products Count 3 2 5
% within Which of the following best describes your product? 60.0% 40.0% 100.0%
% within Does your business regularly use e-mail to communicate with your distributors?
12.5% 20.0% 14.7%
% of Total 8.8% 5.9% 14.7%Services/Miscellaneous Count 5 1 6
% within Which of the following best describes your product?% within Does your business regularly
83.3% 16.7% 100.0%
use e-mail to communicate with your distributors?
20.8% 10.0% 17.6%
% of Total 14.7% 2.9% 17.6%Wellness Products Count 6 1 7
% within Which of the following best describes your product? 85.7% 14.3% 100.0%
% within Does your business regularly use e-mail to communicate with your 25.0% 10.0% 20.6%distributors?% of Total 17.6% 2.9% 20.6%
Leisure/Educational Products Count% within Which of the following best describes your product?% within Does your business regularly
1
100.0%
1
100.0%
use e-mail to communicate with your distributors?
4.2% 2.9%
% of Total 2.9% 2.9%Other Count 3 2 5
% within Which of the following best describes your product?% within Does your business regularly
60.0% 40.0% 100.0%
use e-mail to communicate with your distributors?
12.5% 20.0% 14.7%
% of Total 8.8% 5.9% 14.7%Total Count 24 10 34
% within Which of the following best describes your product? 70.6% 29.4% 100.0%
% within Does your business regularly use e-mail to communicate with your 100.0% 100.0% 100.0%distributors?% of Total 70.6% 29.4% 100.0%
114
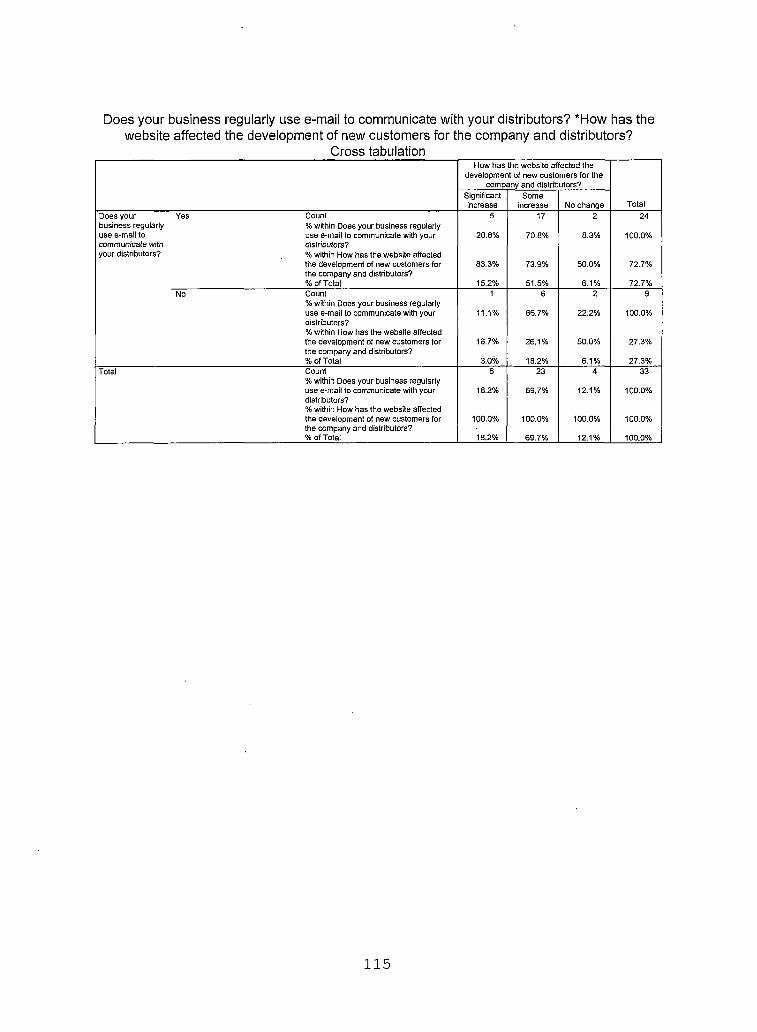
Does your business regularly use e-mail to communicate with your distributors? *How has the website affected the development of new customers for the company and distributors?
Cross tabulationHow has the website affected the
development of new customers for the company and distributors?
TotalSignificantincrease
Someincrease No change
Does your Yes Count 5 17 2 24business regularly % within Does your business regularlyuse e-mail to use e-mail to communicate with your 20.8% 70.8% 8.3% 100.0%communicate with distributors?your distributors? % within How has the website affected
the development of new customers for the company and distributors?
83.3% 73.9% 50.0% 72.7%
% of Total 15.2% 51.5% 6.1% 72.7%No Count 1 6 2 9
% within Does your business regularly use e-mail to communicate with your distributors?% within How has the website affected
11.1% 66.7% 22.2% 100.0%
the development of new customers for the company and distributors?
16.7% 26.1% 50.0% 27.3%
% of Total 3.0% 18.2% 6.1% 27.3%Total Count 6 23 4 33
% within Does your business regularly use e-mail to communicate with your 18.2% 69.7% 12.1% 100.0%distributors?% within How has the website affected the development of new customers for the company and distributors?
100.0% 100.0% 100.0% 100.0%
% of Total 18.2% 69.7% 12.1% 100.0%
115
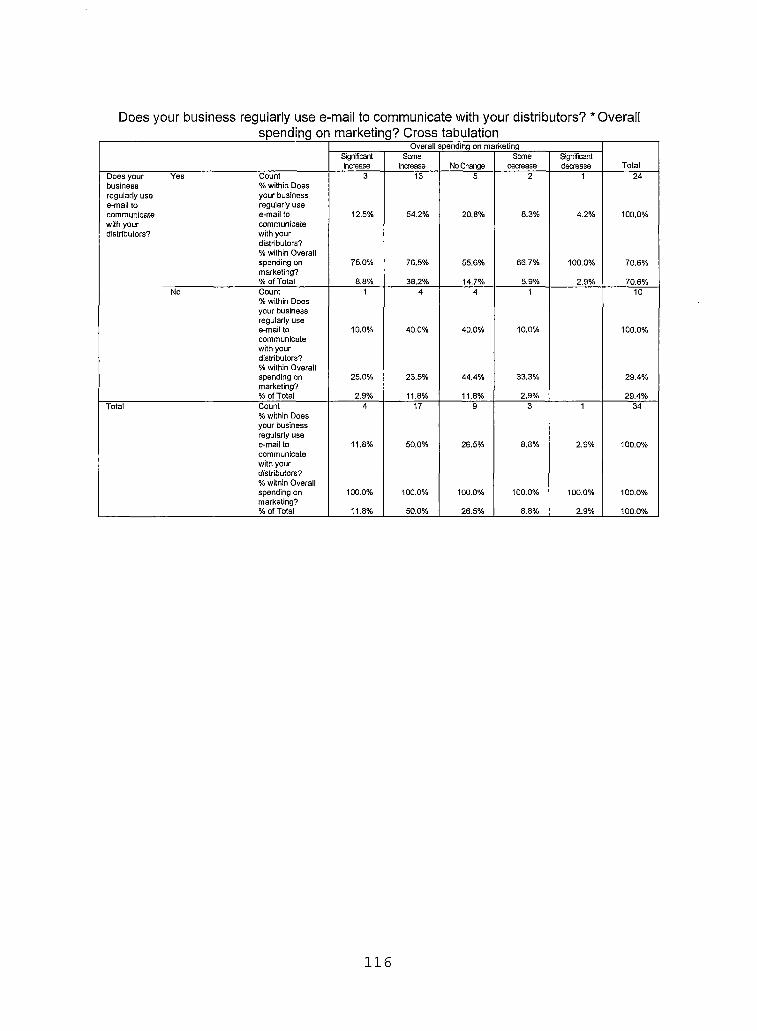
Does your business regularly use e-mail to communicate with your distributors? * Overallspending on marketing? Cross tabulation
Overall spending on marketing
TotalSignificantincrease
Someincrease No Change
Somedecrease
Significantdecrease
Does your Yes Count 3 13 5 2 1 24business % within Doesregularly use your businesse-mail to regularly usecommunicate e-mail to 12.5% 54.2% 20.8% 8.3% 4.2% 100.0%with your communicatedistributors? with your
distributors?% within Overall spending on marketing?
75.0% 76.5% 55.6% 66.7% 100.0% 70.6%
% of Total 8.8% 38.2% 14.7% 5.9% 2.9% 70.6%No Count
% within Does1 4 4 1 10
your business regularly use e-mail to communicate with your distributors?% within Overall
10.0% 40.0% 40.0% 10.0% 100.0%
spending on marketing?
25.0% 23.5% 44.4% 33.3% 29.4%
% of Total 2.9% 11.8% 11.8% 2.9% 29.4%Total Count
% within Does your business
4 17 9 3 1 34
regularly use e-mail to 11.8% 50.0% 26.5% 8.8% 2.9% 100.0%communicate with your distributors?% within Overall spending on marketing?
100.0% 100.0% 100.0% 100.0% 100.0% 100.0%
% of Total 11.8% 50.0% 26.5% 8.8% 2.9% 100.0%
116

Does your business regularly use e-mail to communicate with your distributors? * MarketingE-commerce services? Cross tabulation
Marketing E-commerce services?
TotalSignificantincrease
Someincrease No change
Does your Yes Countbusiness regularly % within Does your business regularlyuse e-mail to use e-mail to communicate with yourcommunicate with distributors?your distributors? % wjthin Marketing E-commerce
services?% of Total
6
25.0%
100.0%
17.6%
14
58.3%
63.6%
41.2%
4
16.7%
66.7%
11.8%
24
100.0%
70.6%
70.6%No Count
% within Does your business regularly use e-mail to communicate with your distributors?% within Marketing E-commerce services?% of Total
8
80.0%
36.4%
23.5%
2
20.0%
33.3%
5.9%
10
100.0%
29.4%
29.4%Total Count
% within Does your business regularly use e-mail to communicate with your distributors?% within Marketing E-commerce services?% of Total
6
17.6%
100.0%
17.6%
22
64.7%
100.0%
64.7%
6
17.6%
100.0%
17.6%
34
100.0%
100.0%
100.0%
117
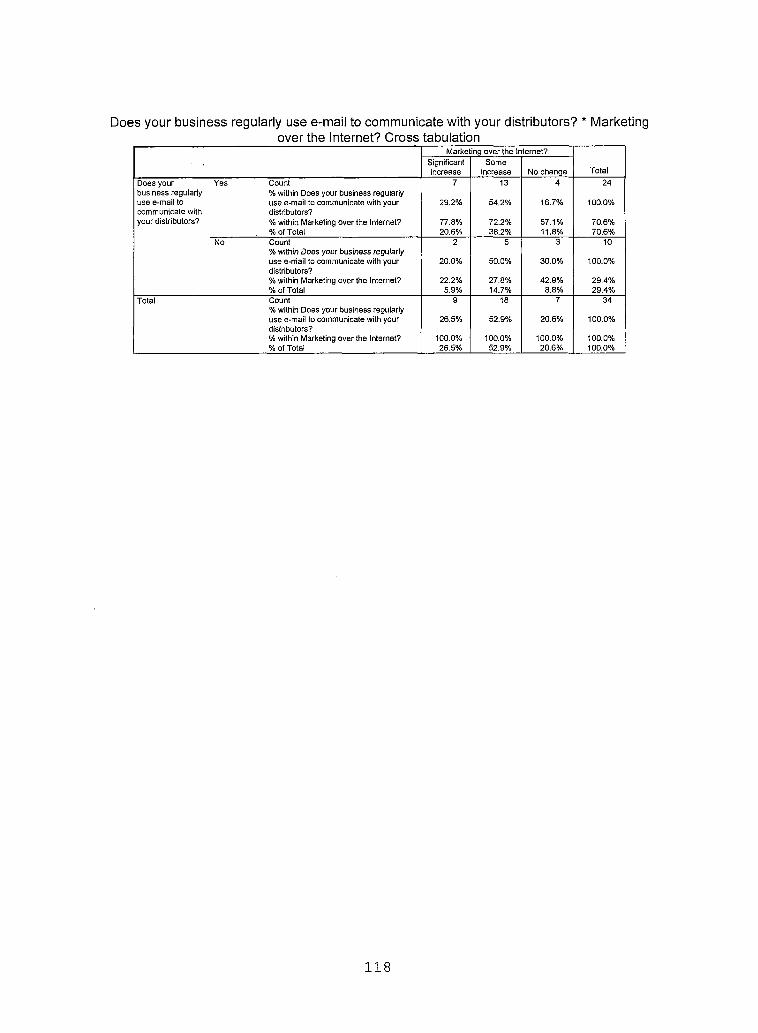
Does your business regularly use e-mail to communicate with your distributors? * Marketingover the Internet? Cross tabulation
Marketing over the Internet?
TotalSignificantincrease
Someincrease No change
Does your Yes Count 7 13 4 24business regularly % within Does your business regularlyuse e-mail to use e-mail to communicate with your 29.2% 54.2% 16.7% 100.0%communicate with distributors?your distributors? % within Marketing over the Internet? 77.8% 72.2% 57.1% 70.6%
% of Total 20.6% 38.2% 11.8% 70.6%No Count
% within Does your business regularly2 5 3 10
use e-mail to communicate with your distributors?
20.0% 50.0% 30.0% 100.0%
% within Marketing over the Internet? 22.2% 27.8% 42.9% 29.4%% of Total 5.9% 14.7% 8.8% 29.4%
Total Count 9 18 7 34% within Does your business regularly use e-mail to communicate with your 26.5% 52.9% 20.6% 100.0%distributors?% within Marketing over the Internet? 100.0% 100.0% 100.0% 100.0%% of Total 26.5% 52.9% 20.6% 100.0%
118
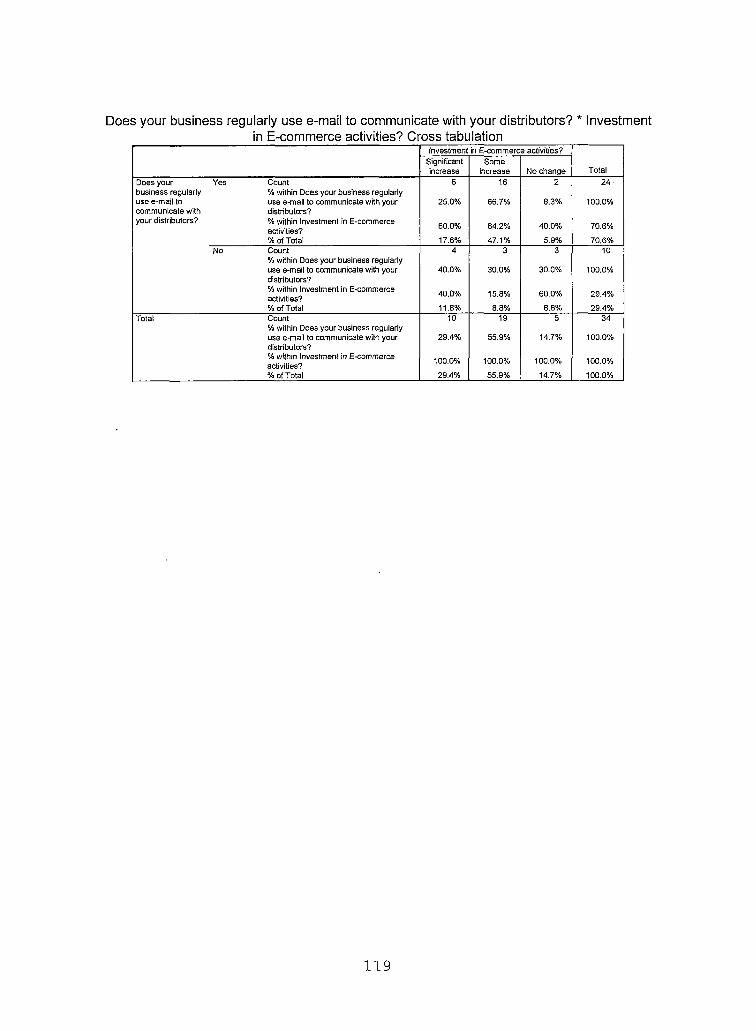
Does your business regularly use e-mail to communicate with your distributors? * Investmentin E-commerce activities? Cross tabulation
Investment in E-commerce activities?
TotalSignificantincrease
Someincrease No change
Does your Yes Count 6 16 2 24business regularly % within Does your business regularlyuse e-mail to use e-mail to communicate with your 25.0% 66.7% 8.3% 100.0%communicate with distributors?your distributors? % within Investment in E-commerce
activities? 60.0% 84.2% 40.0% 70.6%
% of Total 17.6% 47.1% 5.9% 70.6%No Count 4 3 3 10
% within Does your business regularly use e-mail to communicate with your distributors?
40.0% 30.0% 30.0% 100.0%
% within Investment in E-commerce activities? 40.0% 15.8% 60.0% 29.4%
% of Total 11.8% 8.8% 8.8% 29.4%Total Count
% within Does your business regularly10 19 5 34
use e-mail to communicate with your 29.4% 55.9% 14.7% 100.0%distributors?% within Investment in E-commerce activities? 100.0% 100.0% 100.0% 100.0%
% of Total 29.4% 55.9% 14.7% 100.0%
119
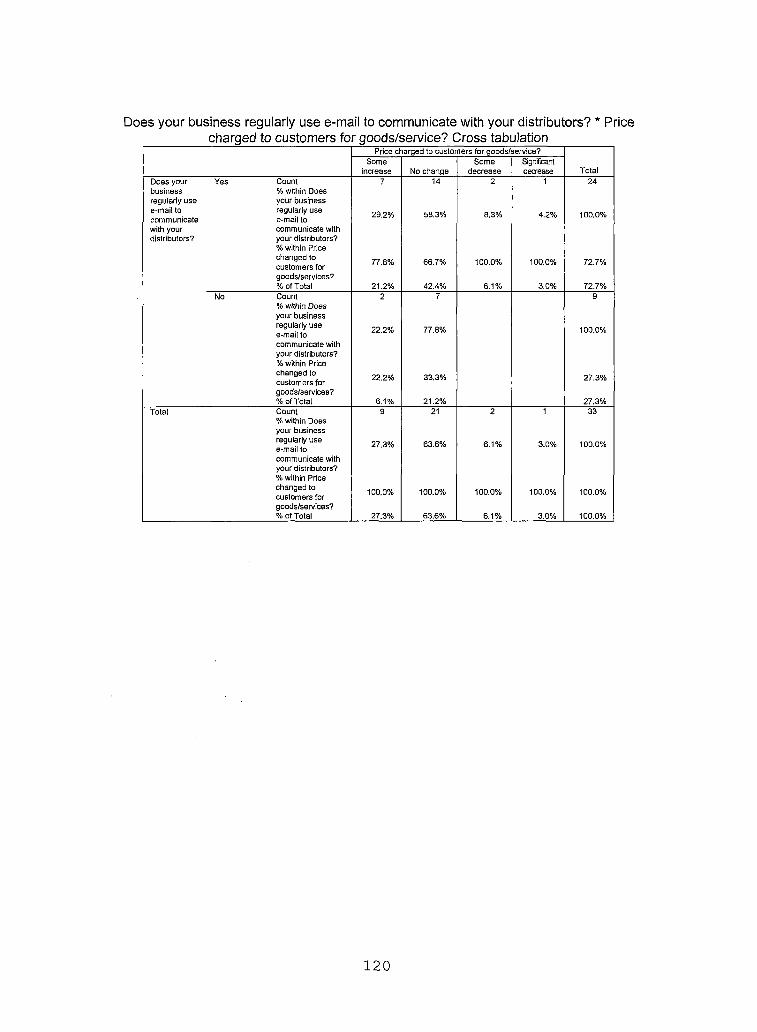
Does your business regularly use e-mail to communicate with your distributors? * Pricecharged to customers for goods/service? Cross tabulation
Price charged to customers for goods/service?
TotalSome
increase No changeSome
decreaseSignificantdecrease
Doss your Yes Count 7 14 2 1 24business % within Doesregularly use your businesse-mail to regularly use 29.2% 58.3% 8.3% 4.2% 100.0%communicate e-mail towith your communicate withdistributors? your distributors?
% within Price changed to customers for goods/services?
77.8% 66.7% 100.0% 100.0% 72.7%
% of Total 21.2% 42.4% 6.1% 3.0% 72.7%No Count
% within Does2 7 9
your business regularly use e-mail tocommunicate with
22.2% 77.8% 100.0%
your distributors?% within Price changed to customers for 22.2% 33.3% 27.3%
goods/services?% of Total 6.1% 21.2% 27.3%
Total Count% within Does your business
9 21 2 1 33
regularly use e-mail to 27.3% 63.6% 6.1% 3.0% 100.0%
communicate with your distributors?% within Price changed to customers for 100.0% 100.0% 100.0% 100.0% 100.0%
goods/services?% of Total 27.3% 63.6% 6.1% 3.0% 100.0%
120
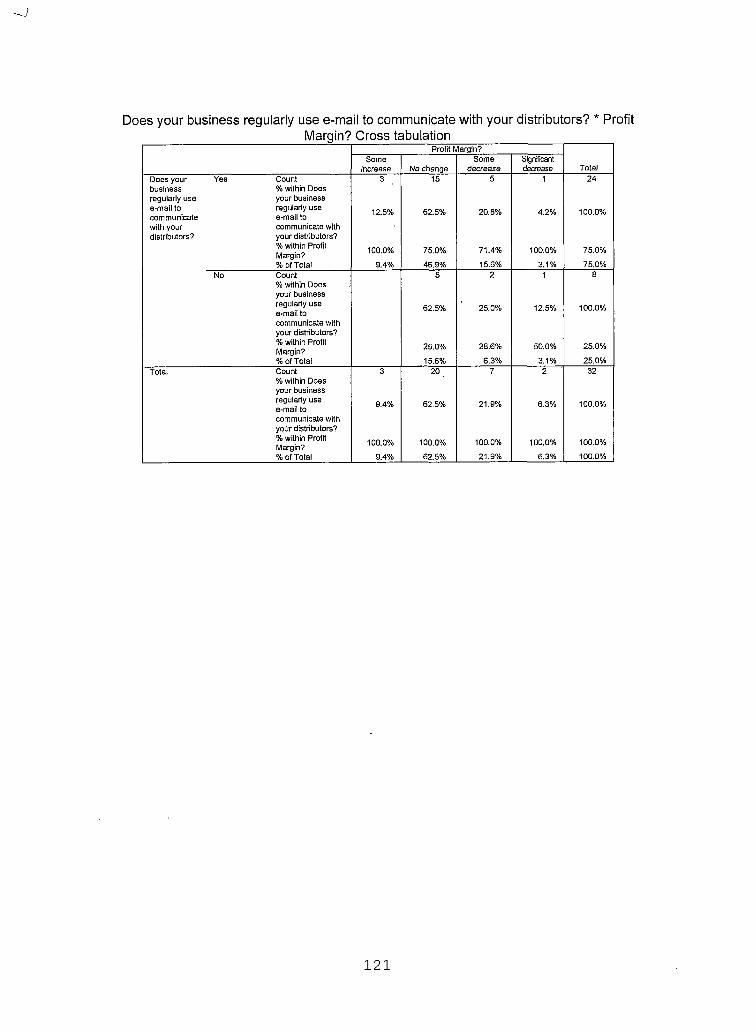
1
Does your business regularly use e-mail to communicate with your distributors? * ProfitMargin? Cross tabulation
Profit Margin?
TotalSome
increase No changeSome
decreaseSignificantdecrease
Does your Yes Count 3 15 5 1 24business % within Doesregularly use your businesse-mail to regularly use 12.5% 62.5% 20.8% 4.2% 100.0%communicate e-mail towith your communicate withdistributors? your distributors?
% within Profit 100.0% 75.0% 71.4% 100.0% 75.0%Margin?% of Total 9.4% 46.9% 15.6% 3.1% 75.0%
No Count% within Does
5 2 1 8
your business regularly use e-mail to 62.5% 25.0% 12.5% 100.0%
communicate with your distributors?% within Profit Margin? 25.0% 28.6% 50.0% 25.0%
% ofTotal 15.6% 6.3% 3.1% 25.0%Total Count 3 20 7 2 32
% within Does your business regularly use e-mail to 9.4% 62.5% 21.9% 6.3% 100.0%
communicate with your distributors?% within Profit Margin? 100.0% 100.0% 100.0% 100.0% 100.0%
% of Total 9.4% 62.5% 21.9% 6.3% 100.0%
121
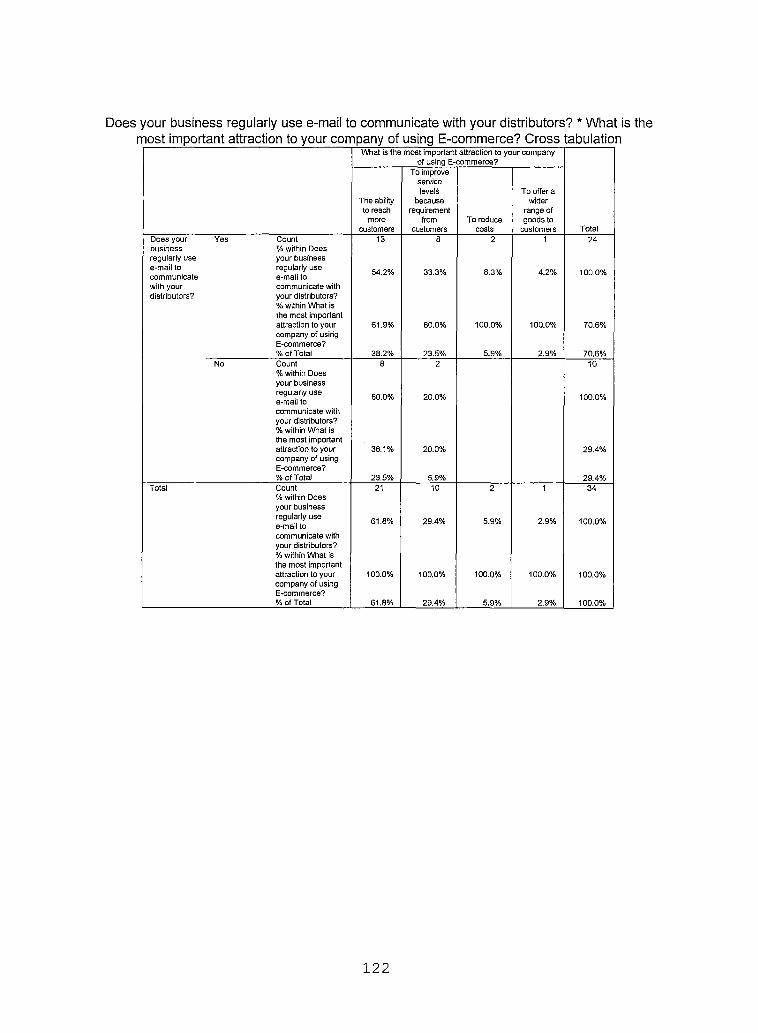
Does your business regularly use e-mail to communicate with your distributors? * What is themost important attraction to your company of using E-commerce? Cross tabulation
What is the most important attraction to your company of using E-commerce?
Total
The ability to reach
morecustomers
To improve service levels
becauserequirement
fromcustomers
To reduce costs
To offers wider
range ofgoods to
customersDoes your Yes Count 13 8 2 1 24business % within Doesregularly use your businesse-mail to communicate
regularly use e-mail to 54.2% 33.3% 8.3% 4.2% 100.0%
with your communicate withdistributors? your distributors?
% within What isthe most important attraction to your company of using E-commerce?
61.9% 80.0% 100.0% 100.0% 70.6%
% of Total 38.2% 23.5% 5.9% 2.9% 70.6%No Count
% within Does8 2 10
your business regularly use e-mail tocommunicate with
80.0% 20.0% 100.0%
your distributors?% within What is the most important attraction to your company of using
38.1% 20.0% 29.4%
E-commerce?% of Total 23.5% 5.9% 29.4%
Total Count% within Does your business
21 10 2 1 34
regularly use e-mail to 61.8% 29.4% 5.9% 2.9% 100.0%
communicate with your distributors?% within What is the most important attraction to your company of using
100.0% 100.0% 100.0% 100.0% 100.0%
E-commerce?% of Total 61.8% 29.4% 5.9% 2.9% 100.0%
122
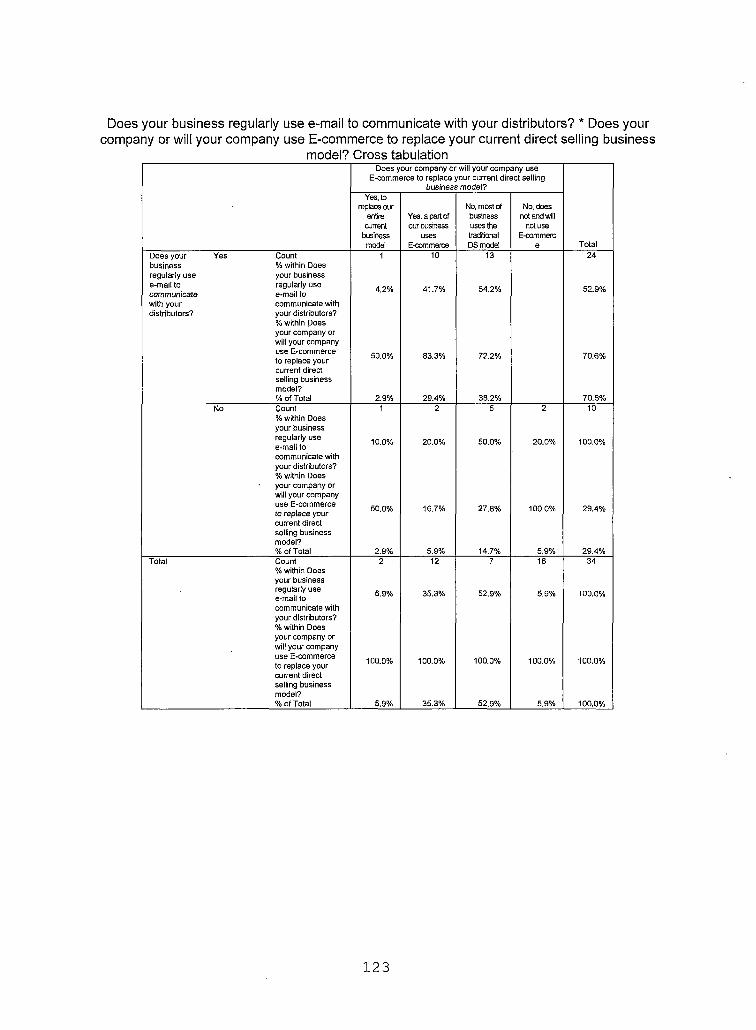
Does your business regularly use e-mail to communicate with your distributors? * Does your company or will your company use E-commerce to replace your current direct selling business
model? Cross tabulationDoes your company or will your company use
E-commerce to replace your current direct selling business model?
Total
Yes, to replace our
entire current
business model
Yes, a part of our business
usesE-commerce
No, most of business uses the traditionalDS model
No, does not and will
not use E-commerc
eDoes your Yes Countbusiness % within Doesregularly use your businesse-mail to regularly usecommunicate e-mail towith your communicate withdistributors? your distributors?
% within Does your company or will your company use E-commerce to replace your current direct selling business model?% of Total
1
4.2%
50.0%
2.9%
10
41.7%
83.3%
29.4%
13
54.2%
72.2%
38.2%
24
52.9%
70.6%
70.6%No Count
% within Does your business regularly use e-mail tocommunicate with your distributors?% within Does
* your company or will your company use E-commerce to replace your current direct selling business model?% of Total
1
10.0%
50.0%
2.9%
2
20.0%
16.7%
5.9%
5
50.0%
27.8%
14.7%
2
20.0%
100.0%
5.9%
10
100.0%
29.4%
29.4%Total Count
% within Does your business regularly use e-mail tocommunicate with your distributors?% within Does your company or will your company use E-commerce to replace your current direct selling business model?% of Total
2
5.9%
100.0%
5.9%
12
35.3%
100.0%
35.3%
7
52.9%
100.0%
52.9%
18
5.9%
100.0%
5.9%
34
100.0%
100.0%
100.0%
123
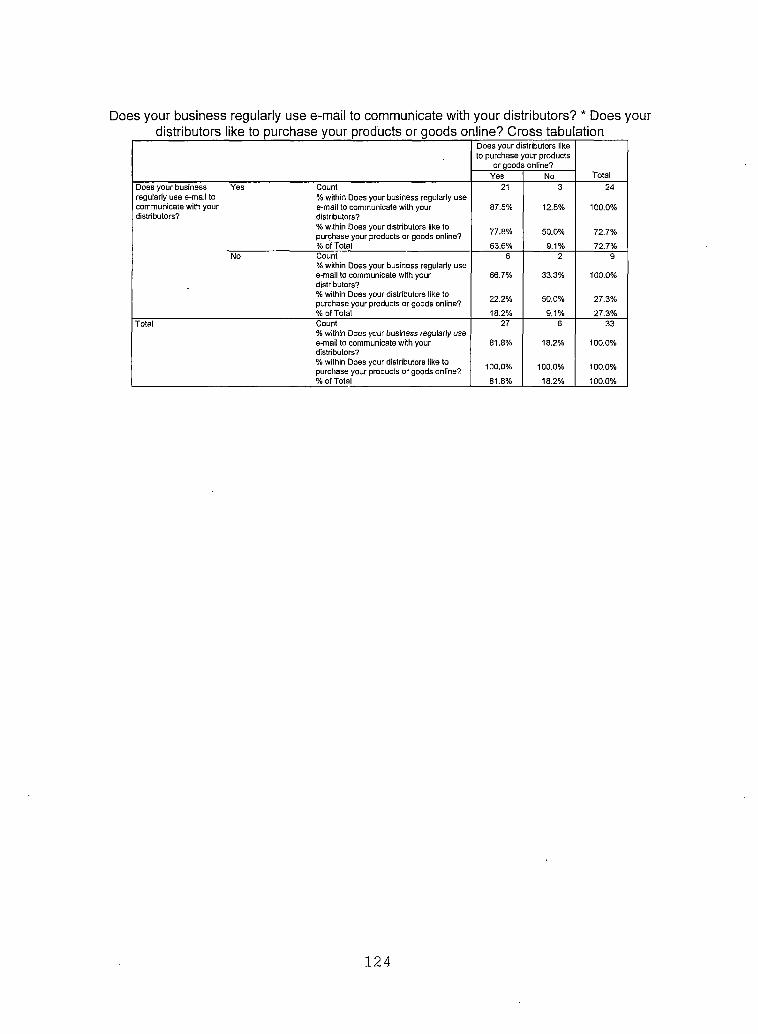
Does your business regularly use e-mail to communicate with your distributors? * Does yourdistributors like to purchase your products or goods online? Cross tabu ation
Does your distributors like to purchase your products
or goods online?Yes No Total
Does your business Yes Count 21 3 24regularly use e-mail to % within Does your business regularly usecommunicate with your e-mail to communicate with your 87.5% 12.5% 100.0%distributors? distributors?
% within Does your distributors like to purchase your products or goods online? 77.8% 50.0% 72.7%
% of Total 63.6% 9.1% 72.7%No Count
% within Does your business regularly use6 2 9
e-mail to communicate with your distributors?
66.7% 33.3% 100.0%
% within Does your distributors like to purchase your products or goods online? 22.2% 50.0% 27.3%
% of Total 18.2% 9.1% 27.3%Total Count
% within Does your business regularly use27 6 33
e-mail to communicate with your distributors?
81.8% 18.2% 100.0%
% within Does your distributors like to purchase your products or goods online? 100.0% 100.0% 100.0%
% of Total 81.8% 18.2% 100.0%
124
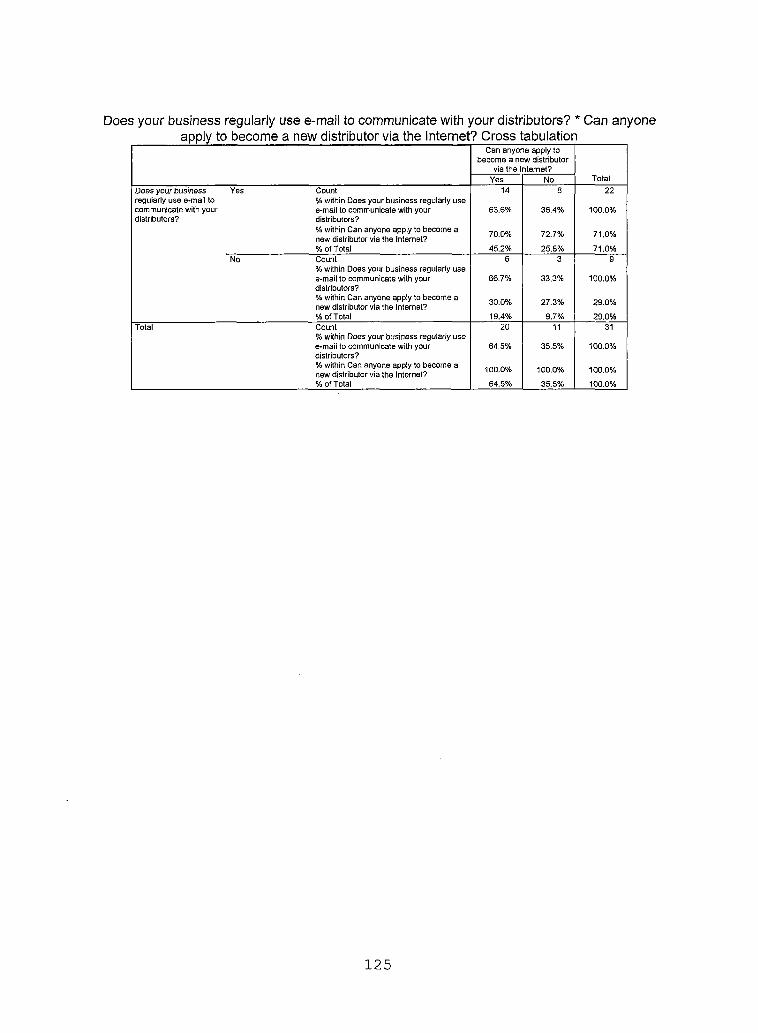
Does your business regularly use e-mail to communicate with your distributors? * Can anyone apply to become a new distributor via the Internet? Cross tabulation
Can anyone apply to become a new distributor
via the Internet?TotalYes No
Does your business Yes Count 14 8 22regularly use e-mail to % within Does your business regularly usecommunicate with your e-mail to communicate with your 63.6% 36.4% 100.0%distributors? distributors?
% within Can anyone apply to become a new distributor via the Internet? 70.0% 72.7% 71.0%
% of Total 45.2% 25.8% 71.0%No Count
% within Does your business regularly use6 3 9
e-mail to communicate with your distributors?
66.7% 33.3% 100.0%
% within Can anyone apply to become a new distributor via the Internet? 30.0% 27.3% 29.0%
% of Total 19.4% 9.7% 29.0%Total Count
% within Does your business regularly use20 11 31
e-mail to communicate with your distributors?
64.5% 35.5% 100.0%
% within Can anyone apply to become a new distributor via the Internet?
100.0% 100.0% 100.0%
% of Total 64.5% 35.5% 100.0%
125
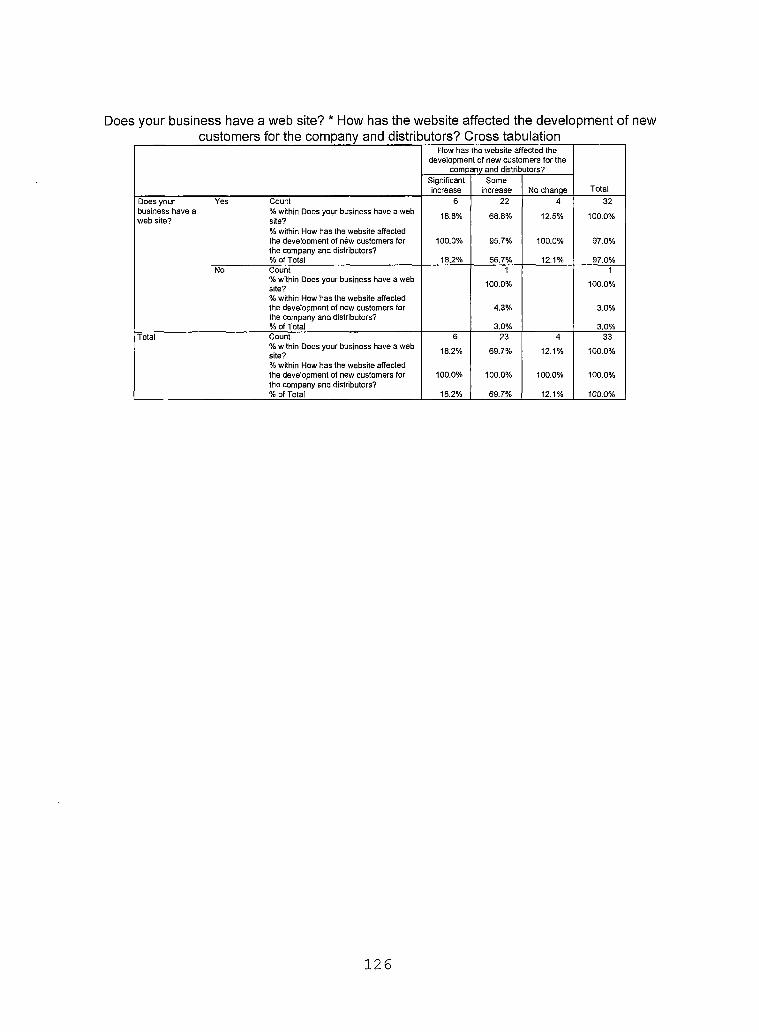
Does your business have a web site? * How has the website affected the development of newcustomers for the company and distributors? Cross tabulation
How has the website affected the development of new customers for the
company and distributors?
TotalSignificantincrease
Someincrease No change
Does your Yes Count 6 22 4 32business have a web site?
% within Does your business have a web site? 18.8% 68.8% 12.5% 100.0%
% within How has the website affected the development of new customers for the company and distributors?
100.0% 95.7% 100.0% 97.0%
% of Total 18.2% 66.7% 12.1% 97.0%No Count 1 1
% within Does your business have a web site? 100.0% 100,0%
% within How has the website affected the development of new customers for the company and distributors?
4.3% 3.0%
% of Total 3.0% 3.0%Total Count 6 23 4 33
% within Does your business have a web site? 18.2% 69.7% 12.1% 100.0%
% within How has the website affected the development of new customers for the company and distributors?
100.0% 100.0% 100.0% 100.0%
% of Total 18.2% 69.7% 12.1% 100.0%
126
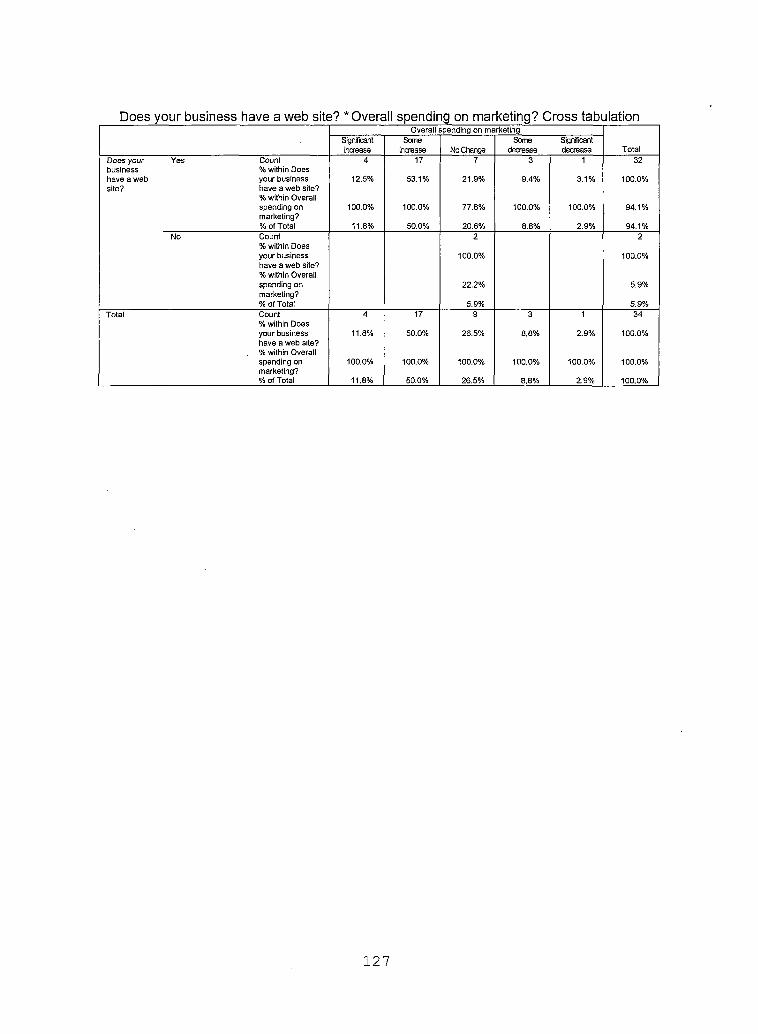
Does your business have a web site? ‘Overall spending on marketing? Cross tabulationOverall spending on marketing
TotalSignificantincrease
Someincrease No Change
Somedecrease
Significantdecrease
Does your Yes Count 4 17 7 3 1 32business % within Doeshave a web your business 12.5% 53.1% 21.9% 9.4% 3.1% 100.0%site? have a web site?
% within Overall spending on marketing?
100.0% 100.0% 77.8% 100.0% 100.0% 94.1%
% of Total 11.8% 50.0% 20.6% 8.8% 2.9% 94.1%No Count
% within Does2 2
your business have a web site?% within Overall
100.0% 100.0%
spending on marketing?
22.2% 5.9%
% of Total 5.9% 5.9%Total Count
% within Does4 17 9 3 1 34
your business have a web site?
11.8% 50.0% 26.5% 8.8% 2.9% 100.0%
% within Overall spending on 100.0% 100.0% 100.0% 100.0% 100.0% 100.0%marketing?% of Total 11.8% 50.0% 26.5% 8.8% 2.9% 100.0%
127
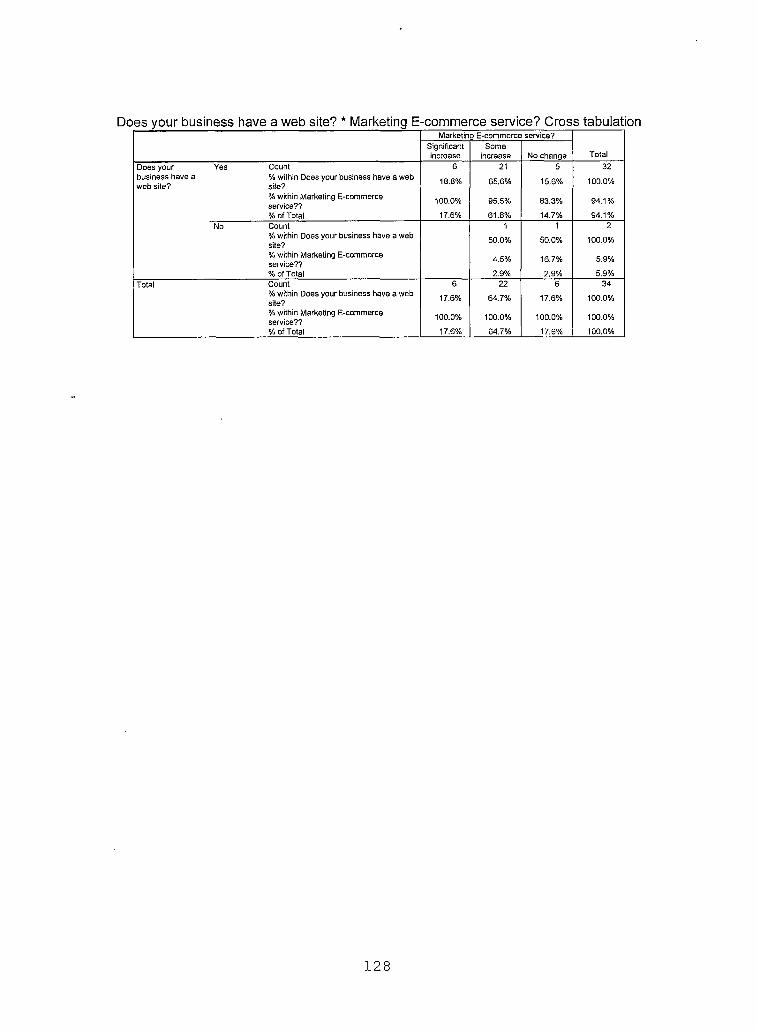
Does your business have a web site? * Marketing E-commerce service? Cross tabulationMarketing E-commerce service?
TotalSignificantincrease
Someincrease No change
Does your Yes Count 6 21 5 32business have a web site?
% within Does your business have a web site? 18.8% 65.6% 15.6% 100.0%
% within Marketing E-commerce service?? 100.0% 95.5% 83.3% 94.1%
% of Total 17.6% 61.8% 14.7% 94.1%No Count 1 1 2
% within Does your business have a web site? 50.0% 50.0% 100.0%
% within Marketing E-commerce service?? 4.5% 16.7% 5.9%
% of Total 2.9% 2.9% 5.9%Total Count 6 22 6 34
% within Does your business have a web site? 17.6% 64.7% 17.6% 100.0%
% within Marketing E-commerce service?? 100.0% 100.0% 100.0% 100.0%
% of Total 17.6% 64.7% 17.6% 100.0%
128
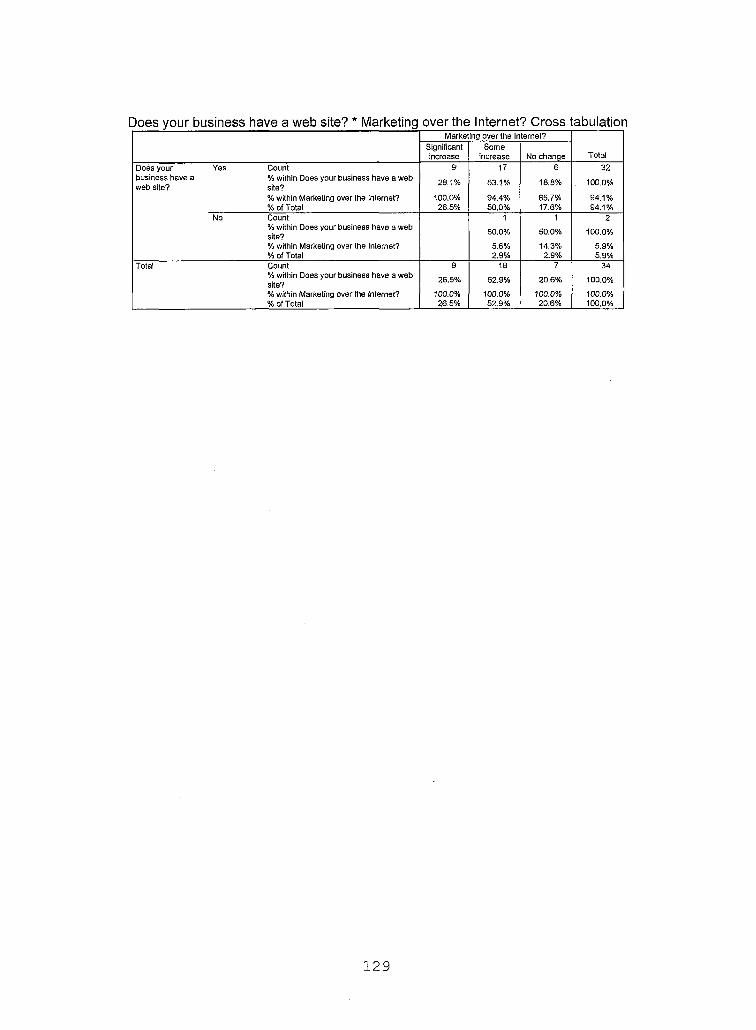
Does your business have a web site? * Marketing over the Internet? Cross tabulationMarketing over the Internet?
TotalSignificantincrease
Someincrease No change
Does your Yes Countbusiness have a % within Does your business have a webweb site? site?
% within Marketing over the internet?% of Total
9
28.1%
100.0%26.5%
17
53.1%
94.4%50.0%
6
18.8%
85.7%17.6%
32
. 100.0%
94.1%94.1%
No Count% within Does your business have a web site?% within Marketing over the Internet?% of Total
1
50,0%
5.6%2.9%
1
50.0%
14.3%2.9%
2
100.0%
5.9%5.9%
Total Count% within Does your business have a web site?% within Marketing over the Internet?% of Total
9
26.5%
100.0%26.5%
18
52.9%
100.0%52.9%
7
20.6%
100.0%20.6%
34
100.0%
100.0%100.0%
129
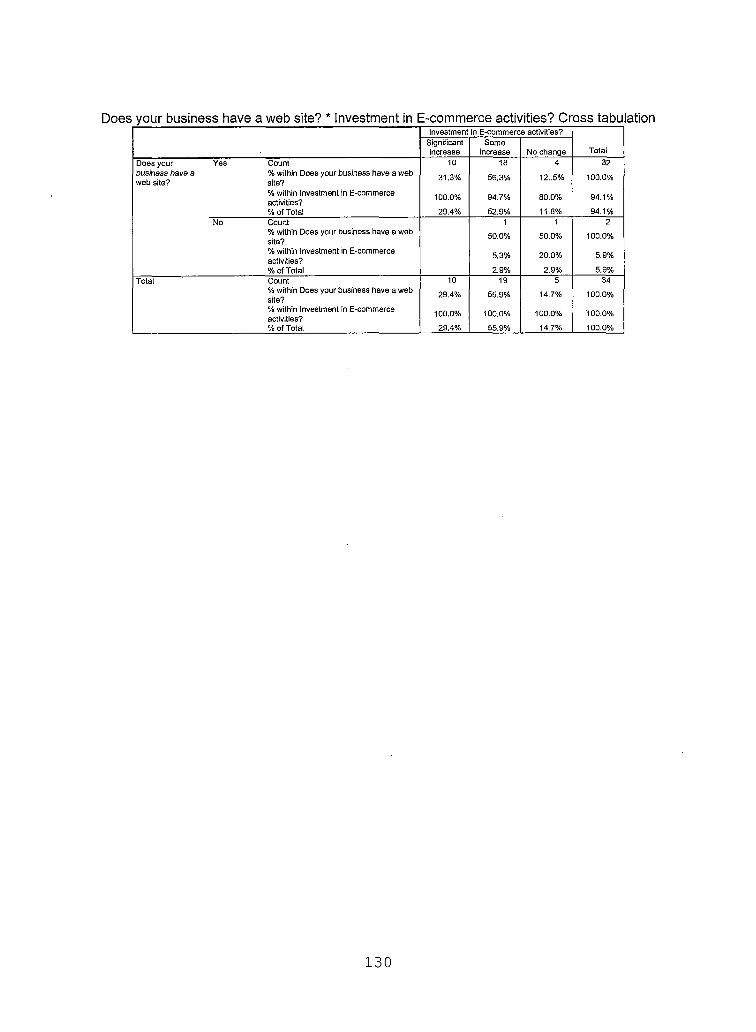
Does your business have a web site? * Investment in E-commerce activities? Cross tabu ationInvestment in E-commerce activities?
TotalSignificantincrease
Someincrease No change
Does your Yes Count 10 18 4 32business have a web site?
% within Does your business have a web site? 31.3% 56.3% 12..5% 100.0%
% within Investment in E-commerce activities? 100.0% 94.7% 80.0% 94.1 %
% of Total 29.4% 52.9% 11.8% 94.1%No Count 1 1 2
% within Does your business have a web 50.0% 50.0% 100.0%
% within Investment in E-commerce activities?
5.3% 20.0% 5.9%
% of Total 2.9% 2.9% 5.9%Total Count 10 19 5 34
% within Does your business have a web site?
29.4% 55.9% 14.7% 100.0%
% within investment in E-commerce activities?
100.0% 100.0% 100.0% 100.0%
% of Total 29.4% 55.9% 14.7% 100.0%
130
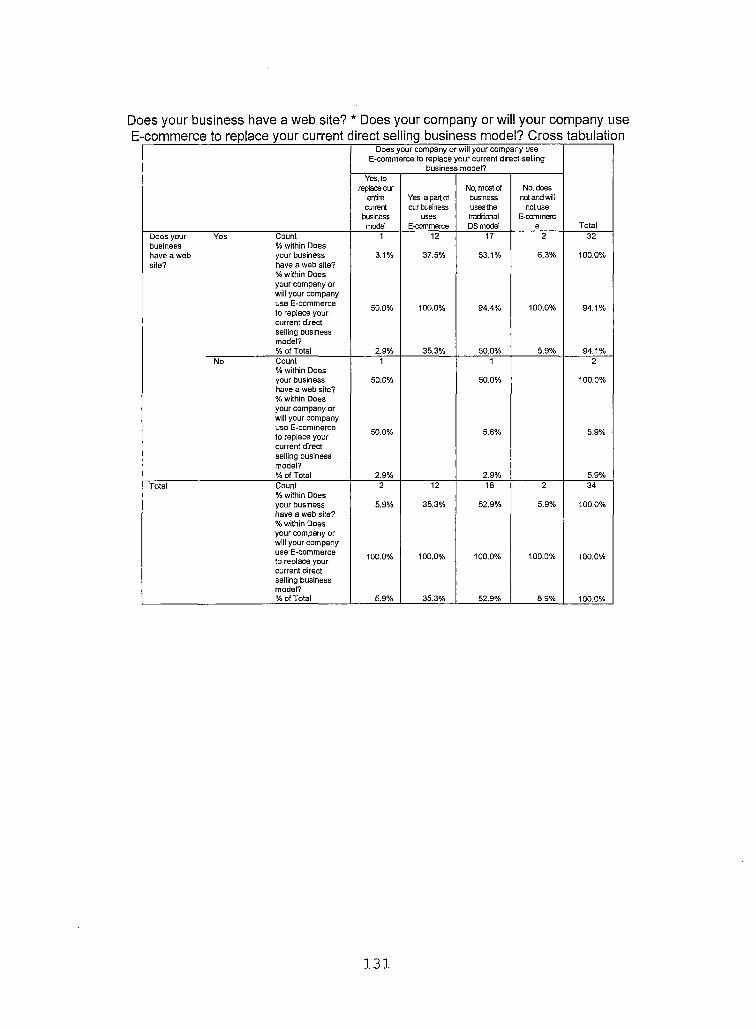
Does your business have a web site? * Does your company or will your company use E-commerce to replace your current direct selling business model? Cross tabulation
Does your company or will your company use E-commerce to replace your current direct selling
business model?
Total
Yes, to replace our
entire current
business model
Yes, a part of our business
usesE-commerce
No, most of business uses the traditionalDS model
No, does not and will
not use E-commero
eDoes your Yes Count 1 12 17 2 32business % within Doeshave a web your business 3.1% 37.5% 53.1% 6.3% 100.0%site? have a web site?
% within Doesyour company or will your company use E-commerce to replace your current direct
50.0% 100.0% 94.4% 100.0% 94.1%
selling business model?% of Total 2.9% 35.3% 50.0% 5.9% 94.1%
No Count% within Does
1 1 2
your business have a web site?% within Does
50.0% 50.0% 100.0%
your company or will your company use E-commerce to replace your current direct selling business model?
50.0% 5.6% 5.9%
% of Total 2.9% 2.9% 5.9%Total Count
% within Does2 12 18 2 34
your business have a web site?
5.9% 35.3% 52.9% 5.9% 100.0%
% within Doesyour company or will your company use E-commerce 100.0% 100.0% 100.0% 100.0% 100.0%to replace your current direct selling business model?% of Total 5.9% 35.3% 52.9% 5.9% 100.0%
131
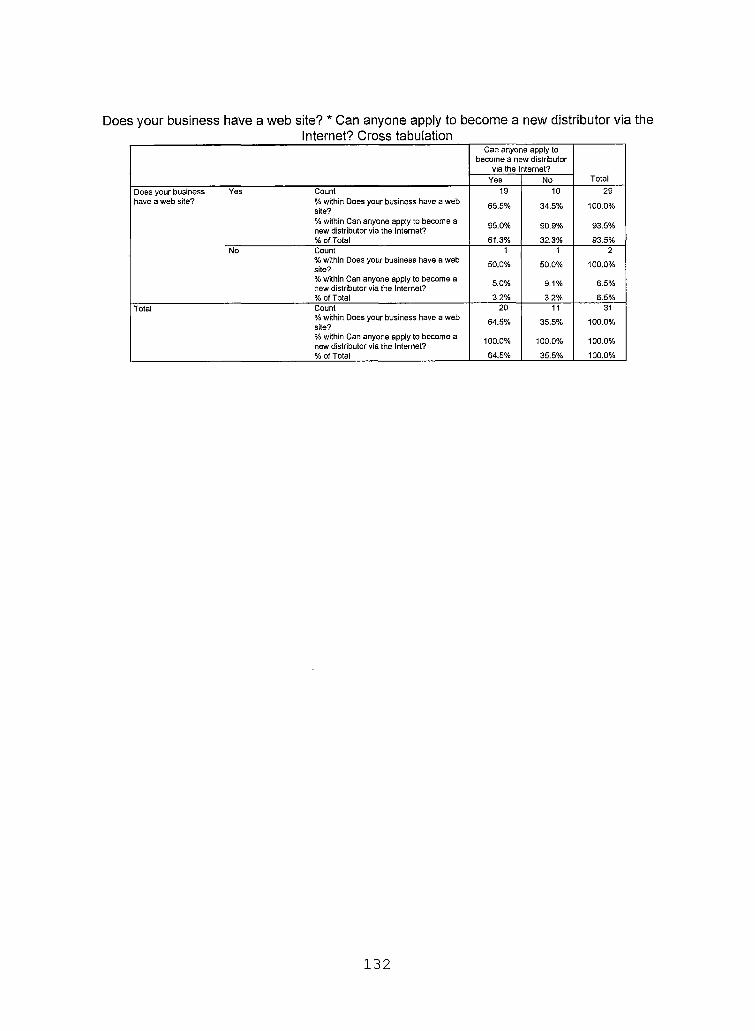
Does your business have a web site? * Can anyone apply to become a new distributor via the Internet? Cross tabulation
Can anyone apply to become a new distributor
via the Internet?TotalYes No
Does your business Yes Count 19 10 29have a web site? % within Does your business have a web
site? 65.5% 34.5% 100.0%
% within Can anyone apply to become a new distributor via the Internet? 95.0% 90.9% 93.5%
% of Total 61.3% 32.3% 93.5%No Count 1 1 2
% within Does your business have a web site? 50.0% 50.0% 100.0%
% within Can anyone apply to become a new distributor via the Internet? 5.0% 9.1% 6.5%
% of Total 3.2% 3.2% 6.5%Total Count 20 11 31
% within Does your business have a web site?
64.5% 35.5% 100.0%
% within Can anyone apply to become a new distributor via the Internet?
100.0% 100.0% 100.0%
% of Total 64.5% 35.5% 100.0%
132
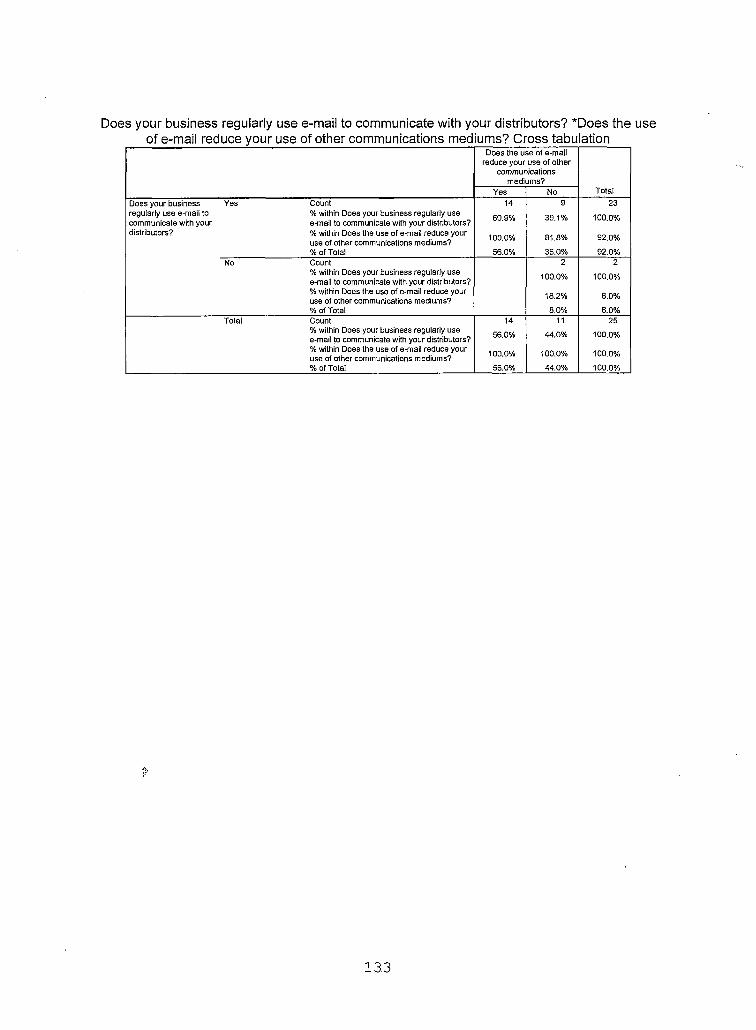
Does your business regularly use e-mail to communicate with your distributors? *Does the useof e-mail reduce your use of other communications mediums? Cross tabu ation
Does the use of e-mail reduce your use of other
communications mediums?
Yes No TotalDoes your business regularly use e-mail to communicate with your distributors?
Yes Count% within Does your business regularly use e-mail to communicate with your distributors? % within Does the use of e-mail reduce your use of other communications mediums?% of Total
14
60.9%
100.0%
56.0%
9
39.1%
81.8%
36.0%
23
100.0%
92.0%
92.0%No Count
% within Does your business regularly use e-mail to communicate with your distributors? % within Does the use of e-mail reduce your use of other communications mediums?% of Total
2
100.0%
18.2%
8.0%
2
100.0%
8.0%
8.0%Total Count
% within Does your business regularly use e-mail to communicate with your distributors? % within Does the use of e-mail reduce your use of other communications mediums?% of Total
14
56.0%
100.0%
56.0%
11
44.0%
100.0%
44.0%
25
100.0%
100.0%
100.0%
A,
133
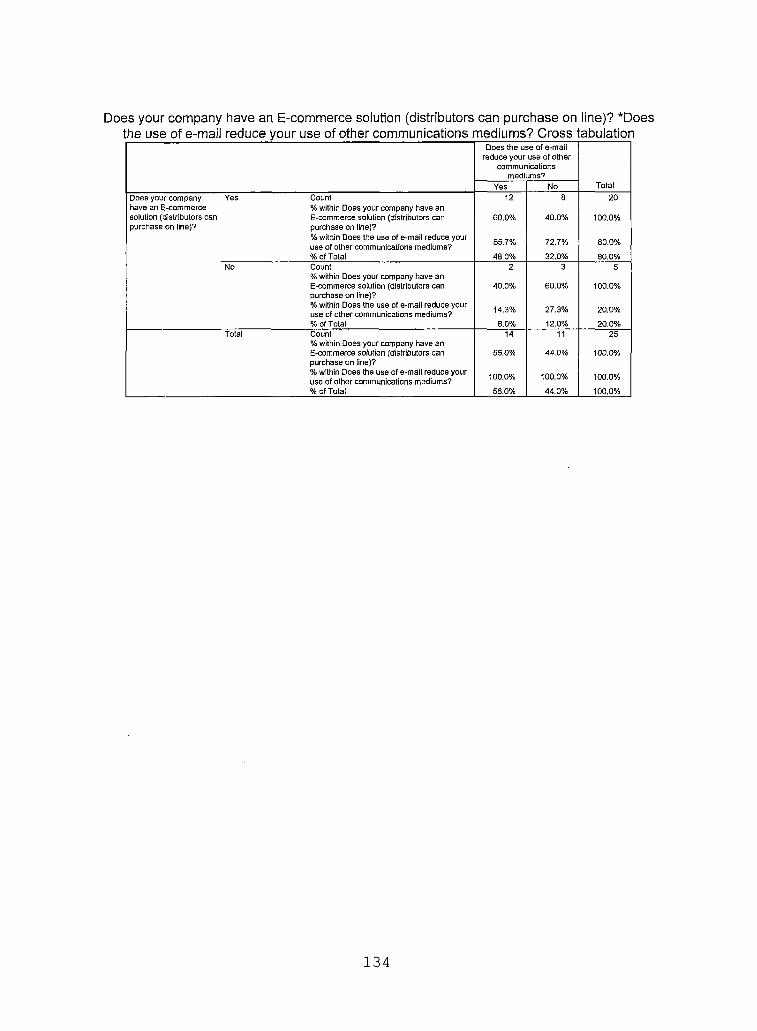
Does your company have an E-commerce solution (distributors can purchase on line)? *Doesthe use of e-mail reduce your use of other communications mediums? Cross tabulation
Does the use of e-mail reduce your use of other
communications mediums?
TotalYes NoDoes your company Yes Count 12 8 20have an E-commerce % within Does your company have ansolution (distributors can E-commerce solution (distributors can 60.0% 40.0% 100.0%purchase on line)? purchase on line)?
% within Does the use of e-mail reduce your use of other communications mediums? 85.7% 72.7% 80.0%
% ofTotal 48.0% 32.0% 80.0%No Count 2 3 5
% within Does your company have an E-commerce solution (distributors can purchase on line)?
40.0% 60.0% 100.0%
% within Does the use of e-mail reduce your use of other communications mediums? 14.3% 27.3% 20.0%
% of Total 8.0% 12.0% 20.0%Total Count
% within Does your company have an14 11 25
E-commerce solution (distributors can purchase on line)?
56.0% 44.0% 100.0%
% within Does the use of e-mail reduce your use of other communications mediums? 100.0% 100.0% 100.0%
% ofTotal 56.0% 44.0% 100.0%
134
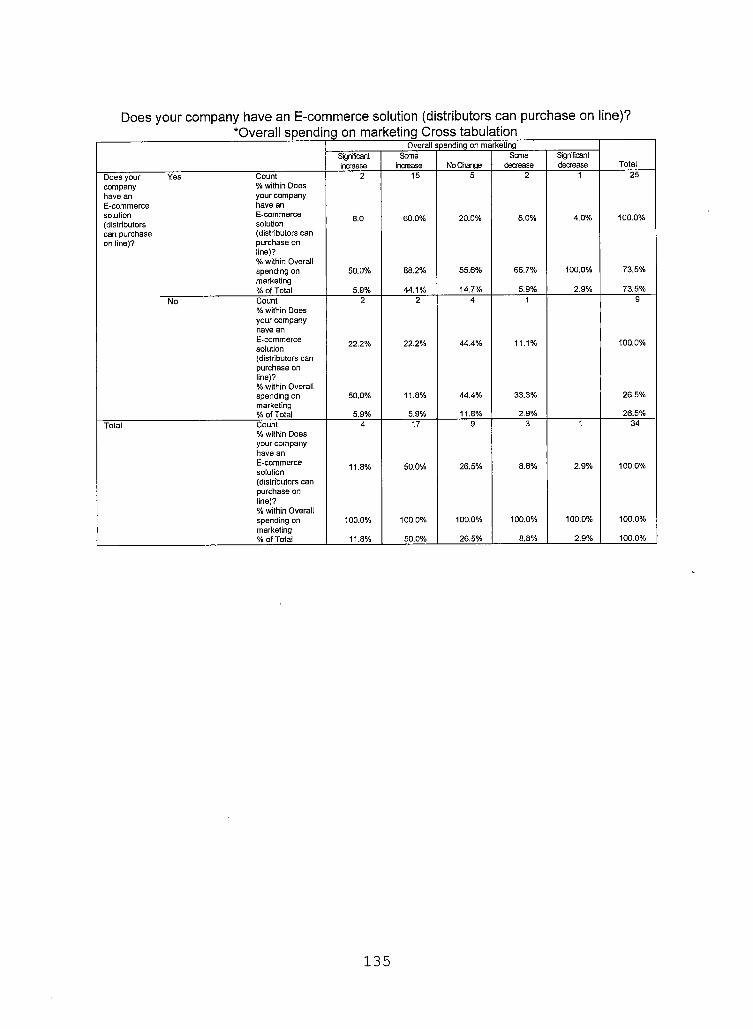
Does your company have an E-commerce solution (distributors can purchase on line)?‘Overall spending on marketing Cross tabulation
Overall spending on marketing
TotalSignificantincrease
Someincrease No Change
Somedecrease
Significantdecrease
Does your Yes Count 2 15 5 2 1 25company % within Doeshave an your companyE-commerce have ansolution E-commerce 8.0 60.0% 20.0% 8.0% 4.0% 100.0%(distributors solutioncan purchase (distributors canon line)? purchase on
line)?% within Overall spending on marketing
50.0% 88.2% 55.6% 66.7% 100.0% 73.5%
% of Total 5.9% 44.1% 14.7% 5.9% 2.9% 73.5%No Count
% within Does2 2 4 1 9
your company have anE-commercesolution 22.2% 22.2% 44.4% 11.1% 100.0%
(distributors can purchase on line)?% within Overallspending on 50.0% 11.8% 44.4% 33.3% 26.5%marketing % of Total 5.9% 5.9% 11.8% 2.9% 26.5%
Total Count% within Does
4 17 9 3 1 34
your company have an E-commerce solution(distributors can purchase on line)?% within Overall
11.8% 50.0% 26.5% 8.8% 2.9% 100.0%
spending on marketing
100.0% 100.0% 100.0% 100.0% 100.0% 100.0%
% of Total 11.8% 50.0% 26.5% 8.8% 2.9% 100.0%
135
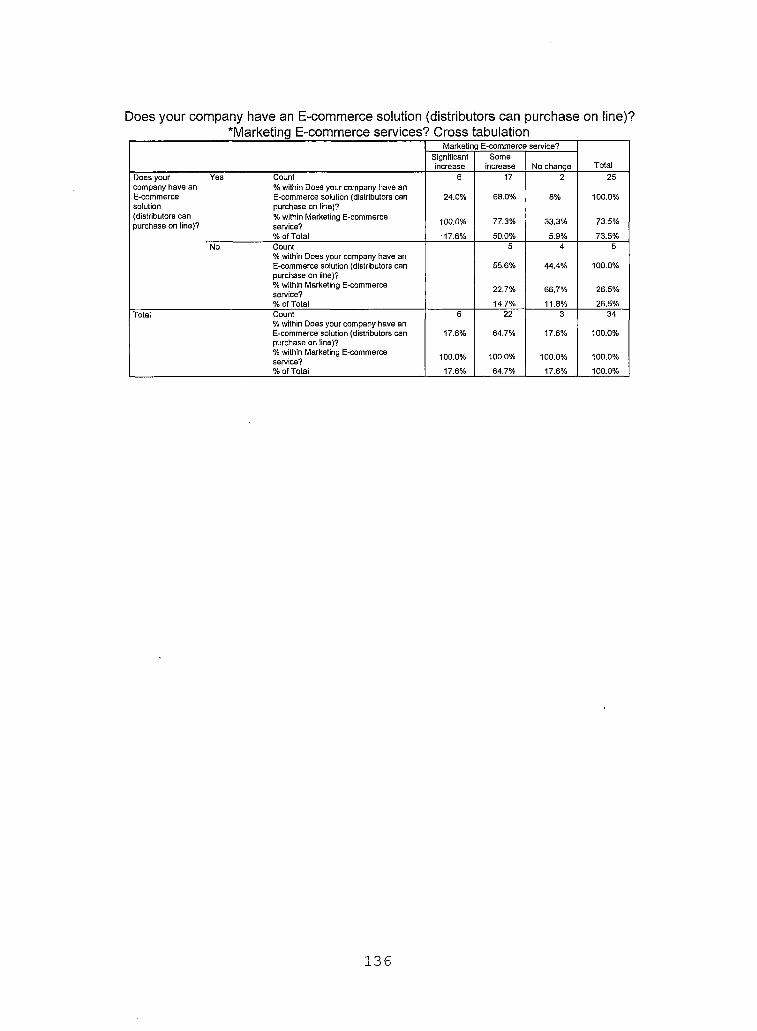
Does your company have an E-commerce solution (distributors can purchase on line)?‘Marketing E-commerce services? Cross tabulation
Marketing E-commerce service?
TotalSignificantincrease
Someincrease No change
Does your Yes Count 6 17 2 25company have an % within Does your company have anE-commerce E-commerce solution (distributors can 24.0% 68.0% 8% 100.0%solution purchase on line)?(distributors can purchase on line)?
% within Marketing E-commerce service? 100.0% 77.3% 33.3% 73.5%
% of Total ■17.6% 50.0% 5.9% 73.5%No Count
% within Does your company have an5 4 5
E-commerce solution (distributors can purchase on line)?
55.6% 44.4% 100.0%
% within Marketing E-commerce service? 22.7% 66.7% 26.5%
% of Total 14.7% 11.8% 26.5%Total Count 6 22 3 34
% within Does your company have an E-commerce solution (distributors can purchase on line)?
17.6% 64.7% 17.6% 100.0%
% within Marketing E-commerce service? 100.0% 100.0% 100.0% 100.0%
% of Total 17.6% 64.7% 17.6% 100.0%
136
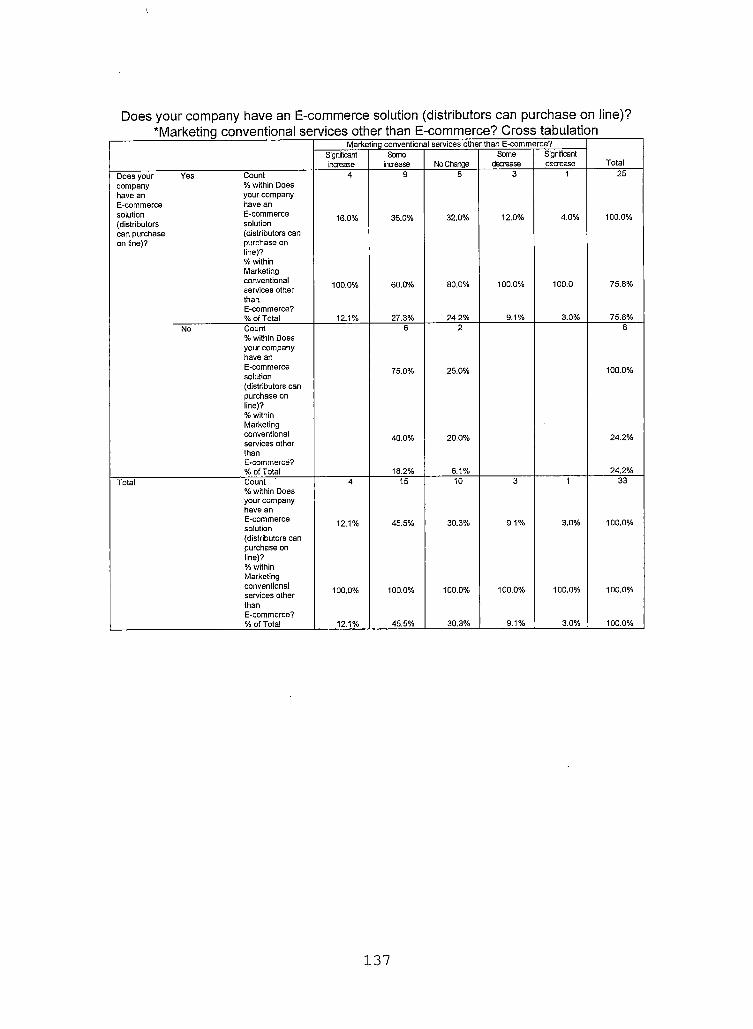
Does your company have an E-commerce solution (distributors can purchase on line)?*Marketing conventional services other than E-commerce? Cross tabulation
Marketing conventional services other than E-commerce?
TotalSignificantincrease
Someincrease No Change
Somedecrease
Significantdecrease
Does your Yes Count 4 9 8 3 1 25company % within Doeshave an your companyE-commerce have ansolution E-commerce 16.0% 36.0% 32.0% 12.0% 4.0% 100.0%(distributors solutioncan purchase (distributors canon line)? purchase on
line)?% withinMarketingconventional 100.0% 60.0% 80.0% 100.0% 100.0 75.8%services other thanE-commerce?% of Total 27.3% 24.2% 9.1% 3.0% 75.8%12.1%
No Count% within Does
6 2 8
your company have anE-commercesolution
75.0% 25.0% 100.0%
(distributors can purchase on line)?% withinMarketing conventional services other
40.0% 20.0% 24.2%
thanE-commerce?% of Total 18.2% 6.1% 24.2%
Total Count% within Does
4 15 10 3 1 33
your company have an E-commerce solution(distributors can purchase on line)?% within
12.1% 45.5% 30.3% 9.1% 3.0% 100.0%
Marketingconventional 100.0% 100.0% 100.0% 100.0% 100.0% 100.0%services other thanE-commerce?% of Total 9.1% 3.0% 100.0%12.1% 45.5% 30.3%
137
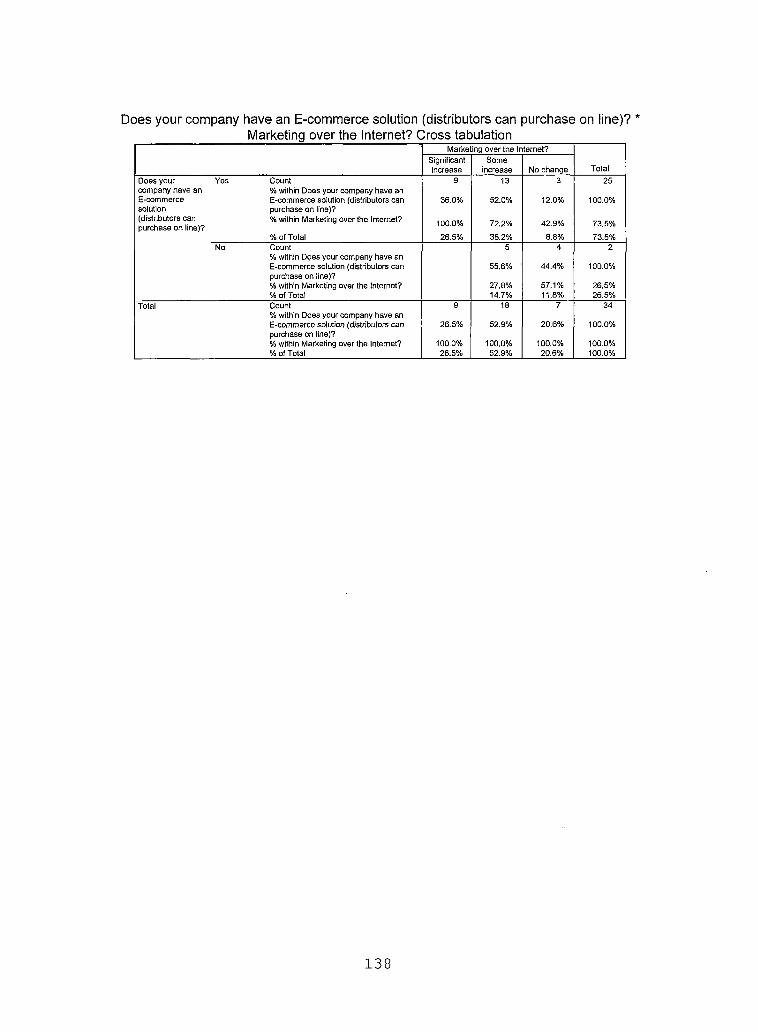
Does your company have an E-commerce solution (distributors can purchase on line)? *Marketing over the Internet? Cross tabulation
Marketing over the Internet?
TotalSignificantincrease
Someincrease No change
Does your Yes Count 9 13 3 25company have an % within Does your company have anE-commerce E-commerce solution (distributors can 36.0% 52.0% 12.0% 100.0%solution purchase on line)?(distributors can purchase on line)?
% within Marketing over the Internet? 100.0% 72.2% 42.9% 73.5%
% of Total 26.5% 38.2% 8.8% 73.5%No Count 5 4 2
% within Does your company have an E-commerce solution (distributors can purchase on line)?
55.6% 44.4% 100.0%
% within Marketing over the Internet? 27.8% 57.1% 26.5%% of Total 14.7% 11.8% 26.5%
Total Count% within Does your company have an
9 18 7 34
E-commerce solution (distributors can purchase on line)?
26.5% 52.9% 20.6% 100.0%
% within Marketing over the Internet? 100.0% 100.0% 100.0% 100.0%% of Total 26.5% 52.9% 20.6% 100.0%
138
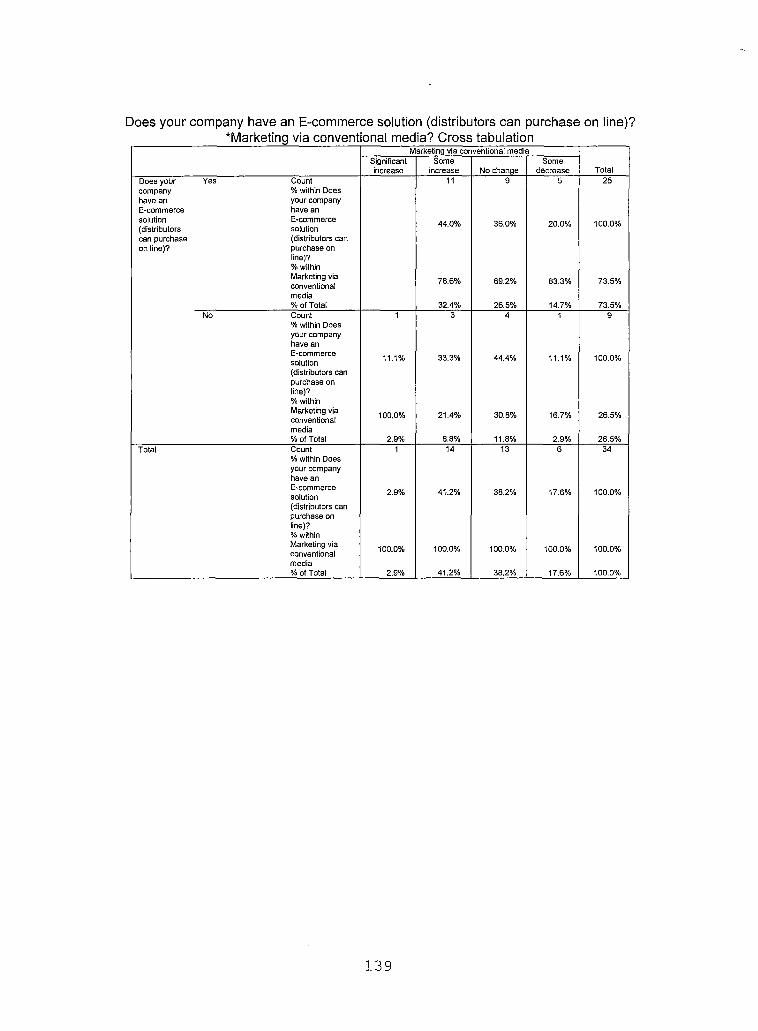
Does your company have an E-commerce solution (distributors can purchase on line)?"Marketing via conventional media? Cross tabulation
Marketing via conventional media
TotalSignificantincrease
Someincrease No change
Somedecrease
Does your Yes Count 11 9 5 25company % within Doeshave an your companyE-commerce have ansolution E-commerce 44.0% 36.0% 20.0% 100.0%{distributors solutioncan purchase (distributors canon line)? purchase on
line)?% withinMarketing via conventional 78.6% 69.2% 83.3% 73.5%
media % of Total 32.4% 26.5% 14.7% 73.5%
No Count% within Does
1 3 4 1 9
your company have anE-commercesolution(distributors can purchase on line)?% within
11.1% 33.3% 44.4% 11.1% 100.0%
Marketing via conventional 100.0% 21.4% 30.8% 16.7% 26.5%
media % of Total 2.9% 8.8% 11.8% 2.9% 26.5%
Total Count% within Does
1 14 13 6 34
your company have an E-commerce solution(distributors can purchase on line)?% within
2.9% 41.2% 38.2% 17.6% 100.0%
Marketing via conventional 100.0% 100.0% 100.0% 100.0% 100.0%
media % of Total 2.9% 41.2% 38.2% 17.6% 100,0%
139
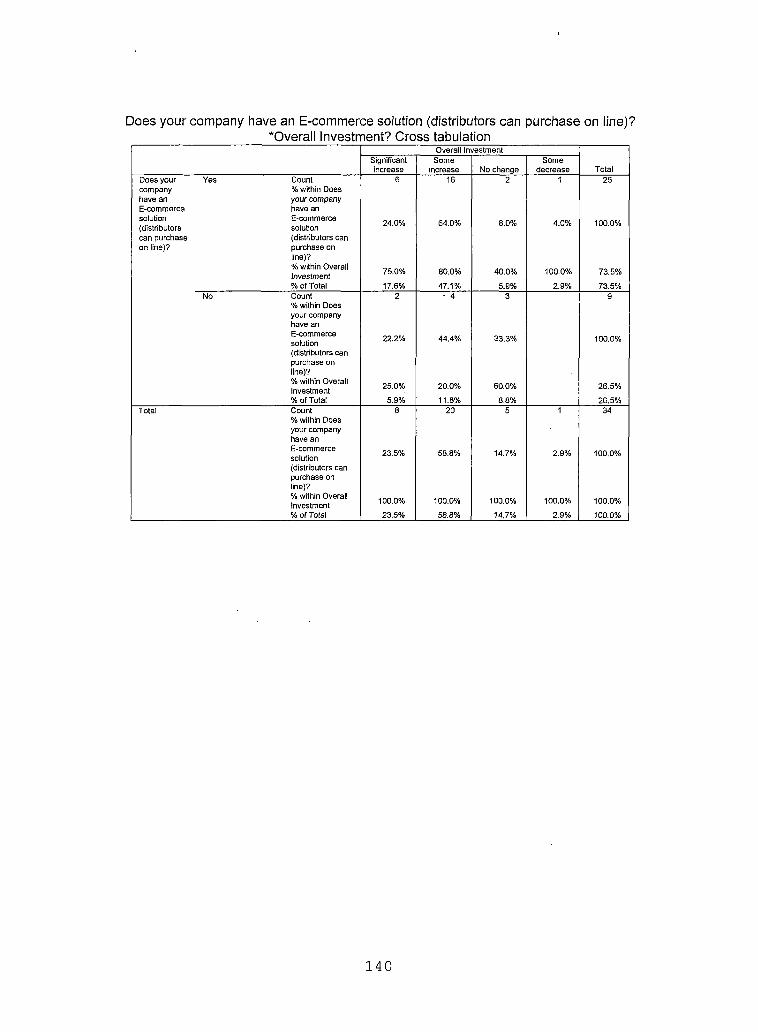
Does your company have an E-commerce solution (distributors can purchase on line)?‘Overall Investment? Cross tabulation
Overall Investment
TotalSignificantincrease
Someincrease No change
Somedecrease
Does your Yes Count 6 16 2 1 25company % within Doeshave an your companyE-commerce have ansolution(distributors
E-commercesolution 24.0% 64.0% 8.0% 4.0% 100.0%
can purchase (distributors canon line)? purchase on
line)?% within Overall Investment 75.0% 80.0% 40.0% 100.0% 73.5%
% of Total 17.6% 47.1% 5.9% 2.9% 73.5%No Count
% within Does2 • 4 3 9
your company have an E-commerce solution(distributors can purchase on line)?
22.2% 44.4% 33.3% 100.0%
% within Overall Investment 25.0% 20.0% 60.0% 26.5%
% ofTotal 5.9% 11.8% 8.8% 26.5%Total Count
% within Does8 20 5 1 34
your company have an E-commerce solution(distributors can purchase on line)?
23.5% 58.8% 14.7% 2.9% 100.0%
% within Overall investment 100.0% 100.0% 100.0% 100.0% 100.0%
% of Total 23.5% 58.8% 14.7% 2.9% 100.0%
140
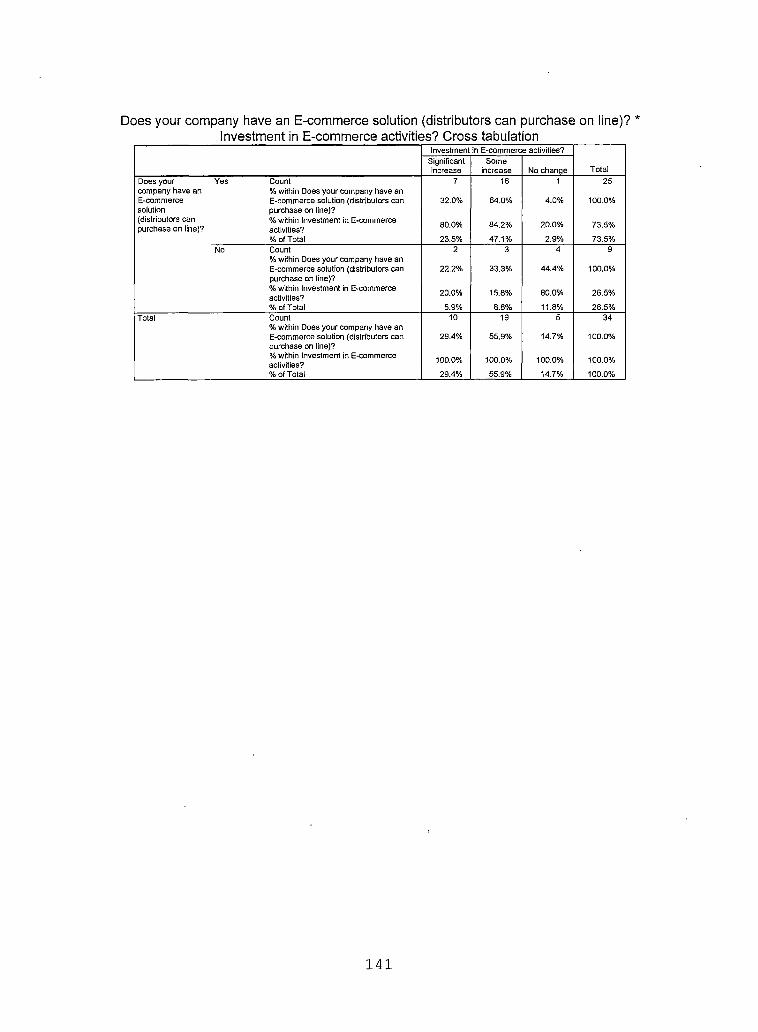
Does your company have an E-commerce solution (distributors can purchase on line)? *Investment in E-commerce activities? Cross tabulation
Investment in E-commerce activities?
TotalSignificantincrease
Someincrease No change
Does your Yes Countcompany have an % within Does your company have anE-commerce E-commerce solution (distributors cansolution purchase on line)?(distributors can % within Investment in E-commercepurchase on line)? activities?
% of Total
7
32.0%
80.0%
23.5%
16
64.0%
84.2%
47.1%
1
4.0%
20.0%
2.9%
25
100.0%
73.5%
73.5%No Count
% within Does your company have an E-commerce solution (distributors can purchase on line)?% within Investment in E-commerce activities?% of Total
2
22.2%
20.0%
5.9%
3
33.3%
15.8%
8.8%
4
44.4%
80.0%
11.8%
9
100.0%
26.5%
26.5%Total Count
% within Does your company have an E-commerce solution (distributors can purchase on line)?% within Investment in E-commerce activities?%of Total
10
29.4%
100.0%
29.4%
19
55.9%
100.0%
55,9%
5
14.7%
100.0%
14.7%
34
100.0%
100.0%
100.0%
141
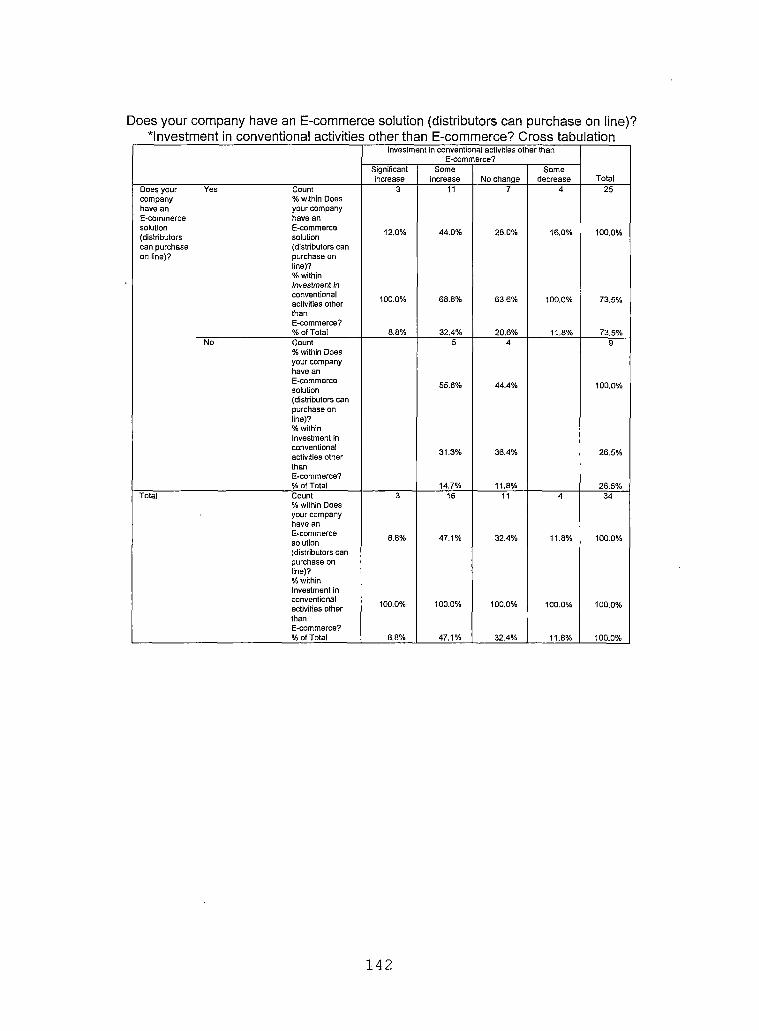
Does your company have an E-commerce solution (distributors can purchase on line)?‘Investment in conventional activities other than E-commerce? Cross tabulation
Investment in conventional activities other than E-commerce?
TotalSignificantincrease
Someincrease No change
Somedecrease
Does your Yes Count 3 11 7 4 25company % within Doeshave an your companyE-commerce have ansolution(distributors
E-commercesolution 12.0% 44.0% 28.0% 16.0% 100.0%
can purchase (distributors canon line)? purchase on
line)?% withinInvestment in conventional activities other thanE-commerce?
100.0% 68.8% 63.6% 100.0% 73.5%
%of Total 8.8% 32.4% 20.6% 11.8% 73.5%No Count
% within Does your company have an E-commerce solution(distributors can purchase on line)?% withinInvestment in conventional activities other thanE-commerce?% of Total
5
55.6%
31.3%
4
44.4%
36.4%
9
100.0%
26.5%
14.7% 11.8% 26.5%Total Count
% within Does3 16 11 4 34
your company have an E-commerce solution(distributors can purchase on line)?% within
8.8% 47.1% 32.4% 11.8% 100.0%
Investment in conventional activities other 100.0% 100.0% 100.0% 100.0% 100.0%
thanE-commerce?% of Total 8.8% 47.1% 32.4% 11.8% 100.0%
142
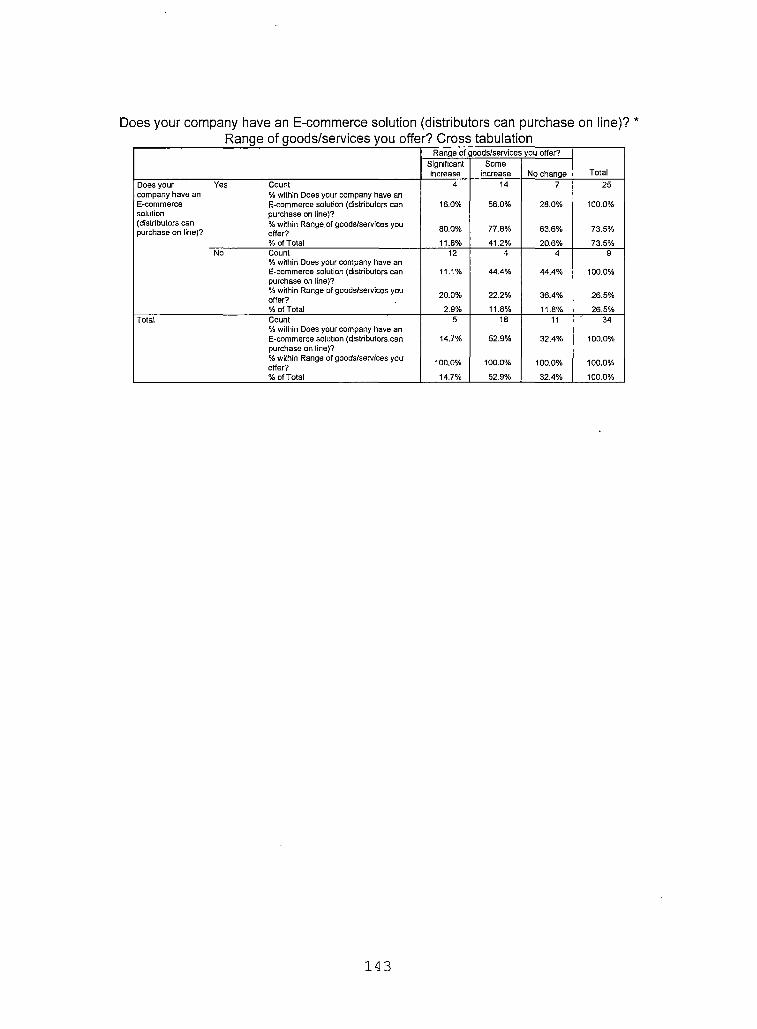
Does your company have an E-commerce solution (distributors can purchase on line)? *Range of goods/services you offer? Cross tabulation
Range of goods/services you offer?
TotalSignificantincrease
Someincrease No change
Does your Yes Countcompany have an % within Does your company have anE-commerce E-commerce solution (distributors cansolution purchase on line)?(distributors can % within Range, of goods/services youpurchase on line)? offer?
% of Total
4
16.0%
80.0%
11.8%
14
56.0%
77.8%
41.2%
7
28.0%
63.6%
20.6%
25
100.0%
73.5%
73.5%No Count
% within Does your company have an E-commerce solution (distributors can purchase on line)?% within Range of goods/services you offer?% of Total
12
11.1%
20.0%
2.9%
4
44.4%
22.2%
11.8%
4
44.4%
36.4%
11.8%
9
100.0%
26.5%
. 26.5%Total Count
% within Does your company have an E-commerce solution (distributors can purchase on line)?% within Range of goods/services you offer?% of Total
5
14.7%
100.0%
14.7%
18
52.9%
100.0%
52.9%
11
32.4%
100.0%
32.4%
34
100.0%
100.0%
100.0%
143
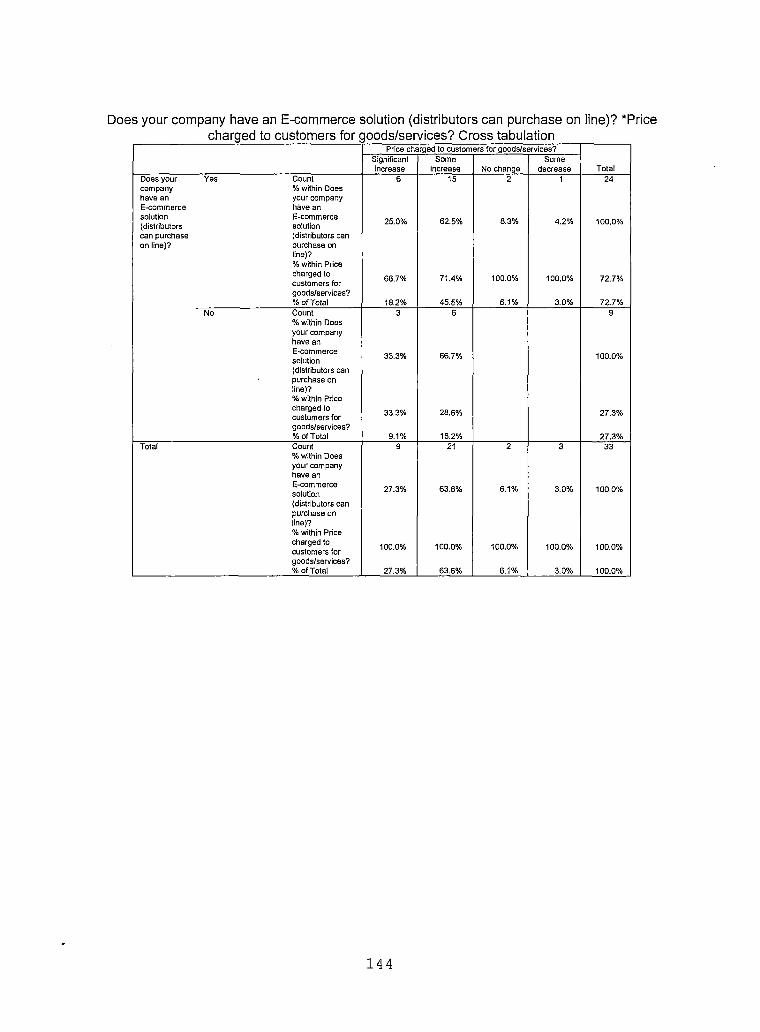
Does your company have an E-commerce solution (distributors can purchase on line)? "Pricecharged to customers for goods/services? Cross tabulation
Price charged to customers for goods/services?
TotalSignificantincrease
Someincrease No change
Somedecrease
Does your Yes Count 6 15 2 1 24company % within Doeshave an your companyE-commerce have ansolution(distributors
E-commercesolution 25.0% 62.5% 8.3% 4.2% 100.0%
can purchase (distributors canon line)? purchase on
line)?% within Price charged to customers for 66.7% 71.4% 100.0% 100.0% 72.7%
goods/services?% of Total 18.2% 45.5% 6.1% 3.0% 72.7%
No Count% within Does
3 6 9
your company have anE-commercesolution(distributors can purchase on line)?% within Price
33.3% 66.7% 100.0%
charged to customers for 33.3% 28.6% 27.3%
goods/services?% of Total 9.1% 18.2% 27.3%
Total Count% within Does
9 21 2 3 33
your company have an E-commerce solution(distributors can purchase on line)?% within Price
27.3% 63.6% 6.1% 3.0% 100.0%
charged to customers for 100.0% 100.0% 100.0% 100.0% 100.0%
goods/services?% of Total 27.3% 63.6% 6.1% 3.0% 100.0%
144
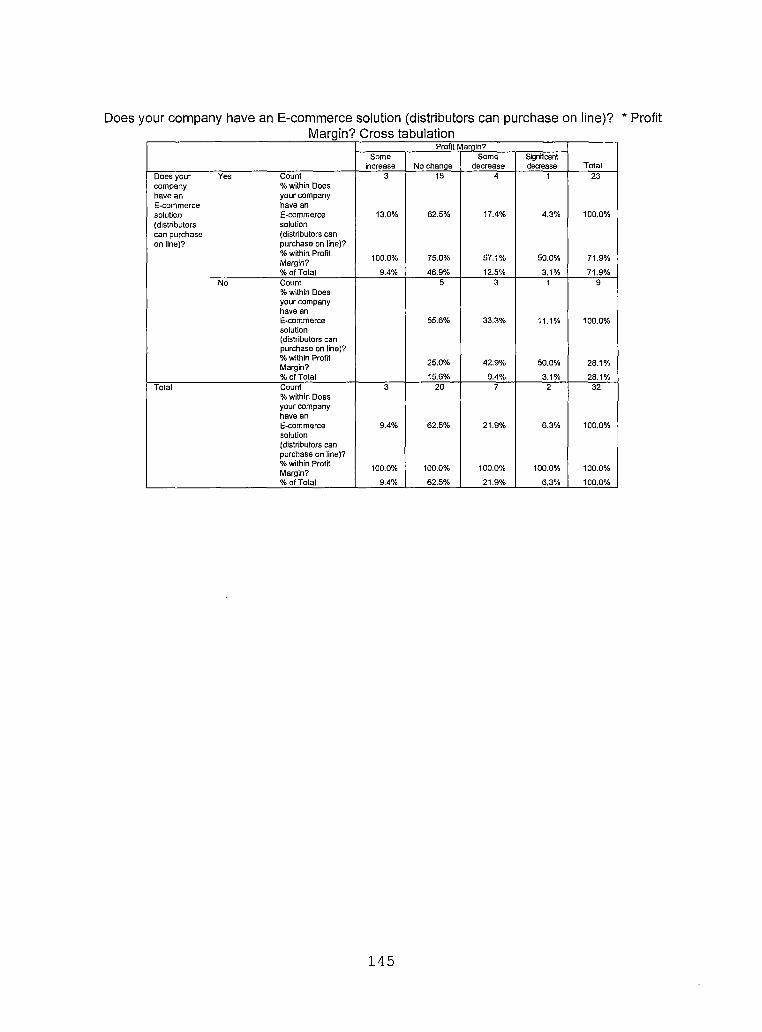
Does your company have an E-commerce solution (distributors can purchase on line)? * ProfitMargin? Cross tabulation
Profit Margin?
TotalSome
increase No changeSome
decreaseSignificantdecrease
Does your Yes Count 3 15 4 1 23company % within Doeshave an your companyE-commerce have ansolution E-commerce 13.0% 62.5% 17.4% 4.3% 100.0%(distributors solutioncan purchase (distributors canon line)? purchase on line)?
% within Profit Margin? 100.0% 75.0% 57.1% 50.0% 71.9%
% of Total 9.4% 46.9% 12.5% 3.1% 71.9%No Count
% within Does5 3 1 9
your company have anE-commercesolution
55.6% 33.3% 11.1% 100.0%
(distributors can purchase on line)?% within Profit Margin? 25.0% 42.9% 50.0% 28.1%
% of Total 15.6% 9.4% 3.1% 28.1%Total Count
% within Does3 20 7 2 32
your company have anE-commercesolution
9.4% 62.5% 21.9% 6.3% 100.0%
(distributors can purchase on line)?% within Profit Margin? 100.0% 100.0% 100.0% 100.0% 100.0%
% of Total 9.4% 62.5% 21.9% 6.3% 100.0%
145
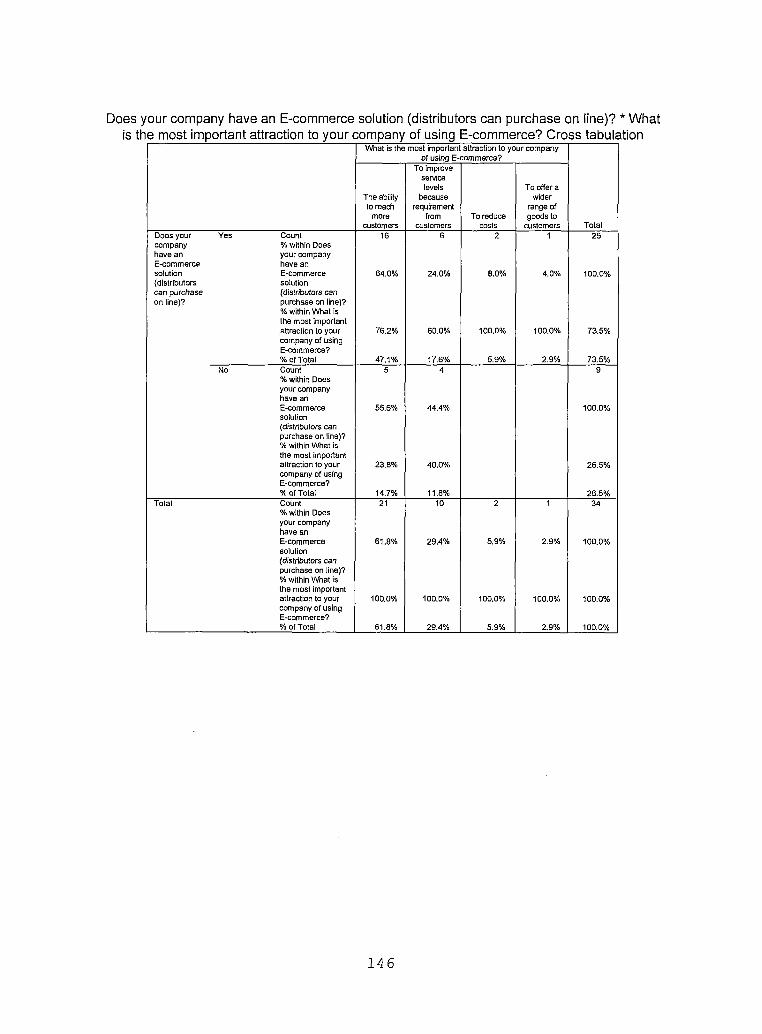
Does your company have an E-commerce solution (distributors can purchase on line)? * Whatis the most important attraction to your company of using E-commerce? Cross tabulation
What is the most important attraction to your company of using E-commerce?
Total
The ability to reach
morecustomers
To improve service levels
becauserequirement
fromcustomers
To reduce costs
To offer a wider
range ofgoods to
customersDoes your Yes Count 16 6 2 1 25company % within Doeshave an your companyE-commerce have ansolution E-commerce 64.0% 24.0% 8.0% 4.0% 100.0%(distributors solutioncart purchase (distributors canon line)? purchase on line)?
% within What isthe most important attraction to your company of using
76.2% 60.0% 100.0% 100.0% 73.5%
E-commerce?% of Total 47.1% 17.6% 5.9% 2.9% 73.5%
No Count% within Does
5 4 9
your company have anE-commercesolution
55.6% 44.4% 100.0%
(distributors can purchase on line)?% within What is the most important attraction to your company of using E-commerce?
23.8% 40.0% 26.5%
% of Total 14.7% 11.8% 26.5%Total Count
% within Does21 10 2 1 34
your company have anE-commercesolution
61.8% 29.4% 5.9% 2.9% 100.0%
(distributors can purchase on line)?% within What is the most important attraction to your company of using
100.0% 100.0% 100.0% 100.0% 100.0%
E-commerce?% of Total 61.8% 29.4% 5.9% 2.9% 100.0%
146
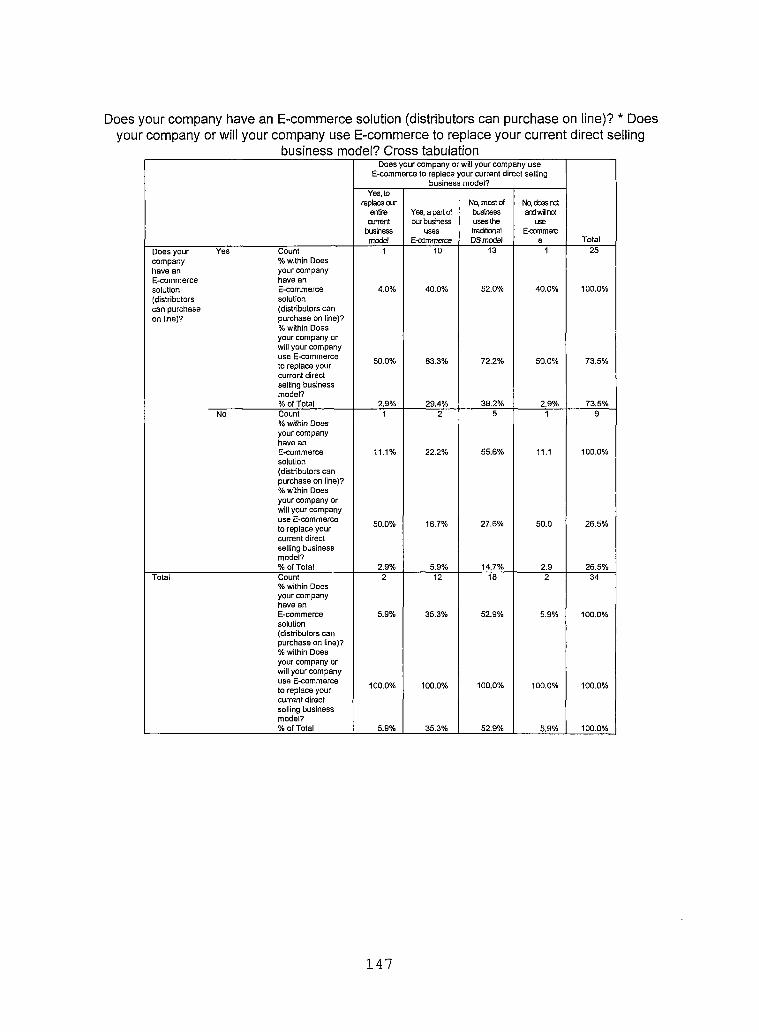
Does your company have an E-commerce solution (distributors can purchase on line)? * Does your company or will your company use E-commerce to replace your current direct selling
business model? Cross tabulationDoes your company or will your company use
E-commerce to replace your current direct selling business model?
Total
Yes, to replace our
entire current
business model
Yes, a part of our business
usesE-commerce
No, most of business uses the traditionalDS model
No, does not and wi not
useE-ccmmerc
eDoes your Yes Countcompany % within Doeshave an your companyE-commerce have ansolution E-commerce(distributors solutioncan purchase (distributors canon line)? purchase on line)?
% within Does your company or will your company use E-commerce to replace your current direct selling business model?%of Total
1
4.0%
50.0%
2.9%
10
40.0%
83.3%
29.4%
13
52.0%
72.2%
38.2%
1
40.0%
50.0%
2.9%
25
100.0%
73.5%
73.5%No Count
% within Does your company have anE-commercesolution(distributors can purchase on line)?% within Does your company or will your company use E-commerce to replace your current direct selling business model?% of Total
1
11.1%
50.0%
2.9%
2
22.2%
16.7%
5.9%
5
55.6%
27.6%
14.7%
1
11.1
50.0
2.9
9
100.0%
26.5%
26.5%Total Count
% within Does your company have anE-commercesolution(distributors can purchase on line)?% within Does your company or will your company use E-commerce to replace your current direct selling business model?% ofTotal
2
5.9%
100.0%
5.9%
12
35.3%
100.0%
35.3%
18
52.9%
100.0%
52.9%
2
5.9%
100.0%
5.9%
34
100.0%
100.0%
100.0%
147
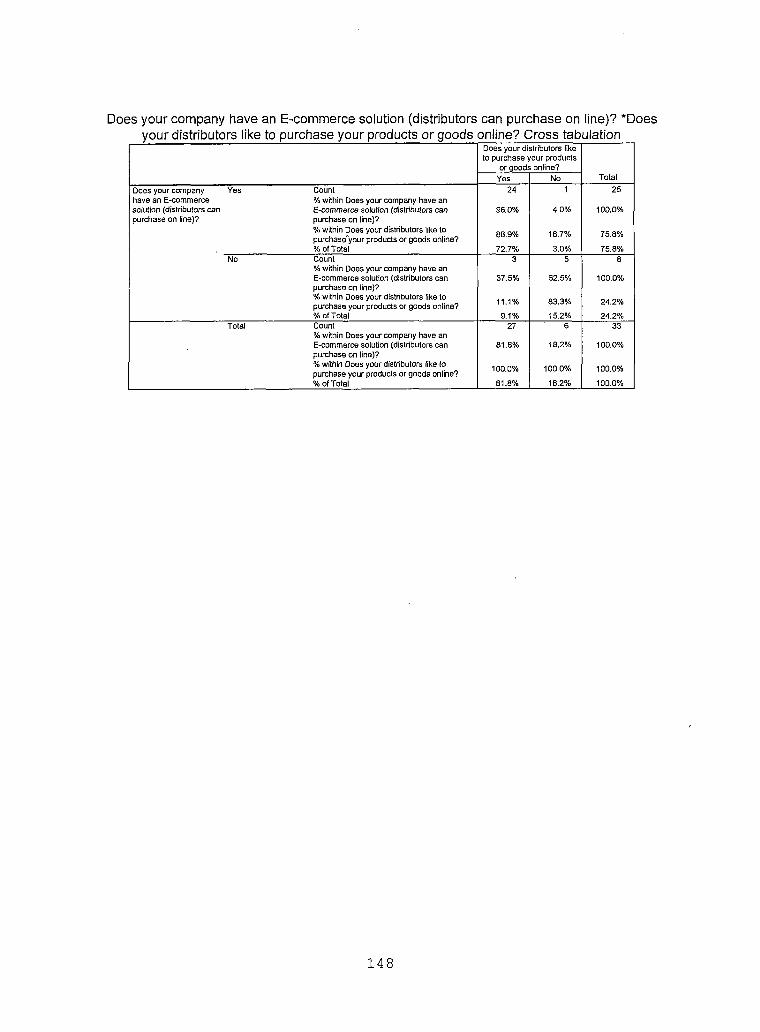
Does your company have an E-commerce solution (distributors can purchase on line)? *Doesyour distributors like to purchase your products or goods online? Cross tabulation
Does your distributors like to purchase your products
or goods online?TotalYes No
Does your company Yes Count 24 1 25have an E-commerce % within Does your company have ansolution (distributors can E-commerce solution (distributors can 95.0% 4.0% 100.0%purchase on line)? purchase on line)?
% within Does your distributors like to purchase 'your products or goods online? 88.9% 16.7% 75.8%
% of Total 72.7% 3.0% 75.8%No Count 3 5 8
% within Does your company have an E-commerce solution (distributors can 37.5% 62.5% 100.0%purchase on line)?% within Does your distributors like to purchase your products or goods online? 11.1% 83.3% 24.2%
% of Total 9.1% 15.2% 24.2%Total Count
% within Does your company have an E-commerce solution (distributors can purchase on line)?% within Does your distributors like to purchase your products or goods online?
27
81.8%
100.0%
6
18.2%
100.0%
33
100.0%
100.0%
% of Total 81.8% 18.2% 100.0%
148

Does your company have an E-commerce solution (distributors can purchase on line)? *Cananyone apply to become a new distributors via the Internet? Cross tabulation
Can anyone apply to become a new distributors
via the Internet?TotalYes No
Does your company Yes Count 16 8 24have an E-commerce % within Does your company have ansolution (distributors can E-commerce solution (distributors can 66.7% 33.3% 100.0%purchase on line)? purchase on line)?
% within Can anyone apply to become a new distributors via the Internet? 80.0% 72.7% 77.4%
% of Total 51.6% 25.8% 77.4%No Count
% within Does your company have an4 3 7
E-commerce solution (distributors can 57.1% 42.9% 100.0%purchase on line)?% within Can anyone apply to become a new distributors via the Internet? 20.0% 27.3% 22.6%
% of Total 12.9% 9.7% 22.6%Total Count 20 11 31
% within Does your company have an E-commerce solution (distributors can purchase on line)?
64.5% 35.5% 100.0%
% within Can anyone apply to become a new distributors via the Internet? 100.0% 100.0% 100.0%
% of Total 64.5% 35.5% 100.0%
149
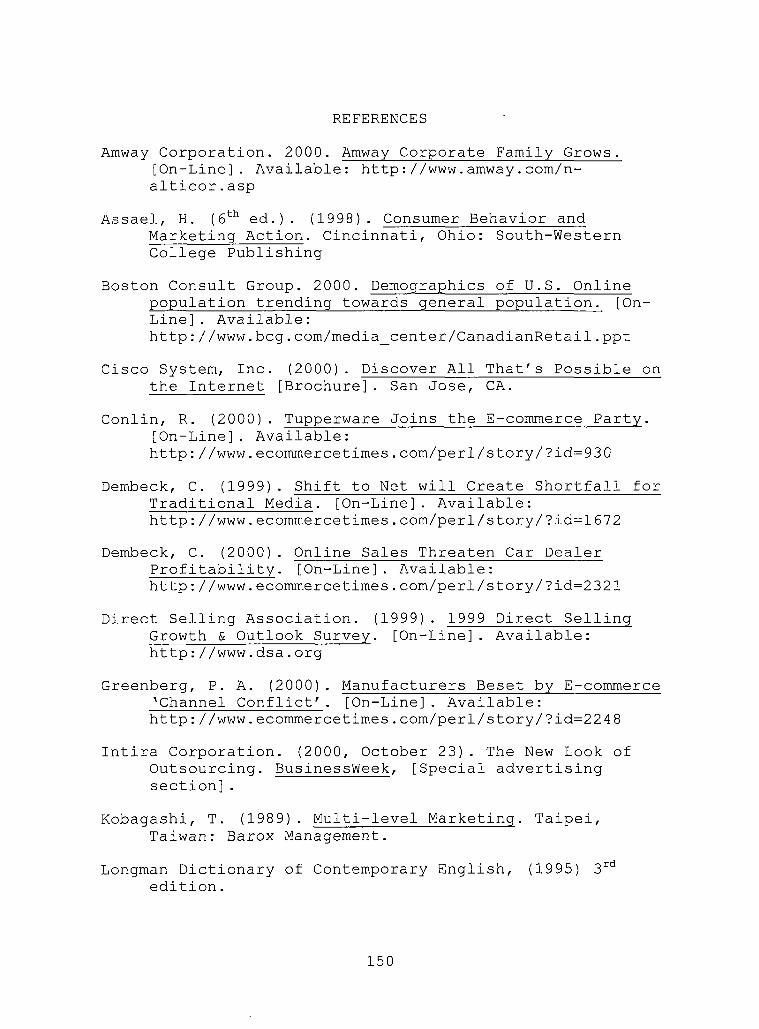
REFERENCES
Amway Corporation. 2000. Amway Corporate Family Grows. [On-Line]. Available: http://www.amway.com/n- alticor.asp
Assael, H. (6th ed.) . (1998) . Consumer Behavior andMarketing Action. Cincinnati, Ohio: South-Western College Publishing
Boston Consult Group. 2000. Demographics of U.S. Onlinepopulation trending towards general population. [On-Line] . Available:http://www.beg.com/media_center/CanadianRetail.ppt
Cisco System, Inc the Internet
(2000). Discover All That's Possible on [Brochure]. San Jose, CA.
Conlin, R. (2000) . Tupperware Joins the E-commerce Party. [On-Line]. Available:http://www.ecommercetimes.com/perl/story/?id=930
Dembeck, C. (1999). Shift to Net will Create Shortfall for Traditional Media. [On-Line]. Available: http://www.ecommercetimes.com/perl/story/?id=1672
Dembeck, C. (2000). Online Sales Threaten Car Dealer Profitability. [On-Line]. Available: http://www.ecommercetimes.com/perl/story/?id=2321
Direct Selling Association. (1999). 1999 Direct Selling Growth & Outlook Survey. [On-Line]. Available: http://www.dsa.org
Greenberg, P. A. (2000). Manufacturers Beset by E-commerce 'Channel Conflict'. [On-Line]. Available: http://www.ecommercetimes.com/perl/story/?id=2248
Intira Corporation. (2000, October 23). The New Look of Outsourcing. BusinessWeek, [Special advertising section].
Kobagashi, T. (1989). Multi-level Marketing. Taipei, Taiwan: Barox Management.
Longman Dictionary of Contemporary English, (1995) 3rd edition.
150
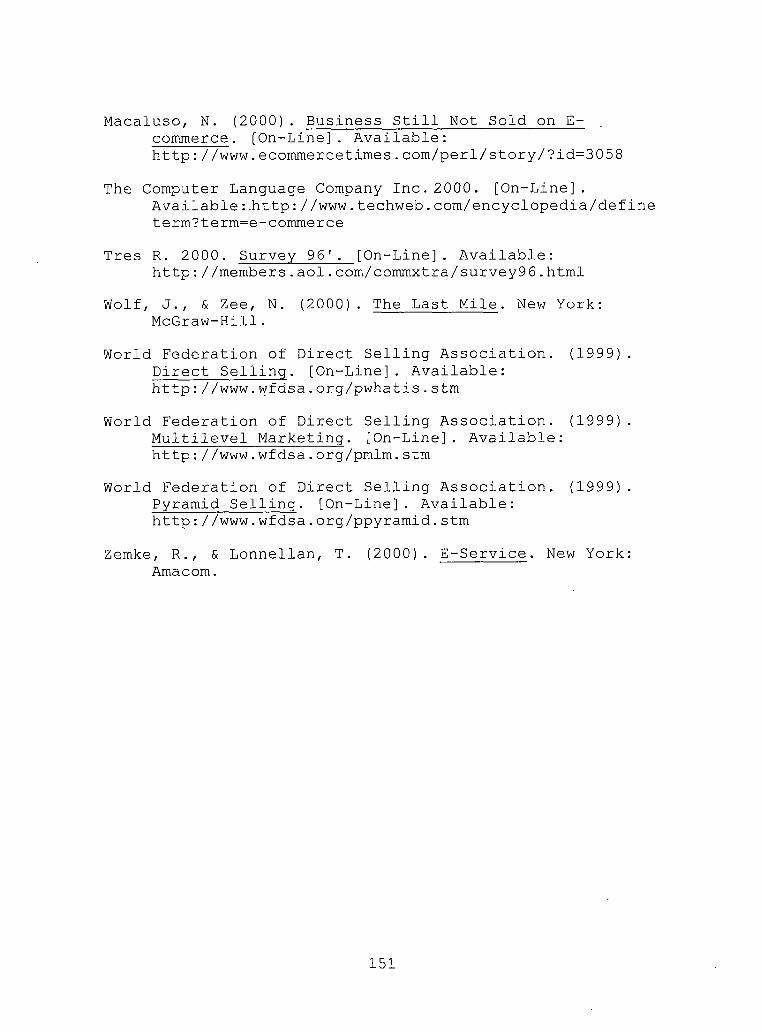
Macaluso, N. (2000). Business Still Not Sold on E- commerce. [On-Line]. Available:http://www.ecommercetimes.com/perl/story/?id=3058
The Computer Language Company Inc.2000. [On-Line].Available: .http://www.techweb.com/encyclopedia/define term?term=e-commerce
Tres R. 2000. Survey 96'. [On-Line]. Available:http://members.aol.com/commxtra/survey96.html
Wolf, J., & Zee, N. (2000). The Last Mile. New York: McGraw-Hill.
World Federation of Direct Selling Association. (1999). Direct Selling. [On-Line]. Available: http://www.wfdsa.org/pwhatis.stm
World Federation of Direct Selling Association. (1999) . Multilevel Marketing. [On-Line]. Available: http://www.wfdsa.org/pmlm.stm
World Federation of Direct Selling Association. (1999). Pyramid Selling. [On-Line]. Available: http://www.wfdsa.org/ppyramid.stm
Zemke, R., & Lonnellan, T. (2000). E-Service. New York: Amacom.
151