the impact of file sharing on movies · the wolverine case provides a unique opportunity for...
TRANSCRIPT

1
The Impact of File Sharing on Movies
Koleman Strumpf University of Kansas
Felix Oberholzer‐Gee Harvard University
December 31, 2010
1. Introduction
The advent of file‐sharing technology makes it possible for consumers to copy music, books, video games and other protected works on an unprecedented scale at minimal cost. By some estimates, file sharing now accounts for up to sixty percent of all bandwidth usage (Sandvine, 2002‐2007 and 2008ab). Music consumption was first affected by the new technology, mostly because the small size of music files allowed for fairly rapid transfers even in the early days of file‐sharing when the technology was often slow and unreliable. By contrast, consumers gained the ability to share the much larger files associated with movies only with the emergence of BitTorrent‐based file‐sharing services. With the help of the BitTorrent technology, consumers can now download a feature film in less than two hours. BitTorrent is also significant because the technology forces users to share the parts of files that they already own while they download the remaining bits. This procedure limits the opportunity to free‐ride that plagued older file‐sharing systems. In view of these advances, it is no surprise that movies are now among the most heavily traded works on file‐sharing sites.
Academic research on the impact of file sharing on commerce and consumption mirrors the overall technological development. We know most about the effect of file sharing on music – while estimates vary, a good number of studies seem to indicate that file sharing is perhaps responsible for no more than a fifth of the decline in music sales in recent years (Oberholzer‐Gee and Strumpf 2009) – but we have comparatively little knowledge about the influence of file sharing on movie consumption. In this paper, we take a first look at the influence of file sharing

2
on the attendance and revenue of movie theatres. The idea is to see whether the extent of file sharing prior to a theatrical release is systematically related to the demand for theater tickets.
Our case study is the movie “X‐Men Origins: Wolverine,” which was available on file‐sharing services more than four weeks prior to its theatrical release. We exploit this unusual leak – unusual both because the film was available far earlier than is typical and in a quality that closely resembled the eventually released legitimate copy – to determine the influence of file sharing on the demand for theater tickets under these adverse circumstances.
2. Background – File Sharing
File sharing refers to the computer protocols which facilitate the free transfer of digital files between users. On such networks copyrighted material is often transferred without the consent of or compensation paid to its owner. The first such file sharing networks, such as Napster and KaZaA, specialized in transfers of music files. Starting around 2004, BitTorrent became the dominant file sharing network in the US. BitTorrent facilitates the transfer of large files, which are broken into smaller chunks that are swapped using an efficient tit‐for‐tat rule. This new technology led file sharing users to focus on movies: a recent estimate is that between half and three‐fourths of BitTorrent transfers involve video (Torrentfreak, 2010). File sharing has also become relatively mainstream, with an estimated 60m users in the US (BigChampagne. 2010).1
Downloading a file on the BitTorrent network requires two steps. First a user visits an index site which provides links to the files which are available for downloading. Index sites can be searched and accessed using a typical web browser. Some of the more well known indexers include The Pirate Bay, Isohunt, Mininova, Demonoid, and KickAssTorrents, and the links on these sites often overlap. In the second step, the index links point to a cloud of users who are currently uploading and downloading the particular file. A computer called a tracker manages each cloud (a single tracker typically manages many such clouds, and many clouds have multiple trackers).
A user’s experience on BitTorrent varies based on some technological features. Upload or download speeds can vary based on local internet congestion, which changes over time based on technical issues (severed fiber lines or ISPs adding additional capacity) as well as demand (local internet activity, including those unrelated to file sharing). The BitTorrent infrastructure also plays a role. Index sites and trackers can crash or become faster, often times for reasons
1For a more detailed timeline of file sharing, see Oberholzer‐Gee and Strumpf (2009).

3
unrelated to demand (for example, index sites may remove all unauthorized content or suddenly open following an extended dormancy). Legal actions also matter, as both index sites and trackers can disappear due police raids or court orders (the latter can go into effect long after an initial verdict or when site owners decide to stop making appeals).
3. The Movie Industry
The US movie industry derives revenues from a wide range of sources. While there is readily available data for theatrical exhibition and home video (which includes sale and rental of DVDs, BluRay Discs, video on demand and electronic sell‐through), there is little information for ancillary streams such as television licenses.2 Figure 1 presents aggregate real revenues for the US market over the last decade. While theatrical revenues are steady, home video revenues rose in the beginning of the decade and declined in the second half. The latter is important since home video revenues are roughly twice as large as theatrical revenues. Figure 2 shows theatrical revenues for foreign markets.3 Non‐US revenues have doubled in the last decade and now rival the US home video market in size.4
A couple of general points emerge from these data. The movie industry enjoyed strong growth in the early part of this decade, but revenues have been flat (theatrical) or even declining (home video) over the past few years. Since this coincides with the growth of video file sharing, some have argued this is evidence of a crowd‐out effect. While a possibility, there are reasons to be skeptical these time series patterns are due to a causal relationship. First there are several alternative factors which could explain the recent revenue declines. For example part of the previous growth was fueled by home consumers starting up a library of the new format (DVD), and as the format matured this effect dissipated (real DVD revenues increased steadily through the early part of the last decade, peaked in 2006 and then fell 14% over the next three years).5 Also during this period there large changes in the rental market 2Based on confidential MPAA documents, Epstein (2005, 2006) states that television licensing revenues from cable, traditional networks, syndication and foreign broadcasts nearly match those from home video in 2004, and are far more profitable due to lower costs. Vogel (2007) presents comparable numbers for 2005 and of specific movies.
3There are no public data for home video revenues in foreign markets, but Epstein (2005, 2006) reports they were about two‐thirds the size of the US home videos.
4Vogel (2007) has historical time series of revenue and costs within the industry.
5While home video sales exceed theatrical revenues, the most popular titles make more money from ticket sales than from DVD sales. For example, in 2009 the top 100 theater titles sold $9.4b in tickets while the top 100 selling DVD titles had revenues of $4.0b (there is a high degree of overlap in the titles on these two charts). It is the catalog titles, which have little or no theatrical sales, which explain why the home market is larger.

4
with the rise of Netflix and Redbox. At the same time, no new format has caught on in a significant way to replace the decline of the DVD. Second, while the domestic movie industry has struggled, the experience of the international market is more mixed or even positive. Since file sharing is a global phenomenon, if it crowds out sales in the US it should also be doing so in other countries. All this suggests that a more detailed analysis is needed to quantify the displacement of file sharing on video markets.
4. The Wolverine Experiment
Movies typically become available on file sharing networks within a week or so following their release in theaters (Figure 3 shows the typical release pattern for the top 150 grossing movies each year between 2005 and 2009). These initial copies are typically low quality and come from video cams made in the theater. A rare exception to this case occurred in April 2009 when a copy of the movie “X‐Men Origins: Wolverine” was made available a full month before its release in theaters.6 In addition to being available so early, the copy was a workprint which is virtually identical to the copy shown in theaters (minus some final special effects). The movie was downloaded about 1m times on BitTorrent in its first week of availability, 4.5m times by the time it was released in theaters, and 7.2m times over all 2009. A majority of these downloads were made outside the US.
The Wolverine case provides a unique opportunity for studying the impact of file sharing on movies. First, it provides a worst‐case scenario in which a high quality copy of the movie was readily available prior to its theatrical showing. The extensive media coverage of the movie’s leak probably meant virtually of the potential theatergoers were aware they could download it in advance. If individuals use file sharing to substitute for paying to see a film, it should be apparent in this case. Second, we can see how the promotion associated with the theatrical release influences the number of downloads on the file sharing network. Finally, the case sheds light on the impact of file sharing outside the US. Movies are often released later outside the US, and during this period movies are often made available on file sharing sites from those in early release countries (in contrast Wolverine was released at basically the same time in all countries). This is comparable to the Wolverine case in that the file sharing release pre‐dates the theatrical release.
6The exact source of the movie is still unknown, but it is rumored to have been leaked by an employee at an Australian company which was finalizing the movie’s special effects.

5
5. Empirical Strategy
We are interested in the influence of file sharing on the demand for movie tickets. We estimate models of the following general form:
(1)
Salesi is a measure of demand (revenue or attendance) at theatre i over the course of the exhibition of the movie. Peersi denotes the file‐sharing activity at that location prior to the release of the film. The obvious difficulty with this approach is that unobserved determinants of the demand for a film are likely to drive file‐sharing activity and sales, leading us to estimate
β with a positive bias. We begin to address this concern by including state fixed effects, , in our regressions and by instrumenting for Peers. Our instruments are measures of Internet performance. We cannot use the type of Internet service that a household orders as an instrument (e.g., broadband service) because it is likely to be correlated with unobserved preferences for entertainment. Rather, we rely on the average actual performance of the Internet in a particular location as a proxy for the cost of downloading movies. Specifically, our measures are latency (the time it takes for a small piece of data to be sent from a computer in a specific location to the Internet and back, measured in milliseconds), and the standard deviation of download speed in a specific locale (measured in kilobytes per second). Both measures exhibit significant variation across locations and within location over time (see summary statistics). We expect increases in latency and in the standard deviation of download speed to discourage file sharing. Our identifying assumption is that Internet performance is not directly related to the demand for movies.
6. Data
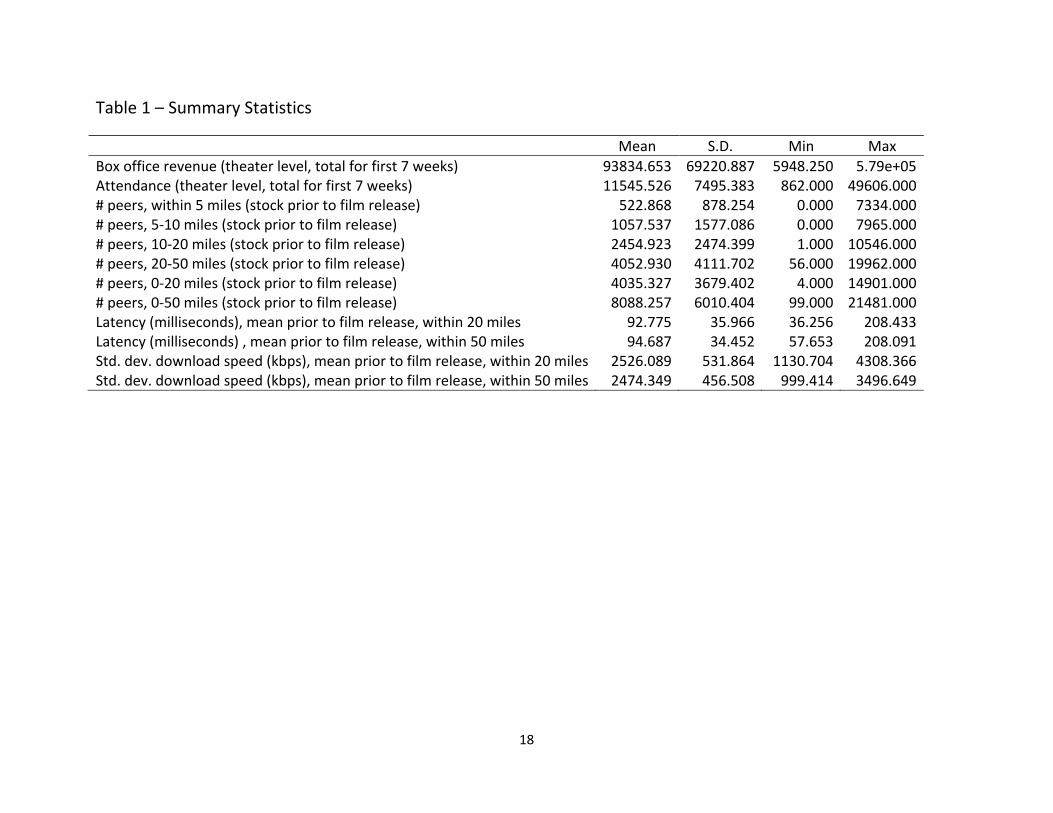
We use three sources of data. Information on theatre revenue and attendance comes from a large national chain of movie theatres. We observe data for 272 theatres located in 206 cities in the continental United States (see figure 4 for the geographic distribution of the theatres). For each location, we aggregate revenue and attendance data over the first seven weeks of the release of Wolverine (98% of the movie’s eventual domestic box office occurred during this period). Table 1 provides summary statistics.
Starting the day after the initial leak of the movie, we ran a modified file‐sharing software to collect the IP addresses of Internet users who downloaded one of the available versions of Wolverine. We collected each of the popular links to the movie posted on the index site The Pirate Bay. Each of these links represented a slightly different edit of the original release. We also added links to a final DVD quality copy, which included all special effects, which became

6
available a few weeks after the theatrical release. Typical BitTorrent client software will connect a user with a few peers who share a movie of interest. Our application collects all IP addresses in a cloud without ever downloading the movie. We ran this application about every five minutes during the four weeks prior to the release of Wolverine. We geocode and aggregate the number of IP addresses over this pre‐release window of time. Thus, our measures are proxies for the sum of downloading activity in a particular location. For example, we observe 523 IP addresses within 5 miles of the average theatre over the course of the four weeks prior to the exhibition of Wolverine. Within 50 miles of the average theatre, we observe 8,088 IP addresses (see table 1).
Finally, our Internet performance data come from Ookla, a company specialized in measuring Internet performance. We aggregate the firm’s location‐specific measures over the pre‐release period, relating them to the location of the theatres in our data. For example, for IP addresses within 20 miles of our average theatre, mean latency was 92.8 milliseconds with a standard deviation of 36 milliseconds.
7. Results
A. Benchmarks
Before turning to the formal estimates, some simple approaches provide some context. First what would happen if every download results in a foregone ticket purchase? There were 4.5m downloads prior to Wolverine’s theatrical release (and roughly 6m downloads during its theatrical run). In contrast, about 40‐50m tickets were sold worldwide. So even with the very pessimistic assumption of one‐for‐one substitution, there is only a 10% reduction in ticket sales. Given how early the leaked workprint was available, this is an extremely modest effect.7
An alternative to estimating the substitution effect is to look at box office futures markets. The Hollywood Stock Exchange (HSX) runs markets in which traders are rewarded for the accuracy of their forecast of a movie’s first month box office. The HSX has an admirable track record in forecasting and has been shown to quickly respond to news such as casting changes (Elberse, 2007). The markets meet standard tests of market efficiency (Pennock et al, 2001), and so prices at any time should be the best estimate of the eventual box office returns given the available information at that time. Under the plausible assumption that the leak was unanticipated, the change in market price around the leak date gives an estimate of what forward‐looking traders believe the impact on ticket sales will be. Figure 5 shows the time
7 The magnitudes in this paragraph are comparable for other tent pole movies released over the period 2007‐2010.

7
series of HSX prices. There was a very modest change in price on the day the movie became available on BitTorrent, and starting a week later prices rose by a fifth up until the theatrical release. There is little evidence in these numbers that traders thought the leak would have a negative impact on ticket sales.
B. Estimates
Summary statistics for the variables employed in our analysis are provided in table 1. Mean theatre attendance in our data is 11,545, yielding gross revenues of $93,834 per theatre. As one might expect, file sharing activity peaks right when the first copies become available (see figure 6.) In our data, there is substantial variation in file sharing over time and across cities (see figure 7).
We begin our more formal analysis by relating the number of peers who downloaded the movie to theatrical demand. A priori, it is not obvious how close to a theater peers have to be in order to influence demand. In table 2, we run exploratory regressions aggregating the number of peers in distance rings around theatre locations. In the revenue regressions, the influence of peers monotonically declines in distance to a theatre. This holds in the regression with and without state fixed effects. Recall from the discussion above that we are likely to estimate the effect of file sharing with a positive bias in models of this type. As a result, it seems appropriate to exclude peers from the analysis if they are located at a distance greater than 50 miles, perhaps even at a distance greater than 20 miles. The attendance regressions show a similar drop‐off in the importance of more distant peers although the decline is less gradual.
Tables 3 and 4 report our analysis of box office revenues for peers located within 20 and 50 miles of our theatres, respectively. As expected, the uninstrumented regressions show a positive correlation between the number of peers and box office revenue. The correlation is likely to be driven by unobserved differences across locations within a state. Turning to our instruments to address this issue, we find that both latency and the standard deviation of download speed discourage file sharing (models (2) and (4)), although the latter turns out to be the weaker instrument. The effect of Internet latency is both economically and statistically significant. A one‐standard‐deviation increase in latency reduces the number of peers by about 25% of its mean (table 3, model 2). In the corresponding model in table 4 (peers up to 50 miles), the effect is almost twice as large. A surprising difference between the second‐stage estimates in tables 3 and 4 is that they decrease in the 50‐mile analysis but, strangely, increase in the 20‐mile analysis. In equations (4) and (5) of tables 3 and 4 we add our second instrument to the first stage and find an insignificant positive effect of the number of peers on box office revenue. Although the effect of file sharing on revenue is imprecisely estimated, its economic significance is not small. The size of the coefficient on peers in regression (5) of table 3 implies

8
that a one‐standard‐deviation increase in the number of peers elevates box office revenue by a good 10% of its mean.
We report the results for our analysis of attendance effects in tables 5 and 6. The results closely mirror our findings for the box office. In specification (5) that relies on both instruments, we again find a statistically insignificant relation between file sharing and theatre attendance. As before, the size of the estimated coefficients is quite substantial. In the 20‐mile analysis, a one‐standard‐deviation increase in file sharing lifts attendance by 7.7% of its mean. The corresponding figure is 2.5% in the 50‐mile analysis.
8. Conclusion: The Bigger Project
Our results indicate that downloads of the movie Wolverine prior to its release in theaters has positive impact on the box office. While this is an intriguing and perhaps counter intuitive result, it is important to remember that the parameters are imprecisely estimated. This is not surprising since we are essentially looking at a case study of a single movie. It is also unclear to what extent we can extrapolate from this one title to consider the impact on the industry as a whole.
This serves as motivation for a broader project in which we look at a large sample of movies. Over the period September 2009 to January 2010, we tracked all movies which were currently or recently in theaters or were going to be released in theaters in the next month, a sample of movies which were currently or recently released on DVD or were going to be released in the next month, as well as a sample of older catalog titles. Our database includes over 1500 movies, which by design include all commercially relevant ones and a sample of less popular ones (titles we obtained from sampling Amazon’s DVD listings would often sell only a few copies a week). We had a scraper access five index sites and download all links for the set of currently active movies. Over 40,000 such links are included in the database (recall that a given movie will often have multiple links, with each typically reflecting a movie copy of a particular quality). Four computers continuously monitored the associated clouds and kept records of all IP’s as information about the health of the associated trackers. Over 600,000 cloud scrapes were made.
Having multiple movies provides several alternative sources of identification beyond the local internet speeds used in this paper. We will be able to more fully exploit the panel feature of the data, considering the impact on weekly revenues of both current and lagged downloads. There will continue to be variation within a given movie, because we can compare differences between cities. The additional instruments we will consider should influence downloads but be unrelated to the popularity of a given title:

9
• time series events in the BitTorrent infrastructure (events which make it easier or harder to download): these events will be important for titles near their peak demand (when they are first released) and have little effect on other titles
‐ indexers: new sites come on while others are removed for reasons unrelated to demand. During our study period, one major index site (Mininova) simultaneously removed all unauthorized links while another (Demonoid) which had been dormant was re‐opened. These were driven by legal and technical features, and their exact timing was largely unanticipated.
‐ trackers: trackers are often added or removed as volunteers decide to add or remove their resources. In each of our cloud scrape, we contact the associated tracker(s) and collect responsiveness measures (such as throughput speed) measuring its health.
• variation in availability of titles: these are largely due to differences across studios, and each studio has a range of releases including both very popular and more niche titles.
‐ release date on file sharing networks: while this is partly driven by popularity, there are also random elements or factors unrelated to demand (for example there are differences across studios in how much effort they exert to prevent movies from reaching file sharing networks; another factor is variation in international release dates, which are often still staggered even for popular movies). We might add an additional indicator for the date at which the first high quality copy is available.
‐ interdiction: once a movie is available on BitTorrent, studios can hire companies to pollute clouds with bad IPs. We have lists of these bad IPs which we can then match to our data
• weather forecast errors: while expected weather events will impact both sales and downloads, a mistake in the forecast might impact only downloads
‐ suppose individuals plan in advance to go to movie. If there is a forecast for bad weather for the date when the movie reaches theaters, individuals may choose to download instead. Suppose the forecast turns out to be incorrect: then the individual has downloaded the movie and still has the option to go to the movie
‐ this would be implementing by including the weather forecast and actual weather in the first stage (explaining downloads)
‐ this will vary across time and across cities
Our hope is that these additional instruments, in conjunction with a much larger sample size, will provide more precise estimates of the impact of file sharing on movie sales and will allow us to calculate the impact on the industry as a whole.

10
References
BigChampagne (2010). “From Napster to Now: File Sharing Trends.” http://musikwirtschaftsforschung.files.wordpress.com/2010/06/eric_garland_vienna_music_business_research_end‐revised.pdf.
Boxofficemojo (2010). “Yearly Box Office.” http://boxofficemojo.com/yearly/.
DEG (2010). “U.S. Consumer Home Entertainment Rental & Sell‐Through Spending.” http://www.dvdinformation.com/.
Elberse, Anita (2007). “The Power of Stars: Do Star Actors Drive the Success of Movies?” Journal of Marketing. 71, no. 4.
Epstein, Edward Jay (2005). “Hollywood's Profits, Demystified.” Slate. http://www.slate.com/id/2124078/.
Epstein, Edward Jay (2006). The Big Picture: Money and Power in Hollywood. Random House: New York.
MPAA (various years). Theatrical Market Statistics and International Theatrical Snapshot. http://mpaa.org/.
Oberholzer‐Gee, Felix and Koleman Strumpf (2009). “File‐Sharing and Copyright.” NBER's Innovation Policy and the Economy series, volume 10. ed. Joshua Lerner and Scott Stern. MIT Press.
Pennock, David, Steve Lawrence, C. Lee Giles, Finn Årup Nielsen (2001). “The Real Power of Artificial Markets.” Science. 291(5506): 987‐988.
Torrentfreak (2010). “A Snapshot of the Public BitTorrent Landscape.” Posted 14 December 2010. http://torrentfreak.com/a‐snapshot‐of‐the‐public‐bittorrent‐landscape‐101214/.
Vogel, Harold (2007). Entertainment Industry Economics. Cambridge University Press: New York.

11
Figure 1 – Domestic Revenues 1999‐2009
Sources: Boxofficemojo (2010), DEG (2010)
Note: other ancillary streams (such as TV licensing) are omitted
0
5
10
15
20
25
1999 2000 2001 2002 2003 2004 2005 2006 2007 2008 2009
Home Video Theatrical
US Theatrical + Home Video Real Revenue (billion 2009$)

12
Figure 2 – International Revenues 2000‐2009
Source: MPAA (various years)
10
15
20
25
30
2000 2001 2002 2003 2004 2005 2006 2007 2008 2009
Total Non‐US
International Box Office Real Revenue (billion 2009$)

13
Figure 3 – File Sharing Release Patterns of the Top 150 Grossing Releases Each Year
0.2
.4.6
.81
-90 -75 -60 -45 -30 -15 0 15 30 45 60 75 90
2005 Releases (mean=8.6)
2006 Releases (mean=2.9)
2007 Releases (mean=7.7)
2008 Releases (mean=14.2)
2009 Releases (mean=10.9)
Days Between P2P and Theater Release Date: CDF

14
Figure 4 – Geographic Distribution of Movie Theatres

15
Figure 5 – Impact of Leak on Box Office Futures Market
The movie became available on file sharing networks on 1 April 2009 (the movie was released in theaters on 1 May 2009)
180
200
220
240
pric
e
01jan2009 01feb2009 01mar2009 01apr2009 01may2009
Wolverine at HSX

16
Figure 6 – File Sharing Trend
020
0000
4000
0060
0000
wee
kly
dow
nloa
ds (u
niqu
e IP
mea
sure
)
1 2 3 4 5 6 7 8 9 10 11week
Within 5 Miles Within 5-10 MilesWithin 10-20 Miles Within 20-50 Miles
within given distance to theatresWeekly Downloads - United States

17
Figure 7 – Variation in File Sharing Across Locations
050
010
0015
000
500
1000
1500
1 2 3 4 5 6 7 8 9 10 11 1 2 3 4 5 6 7 8 9 10 11
AUSTIN BOSTON
KANSAS CITY TUCSON
Within 5 Miles Within 5-10 MilesWithin 10-20 Miles Within 20-50 Miles
wee
kly
dow
nloa
ds (u
niqu
e IP
)
week
Graphs by UNIT_CITY
18
Table 1 – Summary Statistics
Mean S.D. Min Max Box office revenue (theater level, total for first 7 weeks) 93834.653 69220.887 5948.250 5.79e+05Attendance (theater level, total for first 7 weeks) 11545.526 7495.383 862.000 49606.000# peers, within 5 miles (stock prior to film release) 522.868 878.254 0.000 7334.000# peers, 5‐10 miles (stock prior to film release) 1057.537 1577.086 0.000 7965.000# peers, 10‐20 miles (stock prior to film release) 2454.923 2474.399 1.000 10546.000# peers, 20‐50 miles (stock prior to film release) 4052.930 4111.702 56.000 19962.000# peers, 0‐20 miles (stock prior to film release) 4035.327 3679.402 4.000 14901.000# peers, 0‐50 miles (stock prior to film release) 8088.257 6010.404 99.000 21481.000Latency (milliseconds), mean prior to film release, within 20 miles 92.775 35.966 36.256 208.433Latency (milliseconds) , mean prior to film release, within 50 miles 94.687 34.452 57.653 208.091Std. dev. download speed (kbps), mean prior to film release, within 20 miles 2526.089 531.864 1130.704 4308.366Std. dev. download speed (kbps), mean prior to film release, within 50 miles 2474.349 456.508 999.414 3496.649

19
Table 2 – Geography of File Sharing – How much does distance matter?
(1) (2) (3) (4) box office revenue box office revenue attendance attendance # peers, within 5 miles 10.985 12.662 0.677 1.004 (2.19)* (2.44)* (1.21) (1.77)# peers, 5‐10 miles 4.728 4.831 0.137 0.252 (1.66) (1.63) (0.43) (0.78)# peers, 10‐20 miles 2.099 3.089 0.159 0.326 (1.17) (1.54) (0.80) (1.49)# peers, 20‐50 miles 1.243 2.054 ‐0.012 0.155 (1.21) (1.41) (0.11) (0.97)Constant 72,902.293 66,197.215 10,705.995 9,324.095 (10.56)** (6.32)** (13.94)** (8.16)**Observations 272 272 272 272R‐squared 0.07 0.05 0.01 0.03State Fixed Effects? No Yes No YesAbsolute value of t statistics in parentheses * significant at 5%; ** significant at 1%

20
Table 3 – Revenue Impact – Peers within 20 Miles
(1) (2) (3) (4) (5) box office
revenue # peers
1st stage
box office revenue 2nd stage
# peers
1st stage
box office revenue 2nd stage
# peers, 0‐20 miles 4.165 8.664 2.914 (2.99)** (1.13) (0.46)latency ‐29.432 ‐31.940 (milliseconds) (2.94)** (3.17)**
std. dev. download ‐0.850 speed (kbps) (1.83)
Constant 77,028.138 6,765.865 58,873.579 9,146.671 82,074.151 (11.15)** (7.14)** (1.89) (5.68)** (3.15)**Observations 272 272 272 272 272State fixed effects? Yes Yes Yes Yes YesR‐squared 0.04 0.03 0.05 Absolute value of t statistics in parentheses * significant at 5%; ** significant at 1%

21
Table 4 – Revenue Impact – Peers within 50 Miles
(1) (2) (3) (4) (5) box office
revenue # peers
1st stage
box office revenue 2nd stage
# peers
1st stage
box office revenue 2nd stage
# peers, 0‐50 miles 3.235 2.237 1.291 (2.70)** (0.93) (0.55)latency ‐112.567 ‐115.721 (milliseconds) (8.90)** (9.20)**
std. dev. download ‐1.757 speed (kbps) (2.43)*
Constant 67,668.124 18,746.946 75,739.533 23,393.817 83,394.637 (6.44)** (15.47)** (3.80)** (10.37)** (4.31)**Observations 272 272 272 272 272State fixed effects? Yes Yes Yes Yes YesR‐squared 0.03 0.25 0.27 Absolute value of t statistics in parentheses * significant at 5%; ** significant at 1%

22
Table 5 – Attendance Impact – Peers within 20 Miles
(1) (2) (3) (4) (5) attendance # peers
1st stage attendance2nd stage
# peers 1st stage
attendance2nd stage
# peers, 0‐20 miles 0.336 0.866 0.243 (2.22)* (1.04) (0.35)latency (milliseconds) ‐29.432 ‐31.940 (2.94)** (3.17)** std. dev. download speed (kbps) ‐0.850 (1.83) Constant 10,187.795 6,765.865 8,050.978 9,146.671 10,564.808 (13.59)** (7.14)** (2.38)* (5.68)** (3.74)**Observations 272 272 272 272 272State FE? Yes Yes Yes Yes YesR‐squared 0.02 0.03 0.05 Absolute value of t statistics in parentheses * significant at 5%; ** significant at 1%

23
Table 6 – Attendance Impact – Peers within 50 Miles
(1) (2) (3) (4) (5) attendance # peers
1st stage attendance2nd stage
# peers 1st stage
attendance2nd stage
# peers, 0‐50 miles 0.259 0.132 0.048 (1.99)* (0.50) (0.19)latency (milliseconds) ‐112.567 ‐115.721 (8.90)** (9.20)**std. dev. download speed (kbps) ‐1.757 (2.43)*Constant 9,450.227 18,746.946 10,480.413 23,393.817 11,155.200 (8.30)** (15.47)** (4.85)** (10.37)** (5.32)**Observations 272 272 272 272 272State FE? Yes Yes Yes Yes YesR‐squared 0.02 0.25 0.27Absolute value of t statistics in parentheses * significant at 5%; ** significant at 1%