the impact of health insurance education …. enrollment
TRANSCRIPT

1
THE IMPACT OF HEALTH INSURANCE EDUCATION
ON ENROLLMENT OF MICROFINANCE
INSTITUTION CLIENTS IN THE GHANA NATIONAL
HEALTH INSURANCE SCHEME, NORTHERN
REGION OF GHANA
Elizabeth Schultz Marcia Metcalfe Bobbi Gray With contributions from: Christopher Dunford Raymond Guiteras Harounan Kazianga Aaron Szott
R E S E A R C H
P A P E R N o . 3 3
M A Y 2 0 1 3

2
THE IMPACT OF HEALTH INSURANCE EDUCATION ON ENROLLMENT OF MICROFINANCE INSTITUTION CLIENTS IN THE GHANA NATIONAL HEALTH INSURANCE SCHEME, NORTHERN REGION OF GHANA1
ELIZABETH SCHULTZ2, MARCIA METCALFE3*, BOBBI GRAY³ WITH CONTRIBUTIONS FROM: CHRISTOPHER DUNFORD³, RAYMOND GUITERAS4, HAROUNAN KAZIANGA5, AARON SZOTT6 ABSTRACT
Despite the fact that national health insurance has been available in Ghana since 2003, the coverage is far from universal, especially in rural areas. This study evaluates a consumer education intervention for microfinance clients by Freedom from Hunger and Sinapi Aba Trust designed to increase awareness, knowledge and eventually take-up rates of the National Health Insurance Scheme (NHIS).
Designed as a randomized control trial, the study looked at two methods of providing health education to clients of microfinance institutions (MFIs) as well as a “reminder” session provided one year later. While health insurance education appeared to increase knowledge of health insurance among those who received it, the research indicated no significant differences in health insurance enrollment rates between the treatment groups and control group, by type of education or for those who got reminder sessions. The education may not have had a large impact because baseline enrollment and knowledge
1 This project was funded by the Microinsurance Innovation Facility,
ILO and an anonymous donor. The education intervention was
designed and developed by Freedom from Hunger, implemented by
SAT and the research and evaluation as well as field support was
provided by Innovations for Poverty Action–Ghana. 2 Innovations for Poverty Action-Ghana, Osu PMB 57, Accra,
Ghana 3 Freedom from Hunger, 1644 Da Vinci Court, Davis, CA, 95618,
USA. 4 Department of Economics, University of Maryland 5 Department of Economics, University of Oklahoma 6 Development Impact Evaluation Initiative, World Bank
* Corresponding author: Tel.: 001 530 758 6200; E-mail address:
of insurance was already high, suggesting that knowledge was not a barrier to enrollment. Rather, it appears that convenience of registration and clients following through on stated intent to enroll, and the timing of making the premium payments are more common challenges for enrollment. In environments where knowledge and enrollment are low, educational programs may have more impact.
Enrollment increased for the studied groups at a higher rate than the general population. It is possible that the repeated surveys, along with the treatment activities, might have served as “touch points” that prompted clients to take action to register or enroll in insurance.
There are several important opportunities for greater engagement of MFIs and similar organizations to increase uptake of health insurance enrollment among the poor that emerge from this study and its findings. Governments seek sustained methods to enroll and retain informal-sector families in health insurance schemes. MFIs that have field agents who meet regularly with clients are well positioned to partner with public schemes to promote insurance, deliver education about client-value and provide needed prompts and reminders regarding enrollment and re-enrollment. MFIs also have the capacity to provide financing products (small loans) to mitigate enrollment barriers related to having cash on hand at the time of enrollment.
1. BACKGROUND
Although Ghana introduced a national health insurance program in 2003, enrollment rates of families in the informal sector remain low, particularly in rural areas. In 2010, Freedom from Hunger entered into a partnership with Sinapi Aba Trust (SAT), a Ghanaian microfinance institution (MFI), and Innovations for Poverty Action (IPA), a non-governmental organization (NGO) specializing in impact evaluation, to design, implement and evaluate a program to teach microfinance clients about health insurance. The key questions of this evaluation are to determine whether the program increases up-take of insurance, and how insurance enrollment affects use of health services, health spending, and financial security indicators.
This report presents and analyzes final key indicators from the endline survey and qualitative studies and summarizes overall findings and conclusions from the project. We are grateful to the ILO’s Microinsurance Innovation Facility and to an anonymous donor who provided funding for the development of the education module and the test of the impact of the education in a randomized control trial in Ghana. We also are grateful to SAT and the suppor t of their
3
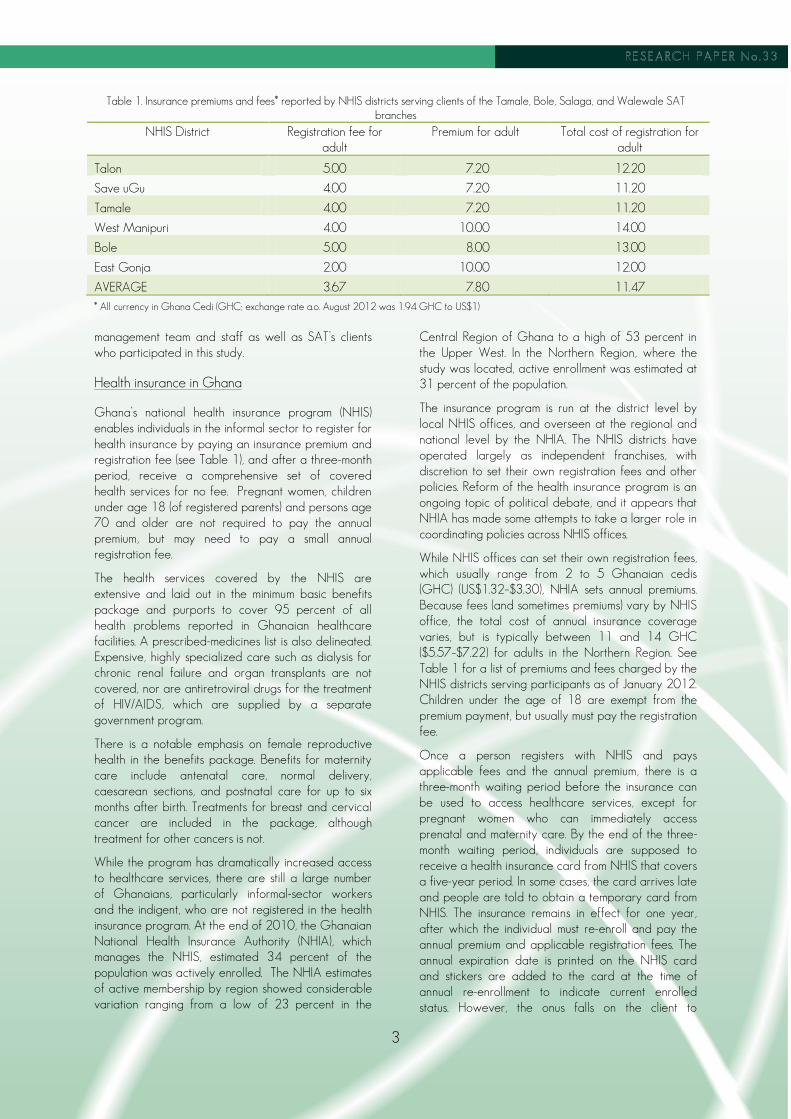
Table 1. Insurance premiums and fees* reported by NHIS districts serving clients of the Tamale, Bole, Salaga, and Walewale SAT
branches
NHIS District Registration fee for adult
Premium for adult Total cost of registration for adult
Talon 5.00 7.20 12.20
Save uGu 4.00 7.20 11.20
Tamale 4.00 7.20 11.20
West Manipuri 4.00 10.00 14.00
Bole 5.00 8.00 13.00
East Gonja 2.00 10.00 12.00
AVERAGE 3.67 7.80 11.47
* All currency in Ghana Cedi (GHC; exchange rate a.o. August 2012 was 1.94 GHC to US$1)
management team and staff as well as SAT’s clients who participated in this study.
Health insurance in Ghana
Ghana’s national health insurance program (NHIS) enables individuals in the informal sector to register for health insurance by paying an insurance premium and registration fee (see Table 1), and after a three-month period, receive a comprehensive set of covered health services for no fee. Pregnant women, children under age 18 (of registered parents) and persons age 70 and older are not required to pay the annual premium, but may need to pay a small annual registration fee.
The health services covered by the NHIS are extensive and laid out in the minimum basic benefits package and purports to cover 95 percent of all health problems reported in Ghanaian healthcare facilities. A prescribed-medicines list is also delineated. Expensive, highly specialized care such as dialysis for chronic renal failure and organ transplants are not covered, nor are antiretroviral drugs for the treatment of HIV/AIDS, which are supplied by a separate government program.
There is a notable emphasis on female reproductive health in the benefits package. Benefits for maternity care include antenatal care, normal delivery, caesarean sections, and postnatal care for up to six months after birth. Treatments for breast and cervical cancer are included in the package, although treatment for other cancers is not.
While the program has dramatically increased access to healthcare services, there are still a large number of Ghanaians, particularly informal-sector workers and the indigent, who are not registered in the health insurance program. At the end of 2010, the Ghanaian National Health Insurance Authority (NHIA), which manages the NHIS, estimated 34 percent of the population was actively enrolled. The NHIA estimates of active membership by region showed considerable variation ranging from a low of 23 percent in the
Central Region of Ghana to a high of 53 percent in the Upper West. In the Northern Region, where the study was located, active enrollment was estimated at 31 percent of the population.
The insurance program is run at the district level by local NHIS offices, and overseen at the regional and national level by the NHIA. The NHIS districts have operated largely as independent franchises, with discretion to set their own registration fees and other policies. Reform of the health insurance program is an ongoing topic of political debate, and it appears that NHIA has made some attempts to take a larger role in coordinating policies across NHIS offices.
While NHIS offices can set their own registration fees, which usually range from 2 to 5 Ghanaian cedis (GHC) (US$1.32–$3.30), NHIA sets annual premiums. Because fees (and sometimes premiums) vary by NHIS office, the total cost of annual insurance coverage varies, but is typically between 11 and 14 GHC ($5.57–$7.22) for adults in the Northern Region. See Table 1 for a list of premiums and fees charged by the NHIS districts serving participants as of January 2012. Children under the age of 18 are exempt from the premium payment, but usually must pay the registration fee.
Once a person registers with NHIS and pays applicable fees and the annual premium, there is a three-month waiting period before the insurance can be used to access healthcare services, except for pregnant women who can immediately access prenatal and maternity care. By the end of the three-month waiting period, individuals are supposed to receive a health insurance card from NHIS that covers a five-year period. In some cases, the card arrives late and people are told to obtain a temporary card from NHIS. The insurance remains in effect for one year, after which the individual must re-enroll and pay the annual premium and applicable registration fees. The annual expiration date is printed on the NHIS card and stickers are added to the card at the time of annual re-enrollment to indicate current enrolled status. However, the onus falls on the client to

4
remember to re-enroll; this poses a particular challenge for illiterate clients who cannot read the expiration date on the card, and who may not understand that they need to pay once a year.7
After the expiration date, covered individuals have a three-month grace period during which the insurance can be renewed. If an individual fails to re-enroll within that period, NHIS policy dictates that the individual must go through another three-month waiting period. At the start of this study, NHIS offices serving the SAT clients in our sample were not enforcing this rule. Rather, they allowed individuals to access care immediately after re-enrolling, even if the policy had expired. If the insurance had been expired for more than one year, clients were required to pay the premium for every year that they have missed in order to use insurance immediately. In 2011, local NHIS officers reported a change in the enforcement of the expiration policy, indicating that if registrants did not pay the annual premium and fees within three-month grace period, that they would lose eligibility for services and be required to wait three months to access services once premiums and fees were paid for the year.
NHIS offices report that re-enrollment is a particular challenge. While registration rates have increased, many of the registered individuals fail to re-enroll each year. For example, in 2010 the Tolon NHIS office, which serves a rural area near the city of Tamale in Northern Ghana,8 estimated that about one-half of the population in its district is registered and has a current policy, but another 30 percent has registered but not renewed their insurance, allowing it to expire. This is consistent with findings from our sample at baseline where 70 percent of the respondents report being registered for insurance, but only about 32.6 percent of the total could be either confirmed as currently enrolled from visual inspection of the insurance card or through extrapolation based on their reported use and ways of paying for health services.
There are a number of potential barriers to registration and enrollment in the health insurance program. Individuals may not know about the program,
7When a client’s insurance expires at the end of one year, the client
is still considered to be “registered” with NHIS—her information is
stored in NHIS databases. If she re-enrolls, a new sticker is provided
for her membership card that indicates the new expiration date. In
order to be considered “enrolled” or “active” and eligible for
covered services, the client must be current on premium payment. If
the client fails to pay the annual premium, the client may be termed
“unenrolled,” “inactive” or “expired.” 8 Some of SAT’s groups served by its Tamale branch are located in
the areas served by the Tolon NHIS office. People may register at
any NHIS office, so the Tolon NHIS office possibly serves some
people living within the city of Tamale as well.
may not understand how insurance works or what is covered or may not know how to go about registering. Some individuals may also be unable to afford the premium at the time it is due. While an 11 to 14 GHC payment is not a particularly high amount even in rural Ghana, a large family may find it a challenge to put together the money to cover every adult household member under age 70, and particularly at a set time each year as there is no flexible payment option. Individuals may also believe that insurance is not a good value for them because of lack of availability of providers, benefit limitations, because they do not think they will need health services, or because they perceive the quality of services available to be low as compared to those who pay for health expenses out-of-pocket, or “cash and carry” care. Lastly, individuals may have every desire and intention of registering, but simply do not get around to doing it. Each of these, with perhaps the exception of lack of knowledge, was observed in our sample either in the quantitative or qualitative surveys and will be discussed more in greater detail.
2. METHODS
Health microinsurance education
For this study, we hypothesized that low knowledge about Ghana’s health insurance program or about insurance in general was a barrier to registration or re-enrollment, and that education, therefore, may be an effective means of increasing insurance uptake and access to healthcare services. We theorized that education could be effective in increasing awareness, knowledge and interest and stimulating greater demand for the health insurance program, pushing those who want to register but have not yet done so, increasing annual re-enrollment, and increasing total active enrollment (those who are current with premium and eligible for benefits) in the sample population.
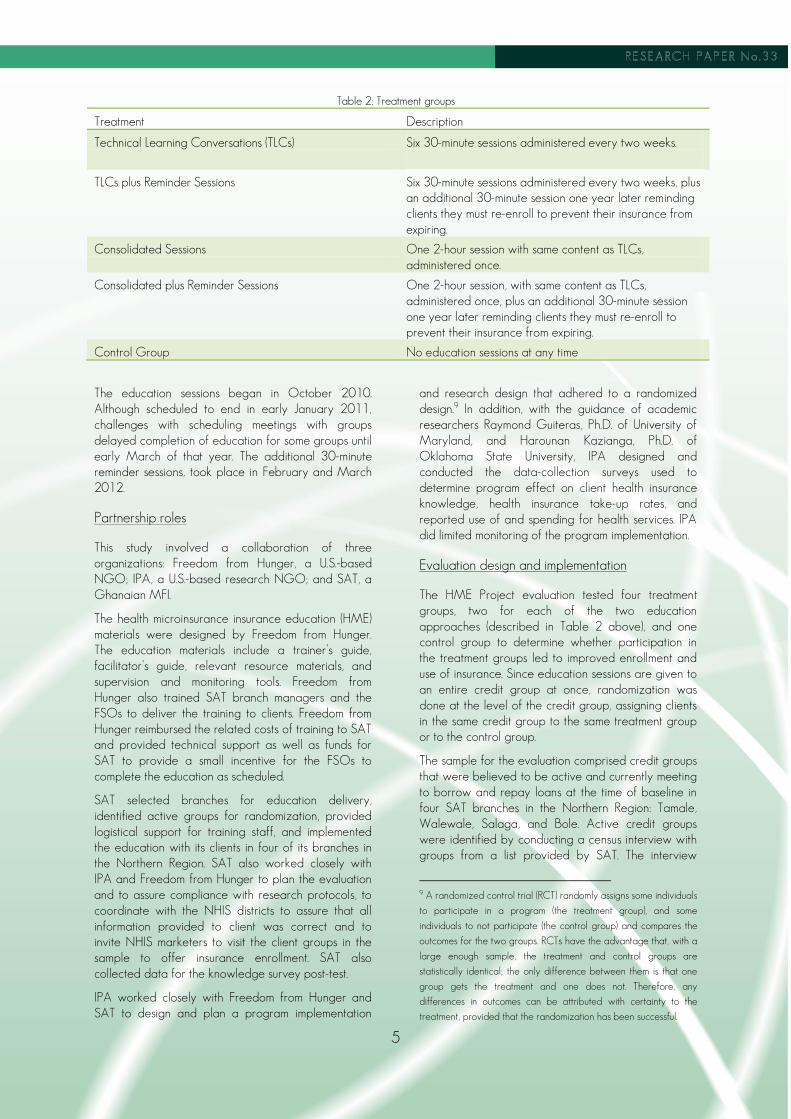
The Health Microinsurance Education (HME) project aimed to provide education about health insurance to clients of SAT in Northern Ghana. The education sessions were designed to be provided at meetings of the clients’ microfinance groups. Two different education treatments were tested and half of each treatment group was also offered a follow-up reminder session after one year as described in Table 2.
The education sessions were delivered by financial service officers (FSOs) who serve the microfinance clients. After completing the education program, FSOs were to arrange for an NHIS agent to visit the group to provide an opportunity for clients to register or re-enroll in health insurance.
5
Table 2: Treatment groups
Treatment Description
Technical Learning Conversations (TLCs) Six 30-minute sessions administered every two weeks.
TLCs plus Reminder Sessions Six 30-minute sessions administered every two weeks, plus an additional 30-minute session one year later reminding clients they must re-enroll to prevent their insurance from expiring.
Consolidated Sessions One 2-hour session with same content as TLCs, administered once.
Consolidated plus Reminder Sessions One 2-hour session, with same content as TLCs, administered once, plus an additional 30-minute session one year later reminding clients they must re-enroll to prevent their insurance from expiring.
Control Group No education sessions at any time
The education sessions began in October 2010. Although scheduled to end in early January 2011, challenges with scheduling meetings with groups delayed completion of education for some groups until early March of that year. The additional 30-minute reminder sessions, took place in February and March 2012.
Partnership roles
This study involved a collaboration of three organizations: Freedom from Hunger, a U.S.-based NGO; IPA, a U.S.-based research NGO; and SAT, a Ghanaian MFI.
The health microinsurance insurance education (HME) materials were designed by Freedom from Hunger. The education materials include a trainer’s guide, facilitator’s guide, relevant resource materials, and supervision and monitoring tools. Freedom from Hunger also trained SAT branch managers and the FSOs to deliver the training to clients. Freedom from Hunger reimbursed the related costs of training to SAT and provided technical support as well as funds for SAT to provide a small incentive for the FSOs to complete the education as scheduled.
SAT selected branches for education delivery, identified active groups for randomization, provided logistical support for training staff, and implemented the education with its clients in four of its branches in the Northern Region. SAT also worked closely with IPA and Freedom from Hunger to plan the evaluation and to assure compliance with research protocols, to coordinate with the NHIS districts to assure that all information provided to client was correct and to invite NHIS marketers to visit the client groups in the sample to offer insurance enrollment. SAT also collected data for the knowledge survey post-test.
IPA worked closely with Freedom from Hunger and SAT to design and plan a program implementation
and research design that adhered to a randomized design.9 In addition, with the guidance of academic researchers Raymond Guiteras, Ph.D. of University of Maryland, and Harounan Kazianga, Ph.D. of Oklahoma State University, IPA designed and conducted the data-collection surveys used to determine program effect on client health insurance knowledge, health insurance take-up rates, and reported use of and spending for health services. IPA did limited monitoring of the program implementation.
Evaluation design and implementation
The HME Project evaluation tested four treatment groups, two for each of the two education approaches (described in Table 2 above), and one control group to determine whether participation in the treatment groups led to improved enrollment and use of insurance. Since education sessions are given to an entire credit group at once, randomization was done at the level of the credit group, assigning clients in the same credit group to the same treatment group or to the control group.
The sample for the evaluation comprised credit groups that were believed to be active and currently meeting to borrow and repay loans at the time of baseline in four SAT branches in the Northern Region: Tamale, Walewale, Salaga, and Bole. Active credit groups were identified by conducting a census interview with groups from a list provided by SAT. The interview
9 A randomized control trial (RCT) randomly assigns some individuals
to participate in a program (the treatment group), and some
individuals to not participate (the control group) and compares the
outcomes for the two groups. RCTs have the advantage that, with a
large enough sample, the treatment and control groups are
statistically identical; the only difference between them is that one
group gets the treatment and one does not. Therefore, any
differences in outcomes can be attributed with certainty to the
treatment, provided that the randomization has been successful.

6
ascertained active status of the group, collected basic information about the group members including enrollment status, and recorded contact information so that the group could be contacted for future survey interviews.
The sample size was 300 credit groups from the four SAT branches in the Northern District. Five members in each credit group were randomly selected to be surveyed.10 The credit groups in the sample were randomly assigned to treatment and control groups. Of the sample credit groups, 40 percent were assigned to the control group, while 15 percent were assigned to each of the four treatment groups. Using information collected through a census of credit groups, random assignment was stratified on branch, urban or rural, and high or low enrollment. Enrollment was defined as being current on an NHIS insurance policy.
Data-collection and analysis
The impact of the program was assessed using data from a baseline survey, a post-education knowledge test, a midline survey, an endline survey and a qualitative study.
The baseline survey was administered from September 2010 to November 2010 at each respondent’s home, unless the respondent requested an alternative location. Enumerators hired and trained by IPA interviewed 1,505 respondents. The survey took approximately between one and two hours to complete. Data entry was done by IPA’s in-house data entry team in Accra, using double-double data entry.
A post-education knowledge test was administered after the last education session in March 2011 to assess the education’s impact on client knowledge of insurance and provide monitoring data to SAT. This knowledge test was made up of health-insurance knowledge questions from the baseline survey and was administered by the FSOs who conducted the education sessions.
The midline take-up survey was conducted with the same respondents from the baseline survey sample at SAT microfinance group meetings in July 2011 by surveyors hired and trained by IPA. The survey was much shorter than the baseline survey and covered the enrollment information in the Household Roster section of the baseline survey and a few additional questions on use of health services.
10 Credit groups with fewer than five members were randomly
paired with another credit group with fewer than five members to
create a new “credit group” with at least five members. These pairs
are treated as one credit group in the research design; both credit
groups assigned to the pair are placed in the same treatment group
or in the control group.
The endline take-up survey was conducted from April to May 2012 with the same respondents from the baseline and midline survey sample, after the reminder sessions were completed for the groups randomly selected to receive them. The endline survey collected all of the same data as the midline survey, plus some additional information about household finances, reasons for enrolling or not enrolling in insurance and how households dealt with health events.
A qualitative study was conducted at the same time as the endline survey. Focus-group discussions were conducted with a random selection of respondents. The interviews, conducted with groups of respondents who had the same registration status, asked about what respondents knew about insurance, which program attributes they liked or disliked, and which attributes were most important to their decision to enroll.
Study limitations
A number of challenges were encountered that may have affected the overall findings of the study.
Randomization and compliance with treatment protocols
While inactive groups identified at the beginning of the program were screened out, some groups became inactive between the census and the beginning of the education sessions. Others became inactive over the course of the study, creating a challenge for both implementation and evaluation of the project. According to the randomization design, 190 client groups were assigned to receive either short- or consolidation-session education; however, only 128 groups (67 percent) actually received education. The most common reason that groups did not receive education was that they were “inactive” and no longer participating in SAT’s loan program, usually because of group default on past loans.
Post-education knowledge test
Issues with the knowledge test to evaluate changes in knowledge immediately after the education included failures to survey the entire subsample and to survey only randomly selected clients assigned by IPA. This resulted in a smaller number of tests being completed and from respondents who were not necessarily randomly selected. Lastly, the SAT FSOs conducted the knowledge tests themselves. Best practice would have been to use independent evaluators.
Spillover and contamination
Spillover of the treatment and its effects into the control group may have contributed to an overall increase in enrollment across the entire sample and diluted the observable effects of the education. Many SAT groups meet in the same communities. Social networks are often an important influence on
7
knowledge and attitudes, and educating some groups may increase community awareness, which affects all SAT groups in an area. With a larger number of active groups, it may have been possible to achieve greater geographic separation to mitigate this effect.
Since randomization was by credit groups and not by credit officers, SAT officers may also have been sources of inadvertent contamination. Data from the quantitative survey does suggest that some members of control groups might have received education and one loan officer reported giving a consolidated treatment to a control group.
Some of the challenges associated with adherence to randomization for individual credit groups might have been avoided if the randomization had been done at the level of the credit officer rather than the credit group. With such a design, randomly selected credit officers would receive the training necessary to implement the education, and those officers would give the education to all of their groups, removing the burden on the officer to remember which credit groups should get treatment. In addition, the risk of spillover effects would be lower because officers would not accidentally mention information from the training to control groups.
In the case of this project, randomizing at the credit officer level was not feasible because there were too few credit officers to randomize at the credit officer level while maintaining power. However, had there been a greater number of credit officers, this would have been an improvement to the study methodology. Other options for increasing control over implementation might include hiring staff specifically to run the intervention.
3. RESULTS
The baseline survey looked extensively at the characteristics associated with enrollment and registration rates providing a comprehensive picture of the sample and the characteristics of clients and families who were registered and not registered in the insurance.
Basic demographics for adult registration and enrollment
When looking at demographic traits associated with enrollment, fewer variables are significantly correlated with enrollment status than were correlated with registration status, and most of the correlation sizes are smaller (Appendix Tables 28 and 30). Women and older adults are more likely to be both registered and enrolled. While education status was significantly correlated with registration, it was not for enrollment. A number of ethnic and religious variables were
significantly associated with higher or lower registration and enrollment rates; however, it is likely that these variables serve as proxies for geographical areas where concentrations of people from the same religion live rather than actual differences due to religion.
Being located in a rural area was associated with a 6 percentage-point decline in the likelihood of being registered but residents of rural areas were no more or less likely to be enrolled than urban residents. Being located in Bole, Salaga or Walewale was all positively associated with the likelihood of being registered, compared to being in Tamale; however, the only geographic variable that was significantly related to enrollment was living in Walewale.
Basic demographics for children’s registration and enrollment status
We also looked at attributes associated with registration and enrollment for children (see Appendix, Tables 31 and 33). As with adults, demographic factors for children were more closely associated with registration status than enrollment status; however, children are slightly more likely to be registered than adults, likely reflecting the fact that there is no premium payment for children. Gender is not a statistically significant predictor of the likelihood a child will be registered or enrolled. Children ages 7 to 17 are less likely to be currently enrolled than younger children, despite the fact that they are more likely to be registered. This is probably because although they are older, their parents have had more time to register them. It is also more likely that more time has elapsed since their registration, so their insurance is more likely to have expired. Gender is not significantly correlated with enrollment status.
There was no significant relationship between enrollment in school and being currently enrolled in health insurance, despite the fact that there was a very large correlation (28 percentage points) between being enrolled in school and being reported as being registered for health insurance.
Children of household heads were significantly more likely to be registered and enrolled than children more distantly related to the household head. A child of the household head was 5 percentage points more likely to be registered than the child of another household member, but only 3 percentage points more likely to be enrolled (Appendix Tables 32 and 34).
Household financial status
The baseline study also looked at the relationship between financial attributes and household registration and enrollment rates; some of these measures were also collected in the endline survey.

8
Appendix Tables 35 and 36 report results for regressions of household insurance registration and enrollment rates on different measures of household income and consumption, including weekly income from the respondent’s SAT business, annual income from the farm harvest, weekly income from other sources besides the SAT business and farming, and a measure of annual consumption per household for the expenditure categories covered in our survey.
In general, the baseline data showed that insurance registration and enrollment status were not closely associated with household income or spending measures. This suggests that there is not a strong relationship between financial resources and insurance registration, and that the cost of paying premiums is not a significant barrier to either registering or maintaining current enrollment for our sample.
The endline survey also collected some information about household finances, including average daily household food consumption, average weekly income, and the number of phones the household owns (Appendix Tables 37 and 38). As with the baseline survey, there was very little relationship between the financial measures and the likelihood that a respondent would be registered or enrolled in health insurance.
Attitudes about insurance
There were two questions on the baseline that dealt directly with attitudes. Respondents were asked whether they agreed or disagreed with the statements, “I would rather risk having to pay for health expenses using cash and carry than pay for health insurance” and “Health insurance is not a good value for the money.” In each case, a response of “disagree” indicated a more positive attitude towards insurance.
Although respondents overall had very positive attitudes about insurance, there was not a clear relationship between attitudes about insurance and registration and enrollment. A response of “Disagree” to the first question was positively associated with insurance registration but not with enrollment. There was no significant relationship between responses to the second question and either registration or enrollment rates (Appendix Table 39).11
11Key hypotheses were tested using both linear and logistic
regression models. Results were similar; no variables were identified
as significant using the logistical regression that were not significant
for the linear model. For ease of interpretation, we report the linear
regression results.
Relationship between registration/enrollment and reporting a health event and self-reported health status
Health insurance registration is significantly related to a higher likelihood of reporting a health event in the past month, but the correlation size is small. Being registered for insurance is correlated with a 2 percentage-point increase in the likelihood that an individual reported experiencing a health event (see Appendix ,Table 40).
This may be because individuals who report health events are more aware that they are at higher risk and thus are more likely to register for insurance. Second, it may be that individuals with health insurance are more likely to seek treatment and that the act of seeking treatment may increase recall and reporting of the event.
Current health insurance enrollment had an even larger correlation with reporting a health event: being currently enrolled was associated with a 12 percentage-point increase in the probability that an individual would have reported having had a health event in the past month. As with registration, it is possible that those who are most likely to experience a health event are aware of this, and are more conscientious about keeping their enrollment current. However, it is also possible that much of the relationship is due to causality in the other direction. Prior to the change in NHIS local policy enforcement in 2011, it was possible for individuals to discover that their insurance was expired when they experienced a health event and to pay premium due and receive immediate access to covered health services. As a result, at baseline someone who has had a health event in the past month was likely to either have had a current policy at the time of the health event, or to have re-enrolled at the time they needed services.
Despite reporting more health events, individuals who are registered for health insurance when asked to rank their health on a 10-point scale rated their health significantly higher than those who are not registered. In the endline survey, respondents who reported they were registered for insurance had an average self-perceived health ranking of 7.31 out of 10 (higher numbers indicate better health), compared with 7.05 for those who were not registered, a statistically significant difference. There was no statistically significant difference between those who were confirmed enrolled and those who were not. It could be that individuals who are more health conscious are more likely to register for insurance. These findings would also be consistent with findings from other studies of client value and health insurance that indicate that high percentages of insured believed that insurance led to improved “peace of mind” and health status.

9
Impact of the education on consumer knowledge about health microinsurance
To test the impact of education on SAT clients’ knowledge and attitudes about health insurance, clients at baseline were quizzed about their knowledge and their attitudes regarding health insurance. The same set of questions were used to develop a post-education knowledge test that was administered a second time to a sub-sample of the baseline clients immediately after the education was administered. The results in Table 3 are based on the responses from clients who both participated in the baseline survey and the post-education knowledge test. As shown earlier, there were issues with the way that the knowledge test was conducted that resulted in both a smaller sample and the inclusion of clients who were not randomly selected. The measures below reflect only the clients who participated in both the baseline and the knowledge surveys (n=132).
In general, and as the data in Table 3 below illustrates, SAT clients had high levels of knowledge at baseline; for all questions, the majority of responses were correct. Respondents were asked whether they agreed or disagreed with the statements, “I would rather risk having to pay for health expenses using cash and carry than pay for health insurance” and “Health insurance is not good value for the money.” In each case, a response of “disagree” indicated a more positive attitude towards insurance.
At baseline, 92.1% of the respondents disagreed with the first question and 74.7 percent disagreed with the second question, suggesting very positive attitudes among a majority of respondents about the health insurance prior to the education.
However, there were some questions that clients were less likely to answer positively. For example, at baseline, almost one-half of clients did not know that they could not use their insurance immediately after registering. About one-third of clients did not think that transportation costs and lost work time could be considered part of the costs of being sick. A quarter of clients incorrectly thought there was a limit to the number of times they could use their insurance each year.
The clients’ knowledge of health insurance improved from the baseline survey to the post-education knowledge test after the education sessions were completed. Table 3 compares correct responses from the baseline survey, the post-education knowledge quiz subset and the endline. It also reports endline scores for questions that had low percentages of correct answers in the baseline for respondents who were included in all three surveys. While the number of respondents correctly identifying transportation cost and lost work time as part of the costs of being sick fell compared to immediate post-education levels, respondents’ knowledge on the other two questions improved, suggesting that gains in knowledge were sustained across the sample as a whole.
Table 3. Knowledge test correct responses by question, for respondents in all 3 surveys
Correct answer
Pre-education (n=132 )
Post-education (n=132 )
Endline (n=132)
T or F: After registering for insurance for the first time, I can use insurance to pay for health care immediately.
F 55% 53% 61%
T or F: Transportation costs and lost work time are part of the costs of being sick.
T 61% 79% 64%
T or F: I must re-enroll in insurance every year in order to access services using my insurance card.
T 96% 88% NA
T or F: There is a limit to how many times I can use my insurance each year.
F 73% 77% 79%
T or F: People with health insurance must still pay the doctor or the hospital before they can get covered services.
F 86% 88% NA
T or F: If I do not use health services this year, I will get back the money I paid for insurance.
F 95% 89% NA
Table 4. Average score on knowledge questions, by treatment group Short sessions
(N=57) Consolidated sessions (N=42)
Control (N=40)
Average number of correct answers, out of 6 4.9* 5.0* 4.3
*Significantly different from the control group at the 5% level.

10
Table 5. Post-education knowledge test, correct responses by question
Correct answer
Short sessions (N=57)
Consolidated sessions (N=42)
Control (N=40)
T or F: After registering for insurance for the first time, I can use insurance to pay for health care immediately.
F 61%* 71%* 43%
T or F: Transportation costs and lost work time are part of the costs of being sick.
T 75%* 74%* 90%
T or F: I must re-enroll in insurance every year in order to access services using my insurance card.
T 89% 90% 87%
T or F: There is a limit to how many times I can use my insurance each year.
F 84%* 83%* 55%
T or F: People with health insurance must still pay the doctor or the hospital before they can get covered services.
F 89% 93%* 80%
T or F: If I do not use health services this year, I will get back the money I paid for insurance.
F 91% 95%* 80%
*Significantly different from the control group at the 5% level.
The results from the post-education knowledge tests also suggest that individuals who were included in the treatment group had larger improvements in knowledge than those who were not. Table 4 reports average post-education quiz scores, by treatment group. Both treatment groups had average scores that were significantly higher than the control group. It should be noted that the sample included in Table 4 is different from that in Table 3, because Table 3 includes only respondents who participated in all three rounds of knowledge test data-collection, whereas Table 4 includes all who participated in the post-education knowledge test, regardless of whether they also participated in the baseline and endline.
Table 5 reports performance by question. The treatment groups generally performed better than the control group, except on the second knowledge question, which asked the respondent whether transportation costs and lost work time were part of the costs of being sick; respondents in the control group were significantly more likely to correctly
identify this as true. Again, as the sample included in Table 5 is broader than that in Table 3, the outcomes reported in the two tables may differ.
The knowledge test therefore indicates that where knowledge levels were lower at baseline, the education likely had a positive effect on improved knowledge, at least immediately after the education. The endline survey asked respondents three of the knowledge questions answered incorrectly most frequently in the baseline and midline study. There was no statistically significant difference in correct responses based on treatment group (Table 6). This could be explained by general gains in knowledge of the population over time, allowing those in the treatment group to catch up.
At endline, higher performance on these questions was significantly correlated with registration in health insurance, however, there was no significant relationship between knowledge and enrollment status (see Appendix, Table 41).
Table 6. Endline knowledge test, correct responses by question
Correct answer
Short sessions (N=57)
Consolidated sessions (N=42)
Control (N=40)
T or F: After registering for insurance for the first time, I can use insurance to pay for health care immediately.
F 64% 65% 65%
T or F: Transportation costs and lost work time are part of the costs of being sick.
T 73% 74% 76%
T or F: There is a limit to how many times I can use my insurance each year.
F 82% 77% 81%
*Significantly different from the control group at the 5% level.

11
Table 7. Places respondents hear about insurance
Source Number of respondents reporting hearing about insurance
Radio 836
Friends or family 803
National Health Insurance Scheme staff 496
TV 453
Hospital or clinic 405
SAT staff 314
Women’s or men’s groups 102
SAT client 60
Church or mosque 46
Haven’t heard about it 36
Other 7
Additionally, respondents at the endline were asked about where they had heard about information regarding the benefits of the health insurance product in the past six months. Table 7 outlines where most reported hearing information. These results indicate that in the past six months, most heard about the insurance from the radio, friends and family, followed by the NHIS, TV, the hospital and an SAT credit officer, in that order. There was no difference between education and control groups for those who indicated they had heard about the insurance from SAT.
The focus-group discussions conducted after the completion of the endline confirmed continued high levels of knowledge and relatively positive attitudes about the microinsurance product. Most of the groups of both currently enrolled clients and clients whose insurance had expired demonstrated high levels of knowledge about the registration fees, the annual premium, where they could receive health services, and about the need to renew their insurance each year to ensure continued coverage without out-of-pocket payments. These two groups of clients attributed much of their knowledge regarding the insurance to visits done by NHIS officers to their communities to promote and register individuals for the NHIS. Clients also reported hearing about the insurance from vans that traveled through their villages and made public announcements about the NHIS coverage, announcements made at their places of worship, on TV and radio.
The reports of where clients obtained information about the insurance during the focus-group discussions are consistent with information provided to us post-study by the NHIS about stepped-up enrollment efforts conducted in the study area. These efforts included local campaigns in communities, churches and mosques
that began in October 2010 and continued through the first quarter of 2012, exactly coinciding with the evaluation time frame for this study.
In contrast to clients who had enrollment experience, clients who had never enrolled in the insurance appeared to have very low or very basic information about the health microinsurance. They could volunteer that it was a product designed by the government to provide affordable health care for the poor but had very little additional information on the details of the product.
In conclusion, the education appeared to improve knowledge regarding the health insurance as measured immediately after the education was provided. However, given the weak survey methods used for the post-education knowledge surveys, we may not have captured the true or full impact of the education. In addition, the starting levels of high knowledge, the local awareness and enrollment efforts conducted at the same time by the NHIS may have created an environment in which education interventions have limited scope to increase further knowledge about insurance.
Impact of the education on decision to enroll in health insurance
To assess the impact of education on clients’ decisions to enroll in health insurance, the midline uptake survey collected data on registration and enrollment rates for clients in the sample.
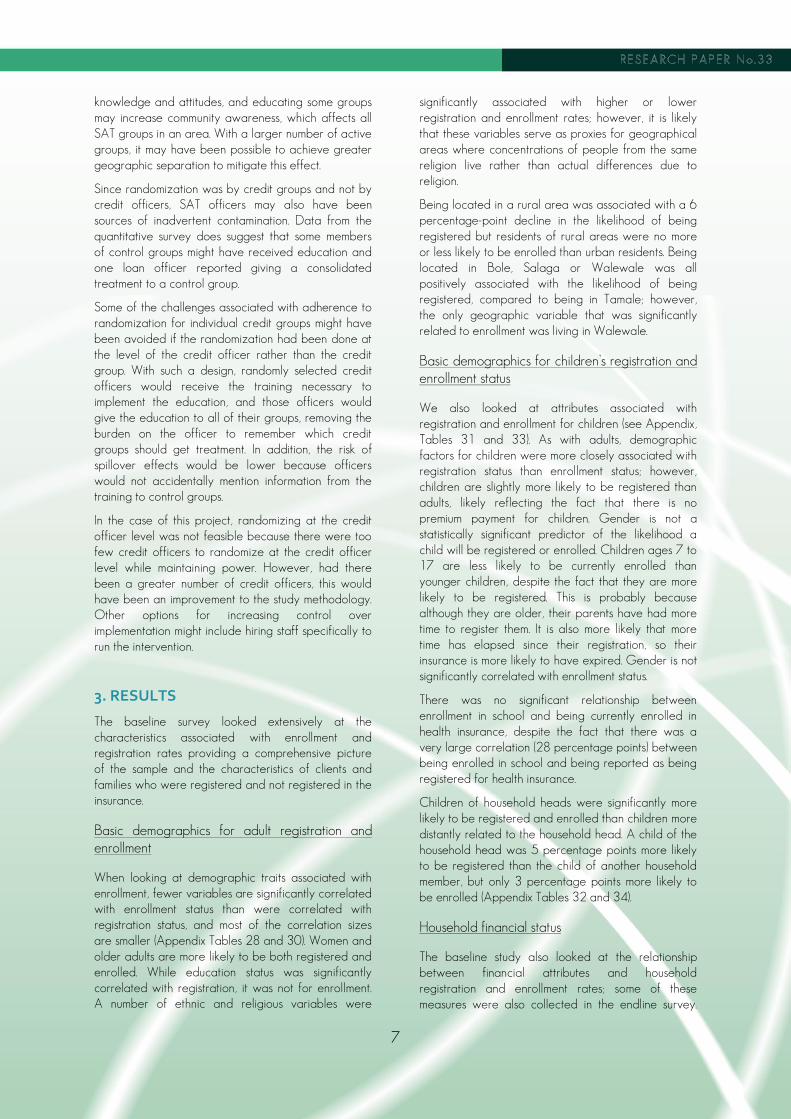
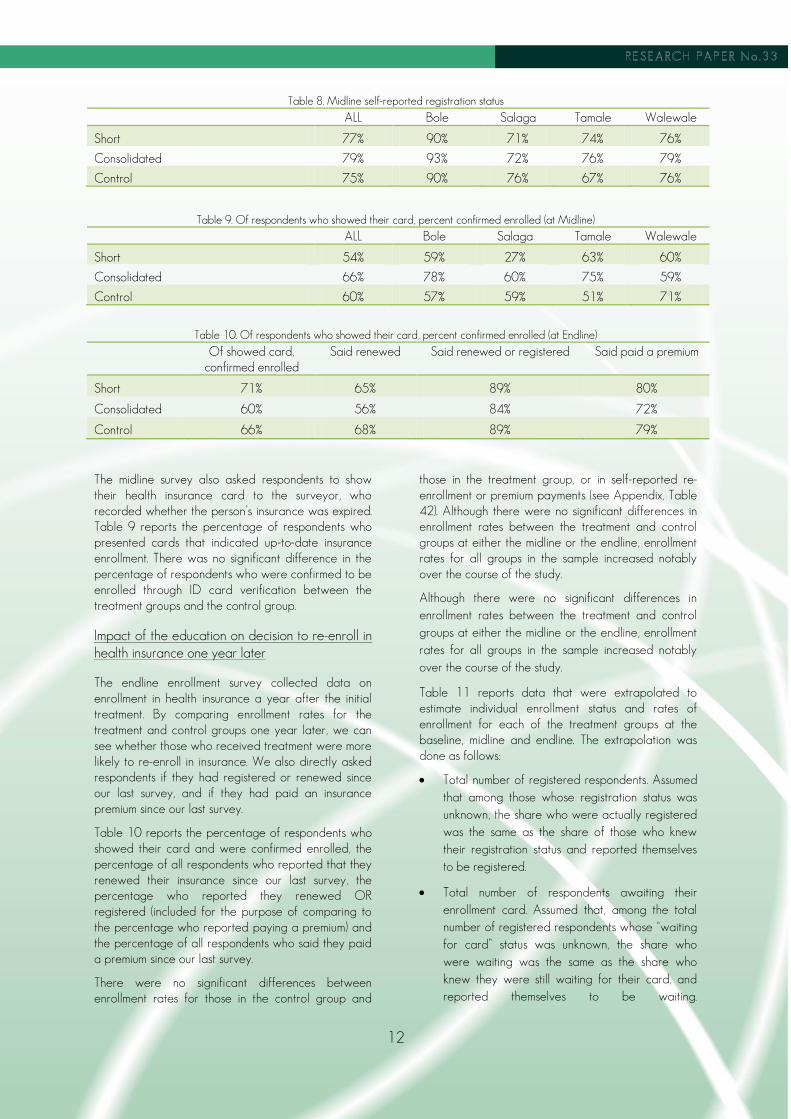
Table 8 reports midline health insurance registration rates for the control group, the consolidated session group and the TLC or short-session group, broken down by branch location. There was no significant difference in registration rates among the groups.
12
Table 8. Midline self-reported registration status
ALL Bole Salaga Tamale Walewale
Short 77% 90% 71% 74% 76%
Consolidated 79% 93% 72% 76% 79%
Control 75% 90% 76% 67% 76%
Table 9. Of respondents who showed their card, percent confirmed enrolled (at Midline)
ALL Bole Salaga Tamale Walewale
Short 54% 59% 27% 63% 60%
Consolidated 66% 78% 60% 75% 59%
Control 60% 57% 59% 51% 71%
Table 10. Of respondents who showed their card, percent confirmed enrolled (at Endline)
Of showed card, confirmed enrolled
Said renewed Said renewed or registered Said paid a premium
Short 71% 65% 89% 80%
Consolidated 60% 56% 84% 72%
Control 66% 68% 89% 79%
The midline survey also asked respondents to show their health insurance card to the surveyor, who recorded whether the person’s insurance was expired. Table 9 reports the percentage of respondents who presented cards that indicated up-to-date insurance enrollment. There was no significant difference in the percentage of respondents who were confirmed to be enrolled through ID card verification between the treatment groups and the control group.
Impact of the education on decision to re-enroll in health insurance one year later
The endline enrollment survey collected data on enrollment in health insurance a year after the initial treatment. By comparing enrollment rates for the treatment and control groups one year later, we can see whether those who received treatment were more likely to re-enroll in insurance. We also directly asked respondents if they had registered or renewed since our last survey, and if they had paid an insurance premium since our last survey.
Table 10 reports the percentage of respondents who showed their card and were confirmed enrolled, the percentage of all respondents who reported that they renewed their insurance since our last survey, the percentage who reported they renewed OR registered (included for the purpose of comparing to the percentage who reported paying a premium) and the percentage of all respondents who said they paid a premium since our last survey.
There were no significant differences between enrollment rates for those in the control group and
those in the treatment group, or in self-reported re-enrollment or premium payments (see Appendix, Table 42). Although there were no significant differences in enrollment rates between the treatment and control groups at either the midline or the endline, enrollment rates for all groups in the sample increased notably over the course of the study.
Although there were no significant differences in enrollment rates between the treatment and control groups at either the midline or the endline, enrollment rates for all groups in the sample increased notably over the course of the study.
Table 11 reports data that were extrapolated to estimate individual enrollment status and rates of enrollment for each of the treatment groups at the baseline, midline and endline. The extrapolation was done as follows:
Total number of registered respondents. Assumed that among those whose registration status was unknown, the share who were actually registered was the same as the share of those who knew their registration status and reported themselves to be registered.
Total number of respondents awaiting their enrollment card. Assumed that, among the total number of registered respondents whose “waiting for card” status was unknown, the share who were waiting was the same as the share who knew they were still waiting for their card, and reported themselves to be waiting.

13
Table 11: Extrapolated enrollment over course of study, by treatment group
Baseline (2010) Midline (2011) Endline (2012)
Short 30% 39% 54%
Consolidated 34% 45% 45%
Control 32% 42% 52%
Table 12. Health services and use of insurance in the case of a health event Treated Treated by
doctor Treated by chem. seller
Used insurance
Short 98% 57% 19% 57%
Consolidated 98% 48% 18% 53%
Control 95% 53% 18% 62%
Total number of enrolled respondents. Assumed that for those registered and who were no longer awaiting a card, that the enrollment rates were the same as for those who reported themselves registered and who were able to show a current insurance card.
Although the short treatment group showed the largest increase in estimated total enrollment, it should be noted that there was no significant difference in enrollment at endline between the treatment and control groups, even when baseline enrollment rates were taken into account (Appendix Table 45). In addition, there were also no significant differences in the change in enrollment rates for each of the three groups (the final enrollment rate, controlled for original enrollment rate).
Impact of education on access to and use of covered services
The endline uptake survey collected data on use of insurance in the case of a health event. Table 12 reports health-service treatment rates for the control and education treatment groups, along with the share of respondents treated by a doctor (a proxy for receiving high quality care), the share of respondents treated by a chemical seller (a proxy for receiving lower quality care) and, for those who received treatment, the share who paid with insurance. The final column shows the percentage of respondents who were able to show their insurance card to a surveyor during the endline uptake survey.
There were no significant differences in treatment rates, insurance usage, or types of treatment between those in the treatment groups and those in the control.
Feedback from the focus groups revealed that while clients had fairly high knowledge about where they could use their insurance card to receive services, they had fairly low knowledge about the types of services that were covered. While some clients indicated that
they knew the insurance covered basic services and did not cover some surgeries or medication, many shared that they discovered what was covered or not covered when they visited a medical provider for treatment. Client comments from interviews across all groups indicated that there was very little concern about having all of the details about what the insurance covered. This suggests that lack of information about specific covered services was not perceived as a reason not to enroll or insurance or a barrier to using it.
In conclusion, the education did not appear to have any effect on access or use of health services; and, the qualitative interviews revealed that lack of knowledge about specific services was not reported as a concern with respect to insurance coverage and access to services.
Impact of a refresher training on re-enrollment
The endline uptake survey collected data on enrollment rates for respondents assigned to receive a refresher or reminder session, and respondents who were given initial treatment but not a refresher session.
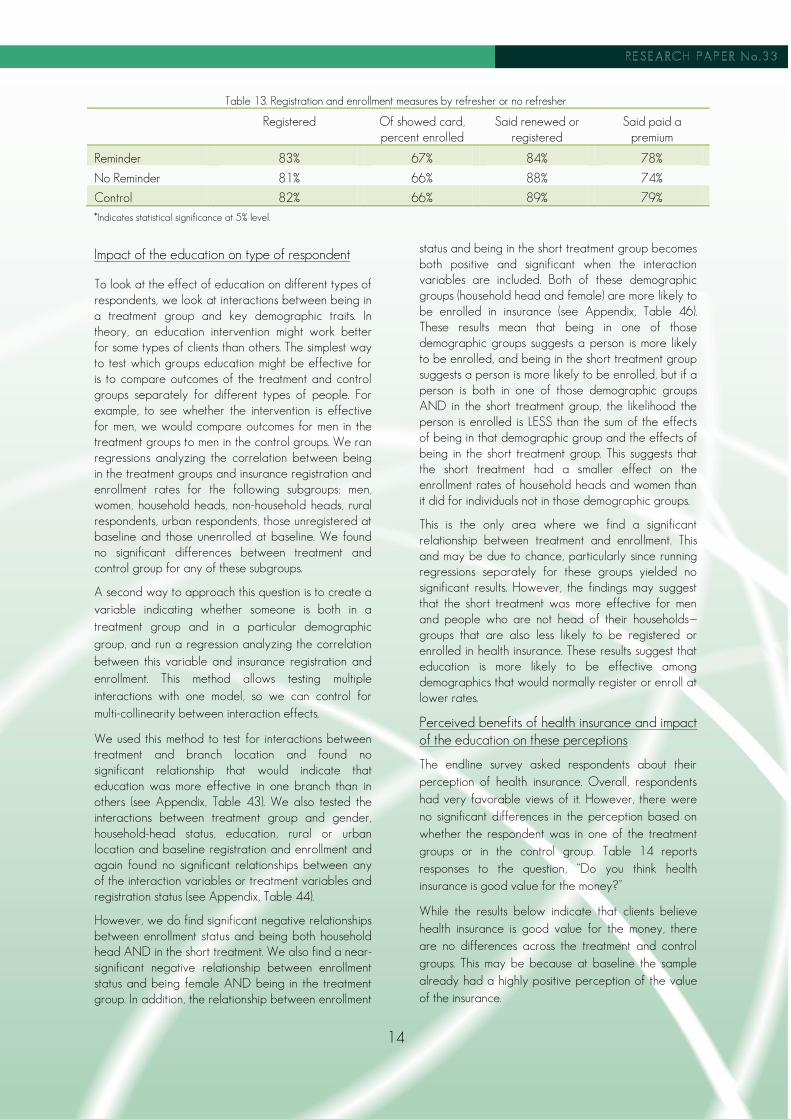
Table 13 reports measures of registration and enrollment rates for those in the treatment groups who received a refresher session versus those in the treatment groups who did not. There were no significant differences in registration or enrollment rates between those who received the refresher and those who did not. There were also no significant differences in the rate at which respondents who received the refresher treatment reported registering or renewing their insurance, or paying a premium, compared to respondents who got education but did not get the refresher session. There were also no statistically significant differences in registration or enrollment rates between those who received both education and a refresher, and those who received no education at all.
14
Table 13. Registration and enrollment measures by refresher or no refresher
Registered Of showed card, percent enrolled
Said renewed or registered
Said paid a premium
Reminder 83% 67% 84% 78%
No Reminder 81% 66% 88% 74%
Control 82% 66% 89% 79%
*Indicates statistical significance at 5% level.
Impact of the education on type of respondent
To look at the effect of education on different types of respondents, we look at interactions between being in a treatment group and key demographic traits. In theory, an education intervention might work better for some types of clients than others. The simplest way to test which groups education might be effective for is to compare outcomes of the treatment and control groups separately for different types of people. For example, to see whether the intervention is effective for men, we would compare outcomes for men in the treatment groups to men in the control groups. We ran regressions analyzing the correlation between being in the treatment groups and insurance registration and enrollment rates for the following subgroups: men, women, household heads, non-household heads, rural respondents, urban respondents, those unregistered at baseline and those unenrolled at baseline. We found no significant differences between treatment and control group for any of these subgroups.
A second way to approach this question is to create a variable indicating whether someone is both in a treatment group and in a particular demographic group, and run a regression analyzing the correlation between this variable and insurance registration and enrollment. This method allows testing multiple interactions with one model, so we can control for multi-collinearity between interaction effects.
We used this method to test for interactions between treatment and branch location and found no significant relationship that would indicate that education was more effective in one branch than in others (see Appendix, Table 43). We also tested the interactions between treatment group and gender, household-head status, education, rural or urban location and baseline registration and enrollment and again found no significant relationships between any of the interaction variables or treatment variables and registration status (see Appendix, Table 44).
However, we do find significant negative relationships between enrollment status and being both household head AND in the short treatment. We also find a near-significant negative relationship between enrollment status and being female AND being in the treatment group. In addition, the relationship between enrollment
status and being in the short treatment group becomes both positive and significant when the interaction variables are included. Both of these demographic groups (household head and female) are more likely to be enrolled in insurance (see Appendix, Table 46). These results mean that being in one of those demographic groups suggests a person is more likely to be enrolled, and being in the short treatment group suggests a person is more likely to be enrolled, but if a person is both in one of those demographic groups AND in the short treatment group, the likelihood the person is enrolled is LESS than the sum of the effects of being in that demographic group and the effects of being in the short treatment group. This suggests that the short treatment had a smaller effect on the enrollment rates of household heads and women than it did for individuals not in those demographic groups.
This is the only area where we find a significant relationship between treatment and enrollment. This and may be due to chance, particularly since running regressions separately for these groups yielded no significant results. However, the findings may suggest that the short treatment was more effective for men and people who are not head of their households—groups that are also less likely to be registered or enrolled in health insurance. These results suggest that education is more likely to be effective among demographics that would normally register or enroll at lower rates.
Perceived benefits of health insurance and impact of the education on these perceptions
The endline survey asked respondents about their perception of health insurance. Overall, respondents had very favorable views of it. However, there were no significant differences in the perception based on whether the respondent was in one of the treatment groups or in the control group. Table 14 reports responses to the question, “Do you think health insurance is good value for the money?”
While the results below indicate that clients believe health insurance is good value for the money, there are no differences across the treatment and control groups. This may be because at baseline the sample already had a highly positive perception of the value of the insurance.

15
Table 14. Do you think health insurance is good value for the money?
Treatment Group Yes Somewhat No Don’t know
Short 82% 10% 7% 1%
Consolidated 84% 7% 7% 2%
Control 85% 9% 4% 2%
Table 15. How likely are you to recommend SAT?
Response Control Short Consolidated
Very likely 66% 69% 66%
Somewhat likely 26% 24% 24%
Neither likely nor unlikely 3% 4% 3%
Somewhat unlikely 2% 1% 4%
Very unlikely 2% 1% 3%
Note: Due to rounding, figures may not total 100%.
Respondents were asked in the endline how likely they were to recommend health insurance to friends and family (Table 15). There were no significant differences between the treatment and control groups in the share of respondents reporting they would be “very likely” to recommend insurance; approximately 90 percent of respondents in all groups gave this response. Respondents were also asked whether they would recommend SAT to family and friends and there were no significant differences in responses among treatment groups.
The focus-group discussions also support the conclusion of high client perceptions of value for the health insurance. Clients reported that the insurance provides them access to affordable or even “free” health care when needed throughout the year. Many focus groups (accounting for about 64 percent of the participants) mentioned “low cost” of insurance as the key benefit to the insurance and low cost was ranked as the number one reason for people’s appreciation of and satisfaction with the insurance. Even clients who have never been enrolled indicated that the insurance is relatively low in cost. For those who are currently enrolled or who have expired insurance, an important benefit is that they do not have to have cash on hand to cover health expenses. One client stated:
“The human system is so funny that you cannot tell when you will fall sick or not and even one wouldn’t know when you will have money or not. So the best thing is to have health insurance so that if anything should happen, you can freely go and seek treatment at the hospital.”
In addition to low cost of the insurance, clients indicated that the insurance also afforded them easy access to nearby medical services. Many clinics are reportedly close to their homes and, for the most part, hospitals in near-by communities were easy to access
year round. Clients in some communities shared information about “roving nurses” who accept the insurance and make medical care quite convenient. Although some reported long queues at the hospital (often attributing this to the fact that so many people are enrolled), they also indicated willingness to make the trade-off between prompt care and services and affordability of the services. They also indicated that when there is an emergency that they are able to seek treatment promptly without having to worry where they will be able to find needed funds for payment.
Factors that influenced the decision to enroll or not enroll in the health insurance
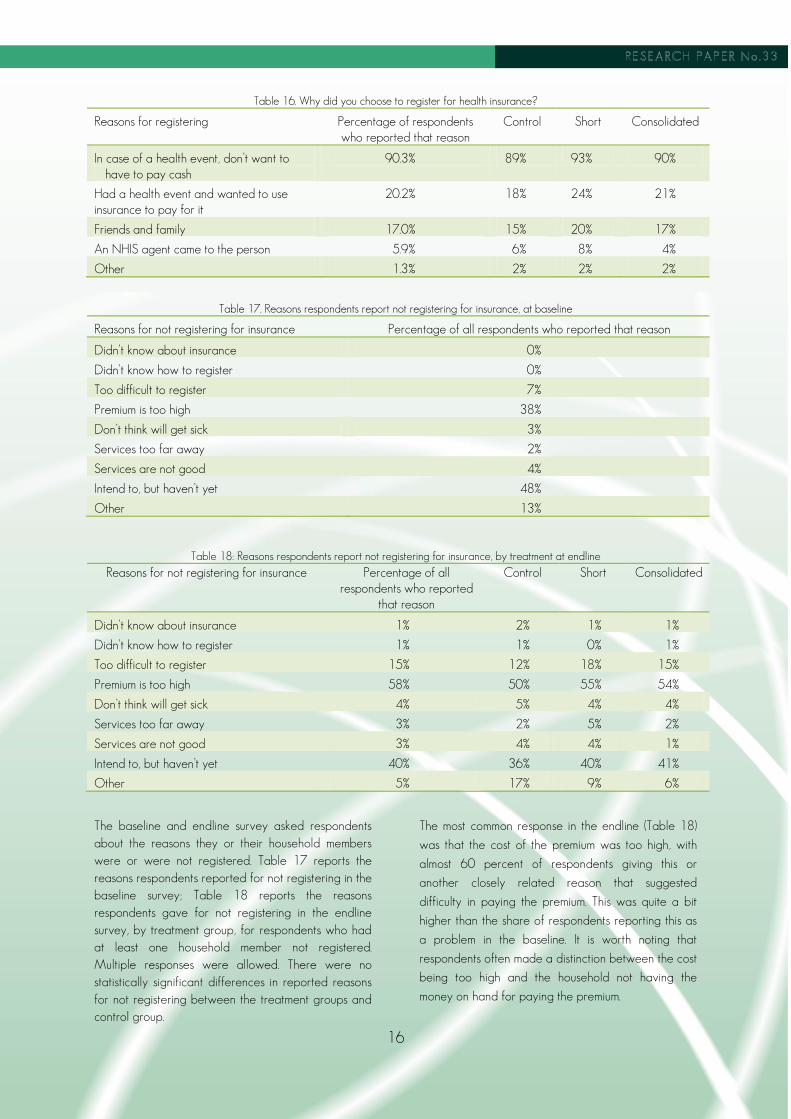
The endline also asked respondents who were registered why they chose to register for insurance. The percentage of registered respondents reporting each reason is listed in Table 16. Multiple responses were allowed; surveyors prompted the respondents by reading out all options.
Responses were very similar across treatment groups. There was no statistically significant difference between the treatment groups and control group in the share of respondents reporting that a SAT person influenced their decision to enroll, even though the education was not supposed to be provided to the control group.
Overall, 90 percent of all respondents said that they registered because they did not want to have to pay cash in case of a future health event. About one-fifth said they experienced a health event and wanted to use insurance to pay for it, and this prompted them to register or re-enroll. One rare but interesting response given by two respondents was that they wanted the insurance card to use as a form of identification. Some clients in the qualitative responses also mentioned this as a benefit.
16
Table 16. Why did you choose to register for health insurance?
Reasons for registering Percentage of respondents who reported that reason
Control Short Consolidated
In case of a health event, don’t want to have to pay cash
90.3% 89% 93% 90%
Had a health event and wanted to use insurance to pay for it
20.2% 18% 24% 21%
Friends and family 17.0% 15% 20% 17%
An NHIS agent came to the person 5.9% 6% 8% 4%
Other 1.3% 2% 2% 2%
Table 17. Reasons respondents report not registering for insurance, at baseline
Reasons for not registering for insurance Percentage of all respondents who reported that reason
Didn’t know about insurance 0%
Didn’t know how to register 0%
Too difficult to register 7%
Premium is too high 38%
Don’t think will get sick 3%
Services too far away 2%
Services are not good 4%
Intend to, but haven’t yet 48%
Other 13%
Table 18: Reasons respondents report not registering for insurance, by treatment at endline
Reasons for not registering for insurance Percentage of all respondents who reported
that reason
Control Short Consolidated
Didn’t know about insurance 1% 2% 1% 1%
Didn’t know how to register 1% 1% 0% 1%
Too difficult to register 15% 12% 18% 15%
Premium is too high 58% 50% 55% 54%
Don’t think will get sick 4% 5% 4% 4%
Services too far away 3% 2% 5% 2%
Services are not good 3% 4% 4% 1%
Intend to, but haven’t yet 40% 36% 40% 41%
Other 5% 17% 9% 6%
The baseline and endline survey asked respondents about the reasons they or their household members were or were not registered. Table 17 reports the reasons respondents reported for not registering in the baseline survey; Table 18 reports the reasons respondents gave for not registering in the endline survey, by treatment group, for respondents who had at least one household member not registered. Multiple responses were allowed. There were no statistically significant differences in reported reasons for not registering between the treatment groups and control group.
The most common response in the endline (Table 18)
was that the cost of the premium was too high, with
almost 60 percent of respondents giving this or
another closely related reason that suggested
difficulty in paying the premium. This was quite a bit
higher than the share of respondents reporting this as
a problem in the baseline. It is worth noting that
respondents often made a distinction between the cost
being too high and the household not having the
money on hand for paying the premium.
17
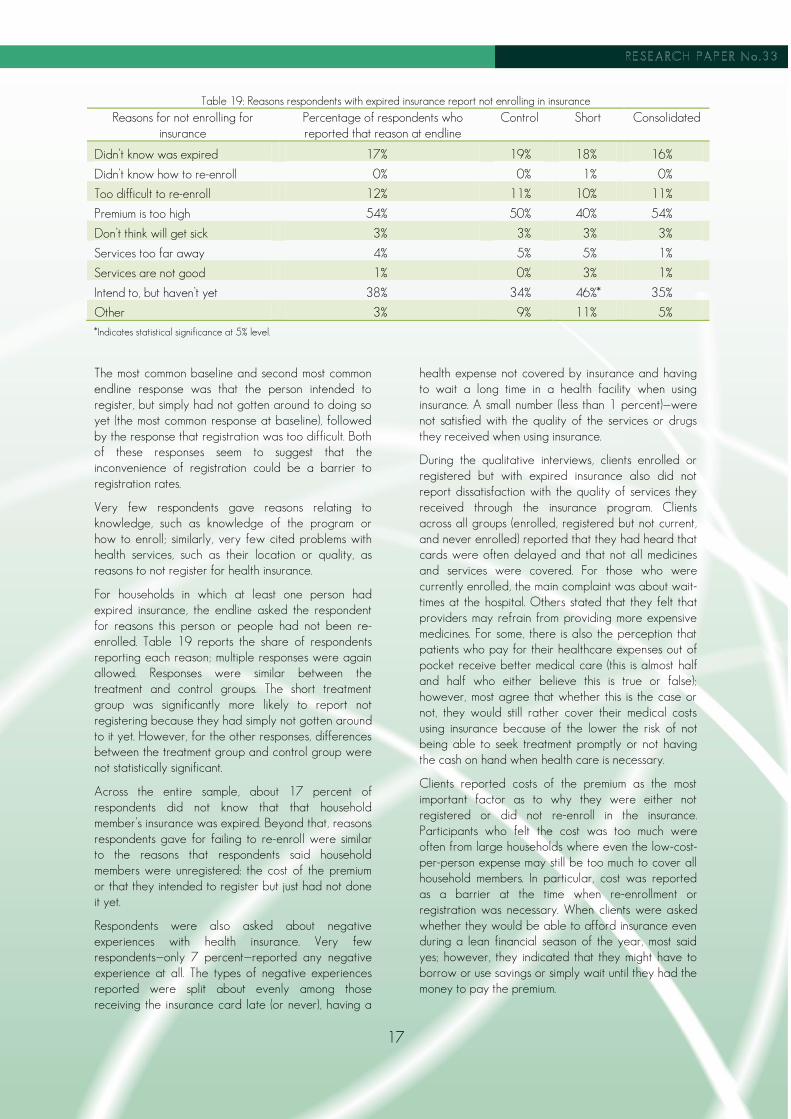
Table 19: Reasons respondents with expired insurance report not enrolling in insurance
Reasons for not enrolling for insurance
Percentage of respondents who reported that reason at endline
Control Short Consolidated
Didn’t know was expired 17% 19% 18% 16%
Didn’t know how to re-enroll 0% 0% 1% 0%
Too difficult to re-enroll 12% 11% 10% 11%
Premium is too high 54% 50% 40% 54%
Don’t think will get sick 3% 3% 3% 3%
Services too far away 4% 5% 5% 1%
Services are not good 1% 0% 3% 1%
Intend to, but haven’t yet 38% 34% 46%* 35%
Other 3% 9% 11% 5%
*Indicates statistical significance at 5% level.
The most common baseline and second most common endline response was that the person intended to register, but simply had not gotten around to doing so yet (the most common response at baseline), followed by the response that registration was too difficult. Both of these responses seem to suggest that the inconvenience of registration could be a barrier to registration rates.
Very few respondents gave reasons relating to knowledge, such as knowledge of the program or how to enroll; similarly, very few cited problems with health services, such as their location or quality, as reasons to not register for health insurance.
For households in which at least one person had expired insurance, the endline asked the respondent for reasons this person or people had not been re-enrolled. Table 19 reports the share of respondents reporting each reason; multiple responses were again allowed. Responses were similar between the treatment and control groups. The short treatment group was significantly more likely to report not registering because they had simply not gotten around to it yet. However, for the other responses, differences between the treatment group and control group were not statistically significant.
Across the entire sample, about 17 percent of respondents did not know that that household member’s insurance was expired. Beyond that, reasons respondents gave for failing to re-enroll were similar to the reasons that respondents said household members were unregistered: the cost of the premium or that they intended to register but just had not done it yet.
Respondents were also asked about negative experiences with health insurance. Very few respondents—only 7 percent—reported any negative experience at all. The types of negative experiences reported were split about evenly among those receiving the insurance card late (or never), having a
health expense not covered by insurance and having to wait a long time in a health facility when using insurance. A small number (less than 1 percent)—were not satisfied with the quality of the services or drugs they received when using insurance.
During the qualitative interviews, clients enrolled or registered but with expired insurance also did not report dissatisfaction with the quality of services they received through the insurance program. Clients across all groups (enrolled, registered but not current, and never enrolled) reported that they had heard that cards were often delayed and that not all medicines and services were covered. For those who were currently enrolled, the main complaint was about wait-times at the hospital. Others stated that they felt that providers may refrain from providing more expensive medicines. For some, there is also the perception that patients who pay for their healthcare expenses out of pocket receive better medical care (this is almost half and half who either believe this is true or false); however, most agree that whether this is the case or not, they would still rather cover their medical costs using insurance because of the lower the risk of not being able to seek treatment promptly or not having the cash on hand when health care is necessary.
Clients reported costs of the premium as the most important factor as to why they were either not registered or did not re-enroll in the insurance. Participants who felt the cost was too much were often from large households where even the low-cost-per-person expense may still be too much to cover all household members. In particular, cost was reported as a barrier at the time when re-enrollment or registration was necessary. When clients were asked whether they would be able to afford insurance even during a lean financial season of the year, most said yes; however, they indicated that they might have to borrow or use savings or simply wait until they had the money to pay the premium.

18
Thus, while affordability generally does not seem to be a barrier, the timing of the need to pay premium may be an issue, particularly during times of the year when there are other financial priorities. One client shared that once they have
“seen that health insurance is something good that helps one in times of difficulties with regard to health issues, we believe we would be able to pay health insurance during the lean season, which is the period even rich people do shake off a bit. We can always take money from our little savings or better still, borrow from moneylenders to pay premiums.”
Relationship between health insurance and household financial stability and well-being
Although our study does not enable us to assign causation between household financial stability and access and financing of care, our quantitative and qualitative surveys do provide valuable information about the relationships between health insurance, health treatment, and health and financial outcomes among this sample of MFI clients in Ghana.
Access to treatment and use of different types of providers
First, it is very unusual for someone not to get needed treatment, regardless of insurance status. Of the 439 respondents who reported having a health event in the past month in our endline survey, 96 percent reported getting some type of treatment. However, insured people are more likely to get care from a doctor, while uninsured people are more likely to go to a chemical seller (see Appendix, Table 46). Chemical sellers are much less highly trained, but will offer clients free advice about drugs they should purchase based on the clients’ symptoms, and many medicines, including anti-malaria drugs and antibiotics, can be purchased over the counter. As a result, asking a chemical seller about which drugs to buy is often a less expensive alternative to going to a more highly trained medical professional to get a prescription.
When clients in the focus groups were asked whether they would be able to cover health expenses even during a lean season, almost all said, “yes.” A common theme is illustrated by the following:
“No matter how hard-up one or a household might be, the life of its members is of great value to them. Even if there is a health event during the lean season, we would be able to pay cash-and-carry (out-of-pocket) for the services rendered. The source of the money will be from either one’s savings or they will borrow from friends or moneylenders.”
Another client who had never enrolled in insurance shared,
“Yes! One wouldn’t sit to watch the other suffer and die because of not having money. If the situation becomes critical, we believe members of our households will run around and find something to help us. The only way to do this is by borrowing.”
Methods of payment
The endline survey asked respondents how they financed the cost of health events. About one-half of respondents who experienced a health event paid for some part of it with insurance (Table 20), and over one-half reported dipping into savings. If the household borrowed, the most common source was family or friends. Very few borrowed from formal sources such as banks, MFIs or savings and loan groups. About 5 percent had to sell valuables. Having insurance did not always shield households from having to find other sources of money to pay for health events. Of the 387 respondents who reported using insurance to pay for the health event, 54 percent of them also indicated a need to dip into savings, 8 percent had to borrow from family or friends and 5 percent still had to sell valuables—the same rate as for all respondents, regardless of whether they used insurance or not.
Among those who did not use insurance, the most common reason for this was that the respondent was not enrolled (Table 21). Expired insurance accounted for almost one-quarter of instances for which respondents reported not using insurance to pay for care, suggesting that expired insurance frequently affects the financial burden that a health event has on a household.
Out-of-pocket costs for identified health events
There was some evidence that insurance lowers the cost of an individual health event for households. As shown in Table 22, respondents who used insurance to pay for costs were less likely to report paying out of pocket for medical services or medicines. (There were no significant differences in the probability that respondents reported paying for health services or medicine by treatment group.) However, when the person experiencing the health event was registered or enrolled in insurance, or used insurance to pay for health costs, the person was more likely to have paid an insurance renewal fee at the time of the health event. This suggests that for the period over which these data were collected, it was common for people to have expired insurance at the time of their health event, and then pay for a renewal in order to use it. As a result, the household would still bear an unexpected financial cost at the time of the health event. In addition, respondents reported paying for transportation costs, traditional medicine, and lost work time at equal rates regardless of whether they were registered, enrolled or used insurance to pay for the health event.

19
Table 20. Financing methods for health events in the sample
Financing Method Percentage of households experiencing a health event who used (multiple responses allowed)
Insurance 50%
Money from savings 67%
Borrowed from a moneylender 4%
Borrowed from family or friends 11%
Bank loan 0%
MFI loan 0%
S&L loan 0%
Sold valuables 5%
Gift 3%
Worked extra 1%
Other 2%
Table 21: Reasons respondents did not use insurance to pay for consultations
Reason Percentage reporting that reason
No response 2%
Isn’t registered 35%
Has not received insurance card yet 7%
Insurance was expired 24%
Treatment not covered by insurance 3%
Provider doesn’t accept insurance 12%
Thought would get better care with cash 7%
Other 2%
Didn’t want to wait for a prescription 9%
Table22: Percent of Respondents Reporting Paying Out-of-Pocket for Health Services or Medicine in the Case of a Health Event
1. Registered respondents compared with not registered
2. Respondents proven enrolled by showing card compared with not proven enrolled
3. Respondents who paid with insurance compared with respondents who did not pay with insurance
Registered Not reg. Enrolled Not enrolled
Paid Didn’t pay
Percentage of respondents reporting paying out of pocket for medical services or medicines
42%* 61%* 40% 47% 24%* 56%*
Percentage of respondents reporting paying an insurance renewal fee
34%* 10%* 41%* 26%* 48%* 17%*
Percentage of respondents reporting paying transportation costs
52% 49% 50% 50% 51% 48%
Percentage of respondents reporting traditional medicine costs
6% 10% 8% 7% 4% 9%
Percentage of respondents reporting lost work income
16% 17% 17% 16% 17% 17%
*Indicates a statistically significant difference (at 5% level) between the two groups

20
Table 23. Financing Methods for Well Patient Visits
Financing Method Percentage of respondents attending a well-patient visit who used
Insurance 58%
Money from savings 42%
Borrowed from a moneylender 1%
Borrowed from family or friends 7%
Bank loan 0%
MFI loan 0%
S&L loan 0%
Sold valuables 1%
Gift 0%
Worked extra 0%
Other 4%
Average total costs for health events
Those who reported using insurance to pay for the health event reported an average total cost of 34 GHC. Those who did not use insurance reported an average expense of 45 GHC. While the difference was not statistically significant, a difference of that size would justify a 10 GHC premium payment, even for an individual with a single health event in a year and especially if some portion of the reported cost was payment of premium at the time of the need for the service.
On average, respondents reported that the person experiencing the health event missed 7.4 days of work. There were no significant differences in the days of work missed based on registration or enrollment status, or whether the person reportedly used insurance to pay for the health event.
Use of insurance, methods of payment and cost of well-patient visits (proxy for use of preventive care)
Respondents were 9 percentage points more likely to report attending a well-patient visit if they were registered for insurance, and 13 percentage points more likely to report attending a well-patient visit if they were currently enrolled in insurance; differences that were statistically significant. Being in the treatment group was not significantly associated with likelihood of attending a well-patient visit.
Well-patient visits were more likely to be financed with insurance than consultations related to health events (58 percent versus 50 percent) and less likely to be financed from savings (42 percent versus 67 percent). Well-patient visits were infrequently financed from sources other than insurance or savings. Sources of financing for well-patient visits for the sample as a whole are reported in Table 23.
Respondents who used insurance to pay for well-patient visits were less likely to also dip into other
savings than those who went to consultations related to health events. While over one-half of those who used insurance in the case of health events also dipped into savings, only 16 percent of those who paid for well-patient visits with insurance also paid with savings. No one who paid for a well-patient event with insurance also sold valuables.
The difference in cost of well-patient visits for those who paid with insurance and those who did not was both striking and statistically significant. Those who paid with insurance spent only an average of 4 GHC on the visit, while those who did not pay with insurance paid 49 GHC.
Total spending on health
The endline survey asked respondents to estimate the total amount of their household’s out-of-pocket health expenses in the past month. The average reported amount was 29 GHC. There was no significant difference in the amount of total reported health expenses based on the respondent’s registration or enrollment status (see Appendix, Table 47). While accurate recall is likely to be imperfect, and amounts reported also likely to be affected by the time of year, the response does show that an average household with two adults and three children under the age of 18 would have paid just slightly more in one month for health services than the family would pay for health insurance coverage for an entire year. (Total annual premium and fees for a family of this size in Tamale would be about 36 GHC or $18.50).
Household shocks and food-insecurity events
The baseline survey asked respondents a number of questions about the consequences of household shocks. We found that when faced with financial shocks, households sell off assets or pull children out of school. Insurance registration was found to be associated with a lower likelihood of pulling children

21
out of school, even controlling for general household financial welfare, and a lower likelihood of household members experiencing food insecurity (see Appendix, Tables 48 and 49). With a simple correlation, we cannot determine causality. While it could be that insurance shields households from financial shocks caused by health events, it could also be that households that are better off or better at financial planning are both generally more likely to have insurance and more likely to shield themselves from financial shocks.
To address this, we analyze the relationship between insurance and shocks at the baseline and endline, controlling for household fixed effects. Because we have data for the same households over time, we can tease out how outcomes change if the respondent’s registration status changes. Controlling for household fixed effects, registration is associated with a 0.6 point drop in the 12-point food-insecurity index. This is a highly significant drop in reported food insecurity events, with a p-value of 0.000. (A total of 1,388 respondents had no missing data from either time point on the panel because no other variables were included as controls.) Similarly, registration in insurance was associated with an 8 percentage-point decrease in likelihood of pulling a child out of school (p-value 0.000) and 3 percentage-point decrease in likelihood of selling off assets (p-value 0.054). Enrollment status was not significantly related to any of these events. These results are highly suggestive that the lower incidence of shocks is due to insurance protecting
households from financial shocks, rather than households having better financial management skills.
4.ANALYSIS
Impact of education on enrollment
Overall, we did not observe significant differences in registration and enrollment rates for MFI clients in groups that received education about health insurance and those that did not, despite indications of improved insurance knowledge. Interestingly, these findings are consistent with those from other recent rigorous studies. A study of take-up of health insurance by tea farmers in Kenya found low take-up (16 percent) and no impact on take-up from insurance education despite increased insurance literacy. Another study in Senegal found no impact from education on enrollment in a health mutual with differing levels of subsidy.
Change in registration and enrollment rates over time
Although we did not detect statistically significant differences in uptake at midline and endline for the treatment and control groups, the magnitude of the change in enrollment and total uptake did change rather substantially for the entire sample as well as for the short treatment groups, as Table 24 shows below.
Table 24: Extrapolated enrollment of SAT clients in sample
Baseline enrolled clients
Midline enrolled clients
Endline enrolled clients
Percent change
Baseline enrollment
Midline enrollment
Endline enrollment
Percentage point change
Short 120 158 218 82% 30% 39% 54% 24
Consolidated 130 172 174 34% 34% 45% 45% 11
Control 169 207 257 52% 32% 42% 52% 20
TOTAL 419 537 649 55% 33% 42% 50% 17
These data show our best estimate of the enrollment status for all of the individuals in the sample from baseline to endline. Since clients who reported that they were registered could not always show ID cards, this data is extrapolated using percentages of clients who reported they were registered, could show cards, and where enrollment could be verified, and applying this percentage distribution to those who reported registered but could not show cards. Although differences across groups are not statistically significant, even controlling for initial enrollment rate, the number of individuals enrolled in the SAT groups
increased by 55 percent over the course of the study. When looked at from the perspective of total penetration or uptake, the percentage of SAT clients in the sample who were enrolled went from 33 percent at baseline to 50 percent at endline.
To understand how the overall increases observed in the SAT enrollment compared to regional data for the broader population we looked at data from the Northern District of the Ghana NHIA for four local areas that include most of the sample of the SAT clients: Bole, East Gonja, Tamale (to compare to our sample that was in the Salaga Branch) and West
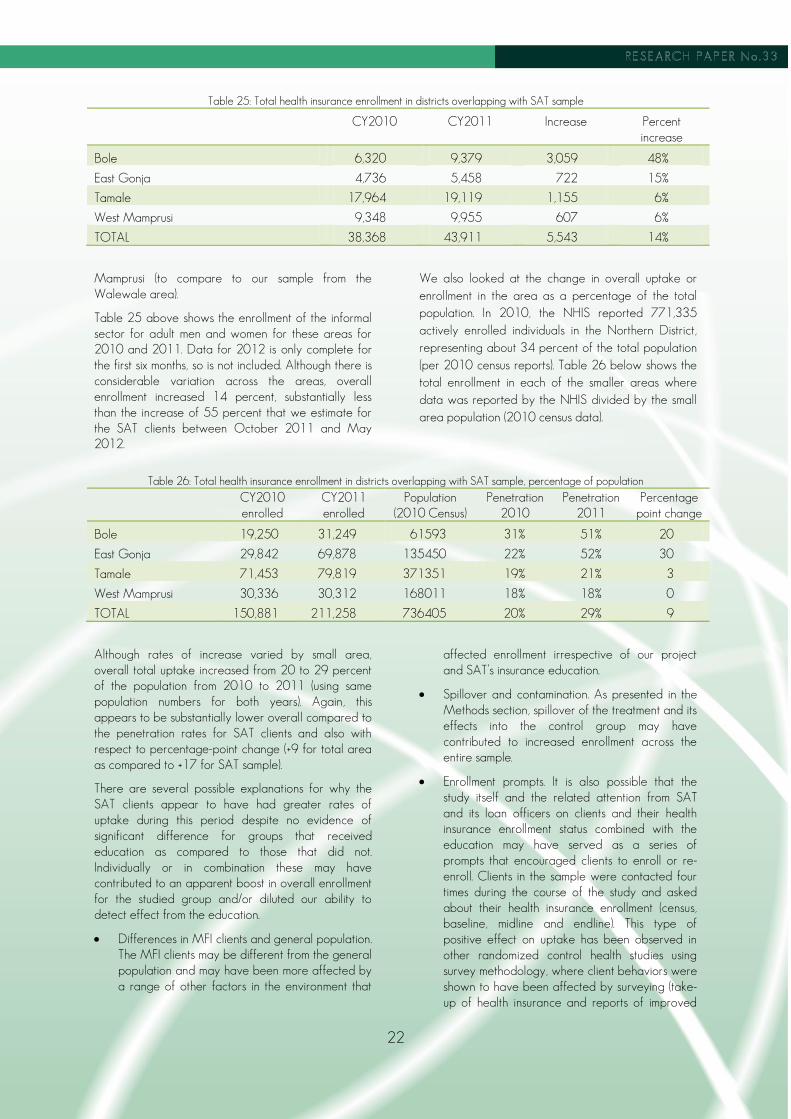
22
Table 25: Total health insurance enrollment in districts overlapping with SAT sample
CY2010 CY2011 Increase Percent increase
Bole 6,320 9,379 3,059 48%
East Gonja 4,736 5,458 722 15%
Tamale 17,964 19,119 1,155 6%
West Mamprusi 9,348 9,955 607 6%
TOTAL 38,368 43,911 5,543 14%
Mamprusi (to compare to our sample from the Walewale area).
Table 25 above shows the enrollment of the informal sector for adult men and women for these areas for 2010 and 2011. Data for 2012 is only complete for the first six months, so is not included. Although there is considerable variation across the areas, overall enrollment increased 14 percent, substantially less than the increase of 55 percent that we estimate for the SAT clients between October 2011 and May 2012.
We also looked at the change in overall uptake or enrollment in the area as a percentage of the total population. In 2010, the NHIS reported 771,335 actively enrolled individuals in the Northern District, representing about 34 percent of the total population (per 2010 census reports). Table 26 below shows the total enrollment in each of the smaller areas where data was reported by the NHIS divided by the small area population (2010 census data).
Table 26: Total health insurance enrollment in districts overlapping with SAT sample, percentage of population
CY2010 enrolled
CY2011 enrolled
Population (2010 Census)
Penetration 2010
Penetration 2011
Percentage point change
Bole 19,250 31,249 61593 31% 51% 20
East Gonja 29,842 69,878 135450 22% 52% 30
Tamale 71,453 79,819 371351 19% 21% 3
West Mamprusi 30,336 30,312 168011 18% 18% 0
TOTAL 150,881 211,258 736405 20% 29% 9
Although rates of increase varied by small area, overall total uptake increased from 20 to 29 percent of the population from 2010 to 2011 (using same population numbers for both years). Again, this appears to be substantially lower overall compared to the penetration rates for SAT clients and also with respect to percentage-point change (+9 for total area as compared to +17 for SAT sample).
There are several possible explanations for why the SAT clients appear to have had greater rates of uptake during this period despite no evidence of significant difference for groups that received education as compared to those that did not. Individually or in combination these may have contributed to an apparent boost in overall enrollment for the studied group and/or diluted our ability to detect effect from the education.
Differences in MFI clients and general population. The MFI clients may be different from the general population and may have been more affected by a range of other factors in the environment that
affected enrollment irrespective of our project and SAT’s insurance education.
Spillover and contamination. As presented in the Methods section, spillover of the treatment and its effects into the control group may have contributed to increased enrollment across the entire sample.
Enrollment prompts. It is also possible that the study itself and the related attention from SAT and its loan officers on clients and their health insurance enrollment status combined with the education may have served as a series of prompts that encouraged clients to enroll or re-enroll. Clients in the sample were contacted four times during the course of the study and asked about their health insurance enrollment (census, baseline, midline and endline). This type of positive effect on uptake has been observed in other randomized control health studies using survey methodology, where client behaviors were shown to have been affected by surveying (take-up of health insurance and reports of improved

23
water source). This effect could have been particularly powerful in this study given the high number of respondents in all treatment groups who reported that they wanted to register, but had just not taken action to do so. The problem of survey impact on respondent behavior might have been avoided by measuring enrollment using more passive observational tools, such as government administrative data on enrollment, rather than through household surveys. In the case of our study, we were unable to get permission from the NHIA to access their data; and even if we had, it is unclear whether we would have been able to match government enrollment records to individuals in the study, as an individual’s name would not be a sufficiently unique identifier.
In summary, while we are not able to say with certainly why the rate of change in enrollment of SAT clients appears to have increased more than for the overall local area, this finding suggests a greater potential benefit that MFIs can bring to efforts to reach and enroll informal-sector families. This is an area worthy of further inquiry to see if simple and regular reminders or encouragement from MFIs to clients—perhaps at every new loan application point—could contribute to increased uptake of health insurance.
Implications for external validity
Although we did not observe a significant impact from the education in our sample, it is important to note that Ghana currently has a number of unique circumstances that likely affected the results of this study and that limit the validity of the findings to other settings.
High initial levels of knowledge and awareness of insurance
One likely explanation of the findings in Ghana is that additional knowledge about health insurance was not an important barrier to enrollment at the time of our study for this population. In both the knowledge tests (prior to the intervention) and the qualitative study, respondents demonstrated a high level of awareness, knowledge and a positive attitude about most aspects of insurance. While education did appear to improve knowledge in areas where there were gaps, the majority of clients in this MFI may have had sufficient basic knowledge about insurance to make a decision about enrolling. Favorable opinions about insurance are widespread among those both enrolled and not enrolled, and did not appear to be influenced by education. Education is likely to be more effective in a setting where initial health insurance enrollment is lower, and people have less knowledge of insurance.
Relatively high starting enrollment
Despite the fact that only about one-third of our sample was enrolled prior to education, there is also the possibility that these rates may have already reached the upper limits for a voluntary social health insurance program that requires active enrollment and premium payment by informal-sector individuals. Table 27 provides current levels of enrollment of informal-sector populations in a sample of developing countries’ insurance programs. Achieving high levels of health insurance coverage in the informal sector has remained a stubborn challenge. This may be particularly true in countries such as the Philippines and Ghana where the insurance option has been available for some time (about ten years), where awareness of the product with its advantages and disadvantages or shortcomings are likely to be well-understood and yet where total uptake has not gone above one-third of those eligible. Outliers such as Rwanda and India may offer lessons about how to make more progress toward universal levels of coverage for poor families.
The high rates of initial enrollment posed a particular challenge for this study with its limited sample size and where our power calculations indicated that an increase in enrollment, on the order of 10 to 20 percentage points, was needed in order for us to be able to reliably detect impact. While a moderate to large increase might be more easily achieved when starting with very low enrollment, when enrollment is high, even an effective program may not result in a large percentage-point increase in enrollment.
Quality of implementation
Another contextual factor that may limit the applicability of findings from this study to other settings was the quality of the education program’s implementation and the degree to which the randomization assignments were followed. In addition, SAT had staff changes over the course of the program that affected continuity—in one case, the branch manager and most of the staff were replaced between the initial education and the reminder sessions. In settings where the implementing organization has regular access to clients and where the organization is highly motivated to deliver the education well, the program might have more impact on the clients. SAT loan officers did report some individual success stories—for example, one officer related a story of a group where all members decided to register after the first session. Together with the finding that short-session education may have been effective for a few groups of people who would normally be less likely to enroll, these anecdotes suggest that for the right situation, the education could be very effective.

24
Table 27: Summary data of Enrollment Levels in Social Health Insurance
Country Date of introduction
Cost to members/family Coverage Percent enrolled*
Ghana 2003 Annual average of $18.50 per family per year (Tamale for 2 adults and three children)
Comprehensive: Outpatient, inpatient, and medicine
34% (as of 2010)
India 2008 Ranges from $6 -13 per family per year with
Up to $545 in hospital expenses per family per year
48.6%
Kenya 2005 Ranges from $4.80 to $45 annually (dependent on income)
Hospital services 8.75% (as of 2011)
Philippines 1995 $28.80 per family per year Hospital care/some outpatient services
32.9% (as of 2010)
Rwanda 2005 Ranges from free for poor to $11.50 for rich per family per year
Comprehensive 73% (as of 2010)
Vietnam 1992 No premium. 5%/20% copay for services depending on member group
Comprehensive: Outpatient, inpatient, and medicine
15.4% (as of 2010)
*Percentages represent informal-sector enrollment
To assess the degree to which failure to deliver education to all treatment groups affected our inability to detect a treatment effect, we compared registration and enrollment rates for individuals assigned to the treatment groups who did or did not get treatment and those who received only some (but not all) of the education sessions. We found only minimal differences between the registration and enrollment rates of those assigned to the treatment groups and those who actually received treatment. This suggests that inconsistent delivery of the education sessions did not have much affect on the results.
Active promotion of enrollment from NHIS
Coinciding with the time of the study were a number of NHIS and NHIA promotional efforts aimed at increasing enrollment. Documentation provided by the NHIS office in the Northern Region indicated that during this period, NHIS agents were making bi-quarterly visits to many districts and communities to inform and enroll clients; setting up offices or kiosks in or near the marketplace to increase community enrollment; working with religious organizations and developing radio and TV spots to promote the health microinsurance. In some cases, enrollment during promotions reduced the three-month waiting period. Client interviews confirmed these activities, indicating that the agents came to their community to discuss the insurance and help them fill out the registration forms. Almost half (47 percent) of the focus groups consisting of currently enrolled clients indicated that the officer who registered them made registration possible and easy. As these activities occurred in both our treatment and control villages, this could have played a role in the increase in enrollment rates across all treatment and control groups.
Uncertainly about enrollment policies and premiums
Actual or potential insurance scheme policy changes may have prompted increases in enrollment as well. When insurance was first introduced, schemes were lenient about allowing individuals with expired insurance to renew their insurance at the time they got sick and wanted to use it. The NHIA has recently pressured schemes to require individuals to go through a 90-day waiting period before their insurance would become valid if it had expired. This stricter policy, which many schemes are now enforcing, could have provided an impetus for individuals to keep their insurance current. In addition, during the study period there were widely publicized reports that the government was planning to implement a lifetime premium whereby individuals would make one large payment and be eligible for care for life. This uncertainly may have had an effect on client decision-making, perhaps encouraging clients to enroll prior to this anticipated change.
Sample characteristics
Finally, it should also be noted that the sample may not be representative of Ghana as a whole or of other populations that would benefit from enrolling in health insurance. While the Northern Region has among the highest rates of poverty, lowest rates of educational attainment and largest percentage of the population living in rural areas, clients of MFIs such as SAT are often better off and better educated than others in their community. While SAT does not require its clients to be literate, receiving an SAT loan requires an existing microenterprise, so the poorest individuals who lack means of earning income were necessarily excluded from the sample.

25
Ongoing barriers to enrollment
Given that knowledge about insurance is high, and opinions of insurance almost universally favorable, why is it that so many Ghanaians remain unregistered? One hypothesis that seems consistent with our data and observations as well as with the findings from other studies is that liquidity is a barrier even if total cost is not. People often do not have the cash on hand when they need to make a premium payment, either at the time of enrollment or re-enrollment. Seemingly contradictorily, respondents commonly listed paying the cost of premiums as a reason they were not enrolled, but also cited the cost of insurance as one of the positive aspects of health insurance. Respondents who listed the cost of premiums as a reason not to enroll, however, often distinguished between the premium being too high and not having money to pay it, and were more likely to mention the latter as the cost-related barrier. In addition, household income and consumption did not appear to be correlated with a higher likelihood of being enrolled in insurance. If high premiums were simply the problem, wealthier households would be expected to enroll at a higher rate than poor ones, and this did not seem to be the case.
It is possible that it is the timing of paying the premium, rather than the amount of the premium, that poses a challenge. In Ghana, income is often highly variable due to seasonality of farm income and irregularity in earnings in the informal sector and with distinct “lean” seasons during which household food stocks and resources are low. This may be an important barrier in our study of the Northern Region of Ghana where 71 percent of the economically active population is employed in agriculture and 83 percent in the informal sector, overall. In addition, many people live in places not easily accessible and may have limited opportunities to make payments.
A large number of respondents who are not registered or whose enrollment has expired say they plan to enroll, but simply have not done so yet. In response to questions about ease of registration in the qualitative discussions, a large number of registered and enrolled respondents mentioned NHIS officials coming to their communities. This suggests that convenience of enrollment is important for maintaining current enrollment status, and this is supported by the study findings. For informal-sector workers, time is money and the time it takes to collect necessary documents, travel and then wait in a local NHIS office may be important for many of those reporting that they have not yet gotten around to enrolling. Another explanation is that individuals often express intent to do something that conflicts with their current behavior. In the case of health insurance, the costs of enrolling is borne immediately, whereas the benefits are in the future. Hence even those who agree that health
insurance provides a higher value than paying “cash and carry” may still put off enrolling in the program, even though she knows that it would be utility maximizing at some future date.
5. CONCLUSION
Our evaluation found that while health insurance education appeared to increase knowledge of health insurance among those who received it, we were not able to observe significant differences in health insurance registration and enrollment rates between those in the treatment group and those in the control group. There were a number of factors relating to the broader health insurance environment in Ghana and the implementation of the education that likely minimized the potential impact of the program and the external validity for other settings or for financial literacy more generally.
First, knowledge of the health insurance program was already high in our sample, likely reflecting high knowledge in the general population due to the fact that the program has been in existence for a number of years and has been broadly publicized. Attitudes toward the program were overwhelmingly positive regardless of treatment group, and in fact differed little even between those enrolled and those not enrolled in insurance. This suggests that knowledge was not a significant barrier to enrollment in health insurance.
Second, registration and enrollment rates were already relatively high at the beginning of the program; about one-third of Ghana’s population is actively enrolled. Experiences with health insurance programs in other developing countries suggest that enrollment rates can top out at this rate or lower, and once they do, it is difficult for interventions to raise them much. This was especially problematic because the power of our study required at least a moderate increase in enrollment rate in order to be detectable.
Third, implementation of the program was not perfect. A number of the groups assigned to the treatment groups did not actually receive education; most of these were groups that became inactive over the course of the study. In addition, personnel changes in the implementing partner created some discontinuity in implementation, and since we randomized the provision of education by credit groups rather than by loan officer there may have been confusion and inadvertent provision of education or other enrollment information to control groups. Registration and enrollment rates were similar for those who were assigned to receive treatment and those who actually received it suggesting implementation quality was not a major factor in the impact of the program. Higher

26
quality and more consistent implementation might have resulted in a slightly different outcome.
Our study also attempted to look at the impact of insurance on health and financial outcomes. Although we cannot draw conclusions about causation between insurance enrollment on these outcomes, it appears that enrollment in insurance is associated with lower susceptibility to shocks and the ability to access higher-quality care in the case of a health event. Insurance is correlated with lower likelihood of food insecurity and pulling children out of school. Those with insurance report spending less on health events, and are more likely to go to a doctor as opposed to a less qualified practitioner such as a drug seller when they have a health event. Insurance does not seem to shield households from health expenses completely, as most people who pay for a health event with insurance also dip into savings to cover expenses, and a good number must even sell off their valuables.
Our findings also make clear that there are still a large number of people in Ghana who are negatively affected by the financial consequences of such shocks as health events. A large number of households reported food-insecurity events, pulling children out school for financial reasons and having to sell off valuables to get money. Health events may be costly for household members either because they are not enrolled in insurance, or because insurance does not fully shield them from all the costs of a health event. This underscores a need to find interventions that can increase demand and get more people actively enrolled in insurance and/or offer other solutions to help households manage the cost of health care. Much work remains to be done to identify sustainable programs that can achieve this.
We also examined the ongoing barriers that prevent people from enrolling in health insurance, given that knowledge about the program and its benefits appears to be high. Our findings suggest that although most people consider the cost of the program to be reasonable, it is a challenge to have the cash to pay for the program on hand when payment is due and when it is convenient to go to make the payment.
Many respondents who were currently enrolled in the program mentioned community visits from NHIS marketers as being helpful in improving ease of registration. The liquidity challenge might also be eased through use of MFI credit or savings products that would allow individuals to borrow to pay for premiums or save ahead towards making premium payments for themselves and their households. Installment payment options and timing enrollment campaigns during times when those eligible are likely to have more cash on hand may also mitigate these barriers to paying premiums.
The observation of much greater overall enrollment in the studied population compared to data from the same local area for all informal-sector enrollment over roughly the same time period raises an interesting question: Was there something about this initiative or this population that may have made these MFI clients more likely to register for insurance? This is an area worthy of further exploration by MFIs and the NHIS. The MIX Market reported that there were over 300,000 active MFI borrowers in Ghana in 2011 and the Ghana Microfinance Network reports that their members, which include MFIs, cooperatives, and rural banks are reaching 6.2 million clients with financial services. Given our findings of client challenges related to food security and financial shocks and the relationship between insurance registration and reduced food insecurity and likelihood of taking children out of school, there is a convincing case to be made that health insurance benefits the MFIs by reducing the financial vulnerability of their clients. Opportunities for greater engagement of MFIs to increase uptake that should be explored include training of field agents to promote the insurance; use of MFI client contact points for regular prompts and enrollment opportunities; direct financial incentives to MFIs for enrollment of clients; and encouragement or support of MFI-financing (small loans) to enable clients to pay premiums in several small payments as a way of addressing the problem of having cash on hand to enroll.
27
REFERENCES
Bonan, J.; Dagnelie, O; LeMay-Boucher, P.; Tenikue, M. 2011. Is it all about money? A randomized evaluation of the impact of insurance literacy and marketing treatments on the demand for health microinsurance in Senegal. Research Paper No. 14, Microinsurance Innovation Facility (Geneva, ILO). Dercom, S.; Gunning, J.W.; Zeitlin, A.; Cerron, C.; Lombardini, S. 2011. Health insurance participation: Evidence from Kenya. Research Paper No. 10, Microinsurance Innovation Facility (Geneva, ILO). Ghana Districts. “A Repository of all districts in the republic of Ghana, Northern District: Economic characteristics”. Available at: http://ghanadistricts.com/region/?r=6&sa=113 Magnoni, B.; Chandani, T. 2012. MILK Brief #11: Doing the math: Health microinsruance in Maharashtra,India. MILK Project. Available at: http://www.microinsurancecentre.org/resources/documents/doc_download/872-milk-brief-11-doing-the-math-health-microinsurance-in-maharashtra-india.html National Health Insurance Authority, Annual Report, 2009 (Ghana). National Health Insurance Authority, Annual Report, 2010 (Ghana).

28
APPENDIX: STATISTICAL RESULTS
Table 28. Predictors of adult individual insurance registration
Dependent Variable: Insurance Registration Status (1 if reported registered, 0 otherwise)
Coefficient Standard error P-Value *Significant?
General
Female 0.14 0.01 0.00 *
Age 31 to 45 0.04 0.02 0.02 *
Over 45 0.10 0.02 0.00 *
Highest schooling is primary 0.06 0.02 0.00 *
Highest schooling is middle 0.13 0.02 0.00 *
Highest schooling is high school 0.22 0.02 0.00 *
Highest schooling is vocational 0.24 0.03 0.00 *
Highest schooling is tertiary 0.34 0.03 0.00 *
Highest schooling is koranic 0.13 0.03 0.00 *
Married 0.07 0.02 0.00 *
No Longer Married 0.05 0.03 0.15
Ethnicities
Dagomba -0.04 0.02 0.07
Mamprusi -0.12 0.03 0.00 *
Gonja 0.08 0.03 0.00 *
Wala 0.06 0.05 0.27
Dagaare 0.10 0.05 0.07
Hausa -0.06 0.05 0.30
Vagla 0.18 0.06 0.00 *
Komkomba 0.12 0.04 0.00 *
Religion
Moslem 0.10 0.03 0.04 *
Christian 0.05 0.03 0.33 *
Geographical
Rural -0.06 0.02 0.00 *
Walewale 0.07 0.03 0.01 *
Bole 0.07 0.03 0.01 *
Salaga 0.08 0.03 0.00 *
Constant 0.31 0.05 0.00 *
N = 5512
R Squared = 0.0785
Adjusted R Squared = 0.0743
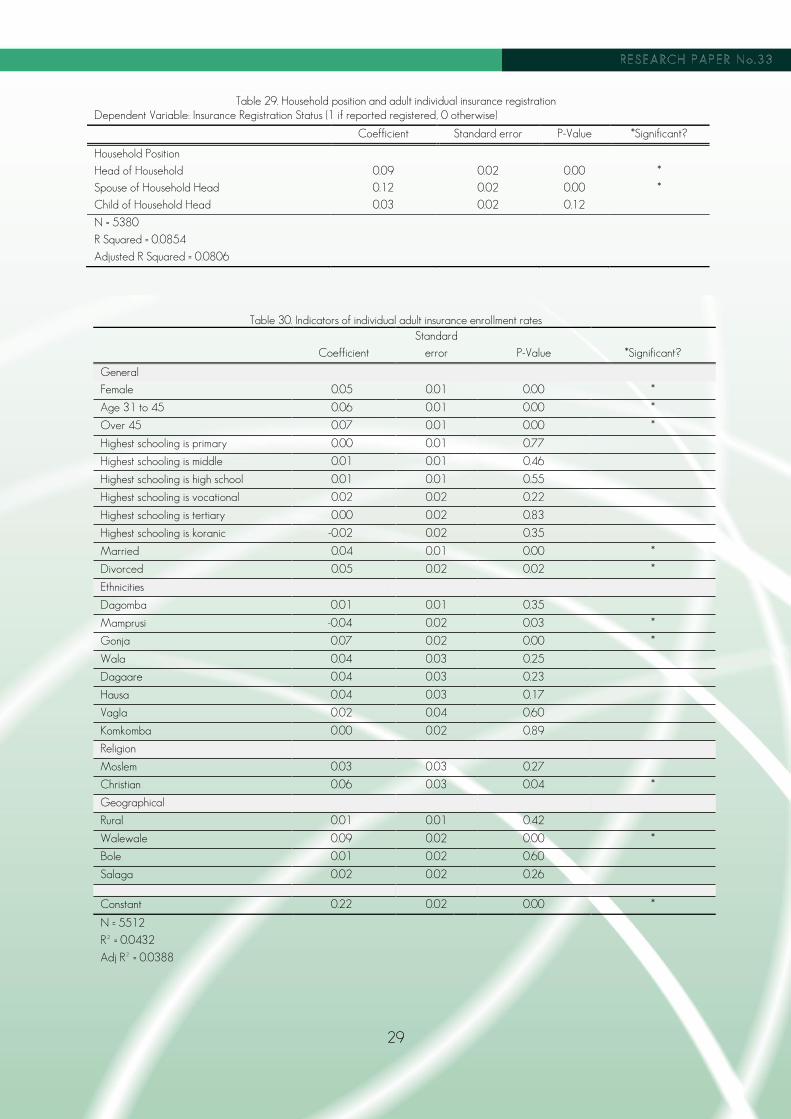
29
Table 29. Household position and adult individual insurance registration
Dependent Variable: Insurance Registration Status (1 if reported registered, 0 otherwise)
Coefficient Standard error P-Value *Significant?
Household Position
Head of Household 0.09 0.02 0.00 *
Spouse of Household Head 0.12 0.02 0.00 *
Child of Household Head 0.03 0.02 0.12
N = 5380
R Squared = 0.0854
Adjusted R Squared = 0.0806
Table 30. Indicators of individual adult insurance enrollment rates
Coefficient
Standard
error P-Value *Significant?
General
Female 0.05 0.01 0.00 *
Age 31 to 45 0.06 0.01 0.00 *
Over 45 0.07 0.01 0.00 *
Highest schooling is primary 0.00 0.01 0.77
Highest schooling is middle 0.01 0.01 0.46
Highest schooling is high school 0.01 0.01 0.55
Highest schooling is vocational 0.02 0.02 0.22
Highest schooling is tertiary 0.00 0.02 0.83
Highest schooling is koranic -0.02 0.02 0.35
Married 0.04 0.01 0.00 *
Divorced 0.05 0.02 0.02 *
Ethnicities
Dagomba 0.01 0.01 0.35
Mamprusi -0.04 0.02 0.03 *
Gonja 0.07 0.02 0.00 *
Wala 0.04 0.03 0.25
Dagaare 0.04 0.03 0.23
Hausa 0.04 0.03 0.17
Vagla 0.02 0.04 0.60
Komkomba 0.00 0.02 0.89
Religion
Moslem 0.03 0.03 0.27
Christian 0.06 0.03 0.04 *
Geographical
Rural 0.01 0.01 0.42
Walewale 0.09 0.02 0.00 *
Bole 0.01 0.02 0.60
Salaga 0.02 0.02 0.26
Constant 0.22 0.02 0.00 *
N = 5512
R² = 0.0432
Adj R² = 0.0388

30
Table 31. Predictors of child individual insurance
Dependent Variable: Insurance Registration Status (1 if reported registered, 0 otherwise)
All Children School Age Children
Coefficient
Standard
error
P-Value
*Significant? Coefficient
Standard
error
P-Value
*Significant?
General
Female -0.01 (0.01) 0.61 -0.01 (0.02) 0.63
Age 7 to 17 0.06 (0.01) 0.00*
Ethnicities
Dagomba -0.14 (0.03) 0.00* -0.11 (0.03) 0.00*
Mamprusi -0.15 (0.03) 0.00* -0.14 (0.04) 0.00*
Gonja 0.06 (0.03) 0.04* 0.05 (0.04) 0.15
Wala -0.05 (0.06) 0.44 -0.02 (0.07) 0.81
Dagaare 0.02 (0.05) 0.69 -0.03 (0.07) 0.70
Hausa 0.03 (0.05) 0.51 0.05 (0.06) 0.44
Vagla 0.15 (0.07) 0.03* 0.14 (0.10) 0.16
Komkomba 0.08 (0.03) 0.01* 0.02 (0.04) 0.70
Religion
Moslem 0.02 (0.06) 0.69 -0.04 (0.08) 0.58
Christian -0.11 (0.06) 0.07 -0.14 (0.08) 0.07
Geographical
Rural -0.15 (0.02) 0.00* -0.13 (0.02) 0.00*
Walewale 0.02 (0.03) 0.56 0.00 (0.04) 0.93
Bole 0.12 (0.03) 0.00* 0.07 (0.04) 0.05
Salaga 0.15 (0.03) 0.00* 0.15 (0.04) 0.00*
School
Enrolled
0.28 (0.03) 0.00*
constant 0.74 (0.06) 0.00* 0.60 (0.09) 0.00*
N = 4485
R Squared = 0.0811
Adjusted R Squared = 0.0779
N = 2555
R Squared = 0.0847
Adjusted R Squared = 0.0790
Table 32. Household position and child individual insurance
Dependent Variable: Insurance registration status (1 if reported registered, 0 otherwise)
Coefficient Standard error
P-Value *Significant?
Household Position
Head of Household -0.21 0.45
0.65
Spouse of Household Head 0.30 0.44
0.49
Child of Household Head 0.05 0.02
0.00 *
N = 4406
R Squared = 0.0868
Adjusted R Squared = 0.0828
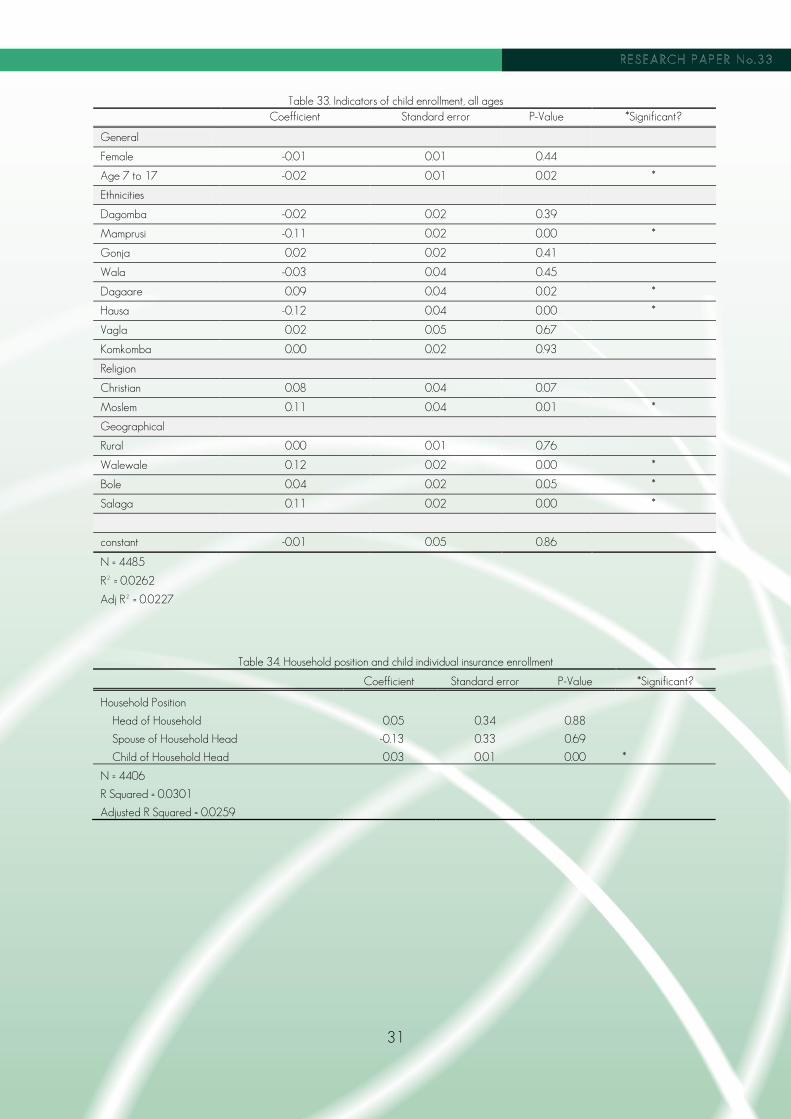
31
Table 33. Indicators of child enrollment, all ages
Coefficient Standard error P-Value *Significant?
General
Female -0.01 0.01 0.44
Age 7 to 17 -0.02 0.01 0.02 *
Ethnicities
Dagomba -0.02 0.02 0.39
Mamprusi -0.11 0.02 0.00 *
Gonja 0.02 0.02 0.41
Wala -0.03 0.04 0.45
Dagaare 0.09 0.04 0.02 *
Hausa -0.12 0.04 0.00 *
Vagla 0.02 0.05 0.67
Komkomba 0.00 0.02 0.93
Religion
Christian 0.08 0.04 0.07
Moslem 0.11 0.04 0.01 *
Geographical
Rural 0.00 0.01 0.76
Walewale 0.12 0.02 0.00 *
Bole 0.04 0.02 0.05 *
Salaga 0.11 0.02 0.00 *
constant -0.01 0.05 0.86
N = 4485
R² = 0.0262
Adj R² = 0.0227
Table 34. Household position and child individual insurance enrollment
Coefficient Standard error P-Value *Significant?
Household Position
Head of Household 0.05 0.34 0.88
Spouse of Household Head -0.13 0.33 0.69
Child of Household Head 0.03 0.01 0.00 *
N = 4406
R Squared = 0.0301
Adjusted R Squared = 0.0259

32
Table 35. Income and household registration rates, baseline survey
Regression Coefficient Standard error P-Value N R-Squared
(1) Share of household that is registered on sales revenue from SAT business (in 1000 GHC)
0.0039 0.0032 0.22 1505 0.0010
(2) Share of household that is registered on income from farming (in 1000 GHC)
0.0377 0.0459 0.41 1505 0.0004
(3) Share of household that is registered on income from other sources (in 1000 GHC)
0.0004 0.0006 0.47 1505 0.0004
(4) Share of household that is registered on annual household consumption per household member (in 1000 GHC)
0.8 0.2 0.00* 1505 0.0099
Table 36. Income and household enrollment rates, baseline survey
Regression Coefficient Standard error P-Value N R-Squared
(1) Share of household that is enrolled on sales revenue from SAT business (in 1000 GHC)
0.0004 0.0019 0.85 1505 0.0000
(2) Share of household that is enrolled on income from farming (in 1000 GHC)
0.0013 0.0278 0.41 1505 0.0000
(3) Share of household that is enrolled on income from other sources (in 1000 GHC)
-0.0002 0.0004 0.50 1505 0.0003
(4) Share of household that is enrolled on annual household consumption per household member (in 1000 GHC)
0.2 0.1 0.12 1505 0.0016
Table 37. Endline registration and financial attributes
Dependent Variable: Insurance registration status (1 if reported enrolled, 0 otherwise)
Coefficient Standard
error P-Value *Significant?
Daily Food Consumption per Household Member 0.0000 0.0002
0.91
Weekly Income per Household Member 0.0003 0.0001
0.08
Phones per Household Member -0.0008 0.0038
0.83
N = 1511
R Squared = 0.0404
Adjusted R Squared = 0.0347 **Included controls for gender, household position, rural v. urban, and region
Table 38. Endline enrollment and financial attributes
Dependent Variable: Insurance Enrollment Status (1 if reported enrolled, 0 otherwise)
Coefficient Standard
error P-Value *Significant?
Daily Food Consumption per Household Member -0.0002 0.0001
0.09
Weekly Income per Household Member 0.0001 0.0001
0.49
Phones per Household Member 0.0009 0.0028
0.74
N = 1511
R Squared = 0.5778
Adjusted R Squared = 0.5747
**Included controls for gender, household position, rural v. urban, region, registration status, and ability to show card
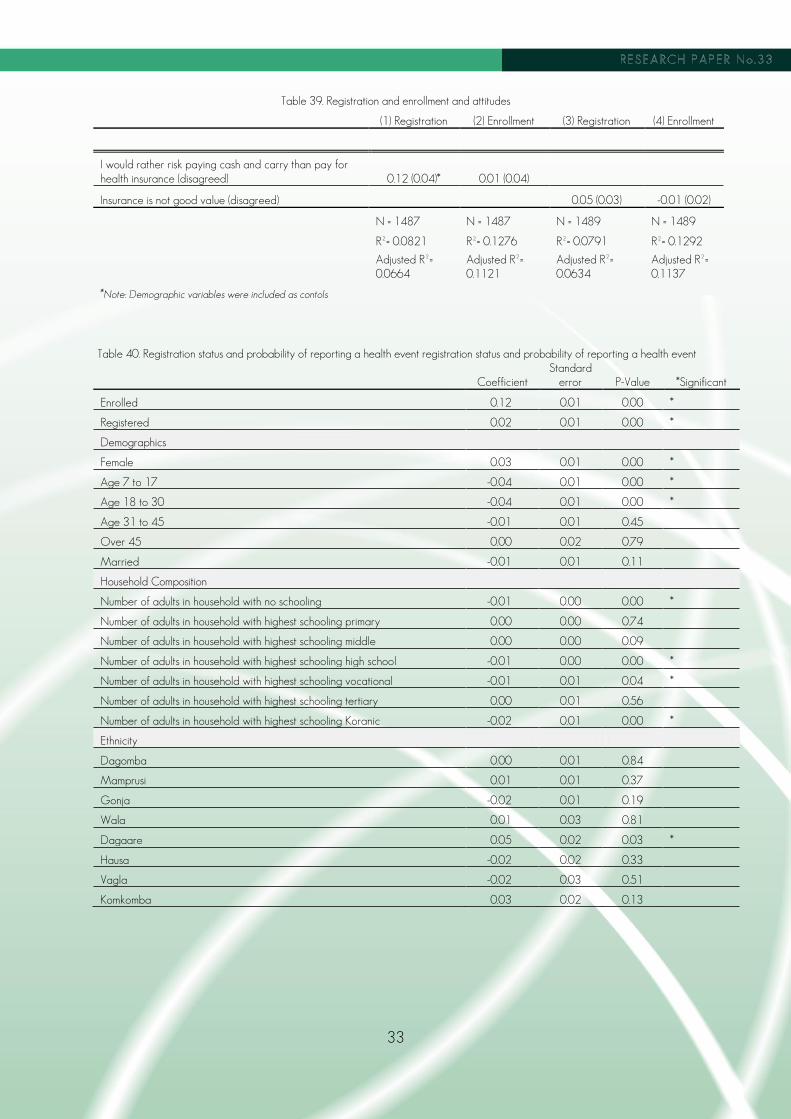
33
Table 39. Registration and enrollment and attitudes
(1) Registration (2) Enrollment (3) Registration (4) Enrollment
I would rather risk paying cash and carry than pay for health insurance (disagreed) 0.12 (0.04)* 0.01 (0.04)
Insurance is not good value (disagreed) 0.05 (0.03) -0.01 (0.02)
N = 1487 N = 1487 N = 1489 N = 1489
R²= 0.0821 R²= 0.1276 R²= 0.0791 R²= 0.1292
Adjusted R²= 0.0664
Adjusted R²= 0.1121
Adjusted R²= 0.0634
Adjusted R²= 0.1137
*Note: Demographic variables were included as contols
Table 40. Registration status and probability of reporting a health event registration status and probability of reporting a health event
Coefficient Standard
error P-Value *Significant
Enrolled 0.12 0.01 0.00 *
Registered 0.02 0.01 0.00 *
Demographics
Female 0.03 0.01 0.00 *
Age 7 to 17 -0.04 0.01 0.00 *
Age 18 to 30 -0.04 0.01 0.00 *
Age 31 to 45 -0.01 0.01 0.45
Over 45 0.00 0.02 0.79
Married -0.01 0.01 0.11
Household Composition
Number of adults in household with no schooling -0.01 0.00 0.00 *
Number of adults in household with highest schooling primary 0.00 0.00 0.74
Number of adults in household with highest schooling middle 0.00 0.00 0.09
Number of adults in household with highest schooling high school -0.01 0.00 0.00 *
Number of adults in household with highest schooling vocational -0.01 0.01 0.04 *
Number of adults in household with highest schooling tertiary 0.00 0.01 0.56
Number of adults in household with highest schooling Koranic -0.02 0.01 0.00 *
Ethnicity
Dagomba 0.00 0.01 0.84
Mamprusi 0.01 0.01 0.37
Gonja -0.02 0.01 0.19
Wala 0.01 0.03 0.81
Dagaare 0.05 0.02 0.03 *
Hausa -0.02 0.02 0.33
Vagla -0.02 0.03 0.51
Komkomba 0.03 0.02 0.13
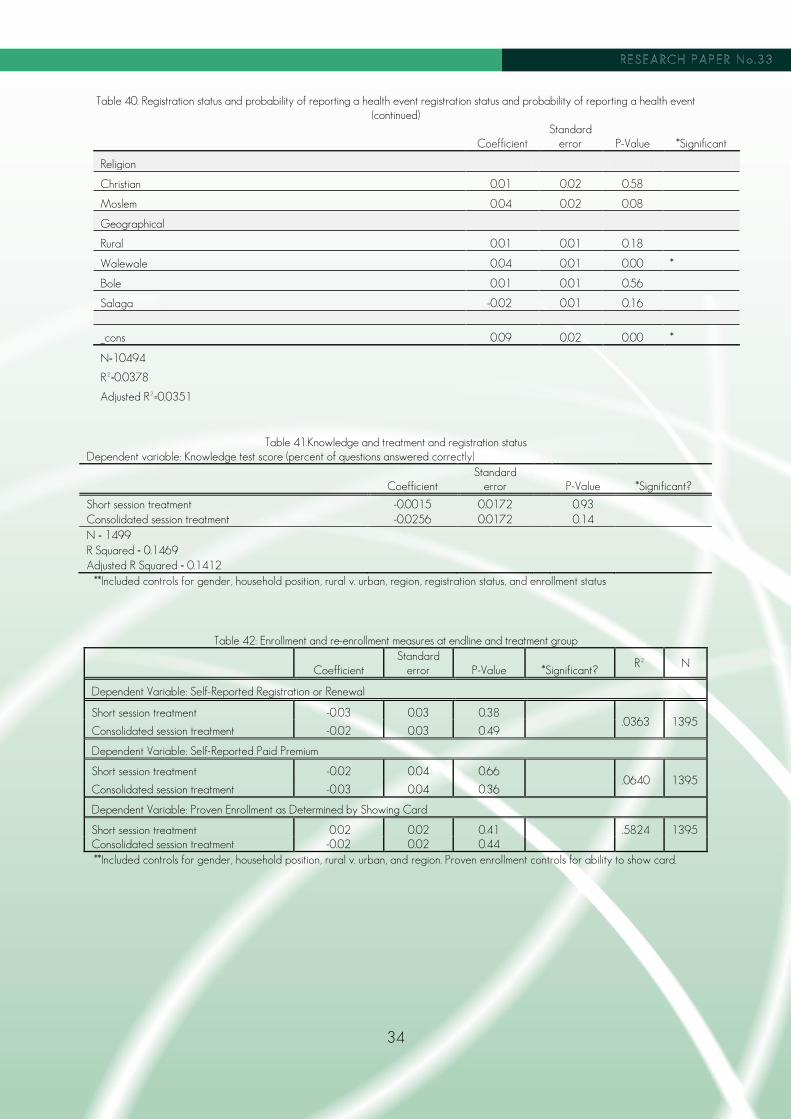
34
Table 40. Registration status and probability of reporting a health event registration status and probability of reporting a health event
(continued)
Coefficient Standard
error P-Value *Significant
Religion
Christian 0.01 0.02 0.58
Moslem 0.04 0.02 0.08
Geographical
Rural 0.01 0.01 0.18
Walewale 0.04 0.01 0.00 *
Bole 0.01 0.01 0.56
Salaga -0.02 0.01 0.16
_cons 0.09 0.02 0.00 *
N=10494 R²=0.0378 Adjusted R²=0.0351
Table 41.Knowledge and treatment and registration status Dependent variable: Knowledge test score (percent of questions answered correctly)
Coefficient Standard
error P-Value *Significant?
Short session treatment -0.0015 0.0172
0.93 Consolidated session treatment -0.0256 0.0172
0.14
N = 1499 R Squared = 0.1469 Adjusted R Squared = 0.1412
**Included controls for gender, household position, rural v. urban, region, registration status, and enrollment status
Table 42: Enrollment and re-enrollment measures at endline and treatment group
Coefficient Standard
error P-Value *Significant? R² N
Dependent Variable: Self-Reported Registration or Renewal
Short session treatment -0.03 0.03 0.38 .0363 1395
Consolidated session treatment -0.02 0.03 0.49
Dependent Variable: Self-Reported Paid Premium
Short session treatment -0.02 0.04 0.66 .0640 1395
Consolidated session treatment -0.03 0.04 0.36
Dependent Variable: Proven Enrollment as Determined by Showing Card
Short session treatment 0.02 0.02 0.41 .5824 1395 Consolidated session treatment -0.02 0.02 0.44 **Included controls for gender, household position, rural v. urban, and region. Proven enrollment controls for ability to show card.

35
Table 43: Registration and enrollment by treatment and location
Coefficient Standard error P-Value *Significant?
Dependent variable: Registration status (1 if registered, 0 if not) N=1395 R²=0.0468
Short session treatment -0.04 0.06 0.51 Consolidated session treatment 0.05 0.05 0.33 Bole*short 0.02 0.07 0.83
Salaga*short 0.04 0.09 0.63 Walewale*short 0.00 0.08 0.98 Bole*consolidated -0.08 0.07 0.23 Salaga* consolidated -0.01 0.08 0.86 Walewale* consolidated -0.01 0.07 0.88 Dependent variable: Proven enrollment (1 if proven enrolled, 0 if not) N=1395 R²=5830
Short session treatment 0.01 0.02 0.54 Consolidated session treatment -0.01 0.02 0.65 Bole*short -0.01 0.05 0.80
Salaga*short 0.05 0.08 0.54 Walewale*short -0.01 0.05 0.80 Bole*consolidated -0.03 0.04 0.47 Salaga* consolidated 0.02 0.07 0.75 Walewale* consolidated -0.02 0.05 0.71
*Note: models control for gender, household position, rural v. urban. Proven enrollment model also controls for ability to show card.

36
Table 44 Registration and enrollment and interactions between treatment and demographics
Coefficient Standard error P-Value *Significant?
Dependent variable: Registration status (1 if registered, 0 if not)
N=1277 R²=0.2636
Short session treatment -0.03 0.10 0.78
Consolidated session treatment 0.00 0.09 0.98
Female 0.01 0.04 0.79
Household head 0.06 0.04 0.12
Rural -0.14 0.04 0.00
Registered at baseline 0.39 0.04 0.00
Enrolled at baseline 0.03 0.02 0.19
Female*short -0.02 0.08 0.83
Household head*short -0.10 0.06 0.11
Rural*short 0.08 0.05 0.20
No School*short 0.01 0.04 0.84
Registered at baseline*short 0.00 0.08 0.98
Enrolled at baseline*short 0.02 0.04 0.51
Female* consolidated 0.04 0.07 0.52
Household Head* consolidated -0.02 0.06 0.81
Rural*consolidated 0.06 0.04 0.16
No School*consolidated -0.06 0.03 0.05
Registered at baseline*consolidated -0.03 0.07 0.65
Enrolled at baseline*consolidated 0.00 0.04 0.98
Dependent variable: Proven enrollment (1 if proven enrolled, 0 if not)
N=1277 R²=5877
Short session treatment 0.15 0.05 0.00 *
Consolidated session treatment 0.03 0.06 0.56
Female 0.07 0.03 0.02
Household head 0.07 0.03 0.03
Rural -0.04 0.03 0.23
Registered at baseline -0.04 0.03 0.16
Enrolled at baseline -0.08 0.04 0.06
Female*short -0.08 0.04 0.07
Household head*short -0.11 0.05 0.01 *
Rural*short -0.00 0.04 0.99
No School*short -0.03 0.04 0.53
Registered at baseline*short -0.04 0.04 0.32
Enrolled at baseline*short 0.09 0.06 0.11
Female* consolidated -0.04 0.05 0.34
Household Head* consolidated -0.04 0.05 0.49
Rural*consolidated 0.01 0.04 0.87
No School*consolidated -0.03 0.05 0.52
Registered at baseline*consolidated -0.01 0.04 0.80
Enrolled at baseline*consolidated 0.08 0.06 0.18
*Note: models control for gender, household position, rural v. urban. Proven enrollment model also controls for ability to show card.
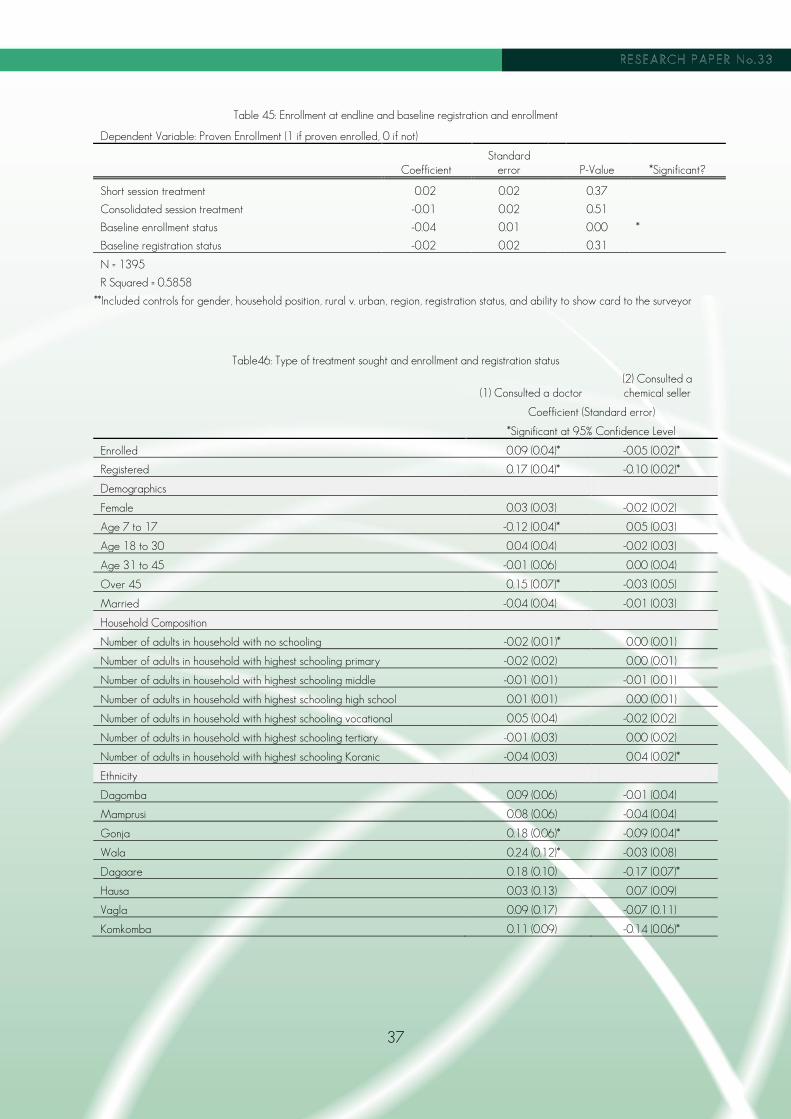
37
Table 45: Enrollment at endline and baseline registration and enrollment
Dependent Variable: Proven Enrollment (1 if proven enrolled, 0 if not)
Coefficient Standard
error
P-Value *Significant?
Short session treatment 0.02 0.02
0.37
Consolidated session treatment -0.01 0.02
0.51
Baseline enrollment status -0.04 0.01 0.00 *
Baseline registration status -0.02 0.02 0.31
N = 1395
R Squared = 0.5858
**Included controls for gender, household position, rural v. urban, region, registration status, and ability to show card to the surveyor
Table46: Type of treatment sought and enrollment and registration status
(1) Consulted a doctor (2) Consulted a chemical seller
Coefficient (Standard error)
*Significant at 95% Confidence Level
Enrolled 0.09 (0.04)* -0.05 (0.02)*
Registered 0.17 (0.04)* -0.10 (0.02)*
Demographics
Female 0.03 (0.03) -0.02 (0.02)
Age 7 to 17 -0.12 (0.04)* 0.05 (0.03)
Age 18 to 30 0.04 (0.04) -0.02 (0.03)
Age 31 to 45 -0.01 (0.06) 0.00 (0.04)
Over 45 0.15 (0.07)* -0.03 (0.05)
Married -0.04 (0.04) -0.01 (0.03)
Household Composition
Number of adults in household with no schooling -0.02 (0.01)* 0.00 (0.01)
Number of adults in household with highest schooling primary -0.02 (0.02) 0.00 (0.01)
Number of adults in household with highest schooling middle -0.01 (0.01) -0.01 (0.01)
Number of adults in household with highest schooling high school 0.01 (0.01) 0.00 (0.01)
Number of adults in household with highest schooling vocational 0.05 (0.04) -0.02 (0.02)
Number of adults in household with highest schooling tertiary -0.01 (0.03) 0.00 (0.02)
Number of adults in household with highest schooling Koranic -0.04 (0.03) 0.04 (0.02)*
Ethnicity
Dagomba 0.09 (0.06) -0.01 (0.04)
Mamprusi 0.08 (0.06) -0.04 (0.04)
Gonja 0.18 (0.06)* -0.09 (0.04)*
Wala 0.24 (0.12)* -0.03 (0.08)
Dagaare 0.18 (0.10) -0.17 (0.07)*
Hausa 0.03 (0.13) 0.07 (0.09)
Vagla 0.09 (0.17) -0.07 (0.11)
Komkomba 0.11 (0.09) -0.14 (0.06)*

38
Table46: Type of treatment sought and enrollment and registration status (continued)
(1) Consulted a doctor (2) Consulted a chemical seller
Religion
Christian -0.03 (0.12) 0.09 (0.08)
Moslem -0.01 (0.12) 0.07 (0.08)
Geographic
Rural 0.02 (0.04) 0.01 (0.03)
Walewale -0.05 (0.06) 0.05 (0.04)
Bole -0.16 (0.06)* 0.08 (0.04)
Salaga -0.28 (0.06)* 0.03 (0.04)
Constant 0.58 (0.13)* 0.13 (0.09)
N=1029 N=1029
R²=0.1264 R²=0.0633
Adjusted R²=-0.1010 Adjusted R²=0.0361
Table478: Household health expenses and registration and enrollment
Dependent Variable: Reported Cost of Health Event Expenses
Coefficient Standard error
P-Value *Significant?
Registered -2.58 6.01 0.66
Confirmed Enrolled 3.78 5.45 0.49
N = 1486
R Squared = 0.0149
Adj. R Squared = 0.0103
**Included controls for gender, household position, and region
Table 48: Shocks and insurance registration and enrollment
Dependent Variable: Did household pull a child from school? (1 if yes, 0 if no)
Coefficient Standard Error
P-Value *Significant?
Dependent Variable: Did household pull a child from school? (1 if yes, 0 if no)
Registered -0.07 0.02 0.00 *
Confirmed Enrolled 0.02 0.02 0.30
N = 1511
R Squared = 0.0235
Adj. R Squared = 0.0164
Dependent Variable: Did household sell assets? (1 if yes, 0 if no)
Registered -0.05 0.03 0.08
Confirmed Enrolled 0.01 0.03 0.35
N = 1511
R Squared = 0.0645
Adj. R Squared = 0.0576
**Included controls for gender, household position, rural v. urban, region, food consumption per capita, reported income per capita, and number of phones per capita.

39
Table 49: Food insecurity index and insurance registration and enrollment
Dependent variable: Food insecurity index, value from 0 to 12, where higher values indicate more frequent incidences of food insecurity
Coefficient Standard error
P-Value *Significant?
Registered -0.35 0.15 0.02 *
Confirmed Enrolled -0.27 0.13 0.04 *
N = 1508
R Squared = 0.0576
Adj. R Squared = 0.0507

40
Housed at the International Labour Organization’s Social Finance Programme, the Microinsurance Innovation Facility seeks to increase the availability of quality insurance for the developing world’s low income families to help them guard against risk and overcome poverty. The Facility was launched in 2008 with generous support from the Bill & Melinda Gates Foundation to learn and promote how to extend better insurance to the working poor. Additional funding has gratefully been received from several donors, including the Z Zurich Foundation and AusAID.