the impact of ict growth on households and …
TRANSCRIPT

Ondřej Šimpach, Jitka Langhamrová
63
THE IMPACT OF ICT GROWTH ON HOUSEHOLDS AND MUNICIPALITIES IN THE CZECH NUTS-3 REGIONS:
THE APPLICATION OF CLUSTER ANALYSIS
Ondřej Šimpach, Jitka Langhamrová Department of Statistics and Probability, Department of Demography
Faculty of Informatics and Statistics University of Economics in Prague
[email protected], [email protected]
Keywords
ICT growth, ICT services, Households and municipalities, NUTS-3 regions, Cluster analysis
Abstract
Czech economic situation has improved. We invest in human health, in education and human capital, in construction and infrastructure and as well in the development of information and communication technologies (ICT). Unfortunately, the ICT development is not equal in all regions of the Czech Republic. There are the regions in which the level of ICT services was already at a high level in the past, therefore the development was stagnating in recent years. On the other hand, there are also regions with low level of ICT services, where we can expect its increase. In this paper, we evaluate the development of selected ICT indicators in NUTS-3 regions of the Czech Republic. We utilize the cluster analysis and apply it on the latest available data from the Czech Statistical Office. We explain the reason of the identified changes and search for the explanation in cases when they did not occur. The findings are confronted with the economic statistics of the analysed regions. We particularly point out on the mutual relations among them.
1. Introduction
The quality of life of the population increases in almost all NUTS-3 regions of the Czech Republic, but the differences between them still remain (Fiala, Langhamrová, 2012). The Czech Republic is gradually starting to become an advanced economy (Maryška et al., 2012 or Basl, Doucek, 2013), which is according to the demographic statistics presented by increasing life expectancy, declining mortality rates, increasing average age and also by the minimum rate of infant mortality (Šimpach, Pechrová, 2013). With the respect to some evaluation criteria which uses Eurostat, we examine the situation in the NUTS-3 regions of the Czech Republic in the year 2012 (latest available data). We can show the statistics for individual regions in scatter-plots depending on GDP per capita in the regions. Capital City of Prague is always classified as the outlier, (because its GDP per capita is more than double than in other regions (Fiala, Langhamrová 2012)). We provide an evidence in the following graphs – see Fig. 1. It is apparent that some regions are in these statistics more than once at the end of the evaluation scale. However, it is not the rule with respect to the development and advancement in ICT that also affect the quality of human life (Maryška, Doucek, Novotný, 2012). It is evident that there will be regions in which the ICT services develop differently than in other

The Impact of ICT Growth on Households and Municipalities in the Czech NUTS-3 Regions: the Application of Cluster Analysis
64
regions. We focus our attention on the selected statistics of ICT services, which are measured and published by the Czech Statistical Office (CZSO, section Statistics, Information Technologies).
Figure 1: Quality of life in the Czech NUTS-3 regions in 2012. Data source: CZSO, authors’ illustration
These services will cover the households and municipalities. Czech households are the most affected by ICT services such as “access to the PC” and “access to the internet”. In the Czech municipalities, which territorially belong to the particular NUTS-3 regions, there are various organizations, companies and authorities. Among the ICT services that the most important for the Czech municipalities (Kuncová, Doucek, 2013) belong the “Access to the internet in organizations” and the “Access to the electronic registry”. Especially the latter statistics has currently the great importance, because the electronic registry speeds up the administrative processes, saves the time and money and thus increase the efficiency and comfort of the people’s lives. In addition, there is the bridge between the households connected to the internet and the internet access in the organizations. In the context of regional comparisons there are also other two statistics important for municipalities. It is the availability of “high-speed internet in municipalities” and the managed “web pages of municipalities”. High speed internet connection becomes increasingly important for the population because the demand for quality internet services, web design and of course the quantity of transferred data increases (Basl, Pour, Šimková, 2008). Web pages of municipalities inform the population about the latest news and especially saving the time and money, because many administrative issues can be solved on-line and without waiting in the queue at the office. It is evident that the development of ICT services in the Czech Republic must have the economic impact both on the household and the municipalities (Maryška, Doucek, Novotný, 2012), (which belong to the relevant NUTS-3 regions).
The aim of this paper is to explore the development of these statistics of ICT services. We base our analysis on the latest available data, and on the similarity of the development of chosen statistics to cluster the NUTS-3 regions. We utilize two clustering techniques, one belonging to the most commonly used – Ward’s method (Ward, 1963), and the other belonging to the simplest group – the nearest neighbour (Gordon, 1999). From the obtained outputs there we may drown the conclusion about which regions developed similarly and which converged only recently. The outputs show that PHA (see the shortcuts of the CZSO) is not the outlier observations any more. Especially the regions, which are based on the evaluation of socio-economic statistics classified as developing had its potential for dynamic development of ICT services in the past. Regions, which were according to the socio-economic statistics classified as developed, have not such potential to grow in ICT services and

Ondřej Šimpach, Jitka Langhamrová
65
development. It is very probable that the future development of ICT services in former undeveloped regions will cause their more dynamic growth at present (Doucek, Novotný, Voříšek, 2009).
2. Materials and Methods
For the purpose of our analysis we use the data about the selected ICT services in the Czech NUTS-3 regions from CZSO database. Some data are available from 2005 to 2011 only, another from 2005 to 2012 (latest available). However, this issue does not matter, because the development of the individual regions is analysed partially, so the absence of the last observation do not have the effect of particular results (see Šimpach, 2013 for an example). For the Czech households we use the statistics about the percentage of households “accessed to the PC” by NUTS-3 regions (observations from 2005 to 2012) and the percentage of households “accessed to the internet” by NUTS-3 regions (observations from 2005 to 2012 as well). For the analysis of ICT development in the Czech municipalities we use the statistics about the percentage of “organizations with the internet access” and the percentage of “organizations with access to the electronic registry” by NUTS-3 regions (all have the observations from 2005 to 2011). In addition we consider the statistics about the percentage of municipalities “connected to the high-speed internet” and the percentage of municipalities “with managed web pages” by NUTS-3 regions (the observations from 2005 to 2011 as well). Using the software IBM SPSS Statistics 20 we apply two clustering methods using square Euclidean metrics (see e.g. Gordon, 1999)
( )∑ −=−i
ii baba 22
2, (1)
where a and b are any of two distances. This metric has a universal application in chosen clustering methods. The first method is Ward’s (the most frequently used). As noted by Mirkin (1996), this method is an agglomerative clustering method in which the dissimilarity between two clusters A and B is measured by the amount by which merging the two clusters into a single larger cluster would increase the average squared distance of a point to its cluster centroid:
( ) ( ) ( ) ( )∑∑∑
∈∈∈∈
−−+
=ByxAyxByAx B
yxd
A
yxd
BA
yxdBAd
,
2
,
2
,
2 ,,,, , (2)
where d(A,B) denotes the distance between the two clusters A and B. The second used clustering method is the nearest neighbour. It was selected because this method belongs to the simple algorithms (see e.g. Gordon, 1999) and its results are easy to interpret. As suggested by Murtagh (1983, p. 354), the nearest neighbour algorithm repeatedly follows a chain of clusters A → B → C → ..., where each cluster is the nearest neighbour of the previous one, until reaching a pair of clusters that are mutual the nearest neighbours. According to Bruynooghe (1977), a distance function d on clusters is defined to be reducible if, for every three clusters A, B and C in the greedy hierarchical clustering such that A and B are mutual the nearest neighbours:
( ) ( ) ( )( )CBdCAdCBAd ,,,min, ≥∪ . (3)
All computed clusters are discussed and commented and on the basis of similarities of NUTS-3 regions there are made the conclusions regarding to their convergence in the field of ICT services.

The Impact of ICT Growth on Households and Municipalities in the Czech NUTS-3 Regions: the Application of Cluster Analysis
66
3. Results and Discussion
Using the above mentioned methods there were calculated the clusters of NUTS-3 regions of the Czech Republic according to the development of ICT statistics in households. On the Fig. 2 we can see those clusters for the situation of Czech households with access to the PC and on the Fig. 3 is shown the situation of households with access to the internet. The results of both Ward’s method and the nearest neighbour are in the case of households’ access to the PC almost identical. The most of the regions except for LIB and VYS developed similarly during the analysed period. LIB and VYS recorded relatively high increase in the computer facilities during the last 7 years, (because these are the regions with medium age-old population structure, which had the potential for buying a PC). Therefore, these regions according to the both methods were farthest from each other. The other regions were equipped by PCs more and thus their relative increases were weaker.
Figure 2: Households’ access to PCs by NUTS-3 regions, Ward’s (top) and nearest neighbour method (bottom).
Data source: CZSO, section Statistics, Information technologies. Authors’ calculation
In the case of households connected to the internet is PHA region relatively outlier observations during the analysed years, because the facilities in PHA grew the fastest in compare to all considered regions, (it is currently nearly 70 %). According to the nearest neighbour method there were not identified the significant differences among the other regions. Ward’s method (which is more sensitive in this case), divided the remaining regions into two similar clusters (JIC, VYS, MSL, LIB, PAR and STC) and (JIM, KVA, UST, OLM, PLZ, KHR and ZLN). Regions in the second cluster grew a little faster in the internet facilities. It may be caused due to the fact that these regions have relatively higher level of long term unemployment and during the period of economic crisis (mainly in 2008–2010) the statistics of internet facilities stagnated. We could observe the significant increase only in the last two years.
On the Fig. 4 there is shown the similarity of regions based on the development of access to the internet in organizations. PHA is again the outlying observation, but in this case it is a negative remote. There are huge number of organizations in PHA region, larger and smaller, but especially the smaller organization lack the access to the internet. The percentage of organizations with access to the internet developed from 51.7 % to 56.9 %. Regions KVA and MSL, which were clustered

Ondřej Šimpach, Jitka Langhamrová
67
together by both Ward’s and the nearest neighbour method, recorded the evolution from 57.4 % to 71.7 % and from 59.5 % to 72.4 % respectively, which is a huge difference. It is due to the fact that there exist more organizations in these regions, where the access to the internet is a standard.
Figure 3: Households’ access to the internet by NUTS-3 regions, Ward’s (top) and nearest neighbour method
(bottom). Data source: CZSO, section Statistics, Information technologies. Authors’ calculation
Figure 4: Access to the internet in organizations by NUTS-3 regions, Ward’s (top) and nearest neighbour
method (bottom). Data source: CZSO, section Statistics, Information technologies. Authors’ calculation
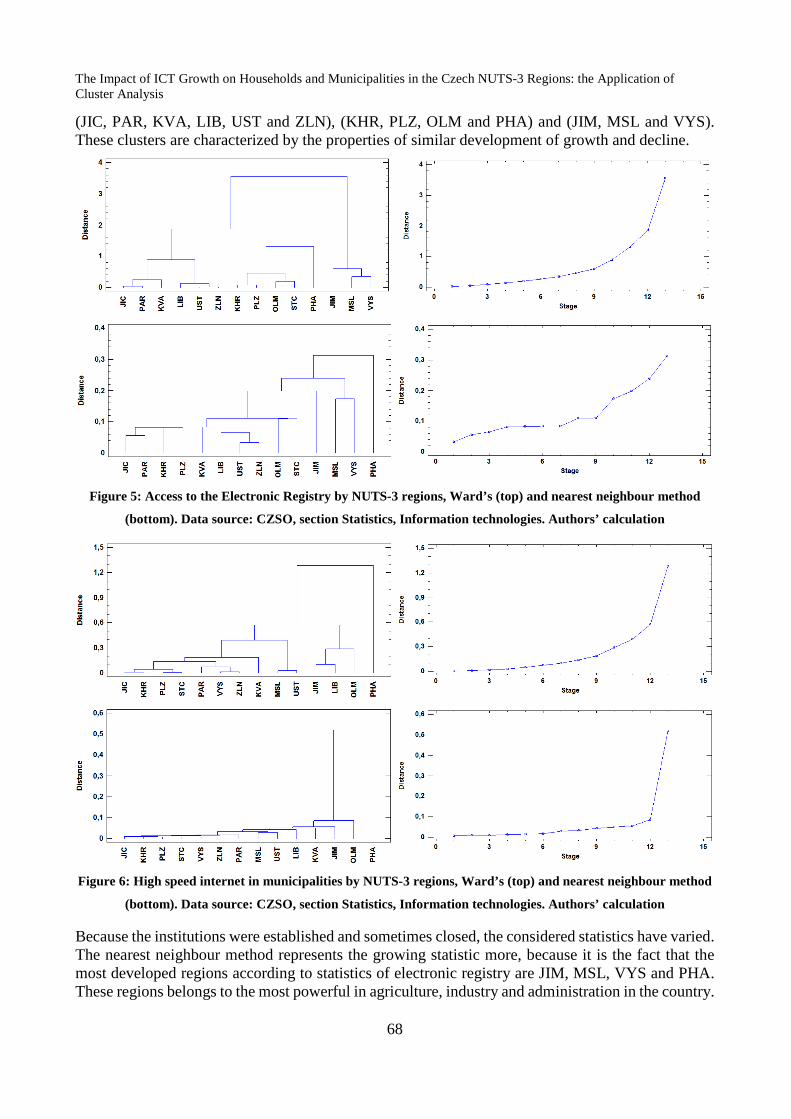
Significant technological progress in the world of ICT are the electronic registry (see Fig. 5). Institutions in municipalities that offer the possibility of loading the documents through the electronic registry save the time and money for many people. Ward’s method divided the regions into 3 clusters
The Impact of ICT Growth on Households and Municipalities in the Czech NUTS-3 Regions: the Application of Cluster Analysis
68
(JIC, PAR, KVA, LIB, UST and ZLN), (KHR, PLZ, OLM and PHA) and (JIM, MSL and VYS). These clusters are characterized by the properties of similar development of growth and decline.
Figure 5: Access to the Electronic Registry by NUTS-3 regions, Ward’s (top) and nearest neighbour method
(bottom). Data source: CZSO, section Statistics, Information technologies. Authors’ calculation
Figure 6: High speed internet in municipalities by NUTS-3 regions, Ward’s (top) and nearest neighbour method
(bottom). Data source: CZSO, section Statistics, Information technologies. Authors’ calculation
Because the institutions were established and sometimes closed, the considered statistics have varied. The nearest neighbour method represents the growing statistic more, because it is the fact that the most developed regions according to statistics of electronic registry are JIM, MSL, VYS and PHA. These regions belongs to the most powerful in agriculture, industry and administration in the country.

Ondřej Šimpach, Jitka Langhamrová
69
The connection of municipalities to the high speed internet grew during the analysed period practically in all regions, (we can see the clusters of similarities of this development in Fig. 6). PHA region is the outlying observation, because there was the most significant increase noted. The current situation is on 94.8% level of high speed internet connections of the PHA’s population. The other regions are in the range from 86.1 % to 93.4 %. Ward’s method is more sensitive to changing the phases of growth and decline (e.g. the region MSL and UST), but it provides almost comparable results with the nearest neighbour method.
Figure 7: Web pages of municipalities by NUTS-3 regions, Ward’s (top) and nearest neighbour method
(bottom). Data source: CZSO, section Statistics, Information technologies. Authors’ calculation
In the case of the web pages development we conclude that the PHA region almost did not change. The current level of managing web pages limits to 100 % (in 2005 the proportion was 93.1 %). The other regions have developed quite significantly. The greatest potential for the development had group of the regions (JIM, UST, OLM, KHR, LIB and STC – see Fig. 7). These are the regions included into the cluster both by Ward’s and the nearest neighbour method. Their facilities increased from 71.3 % (in 2005) to almost 99.2 % (in 2011).
4. Conclusion
The aim of this paper was to evaluate the development of households and municipalities in the Czech NUTS-3 regions on the basis of selected statistics about the development of ICT services. This development based on the data from CZSO for period 2005–2012 (or 2005–2011), was evaluated by the similarity matrices. From the obtained results we can make an important conclusion that the Ward’s method is more sensitive to changing the phases of growth with decline, so those regions which were included into the clusters based on Ward’s method had undergone the similar alternating development. Regions which were mainly developing and their ICT level increased over time were better evaluated by the nearest neighbour method. When we see the relationship between the results of both methods (e.g. in the case of high speed internet connection in municipalities), then the regions in the relevant clusters developed and grew similarly on the basis of analysed ICT statistics. It is

The Impact of ICT Growth on Households and Municipalities in the Czech NUTS-3 Regions: the Application of Cluster Analysis
70
important to note that the largest growth was recorded in regions which are classified according to Eurostat economic assessment as less developed regions. We can make a decision that the nearest neighbour method is more appropriate for the conditions of countries with stable growth potential and Ward’s method for the countries with differently developed regions (such as the Czech Republic).
Acknowledgement
Supported by the IGA of University of Economics in Prague under the No. IGS MF/F4/6/2013.
References
Basl, J., Doucek, P. (2013) ICT and Innovations in Context of the Sustainable Development. In IDIMT-2013 Information Technology Human Values, Innovation and Economy. Prague, Linz: Trauner Verlag, pp. 87–96.
Basl, J., Pour, J., Šimková, E. (2008) The Survey of the Main Trends of the ERP Applications in the Czech Republic and their Business Effects. In XU, L., TJOA, A., CHAUDHRY, S. Research and Practical Issues of Enterprise Information systems II. New York: Springer, pp. 1311-1318.
Bruynooghe, M. (1977) Méthodes nouvelles en classification automatique de données taxinomiqes nombreuses. Statistique et Analyse des Données, vol. 3, pp. 24–42.
Doucek, P., Novotný, O., Voříšek, J. (2009) Human Recources in ICT – The Czech Republic Analysis. SEFBIS Journal, vol. 4, no. 4, pp. 71–79.
Fiala, T., Langhamrová, J. (2012) Možný vývoj úrovně vzdělání populace České republiky do roku 2050 aneb jak se bude vyvíjet lidský kapitál. Fórum sociální politiky, vol. 6, no. 5, pp. 2–8.
Gordon, A. D. (1999) Classification, 2nd Edition. Chapman and Hall, Boca Raton.
Kuncová, M., Doucek, P. (2013) Využívání ICT v České republice ve srovnání s evropskými zeměmi. Regionální studia, vol. 13, no. 1, pp. 67–81.
Maryška, M., Doucek, P., Novotný, O. (2012) Requirements of companies on the knowledge ICT specialists for the ICT administrator role. In 4th World Conference on Educational Sciences. Amsterdam: Elsevier, pp. 4389–4393.
Maryška, M., Novotný, O., Doucek, P., Pecáková, I., Skarlandtová, E., Voříšek, J., Žid, N. (2012) Lidské zdroje v ICT. Praha: Professional Publishing. 147 p.
Mirkin, B. (1996) Mathematical classification and clustering. Nonconvex Optimization and its Applications, vol. 11, Dordrecht: Kluwer Academic Publishers, pp. 140–144.
Murtagh, F. (1983) A survey of recent advances in hierarchical clustering algorithms. The Computer Journal, vol. 26, no. 4, pp. 354–359.
Šimpach, O. (2013) Application of Cluster Analysis on the Demographic Development of Municipalities in the Districts of Liberecky Region. In International Days of Statistics and Economics. Slaný: Melandrium, pp. 1390–1399.
Šimpach, O., Pechrová, M. (2013) Assessing the impact of standard of living on the life expectancy at birth using Vector Autoregressive Model. In Mathematical Methods in Economics. Jihlava: College of Polytechnics Jihlava, pp. 921–926.
Ward, J. H., Jr. (1963) Hierarchical Grouping to Optimize an Objective Function. Journal of the American Statistical Association, vol. 58, pp. 236–244.