the impact of ifrs adoption versus non-adoption on ... the impact of ifrs adoption versus...
TRANSCRIPT

1
The Impact of IFRS Adoption versus Non-Adoption on Corporate Disclosure
Levels in the Asian Region
Richard D. Morris*
Isabelle Susilowati*
and
Sidney J. Gray**
*University of New South Wales
** University of Sydney
July 2012
Our research was supported by the Australian Research Council‟s Discovery Projects
funding scheme (project number DP0346684).
2
The Impact of IFRS Adoption versus Non-Adoption on Corporate
Disclosure Levels in the Asian Region
Abstract
Using a unique hand-collected dataset of 262 companies from eight Asian region
countries in both 2002 and 2007, we examine whether the adoption of IFRS in four of
those countries between 2002 and 2007 improved their disclosure levels more relative
to the other four countries which did not adopt IFRS. A 441 item IFRS-based checklist
is used to measure disclosure. Disclosure levels not only differ across countries but also
on average improve over time. Countries which adopted IFRS between 2002 and 2007
improve disclosure levels more than countries that did not. The result holds after
controlling for country-level and firm-level variables known to influence disclosure
practices. While country-level and firm-level factors do influence disclosure levels,
IFRS adoption has also made a positive difference to disclosure levels in the region.
The paper contributes to the literature by showing that IFRS adoption improves
corporate disclosure in the Asian region over and above the generally upward trend in
disclosure across time.
3
The Impact of IFRS Adoption versus Non-Adoption on Corporate
Disclosure Levels in the Asian Region
Introduction
The adoption of International Financial Reporting Standards (IFRS) by many countries
in the past decade, for example by EU countries in 2005, has been an important event in
financial reporting. This paper examines whether there has been an increase in
corporate disclosure levels in Asian countries that adopted IFRS around 2005 compared
to Asian countries where domestic GAAP was still being used. We find that countries
which adopted IFRS improve corporate disclosure levels more than countries that did
not. The result holds after controlling for country-level and firm-level variables known
to influence disclosure practices and for the generally upward trend in disclosure across
time.
Poor corporate disclosure and transparency became an important issue in Asian
countries following the Financial Crisis of 1997/98. Despite subsequent regulatory
attempts to increase corporate disclosure in many Asian countries, concerns remain
about weak levels of disclosure in the region. For example, the Opacity Index study
2004 (Kurtzman, Yago, Phumiwasana, 2004) shows that to invest in the eight Asian
countries in our study would require at that time an average annual return 3.02% more
than comparable investments in the USA to compensate for additional risk created by
lack of disclosure in these countries.
IFRS are generally thought to be more comprehensive than domestic GAAP of most
countries (with the exception of US GAAP). Studies have investigated the impact of
IFRS adoption on earnings quality, on cost of capital, and on the value relevance of
profits and book value (for example, Barth, Landsman & Lang 2008; Daski, Hail, Leuz
& Verdi, 2008; Armstrong, Barth, Jagolinzer & Reidl, 2010; Horton & Serafim, 2010;
Clarkson, Hanna, Richardson & Thompson, 2011; Landsman, Maydew & Thornock,
forthcoming). However, little is known about whether IFRS adoption has led to an
increase in disclosure levels - in Asian countries or elsewhere. The likely reason is that
disclosure is not measured in computerised databases such as Compustat Global
Vantage or Worldscope, and so not readily accessible by researchers. Yet high
disclosure levels are an important component of quality financial reporting and help to
reduce information asymmetry between a firm and its stakeholders. We provide results

4
of a hand-collected 441 item IFRS-based disclosure checklist for matched samples of
256 companies from eight Asian countries in both 2002 and 2007. These countries are
Australia, China, Hong Kong, and the Philippines which adopted IFRS between those
years, and Japan, India, Singapore, and Malaysia which did not.
Ball (2006) points out that the adoption of IFRS, now in more than 100 countries,
although driven by global integration of markets, may not produce high quality
financial statements in practice because of political and legal barriers to successful
implementation at the country level. Studies show both country-level and firm-level
factors are important determinants of governance choices (including disclosures)
(Doidge, Karolyi & Stulz, 2007) and voluntary IFRS adoption (Francis, Khurana,
Martin, & Perera, 2008). Ball, Robin & Wu (2003) show that, in four Asian countries
(Hong Kong, Malaysia, Singapore & Thailand), firms report earnings which are less
timely in terms of loss recognition than earnings in some common law countries
(Australia, Canada, UK, USA) but about the same as in some code-law countries
(France, Germany, Japan). They argue that poor timeliness of earnings in the four
Asian countries is associated with factors/incentives such as the system for setting and
enforcing standards, the influence of inside stakeholders such as families and banks on
financial reporting decisions, political influences, tax incentives, and enforcement
mechanisms (Ball et al., 2003, pp241-246)1.
Our research is relevant to Ball‟s (2006) point because we examine the impact of IFRS
adoption on four Asian countries which differ in legal system and other regulatory
characteristics and we investigate whether IFRS adoption has been successful in all four
in terms of enhancing disclosure levels. We also compare disclosure levels in these
countries with a control group of four other Asian countries which, up to 2007, had not
adopted IFRS.
A separate stream of research commencing with Gray (1988) and building on the work
of Hofstede (1980) suggests that cultural factors influence corporate disclosures. In a
study covering 42 countries, Hope (2003) finds that corporate disclosures are
consistently associated with legal system type, but he also finds disclosures associated
1 Ball et al. (2003) is among a stream of papers, including Pope & Walker (1999), Ball, Kothari &
Robin (2000); Leuz, Nanda & Wysocki (2003) and Bushman, Piotroski & Smith (2004), which
investigate the influence of country-level factors, for example legal system, enforcement, and
accounting standards, on corporate accounting practices. However, only Ball et al. (2003) focuses on
Asian countries.

5
with cultural variables. He concludes that cultural differences may well be a valid
determinant of disclosures. We examine whether the cultural dimension of “secrecy”,
derived by Gray (1988) from Hofstede‟s cultural values and measured by Braun &
Rodriquez (2008), is associated with changes in disclosure in IFRS adopting Asian
countries.
Several studies have examined the determinants of disclosure in individual Asian
countries (for example, Hossain, Tan & Adams, 1994; Ho & Wong, 2001, 2002;
Hannifa & Cooke, 2002; Chau & Gray, 2002; Morris et al., 2004; Ali, 2005; Sutthachai
& Cooke, 2009; Wan-Hussin, 2009); however none examines the effect of IFRS
adoption on disclosures. Furthermore, these studies do not deal with the fact that some
firm-level determinants are influenced by country-level factors; for example, Japanese
companies tend to be larger than those from other countries in the region. These
differences in turn are driven by macro-level factors, such as, amongst many things,
economic development: as Japan‟s economy is among the largest in the Asian region, it
tends to have larger firms.
Our paper contributes to the literature in several ways. First, we provide evidence from
the Asian region about the impact of IFRS adoption on corporate disclosure levels.
Most studies of the impact of IFRS adoption focus on adoption in the EU and examine
IFRS-induced changes in earnings quality, cost of capital, value relevance of earnings,
as well as IFRS-induced changes in profitability and shareholders‟ equity. To our
knowledge, none investigates the impact of IFRS on disclosure levels.
Second, we find that, even after controlling for country-level and firm-level factors
known to impact disclosures, IFRS adoption still has a significant positive impact on
disclosures in the four Asian countries that adopted IFRS between 2002 and 2007. That
is, while consistent with Ball‟s (2006) conjecture that country-level differences matter
in explaining corporate disclosures, adoption of IFRS also has a significant positive
impact. A number of firm-level variables are also robustly associated with disclosure -
they are organisational, financing and monitoring variables which are market-driven
rather than regulation-driven.

6
Third, our disclosure measure is based on a checklist of 441 items from IFRSs in
2001/022, covering 265 companies from eight Asian countries for both 2002 and 2007.
The items contained therein cover most of the financial section of a typical company
annual report. Our data are finely detailed, hand-collected and taken from primary
sources (companies‟ annual reports) rather than from computerised databases. Other
studies of corporate disclosure across Asian countries use limited and/or more dated
measures of disclosure, and are thus noisy indicators of transparency. For example, the
CIFAR Disclosure Scores, now very outdated, cover only 85 disclosure items in 1991
and 1993, albeit for about 1000 companies from 42 countries (CIFAR, 1995; Hope,
2003, p.266); the Standard & Poor‟s Transparency and Disclosure Survey (2001)
covers 98 items of which only 35 are about financial transparency and disclosure in
annual reports; and the CLSA (2001) corporate governance survey, which covers 495
firms from 25 countries, includes only 10 items on financial disclosure. Most cross-
country studies3 of accounting practices utilise the availability of such computerised
databases. None of these databases allows a researcher to investigate the adoption of
IFRS.
Fourth, the CLSA (2001) and Standard & Poor‟s (2001) data examine large numbers of
companies across many countries but have relatively few firms per country. The CLSA
(2001) data has an average of 15 firms per country. The Standard & Poor‟s (2001) data
for Asian countries has an average of 26 firms per country, and is dominated by one
country, Japan, with 130 firms. While our study examines a smaller number of
countries (eight), we collect more disclosure items (441 per firm) from each firm from
more firms per country.
Fifth, our paper complements and extends studies, mentioned above, that have
examined the determinants of disclosure in individual Asian countries before IFRS
adoption.
2 2002 was the latest year available when we began this project. As far as we are aware, our data set is
the largest collection of finely detailed disclosure information on Asian countries. 3 They include papers which have examined: (a) the value relevance of financial statements in different
countries (Hung, 2001); (b) earnings management (Leuz et al., 2003); (c) conservatism of accounting
income (Ball et al., 2003); (d) the price of earnings opacity (Bhattacharya et al., 2003); (e) the impact of
disclosure levels on cost of capital (Francis et al., 2005), (f) determinants of the voluntary adoption of
IASs (Barth et al., 2005); (g) disclosure and emerging market companies‟ access to capital in global
equity markets (Frost, Gordon & Pownall, 2005).
7
Our paper is organised as follows. The next section provides the hypothesis
development, followed by a section on research methodology, sample selection and
measurement. Our results are presented next, followed by discussion and conclusions.
Hypothesis development
The Impact of IFRS Adoption on Disclosure
From humble beginnings in 1973, through a series of reforms including the
Comparability and Improvements Project (1989-1993) and the “core standards” project
(Schweikart, Gray & Salter, 1996, p.113), IFRSs and their predecessors International
Accounting Standards (IASs) have become since the early 2000s a serious challenge to
US GAAP. In 2005, over 100 countries had adopted IFRS including countries of the
EU. In Asia, IFRS was adopted for all companies by the Philippines, Australia and
Hong Kong in 2005 and by China and New Zealand4 in 2007.
Adoption of IFRS did not happen in the same way for each of these countries, but for
our purposes it was complete by 2007. In the Philippines, a gradual adoption of
IAS/IFRS had been underway from 2001, but was complete in 2005 (IASPlus,
Philippines, January and November 2005 updates). In Australia, despite a process of
convergence of domestic GAAP with IFRS, many differences still remained between
Australian GAAP and IFRS in 2005 when the final changeover occurred. IFRS were
fully converged with Hong Kong standards in 2005 (IASPlus, Hong Kong, January
2005 update). In China, adoption of IFRS in 2007 was for listed companies only and
contained “certain modifications that reflect China's unique circumstances and
environment” (IASPlus, China, April 2006 update).
By contrast, domestic GAAP in our other four countries still remains different to IFRS.
Singaporean GAAP will not be fully converged with IFRS until 2012 (IASPlus,
Singapore, May 2009 update). Japan in 2011 deferred mandatory IFRS adoption but
permitted some companies to adopt IFRS voluntarily (IASPlus Japan, June 2011
update). Malaysia finalised IFRS-compliant standards only in November 2011
(IASPlus, Malaysia, June and November 2011 updates). In 2011, India issued 35 new
4 We do not cover New Zealand in our study because of its close similarity to Australia. However, one
New Zealand company, NZ Telecom, is included in the Australian sample because it is listed on the
Australian Stock Exchange.
8
standards which were converged with IFRS but still contained significant differences
from IFRS (IASPlus, India, February 2011 update).
Our focus is on IFRS disclosure rules. These are very extensive, much more than
countries‟ domestic GAAP. In our eight countries, the proportion of our IFRS-based
disclosure checklist (discussed later) also contained in countries‟ domestic GAAP in
2002 ranges from .43 (China) to .88 (Singapore) with five countries in the range .68 to
.74 (Table 1, panel A). All else equal, we expect that the adoption of IFRS will lead to
an increase in disclosure levels. Our primary hypothesis therefore is:
H1: Countries in the Asian region adopting IFRS will improve their disclosure levels
more relative to countries not adopting IFRS.
Country-level controls
As mentioned, Ball (2006) conjectures that the success of IFRS adoption will be
dependent on the basic financial regulatory infrastructure of the adopting country.
Therefore, in testing H1, country-level regulatory factors must be controlled for. Many
regulatory infrastructure mechanisms could be chosen, but we select a small number
which have good empirical grounding in the recent accounting literature, and have some
plausible, proximal associations with corporate disclosure.
Country legal system. The works of LaPorta et al., (1998, 1999) have had an important
influence on empirical research into cross-country differences in accounting standards
and practices. They show that countries with English common law legal systems
tended to have better economic development, stronger capital markets, better
accounting standards and better enforcement than countries with code law legal
systems. The distinction between common-law and code law countries, and differences
in enforcement and economic development have been used as country-level
determinants in many recent accounting studies, using either the LaPorta et al. data or
more recent measures, for example Ball et al. (2003).
La Porta et al. (1998, tables 5 & 6) show that countries with English common law
systems have significantly better quality accounting standards than countries with
German-origin legal systems, these countries in turn having significantly better quality
accounting standards than countries with French-origin legal systems. For a series of
enforcement mechanisms, La Porta et al. also found that civil law countries are

9
significantly weaker than English common law countries. Since disclosure practices
(not examined by La Porta et al.) will be influenced by both the quality of accounting
standards and their enforcement, our first control proposition is that:
Control proposition 1: Disclosure levels in countries with common law legal systems
will be higher than those in countries that have code law legal systems
Country legal system has the advantage of likely being an exogenous factor, given that
legal systems have been in place for very long periods, often from countries‟ colonial
days – for instance, all English common law countries in our sample were once British
colonies. However, legal system by itself is unlikely to be a sufficient condition for
corporate disclosure. Therefore, related but more proximal influences must also be
explored.
Enforcement. Based on the aforementioned evidence of La Porta et al. (1998), the first
of these more proximal factors is enforcement of laws. Where enforcement is strong,
mandatory disclosure rules ensure better access to basic financial information. Where
enforcement is weak, the mere adoption of IFRS by a country is one vital step towards
improved transparency, but it is not a sufficient condition (Ball, 2006). Domestic
standards, in some cases identical to IFRSs, coupled with comparatively weak
enforcement mechanisms, are found in some Asian countries (Ball et al. 2003).
Accordingly our second control proposition is that:
Control proposition 2: Corporate disclosure levels will be higher in countries where
enforcement of rules is stronger.
Other studies use compilations of data from La Porta et al. (1998) to construct
enforcement indexes (such as Francis et. al. 2005; Bhat, Hope & Kang, 2006).
However, La Porta et al. did not cover China, so that approach is not available to us.
Instead we measure enforcement using the Rule of Law variable, averaged for 2002 and
2007, from Kaufman, Kraay & Mastruzzi (2003). Rule of Law measures the extent to
which citizens of a country have confidence in and abide by that country‟s laws
(Kaufman et al., 2003, p. 4).
Similarity of local standards to IFRS. Another proximal variable to control for is the
closeness of domestic GAAP to IFRS before the adoption of IFRS. Countries whose

10
domestic GAAP in 2002 was closer to IFRS should have disclosure levels closer to
IFRS and thus increase less after IFRS was adopted.
Control proposition 3: Corporate disclosure levels will be influenced by the closeness
of domestic GAAP to IFRS
National culture The cultural dimensions of uncertainty avoidance, power distance,
individualism and masculinity derived by Hofstede (1980) and Hofstede & Hofstede
(2005) were applied to accounting values and accounting practices by Gray (1988), and
have since produced a stream of analytical and empirical papers in international
accounting. Uncertainty avoidance measures the extent to which a society tolerates
ambiguity and uncertainty. Power distance measures how a society handles inequality
among its members. Individualism measures the importance of individuals versus
groups in society. Masculinity measures the extent to which masculine-type attitudes
are preferred over feminine-type attitudes in a society.
Using Hofstede‟s cultural dimensions, Gray (1988) developed the four accounting value
dimensions of statutory control versus professional regulation of accounting, uniformity
versus flexibility of accounting rules, conservatism versus optimism in accounting
measurement, and transparency versus secrecy in accounting disclosures. The last of
these dimensions – transparency versus secrecy - is of relevance to our disclosure study.
Gray (1988, p. 11) argued: “the higher a country ranks in terms of uncertainty
avoidance and power distance and the lower it ranks in terms of individualism and
masculinity, then the more likely it is to rank highly in terms of secrecy.” Therefore we
expect firms from such countries to have poorer financial reporting transparency. Put
another way, firms will likely have higher disclosure levels if they come from countries
with low uncertainty avoidance, low power distance, high individualism and/or high
masculinity cultural scores. Accordingly, we expect that:
Control proposition 4: Corporate disclosure levels will be higher in countries with a
lower secrecy orientation
We use the Secrecy measure provided by Braun & Rodriquez (2008), which is a
mathematical combination of Hofstede‟s four cultural dimensions of uncertainty
avoidance, power distance, individualism and masculinity. Broadly speaking, for each
Hofstede cultural dimension, Braun & Rodriquez (2008) calculate the difference
11
between each country‟s score and the mean score across 56 countries for that
dimension. Each country then has “difference” scores for uncertainty avoidance, power
distance, individualism and masculinity. The secrecy score for each country is the sum
of its “difference” scores for uncertainty avoidance and power distance minus its
“difference” scores for individualism and masculinity. The resultant secrecy score thus
makes use of all four Hofstede cultural dimensions and is influenced by the country‟s
relative position above or below the mean on each cultural dimension.
Firm-level controls
No single theory addresses all the incentives for firms‟ disclosures. Instead the problem
has been examined from several theoretical perspectives including agency theory
(Jensen & Meckling, 1976; Watts & Zimmerman, 1986); signalling theory (Spence,
1973) and related benefit-cost analyses (Verrecchia, 1983, 1990). However, these
perspectives are consistent conceptually5 so all may be used in hypothesis development.
At their core, our firm-level hypotheses are based on the relationship between those
who control the firm on the one hand, and its external suppliers of equity or debt
finance on the other.
The separation between outside owners and inside managers of companies creates
agency costs (Jensen & Meckling, 1976). In the USA, separation between management
and shareholders is common in listed companies (Berle & Means, 1932). However in
Asian countries, family/insider control of companies is common (La Porta et al., 1999,
Claessens, Djankov & Lang, 2000), so that the key agency problems are those between
inside shareholders and outside shareholders. These agency problems include the
transfer of wealth away from outside shareholders to insiders, a phenomenon known as
“tunnelling” (Johnson, La Porta, Lopez-de-Silanes & Shleifer, 2000). Nobes (1998)
characterises countries where insider ownership predominates as insider dominant
countries. The larger the holdings of inside shareholders, the less likely will public
disclosure of information occur because insiders have access to information internally
and may also wish to hide any tunnelling activities from outsiders. La Porta et al.‟s
(1998) study shows that there is a strong negative correlation between the extent and
effectiveness of investor protection laws and ownership concentration. They find that
5 Morris (1987) shows that agency and signalling theories are consistent conceptually, in the sense that
if one is correct, the other may also be correct. They may thus be used together in hypothesis
development.
12
emerging markets tend to have relatively poor investor protection laws (bad laws per se,
or good laws poorly enforced) and high ownership concentration, particularly among
East Asian firms. Thus inside control at the firm level could be associated with poor
rule enforcement at the country level.
Conversely, the larger the cumulative holdings of small outside shareholders, the
greater their demand for information and the more likely the company is to supply it, all
else equal. Nobes (1998) characterises countries where outside shareholders
predominate as outsider dominant countries.
Companies that have recently raised equity or debt finance, at home or abroad, are also
likely to face pressures for increased disclosure, as is shown by the empirical evidence
(for example, Firth, 1980; Meek, Roberts & Gray, 1995). Similarly, the
multinationality of companies (which we proxy by whether they have international
sales) will influence disclosure as a way for firms to provide information to current and
potential customers or investors without local domestic knowledge of such firms (Jaggi
& Low, 2000). Similarly, companies which rely extensively on debt financing from
external sources face an information asymmetry problem with their lenders. Therefore,
all else equal, there should be a positive association between disclosure and leverage.
Signalling theory (Spence, 1973), by which high quality firms take costly-to-copy
actions that signal their superior quality to the market, is a theory consistent with
reducing agency costs (Morris, 1987). Disclosures are one such costly signal.
Signalling costs include direct preparation costs, proprietary costs and, in some cases,
political costs, as well as the cost incurred if the signal is false. Quality can be equated
with profitability and larger firm size. More profitable firms will disclose more so that
investors can assess better the credibility of their reported earnings. For example,
Miller (2002) reports that US firms with increases in earnings also increase their
voluntary disclosures. Larger firms are expected to disclose more because they are
usually more successful and wish to convey that information to the market. Also, larger
firms, having more market power, might disclose more because, compared to smaller
firms, they are less likely to face competitive losses (Hossain, Perera & Rahman, 1995).
Larger firms may also disclose more because they have the accounting expertise to do
so. Of course, larger firms might simply have more to disclose than smaller firms. An
example is firm complexity: all else equal, a company which operates in many different
13
businesses has more to tell the market than one which operates in only one line of
business. Therefore we expect more diversified firms to be more transparent than less
diversified firms. Research has consistently found that larger firms disclose more than
smaller firms (Foster, 1986; Chow & Wong-Boren, 1987; Meek, Roberts, & Gray,
1995; Hossain, Perera & Rahman, 1995); but the evidence on the association between
disclosure and profitability and business complexity is mixed and inconclusive.
A company‟s choice of audit firm can also act as a signal of quality (Bar-Yosef &
Livnat, 1984). Larger audit firms, as typified by the now Big 4, are usually perceived to
be of higher quality than smaller audit firms (DeAngelo, 1981; Chow & Wong-Boren
1987; Hossain et al., 1995). Larger auditors have incentives to ensure that client
companies comply with accounting standards. Therefore the presence of a Big 4
auditor should be associated with better disclosure. Street & Gray (2001) show that
companies claiming to comply with IFRSs in 1999 did so more comprehensively if they
were audited by a large audit firm. In like fashion, the adoption of firm-level corporate
governance mechanisms can act as a signal of quality. Such mechanisms are aimed at
protecting outside shareholders. Therefore, we expect that internal corporate
governance mechanisms will be associated with more disclosures, all else equal.
In summary, our fifth control proposition is that:
Control Proposition 5 Companies will have higher disclosure levels if they:
(a) have more outside shareholders;
(b) have fewer inside controlling shareholdings;
(c) have recently raised equity or debt finance;
(d) have international sales
(e) are larger;
(f) have more business segments;
(g) are more profitable;
(h) employ a Big-4 auditor; and/or
(i) have more internal corporate governance mechanisms.
Research Methodology
Sample Selection
Selection of countries. We focus on eight major Asian countries - Australia, China,
Hong Kong, and the Philippines which adopted IFRS between 2002 and 2007, and
India, Japan, Malaysia, and Singapore which did not. These eight countries vary in
legal system, rule enforcement, and level of secrecy (exhibit 1, panel A and table 1,

14
panel A). In 2002, all were in the top half of 32 countries in the region as measured by
GDP per capita6 and arguably they are among the important countries in the region in
terms of international investor interest. These countries were also chosen for the
practical reason that we were able to obtain annual reports of listed public companies
residing therein from corporate websites or publicly available databases (exhibit 1,
panel B).
Australia, Hong Kong, India, Malaysia and Singapore have English common law legal
systems, reflecting their English colonial histories; the Philippines have a French civil
law system, while Japan and China have German civil law systems. For enforcement
we use the Rule of Law measure in Kaufman, Kraay & Mastruzzi (2008) averaged for
2002 and 2007.
The four non-IFRS adopting countries are included to control for general economic
changes across the region and to allow for the fact that disclosure levels might have a
tendency to increase across time, as companies grow bigger and have more to disclose,
even if IFRS were not adopted.
Selection of companies. Using Stock Exchange Fact Books, newspaper share lists and
stock exchange websites, those companies from the largest 50 listed public companies
by market capitalisation in 2002 that survived to 2007 were identified in each country,
after excluding banks, financial institutions and insurance companies (SIC codes 6000-
6999) due to their special regulatory requirements. Also excluded were companies
which, although listed on the Stock Exchange of one country, were incorporated and
headquartered in a different country7 The year 2007 was chosen because it covered the
adoption of IFRS in our four Asian countries, because it maximised the availability of
annual reports on Mergent Online during the data collection process, and because it has
the advantage of not being influenced by the impact of the Global Financial Crisis of
2008.
[INSERT TABLE 1 HERE]
6 GDP per capita in purchasing power parity dollars (IMF 2009:
http://www.imf.org/external/pubs/ft/weo/2009/01). 7 This exclusion rule applies particularly to Singapore where nine companies among the top 50 are
incorporated and headquartered in other countries and are thus subject to the accounting standards of
those other countries. Several Hong Kong companies incorporated in Bermuda have been retained in
the sample because they are headquartered in Hong Kong and adopt Hong Kong accounting standards.
As mentioned, an exception is that we retained New Zealand Telecom in our Australian sample even
though it is a New Zealand company. It adopted IFRS in 2007.

15
Companies‟ annual reports for 2002 and 2007 in English were obtained from sources
listed in exhibit 1, panel B. All data are hand-collected. Data validity and integrity
checks carried out are reported in the appendix.
The final sample size is 530 (265 x 2) companies but the number varies across countries
(table 2) due to non-availability of annual reports in English of some companies.
Country-and firm-level descriptive statistics appear in table 1, panel B. There are
significant differences in 2002 between IFRS adopting countries and non-IFRS
adopting countries for legal system, rule of law and secrecy, with IFRS adopting
countries being higher on legal system but lower on rule of law and secrecy. There are
also significant differences in 2002 across these country groups for SIZE, KREQUITY
AUDITOR, IDIR, and AC as well as SSH, FCTL3 and DISC. Changes from 2002 to
2007 in firm-level descriptive statistics appear in table 1 panel C. They show that SIZE,
ROR, IDIR, AC and TOPSH all significantly increased between 2002 and 2007 while
KRDEBT significantly decreased.
Disclosure Measure
Companies‟ annual reports were compared with an IFRS-based disclosure checklist.
Such a benchmark is suitable given the nature of the study. As mentioned, table 1 panel
A shows that the proportion of IFRS contained in domestic standards for our sample of
countries ranged in 2002 from 0.43 (China) and 0.62 (Philippines) to 0.88 (Singapore)
with the other five countries in the range .68 to .74. However, the difference between
IFRS adopting countries as a group versus non-adopters is insignificant (table 1, panel
B).
We began with a checklist developed by Deloitte Touche Tohmatsu (2001) divided into
twelve sections, namely General Principles of Presentation, Income Statement, Balance
Sheet, Statement of Changes in Equity, Cash Flow Statements, Accounting Policies,
Explanatory Notes, Disclosures by Banks & Financial Institutions, Disclosure of
Information Reflecting the Effects of Changing Prices, Disclosure for Enterprises
Reporting in the Currency of a Hyperinflationary Economy and Disclosures of
Agricultural Activities. We removed items that could not reasonably be found by
reading an annual report and items which would not be applicable to all companies in
16
our sample (see appendix). Our resulting checklist has 441 items.8. The checklist does
not cover any IFRS introduced after 2002, but the number of such standards is very
small relative to those that the checklist does cover. We also need a checklist that would
be relevant in both 2002 and 2007 to provide a constant benchmark. All annual reports
for 2007 are in English, even from countries like China, Japan and the Philippines
where English is not the main language, while those for 2002 are mainly but not
exclusively in English. That creates a bias as such companies likely are more
internationally oriented and may have better disclosure levels anyway. However, the
bias applies both to IFRS adopting countries (Philippines and China) and to non-IFRS
adopting countries (Japan). Also, the bias is counteracted by our coding conventions
which bias disclosure scores downwards. Jeanjean, Lesage and Stolowy (2010) show
that companies with English language annual reports from non-English speaking
countries are more likely to be larger, internationally oriented, US-listed and to need
external financing. We control for most of those possibilities in our regressions.
The Treatment of Non-Disclosures
In coding the checklist, a decision had to be made about the treatment of undisclosed
items. Non-disclosure can occur for several reasons. First, a company may deliberately
refuse to disclose an item. Second, it may disclose something but not everything about
the item9. Third, the item may actually not be applicable to the company. Fourth, the
item may be too small (not material) to warrant disclosure. With only annual reports to
go by, these possibilities are difficult to tease apart.
As well as choosing checklist items that arguably would be applicable to all or most
companies, two additional approaches could be adopted to deal with non-disclosures: (i)
remove undisclosed items deemed not-applicable to the firm; (ii) treat all undisclosed
items as “applicable” and leave them in the firm‟s disclosure score calculation. Each
approach has its own strengths and weaknesses. In the first approach, if a company has
320 of the 441 checklist-items applicable to it and discloses 180 of these 320 items, its
disclosure score will be 180/320 = 0.563. The number of “applicable” items will vary
8 Studies which used a disclosure checklist have items that range in number from 30 (Wallace and
Naser, 1995) to 224 (Cooke, 1989). 9 Selective disclosure can create distortions. For example, in the case of segment reporting, suppose
company A has one segment and discloses information about it; while company B has five segments but
only discloses information about three. B appears to disclose more than A, but, relative to their
respective disclosure opportunities, A has disclosed more (Botosan, 1997).

17
across firms. If coding were error-free, this is a good approach because firms are not
penalised for having non-applicable items. However, errors can be made in deciding if
undisclosed items are applicable or not, and the chance of judgement errors increases
with the number of coders. We rejected this approach because of the large number of
coders employed in the study (see appendix).
Treating all undisclosed items as “applicable” means that each company will be given a
score out of 441. Companies trying to hide information will be rightly penalised, but
good disclosers could be wrongly penalised. The disclosure scores of many firms are
thus biased downwards using this conservative approach. The downward bias helps to
counteract the above-mentioned upward bias caused by our sample comprising mainly
companies with English-language annual reports. Other advantages of the conservative
coding strategy are objectivity and reduced need for judgement, important matters for
us because many people contributed to coding our dataset; and all firms are measured
against a common benchmark of 441 items in both 2002 and 2007. Choosing larger
companies in each country makes it likely that more items in the IFRS checklist will be
applicable to sample members. Also, the difference-in-difference methodology,
covered later, which focuses on changes across time, reduces the impact of differing
disclosure opportunities. Other surveys of transparency such as Standard & Poor‟s
Transparency and Disclosure Study 2001/02 code conservatively (items either disclosed
or not) with a restricted number of checklist items. So we adopted this conservative
coding approach.
To sum up, the disclosure score (hereafter DISC) was calculated as follows:
TOTM
aijDISC
Where: aij is company i‟s score (0 or 1) on the jth
item in the checklist;
TOTM is the maximum possible score of 441 for DISC
All disclosure scores are unweighted. The reason is to eliminate any bias inherent in a
weighted score (Chow & Wong-Boren, 1987) which may reflect the importance of
items to a specific group of information users (Chau & Gray, 2002). We are not
focusing on any specific user group here. The unweighted method has been used in
many studies (Cooke, 1989; Chau & Gray, 2002; Morris, et al 2004).
Results

18
Descriptive statistics for DISC appear in table 2, as do country means. There are
significant differences in DISC across countries in both 2002 and 2007, as shown by the
one-way ANOVA F statistics, and all countries show significant increases between
2002 and 2007. Three IFRS-adopting countries (Australia, China and the Philippines)
have the largest of these increases.
Table 3 shows Pearson correlations between DISC and country-level variables. DISC is
significantly positively correlated with IFRS, legal system, rule of law and closeness of
local standards to IFRS in 2002, but is not significantly correlated with secrecy.
Correlations between DISC and firm level variables appear in table 4 panel A for 2002
and panel B for 2007. In both years, DISC is significantly positively correlated with
BSEG, ISALDum, KREQUITY, IDIR, and AC, with AUDITOR in 2002 only, and is
significantly negatively correlated with SSH in both years.
While some country level (table 3) and firm level (table 4) variables are themselves
significantly correlated, none is correlated high enough to raise concerns about
multicollinearity (Field, 2005, pp.174-175; Cohen et al., 2003, pp.424-425).
Multivariate results
Pooled Cross-Sectional Regressions. Table 5 shows OLS pooled regressions of DISC
on company-level control variables; YEAR, a binary variable for 2002 & 2007; and
IFRS equal to 1 for countries that adopted IFRS between 2002 and 2007, zero otherwise
(model 1). YEAR controls for any upward time trend in disclosure due to increases in
firm and/or country size or profitability. Country-level control variables are then added
one-at-a-time in models 2-510
. Model 2 adds Legal System to model 1, model 3 adds
Rule of Law to model 2, model 4 adds Local Standards to model 3 and model 5 ads
Secrecy to model 4. A summary of the regression models and definitions of all
variables can be found in Exhibit 1 (panels A and C). The regression specifications are
also summarised at the foot of table 5. In all models, the Variance Inflation Factors
(VIFs) are less than 10.0, reducing concerns about multicollinearity (Field, 2005, p175).
10
Country fixed effects are not included in any model because of multicollinearity problems when they
are combined with IFRS.
19
In all five models, IFRS is positive and significant as predicted by Hypothesis 1. This
indicates that, even after controlling for a number of country-level and firm-level
variables known to influence disclosure, adoption of IFRS has a significant positive
impact on disclosure in the countries covered. The result appears to be robust, but is
probed further in the Difference-in-Difference regressions shortly.
Of the country-level control variables, legal system is positive in all models but
significant in models 2 and 3 only. This is understandable given that the top four
countries for DISC in 2002 and three of the top four for DISC in 2007 all have English
common law legal systems. Rule of Law is positive and significant in models 3 and 5
only, as are Local Standards in model 4 and Secrecy, contrary to expectation, in model
5.
Among the firm-level controls, leverage, BSEG, ISALDUM, KREQUITY, and IDIR
are positive and significant in all five models while, contrary to expectation, SSH is
negative and significant in all models.
The YEAR binary variable is significant and positive in all models, indicating an
upward trend in disclosure across 2002 and 2007, consistent with table 2.
Difference-in-Difference Regressions. The pooled cross-sectional regressions in table
5 treat each firm-year as an independent observation and do not consider that each firm
in the sample appears in 2002 and 2007. Thus the possibility of using each firm as its
own control over time is ignored. Nor do the pooled regressions control for omitted
variables such as industry which are unchanged across time but vary across firms. To
more powerfully probe the impact of IFRS on disclosure, we ran a Difference-in-
Difference regression (table 6, model 6) which regresses Change in DISC 2002-2007
(∆DISC) on changes in those control variables that did significantly change from 2002 to
2007, as shown in table 1 panel B, and those control variables that significantly differed
in 2002 between IFRS adopting countries (as a group) and non-adopting countries (as a
group), as shown in table 1 panel C. Variables which changed significantly from 2002
to 2007 (table 1 panel B) are SIZE, ROR, ISALDum, KRDEBT, AUDITOR, IDIR, AC
and TOPSH. Variables which varied significantly in 2002 across IFRS vs non-IFRS
adopting countries are DISC, KREQUITY, SSH, TOPSH, Legal System, Local
Standards and Secrecy.

20
The DiD methodology treats each firm as its own control thus removing the effect of
firm level factors that do not change over time. However, control variables that
significantly vary across firms in 2002 or which significantly change from 2002 to 2007
are retained in the regression. That is necessary because the DiD methodology has a
parallel trend assumption, namely that the treatment group (IFRS adopting countries)
and the control group (IFRS non-adopting countries) should be reasonably similar
before the „treatment‟ event occurs. The parallel trend assumption also assumes that the
impact on disclosure of any other factors in the two groups in 2002 and between 2002
& 2007 should be reasonably similar. These conditions are not met in our case, and
require the control variables shown in table 6, model 6. Model 7 in table 6 repeats
model 6 but removes control change variables which are not statistically significant in
model 6. A summary of the regression models and definitions of all variables can be
found in Exhibit 1 (panels A and C). The regression specifications are also summarised
at the foot of table 6.
Models 6 and 7 show that IFRS is significant and positive, indicating support for
Hypothesis 1 using the more powerful DiD methodology. Change in DISC 2002- 2007
(∆DISC) is significantly greater in IFRS adopting Asian countries than in IFRS non-
adopting Asian countries.
Only one control change variable – ∆ IDIR – is significant. Of the control variables for
2002, DISC is significant and negative, indicating that firms with higher changes in
DISC tend to have lower DISCs in 2002. Firms with larger changes in DISC also tend
to come from code law countries as shown by the significant negative coefficient on
legal System and from countries with a higher Secrecy scores. That is consistent with
the descriptive statistics in table 2 which shows that the Philippines and China have the
highest changes in DISC 2002-2007, followed by Australia. Firms with larger changes
in DISC also tend in 2002 to have lower TOPSH values and to have an audit committee.
Discussion and Conclusions
We have examined the extent to which disclosure levels increased in four Asian
countries that adopted IFRS between 2002 and 2007, relative to disclosure levels in four
other Asian countries which did not adopt IFRS by 2007. Disclosure is measured by a
441 item checklist, conservatively coded, based on IFRS in 2001. Our central finding is
that firms in IFRS adopting countries significantly increased their disclosure levels as

21
hypothesised, even after controlling for country-level and firm-level variables known
from the literature to influence disclosure. The result is robust across several pooled
cross-sectional regression specifications as well as in Difference-in-Difference
regressions.
It might be thought that our main result occurs because our companies from the
Philippines and China (which have the highest average change scores for DISC in table
2) prepare their annual reports in English and thus have upwardly biased DISC scores.
However, the result holds even with the DiD regressions where any uncontrolled factors
driving the use of English language reports are cancelled out. Also, the coding
conventions we use tend to counteract any English-language-induced upward bias, and
we control for most factors identified by Jeanjean et al (2010) as being associated with
the publication of English language reports in non-English speaking countries..
Our central result has implications for Ball‟s (2006) conjecture that adoption of IFRS
may not succeed in producing high quality financial statements in practice because of
political and legal barriers to successful implementation at the country level. We find
that companies from China and the Philippines (both IFRS adopting countries) have the
largest changes in DISC from 2002 to 2007, even after controlling for these countries‟
code law legal systems, their relatively poor Rule of Law, their pre-existing domestic
GAAP and their level of secrecy.
Our results have implications for standard setters‟ attempts to achieve convergence of
financial reporting practices towards IFRSs across the region. While country-level
differences, be they differences in legal system, enforcement, or national culture are
important determinants of disclosure levels, IFRS adoption does seem to have led to an
increase in disclosure levels in our four Asian countries. That bodes well for the
success of IFRS adoption in other countries from the region.
22
References
Akerlof, G.A. 1970. “The Market for „Lemons‟: Quality Uncertainty and the Market
Mechanism” Quarterly Journal of Economics August, pp. 488-500.
Ali, M.J. 2005. “A Synthesis of Empirical Research on International Accounting
Harmonization and Compliance with International Financial Reporting
Standards” Journal of Accounting Literature 24, 2005, pp. 1-52
Armstrong, C., M. Barth, A. Jagolinzer & E. Reidl, 2010 “Market Reaction to the
Adoption of IFRS in Europe” The Accounting Review 85 (1) pp. 31-61
Ball, R. 2006. International Financial Reporting Standards (IFRS): Pros and Cons
for Investors” Accounting & Business Research 36 (4), pp. .
Ball, R., A.P. Kothari and A. Robin 2000. “The Effect of International Institutional
Factors on Properties of Accounting Earnings” Journal of Accounting &
Economics 29, pp. 1-51.
Ball, R., A. Robin and J.S. Wu 2003. “Incentives versus Standards: Properties of
Accounting Income in Four East Asian Countries” Journal of Accounting
and Economics 36, pp. 235-270.
Barth, M., W.R. Landsman and M. Lang 2008. “International Accounting Standards
and Accounting Quality” Journal of Accounting Research 46 (3) June pp.
467-498
Bar-Yosef S and J. Livnat, 1984 “Auditor Selection: An Incentive Signalling
Approach” Accounting & Business Research Autumn, pp. 301-309
Beck, T., A. Demirgüç-Kunt and R. Levine 2005. "A New Database on Financial
Development and Structure," Policy Research Working Paper No. 2146,
Washington DC: World Bank 1999, revised March 14, 2005.
Berle A. and G. Means 1932. The Modern Corporation and Private Property New
York: MacMillan
Bhat, G., O-K Hope and T. Kang 2006. “Does Corporate Governance Transparency
Affect the Accuracy of Analyst Forecasts?” Accounting & Finance 46 (5)
December, pp. 715-732.
Bhattacharya, U., H. Daouk and M. Welker 2003. “The World Price of Earnings
Opacity” The Accounting Review 78 (3) pp. 641-678.
Botosan, C. 1997. “Disclosure Level and the Cost of Equity Capital” The
Accounting Review 72 (3) July, pp323-349.
Braun, G. And R. Rodriquez 2008. “Earnings Management and Accounting Values:
A Test of Gray (1988)” Journal of International Accounting Research 7 (2)
pp. 1-24.
Bushman, R. and A.J. Smith 2001. “Financial Accounting Information and
Corporate Governance” Journal of Accounting and Economics 32, pp. 237-
333.
Bushman, R.M. and A.J. Smith (2003) “Transparency, Financial Accounting
Information and Corporate Governance” FRBNY Economic Policy Review
April, pp 65-87.
Bushman, R.M., J.D. Piotroski and A.J. Smith 2004. “What Determines Corporate
Transparency?” Journal of Accounting Research 42 (2) May pp. 207-251.
Byrne, I. 2003. “Surveying Transparency and Disclosure in Business” in H. Fletcher
“Corporate Transparency in the Fight against Corruption” Chapter 3 of
Global Corruption Report 2003, pp. 40-41. www.globalcorruptionreport.org/gcr2003.html.
Chau, G.K. and SJ Gray 2002. “Ownership structure and corporate voluntary

23
disclosure in Hong Kong and Singapore” The International Journal of
Accounting 37, pp. 247-265
Choi, F.D.S. and G.K. Meek 2005. International Accounting 5th
ed. Upper Saddle
River, New Jersey: Pearson Education.
Chow C. & A. Wong-Boren 1987 “Voluntary Disclosure by Mexican Companies”
Accounting Review July pp533-541.
Chow, C. W. and A. Wong-Boren 1987. “Voluntary Financial Disclosure by
Mexican Corporations”. The Accounting Review, 62(3), pp. 533 – 541.
CIFAR 1995. Center for International Financial Analysis and Research International
Accounting and Auditing Trends 4th
ed. Edited by V.B. Bavishi. Princeton,
New Jersey: CIFAR
Claessens, S., S. Djankov, and L.H.P. Lang, 2000. “The Separation of Ownership
and Control in East Asian Corporations” Journal of Financial Economics 58,
pp. 81-112.
Claessens, S., S. Djankov and T. Nenova 2000. “Corporate Risk Around the World”
World Bank Policy Research Working paper No. 2271.
http://ssrn.com/abstract=629121.
Clarkson, P., D. Hanna, G. Richardson & R. Thompson, 2011 “The impact of IFRS
adoption on the value relevance of book value and earnings” Journal of
Contemporary Accounting & Economics 7 pp. 1-17
CLSA 2001. “CG Watch: Corporate Governance in Emerging Markets – Saints and
Sinners Who‟s Got Religion?” www.clsa.com.
Cohen, J., P. Cohen, S.G. West and L.S. Aiken 2003. Applied Multiple Regression /
Correlation Analysis for the Behavioral Sciences 3rd
ed. Mahwah, New
Jersey: Lawrence Erlbaum Associates.
Cooke, TE 1989 “Voluntary Corporate Disclosure by Swedish Companies” Journal
of International Financial Management and Accounting Summer, pp. 171-
195
Daske, H., L. Hail, C. Leuz and R. Verdi 2008 “Mandatory IFRS Reporting around
the World: Early Evidence on the Economic Consequences” Journal of
Accounting Research 46 (5) December, pp1085-1142
DeAngelo L 1981. “Auditor Size and Audit Quality” Journal of Accounting &
Economics 3(2) pp. 183-9
Deloitte Touche Tohmatsu 2002. “International Accounting Standards Presentation
and Disclosure Checklist” http://www.iasplus.com/fs/iaschk01.pdf
Deloitte Touche Tohmatsu, 2002. “GAAP Differences in your Pocket: IAS and
GAAP in the Peoples‟ Republic of China”
Ding, Y., O-K Hope, T. Jeanjean and H. Stolowy 2007. “Differences between
domestic accounting standards and IAS: Measurement, determinants and
implications” Journal of Accounting and Public Policy 26, pp. 1-38.
Doidge, C., G.A. Karolyi and R.M. Stulz 2007. “Why do Countries Matter so Much
for Corporate Governance?” Journal of Financial Economics 86 (1) pp1-39
Doupnik, T. and G. Tsakumis 2004. “A Critical Review of Tests of Gray‟s Theory
of Cultural Relevance and Suggestions for Future Research” Journal of
Accounting Literature 23, pp. 1-48.
Durand, R.B. and A. Tarca, 2005. “The Impact of US GAAP Reconciliation
Requirements on Choice of Foreign Stock Exchange for Firms from
Common law and Code law Countries” European Accounting Review 14 (4)
pp. 789-813.
24
Durnev, A. and E.H. Kim 2005. “To Steal or Not to Steal: Firm Attributes, Legal
Environment, and Valuation” The Journal of Finance 60 (3) June, pp. 1461-
1493.
Field, A. 2005. Discovering Statistics Using SPSS 2nd
ed. London: Sage
Publications.
Fields, T., T. Lys and L. Vincent, 2001, “Empirical research on accounting choice”
Journal of Accounting and Economics 31: 255-307
Firth, M. 1980 “Raising Finance and Firms‟ Corporate Reporting Policies”, Abacus
16 (2) December, pp100-115.
Foster, G. 1986. Financial Statement Analysis 2nd
ed. Prentice-Hall.
Francis, J., I. Khurana, X. Martin & R. Pereira 2008: The Role of Firm-Specific
Incentives and Country Factors in Explaining Voluntary IAS Adoptions:
Evidence from Private Firms, European Accounting Review, 17:2, 331-360
Francis, J.R., I.K. Khurana, X. and R. Pereira 2005. “Disclosure Incentives and
Effects on Cost of Capital Around the World” The Accounting Review 80 (4)
October, forthcoming.
Frost, C.A., E.A. Gordon and G. Pownall 2005. “Financial Reporting Quality,
Disclosure, and Emerging Market Companies‟ Access to Capital in Global
Equity Markets”. 12 September. http://ssrn.com/abstract=802824.
Gray SJ, G.K. Meek, and C.B. Roberts 1995 “International Capital Market Pressures
and Voluntary Annual Report Disclosures by US and UK Multinationals”
Journal of International Financial Management and Accounting (USA) 6
(1) Spring, pp. 43-68.
Gray, S.J. 1988. “Towards a Theory of Cultural Influence on the Development of
Accounting Systems Internationally” Abacus 24 (1) March, 1-15.
Haniffa, R.M and T.E. Cooke 2002. “Culture, Corporate Governance and Disclosure
in Malaysian Corporations” Abacus, 38 (3), pp. 317-349
Hatfield, H.R. 1911. “Some Variations in Accounting Practice in England, France,
Germany and the United States” reprinted in Journal of Accounting Research 4 (2)
(Autumn, 1966): 169-182.
Healy, P.M. and K.G. Palepu, 2001. “Information asymmetry, corporate disclosure
and the capital markets: a review of the empirical disclosure on literature”,
Journal of Accounting and Economics 31:405-440
Ho, S. S., and Wong, K. S. 2001. “A Study of Corporate Disclosure Practice and
Effectiveness in Hong Kong”. Journal of International Financial
Management and Accounting, 12(1), pp. 75 – 102.
Ho, S.S. M. and K.S. Wong, 2002, “A study of the relationship between corporate
governance structures and the extent of voluntary disclosure”, Journal of
International Accounting, Auditing and Taxation 10: 139-156
Hofstede, G. 1980. Cultures Consequences: International Differences in Work
Related Values. Beverly Hills: Sage Publications.
Hofstede, G. and Hofstede G.J. 2005. Cultures and Organizations: Software of the
Mind 2nd
ed. New York: McGraw-Hill.
Holthausen, R.W. 2003. “Testing the Relative Power of Accounting Standards
Versus Incentives and Other Institutional Features to Influence the Outcome
of Financial Reporting in an International Setting” Journal of Accounting
and Economics 36, pp.271-283.
Hope, O-K. 2003. “Disclosure Practices, Enforcement of Accounting Standards,
and Analysts‟ Forecast Accuracy: An International Study” Journal of

25
Accounting Research 41 (2) May, pp. 235-272.
Horton, J and G. Serafim, 2010 “Market reaction to and valuation of IFRS
reconciliation adjustments: first evidence from the UK” Review of
Accounting Studies 15 pp. 725-751.
Hossain, M., L. M. Tan, and M. Adams. 1994. Voluntary Disclosure in an Emerging
Capital Market: Some Empirical Evidence from Companies Listed on the
Kuala Lumpur Stock Exchange. The International Journal of Accounting.
29: 334-351.
Hossain, M., Perera, M. H. B., and Rahman, A. R., 1995, “Voluntary Disclosure in
the Annual Reports of New Zealand Companies”, Journal of International
Financial Management and Accounting, 6(1), pp. 69–85.
Hung, M. 2001. “Accounting Standards and Value Relevance of Financial
Statements: An International Analysis” Journal of Accounting and
Economics 30, pp401-420.
IASPlus Accounting Standards Updates by Jurisdiction at
http://www.iasplus.com/country/country.htm (accessed 10 January 2012)
Jaggi, B. and P.Y. Low 2000. “Impact of Culture, Market Forces, and Legal System
on Financial Disclosures” International Journal of Accounting 35 (4) pp.
495-519.
Jeanjean, T., C. Lesage and H. Stolowy 2010. “Why do you speak English (in your
annual report)? International Journal of Accounting 45 pp200-223.
Jensen, M. and W. Meckling 1976. “Theory of the Firm: Managerial Behaviour,
Agency Costs and Ownership Structure” Journal of Financial Economics
October, pp305-360.
Johnson, S, R. La Porta, R. Lopez-de-Silanes & A. Shleifer, 2000. “Tunneling”
American Economic Review 90 (2), May, pp22-27.
Kaufman, Kraay and Mastruzzi 2003. Governance Matters III: Governance
Indicators for 1996-2002 World Bank Policy Research Working Paper 3106.
Kemp, S. and J. Knapp (eds) 2005. CA Financial Reporting Handbook 2005.
Milton, Qld John Wiley & Sons
Kimbro, M.B. 2002. “A Cross-Country Empirical Investigation of Corruption and
its Relationship to Economic, Cultural, and Monitoring Institutions: An
Examination of the Role of Accounting and Financial Statements Quality”
Journal of Accounting, Auditing & Finance pp. 325-349.
Kogut, B. and H. Singh 1988. “The Effect of National Culture on Choice of Entry
Mode” Journal of International Business Studies 19 (3) Autumn, 411-432
Kurtzman, J. G. Yago and T. Phumiwasana 2004. The Opacity Index: The Global
Costs of Opacity MIT Sloan Management Review 2004.
La Porta, R., F. Lopez-de-Silanes, A. Shleifer and R.W. Vishny 1998. “Law and
Finance” The Journal of Political Economy 106 (6) December, pp. 1113-
1155.
La Porta, R., F. Lopez-de-Silanes, and A. Shleifer 1999. “Corporate Ownership
Around the World” The Journal of Finance 54 (2) April pp. 471-517.
Landsman, W., E. Maydew and J. Thornock, “The information content of annual
earnings announcements and mandatory adoption of IFRS” Journal of
Accounting & Economics forthcoming
Leuz, C., D. Nanda and P. Wysocki 2003. “Earnings management and Institutional
Factors: An International Comparison” Journal of Financial Economics 69,
pp. 505-527
Levine, R. and S.J. Zervos 1993. “What We have learned About Policy and Growth

26
from Cross-Country Regressions?” The American Economic Review 83 (2)
May pp. 426-430.
Levitt, A. 1998. “The „Numbers Game‟” presentation at the New York University
Center for Law and Business, New York, September 28, 1998, as cited by
M.Z. Rahman “The Role of Accounting Disclosure in the East Asian
Financial Crisis: Lessons Learned?” Transnational Corporations, 7 (3), pp.
1-52. (1998).
Meek, G. K., Roberts, C. B., and Gray S. J., 1995, “Factors Influencing Voluntary
Annual Report Disclosures by U.S., U.K. and Continental European
Multinational Corporations”, Journal of International Business Studies,
26(3), pp. 555–572.
Miller, G.S. 2002. “Earnings Performance and Discretionary Disclosure” Journal of
Accounting Research 40 (1) March, pp. 173-203.
Morris, R.D. 1987 “Signalling, Agency Theory and Accounting Policy Choice”
Accounting and Business Research Winter pp.47-56.
Morris, R.D. B.U.S. Ho, T. Pham and S.J. Gray 2004. “Financial Reporting
Practices of Indonesian Companies Before and After the Asian Financial
Crisis” Asia-Pacific Journal of Accounting & Economics 11 (2) December
pp. 1-27.
Nobes, C. 2001 GAAP 2001 Survey www.iasplus.com
Nobes, C. and R. Parker 2000. Comparative International Accounting 6th
ed.
Harlow: Financial Times Prentice-Hall.
Patel, S.A., A. Balic, and L. Bwakira 2002. “Measuring Transparency and
Disclosure at Firm-Level in Emerging markets” Emerging Markets Review 2,
pp. 325-337.
Pope, P. and M. Walker 1999. “International Differences in the Timeliness,
Conservatism, and Classification of Earnings” Journal of Accounting
Research 37 (Supplement), pp. 53-87.
Radebaugh, L.H. and S.J. Gray 2002. International Accounting & Multinational
Enterprises 5th
ed. New York: John Wiley.
Schweikart, J.A., S.J. Gray and S.B. Salter 1996 „An Interview with Sir Bryan
Carsberg, Secretary-General of the International Accounting Standards
Committee‟, Accounting Horizons, 10 (1) March pp.110-117..
Spence, M 1973 “Job Market Signalling” Quarterly Journal of Economics 87
pp355-374
Standard & Poor‟s 2001. “Standard & Poor‟s Transparency and Disclosure Study
for International Investors” www.standardandpoors.com
Street DL and SJ Gray 2001. Observance of International Accounting Standards:
Factors Explaining Non-Compliance ACCA Research Report No. 74
Street, D. 2002. “GAAP Convergence 2002: A Survey of National Efforts to
promote and Achieve Convergence with International Financial Reporting
Standards” http://www.ifac.org.
Sutthachai, S. and T. Cooke 2009 “An Analysis of Thai Financial Reporting
Practices and the Impact of the 1997 Economic Crisis” Abacus 45 (4) pp.
493-517.
Taylor, S. 1987. “International Accounting Standards: An Alternative Rationale”
Abacus 23 (2) pp. 157-171.
Verrechia, R. 1983. “Discretionary Disclosure” Journal of Accounting and
Economics 5 (3) pp. 179-194.
Verrechia, R. 1990. “Information Quality and Discretionary Disclosure” Journal of
27
Accounting and Economics 12 March pp. 365-380.
Wallace, R. S. Olusegan and K. Naser. 1995. “Firm-specific determinants of the
comprehensiveness of mandatory disclosure in the corporate annual reports
of firms listed on the stock exchange of Hong Kong”, Journal of Accounting
and Public Policy, 14(4): 311-368.
Wan-Hussin, W.N. 2009. “The impact of family-firm structure and board
composition on corporate transparency: Evidence based on segment-
disclsoures in Malaysia” International Journal of Accounting 44 (4) pp. 313-
333.
Watts, R. and J. Zimmerman 1986. Positive Accounting Theory Prentice-Hall.
Willard Report, 1998. “Report of the Working Group on Transparency and
Accountability”, G22 Working Group, October.
28
EXHIBIT 1
PANEL A: DEFINITION AND MEASUREMENT OF VARIABLES
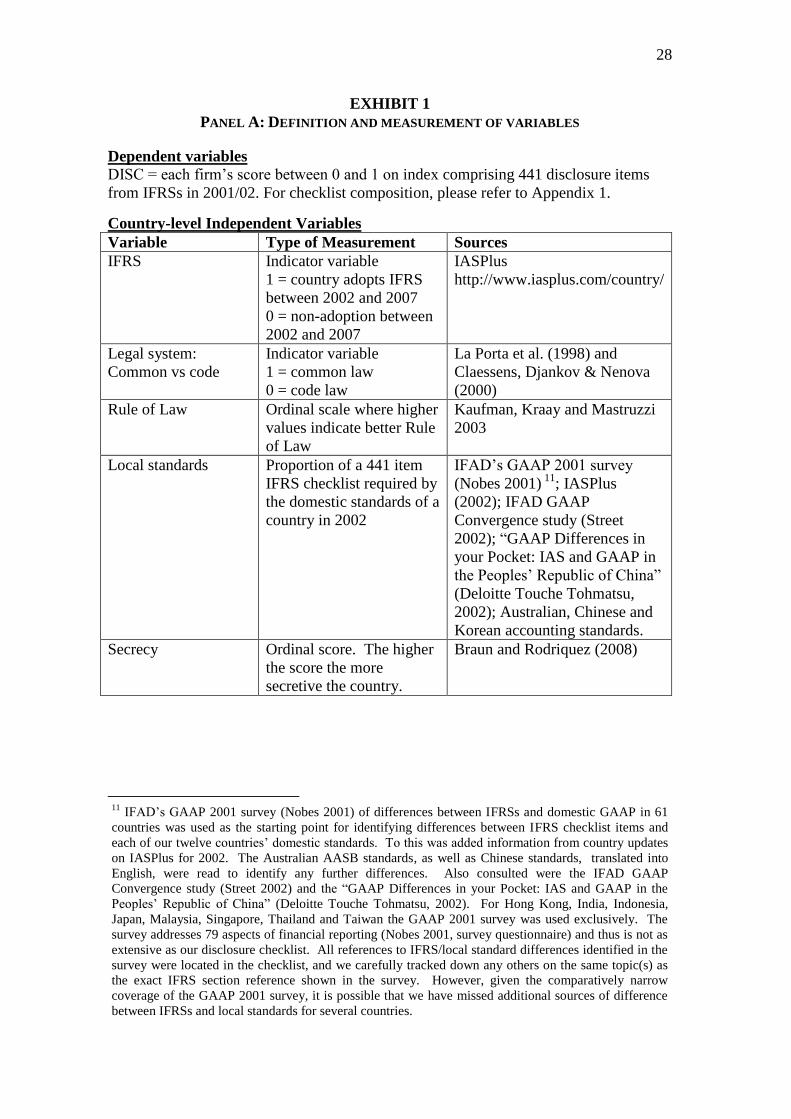
Dependent variables
DISC = each firm‟s score between 0 and 1 on index comprising 441 disclosure items
from IFRSs in 2001/02. For checklist composition, please refer to Appendix 1.
Country-level Independent Variables
Variable Type of Measurement Sources
IFRS Indicator variable
1 = country adopts IFRS
between 2002 and 2007
0 = non-adoption between
2002 and 2007
IASPlus
http://www.iasplus.com/country/
Legal system:
Common vs code
Indicator variable
1 = common law
0 = code law
La Porta et al. (1998) and
Claessens, Djankov & Nenova
(2000)
Rule of Law Ordinal scale where higher
values indicate better Rule
of Law
Kaufman, Kraay and Mastruzzi
2003
Local standards Proportion of a 441 item
IFRS checklist required by
the domestic standards of a
country in 2002
IFAD‟s GAAP 2001 survey
(Nobes 2001) 11
; IASPlus
(2002); IFAD GAAP
Convergence study (Street
2002); “GAAP Differences in
your Pocket: IAS and GAAP in
the Peoples‟ Republic of China”
(Deloitte Touche Tohmatsu,
2002); Australian, Chinese and
Korean accounting standards.
Secrecy Ordinal score. The higher
the score the more
secretive the country.
Braun and Rodriquez (2008)
11
IFAD‟s GAAP 2001 survey (Nobes 2001) of differences between IFRSs and domestic GAAP in 61
countries was used as the starting point for identifying differences between IFRS checklist items and
each of our twelve countries‟ domestic standards. To this was added information from country updates
on IASPlus for 2002. The Australian AASB standards, as well as Chinese standards, translated into
English, were read to identify any further differences. Also consulted were the IFAD GAAP
Convergence study (Street 2002) and the “GAAP Differences in your Pocket: IAS and GAAP in the
Peoples‟ Republic of China” (Deloitte Touche Tohmatsu, 2002). For Hong Kong, India, Indonesia,
Japan, Malaysia, Singapore, Thailand and Taiwan the GAAP 2001 survey was used exclusively. The
survey addresses 79 aspects of financial reporting (Nobes 2001, survey questionnaire) and thus is not as
extensive as our disclosure checklist. All references to IFRS/local standard differences identified in the
survey were located in the checklist, and we carefully tracked down any others on the same topic(s) as
the exact IFRS section reference shown in the survey. However, given the comparatively narrow
coverage of the GAAP 2001 survey, it is possible that we have missed additional sources of difference
between IFRSs and local standards for several countries.

29
Firm Level Independent Variables
Variables Explanation
SIZE Natural log of firm total assets in US $m
LEV Total liabilities/Total assets
ROR NPAT/Total assets
BSEG Number of business segments
ISALDum Dummy variable
1=firm generated revenue in countries other than country of
incorporation
0=firm did not generate revenue in countries other than
country of incorporation
KRDDum Dummy variable
1= firm raised debt capital in the financial year
0= firm did not raise debt capital in the financial year
KREDum Dummy variable
1= firm raised equity capital in the financial year
0= firm did not raise equity capital in the financial year
AUDITOR Dummy variable
1=firm‟s financial statements were audited by Big 5 auditor
0=firm‟s financial statements were not audited by Big 5
auditor
IDIR Dummy variable
1 = firm has independent directors on board
0 = firm does not have independent directors on board
AC Dummy variable
1= firm has an audit committee
0= firm does not have an audit committee
DUALD Dummy variable
1 = Chairman and CEO are different persons
0 = Chairman and CEO are the same person
SSH Accumulated % of shareholding <5%.
Where the information is absent, the company is assumed to
be widely held, i.e. SSH =1; if the information for block
ownership is present, SSH is estimated to be 1 – highest
blockownership OR 1 – (sum of % of block ownership >5%)
TOPSH % holding of largest shareholder
FCTL3 Dummy variable for block ownership
2 = 30% or more of shares are held by individuals, private
firms or government body;
1 = 30% or more of shares are held by a public company;
0 = otherwise
PANEL B: SOURCES OF COMPANIES’ ANNUAL REPORTS
Country Sample size Data sources
Australia 41 Connect4, Aspect, and Mergent Online Databases
China 12 Mergent Online, Chinese Securities and Regulation
Commission‟s website
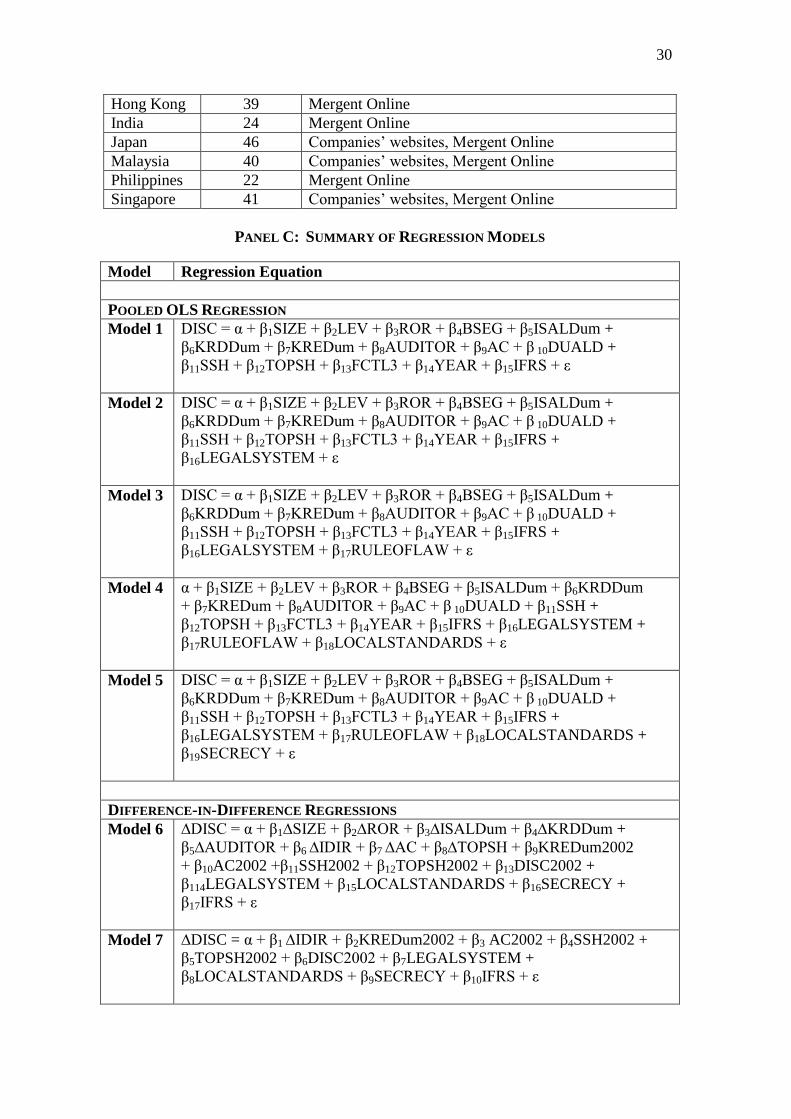
30
Hong Kong 39 Mergent Online
India 24 Mergent Online
Japan 46 Companies‟ websites, Mergent Online
Malaysia 40 Companies‟ websites, Mergent Online
Philippines 22 Mergent Online
Singapore 41 Companies‟ websites, Mergent Online
PANEL C: SUMMARY OF REGRESSION MODELS
Model Regression Equation
POOLED OLS REGRESSION
Model 1 DISC = α + β1SIZE + β2LEV + β3ROR + β4BSEG + β5ISALDum +
β6KRDDum + β7KREDum + β8AUDITOR + β9AC + β 10DUALD +
β11SSH + β12TOPSH + β13FCTL3 + β14YEAR + β15IFRS + ε
Model 2 DISC = α + β1SIZE + β2LEV + β3ROR + β4BSEG + β5ISALDum +
β6KRDDum + β7KREDum + β8AUDITOR + β9AC + β 10DUALD +
β11SSH + β12TOPSH + β13FCTL3 + β14YEAR + β15IFRS +
β16LEGALSYSTEM + ε
Model 3 DISC = α + β1SIZE + β2LEV + β3ROR + β4BSEG + β5ISALDum +
β6KRDDum + β7KREDum + β8AUDITOR + β9AC + β 10DUALD +
β11SSH + β12TOPSH + β13FCTL3 + β14YEAR + β15IFRS +
β16LEGALSYSTEM + β17RULEOFLAW + ε
Model 4 α + β1SIZE + β2LEV + β3ROR + β4BSEG + β5ISALDum + β6KRDDum
+ β7KREDum + β8AUDITOR + β9AC + β 10DUALD + β11SSH +
β12TOPSH + β13FCTL3 + β14YEAR + β15IFRS + β16LEGALSYSTEM +
β17RULEOFLAW + β18LOCALSTANDARDS + ε
Model 5 DISC = α + β1SIZE + β2LEV + β3ROR + β4BSEG + β5ISALDum +
β6KRDDum + β7KREDum + β8AUDITOR + β9AC + β 10DUALD +
β11SSH + β12TOPSH + β13FCTL3 + β14YEAR + β15IFRS +
β16LEGALSYSTEM + β17RULEOFLAW + β18LOCALSTANDARDS +
β19SECRECY + ε
DIFFERENCE-IN-DIFFERENCE REGRESSIONS
Model 6 ∆DISC = α + β1∆SIZE + β2∆ROR + β3∆ISALDum + β4∆KRDDum +
β5∆AUDITOR + β6 ∆IDIR + β7 ∆AC + β8∆TOPSH + β9KREDum2002
+ β10AC2002 +β11SSH2002 + β12TOPSH2002 + β13DISC2002 +
β114LEGALSYSTEM + β15LOCALSTANDARDS + β16SECRECY +
β17IFRS + ε
Model 7 ∆DISC = α + β1 ∆IDIR + β2KREDum2002 + β3 AC2002 + β4SSH2002 +
β5TOPSH2002 + β6DISC2002 + β7LEGALSYSTEM +
β8LOCALSTANDARDS + β9SECRECY + β10IFRS + ε
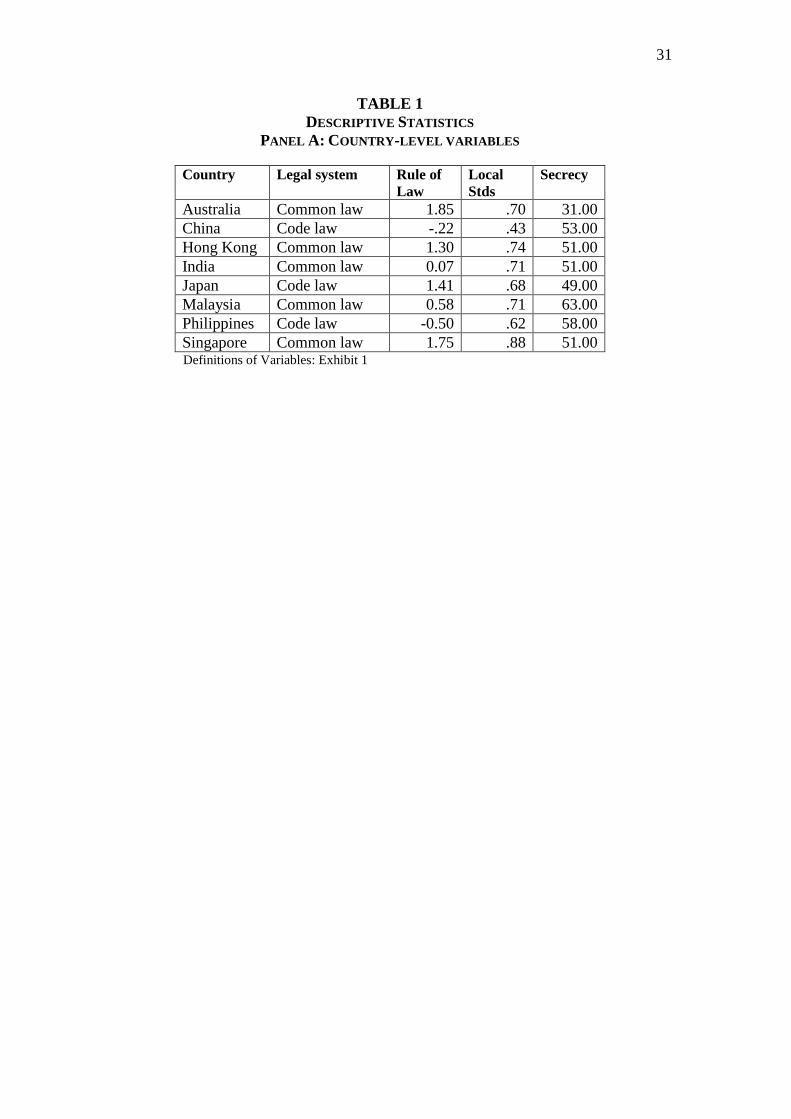
31
TABLE 1
DESCRIPTIVE STATISTICS
PANEL A: COUNTRY-LEVEL VARIABLES
Country Legal system Rule of
Law
Local
Stds
Secrecy
Australia Common law 1.85 .70 31.00
China Code law -.22 .43 53.00
Hong Kong Common law 1.30 .74 51.00
India Common law 0.07 .71 51.00
Japan Code law 1.41 .68 49.00
Malaysia Common law 0.58 .71 63.00
Philippines Code law -0.50 .62 58.00
Singapore Common law 1.75 .88 51.00 Definitions of Variables: Exhibit 1
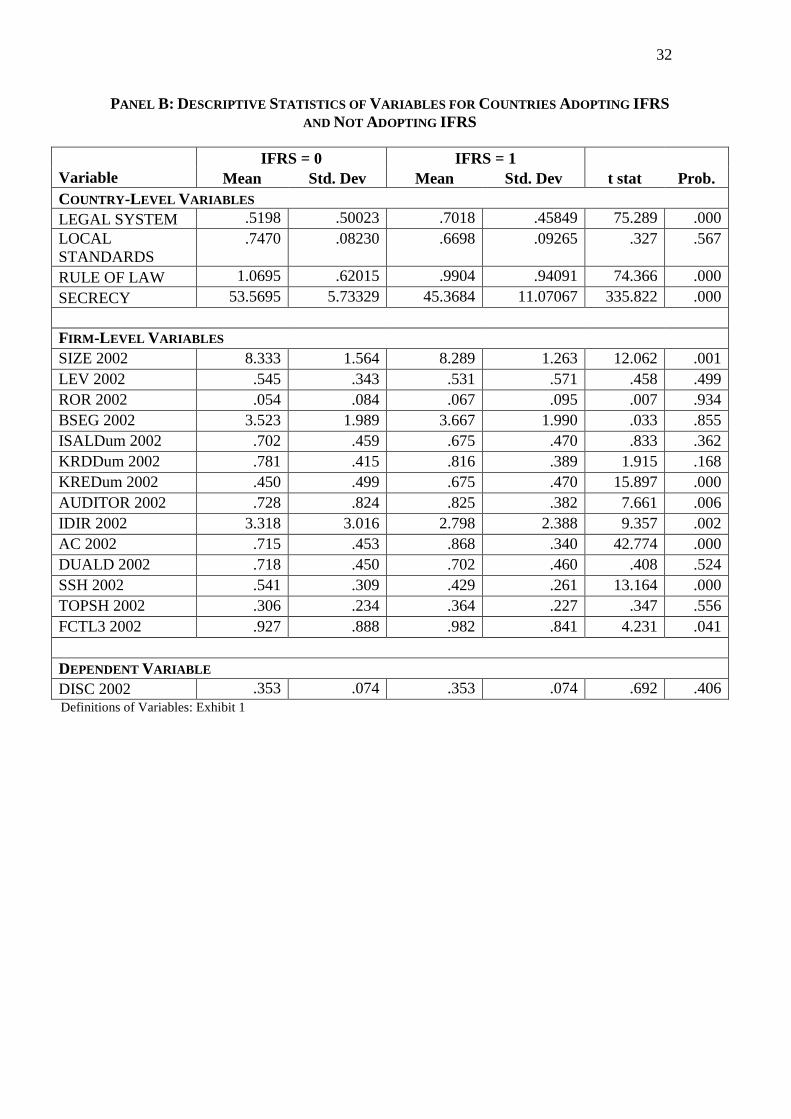
32
PANEL B: DESCRIPTIVE STATISTICS OF VARIABLES FOR COUNTRIES ADOPTING IFRS
AND NOT ADOPTING IFRS
IFRS = 0 IFRS = 1
Variable Mean Std. Dev Mean Std. Dev t stat Prob.
COUNTRY-LEVEL VARIABLES
LEGAL SYSTEM .5198 .50023 .7018 .45849 75.289 .000
LOCAL
STANDARDS
.7470 .08230 .6698 .09265 .327 .567
RULE OF LAW 1.0695 .62015 .9904 .94091 74.366 .000
SECRECY 53.5695 5.73329 45.3684 11.07067 335.822 .000
FIRM-LEVEL VARIABLES
SIZE 2002 8.333 1.564 8.289 1.263 12.062 .001
LEV 2002 .545 .343 .531 .571 .458 .499
ROR 2002 .054 .084 .067 .095 .007 .934
BSEG 2002 3.523 1.989 3.667 1.990 .033 .855
ISALDum 2002 .702 .459 .675 .470 .833 .362
KRDDum 2002 .781 .415 .816 .389 1.915 .168
KREDum 2002 .450 .499 .675 .470 15.897 .000
AUDITOR 2002 .728 .824 .825 .382 7.661 .006
IDIR 2002 3.318 3.016 2.798 2.388 9.357 .002
AC 2002 .715 .453 .868 .340 42.774 .000
DUALD 2002 .718 .450 .702 .460 .408 .524
SSH 2002 .541 .309 .429 .261 13.164 .000
TOPSH 2002 .306 .234 .364 .227 .347 .556
FCTL3 2002 .927 .888 .982 .841 4.231 .041
DEPENDENT VARIABLE
DISC 2002 .353 .074 .353 .074 .692 .406
Definitions of Variables: Exhibit 1

33
PANEL C: INDEPENDENT VARIABLES DESCRIPTIVE STATISTICS FOR 2002 AND 2007
Year 2002 Year 2007
Variable Mean Std. Dev Mean Std. Dev t stat Prob.
SIZE 8.315 1.440 8.740 1.522 8.366 .000
LEV .539 .454 .499 .304 -1.318 .189
ROR .059 .089 .120 .242 3.911 .000
BSEG 3.585 1.987 3.619 2.036 .292 .771
ISALDum .691 .463 .785 .412 3.578 .000
KRDDum .796 .404 .732 .444 -2.029 .043
KREDum .547 .499 .517 .501 -.799 .425
AUDITOR .770 .671 .838 .369 1.772 .078
IDIR 3.094 2.771 4.449 2.875 8.076 .000
AC .781 .414 .947 .225 6.295 .000
DUALD .711 .453 .717 .451 .187 .852
SSH .493 .294 .458 .623 -.949 .343
TOPSH .331 .232 .376 .406 2.071 .039
FCTL3 .951 .867 1.042 .827 1.486 .138 Definitions of Variables: Exhibit 1

34
TABLE 2
DESCRIPTIVE STATISTICS
DEPENDENT VARIABLE
DISC
2002
DISC
2007 Difference
T (two-tailed
sig)
Full Sample Mean .365 .468 .103 .000
N = 265 Std Dev .075 .111
Australia Mean .388 .503 .115 .000
N = 41 Std Dev .028 .060
China Mean .315 .461 .146 .005
N = 12 Std Dev .037 .150
Hong Kong Mean .430 .499 .069 .001
N = 39 Std Dev .085 .104
India Mean .290 .383 .094 .000
N = 24 Std Dev .047 .112
Japan Mean .322 .414 .092 .000
N = 46 Std Dev .030 .125
Malaysia Mean .363 .469 .106 .000
N = 40 Std Dev .065 .097
Philippines Mean .316 .508 .192 .000
N = 22 Std Dev .054
Singapore Mean .416 .493 .077 .000
N = 41 Std Dev .082 .087
One way
ANOVA
comparing
countries
F 5.933 24.306
Prob. .000 .000
. Definitions of Variables: Exhibit 1

35
TABLE 3
PEARSON CORRELATIONS OF DISC WITH COUNTRY-LEVEL INDEPENDENT VARIABLES
DISC
LEGAL
SYSTEM SECRECY
RULE OF
LAW
LOCAL
STANDARD
DISC 1
LEGAL
SYSTEM
.197**
1
SECRECY -.080 -.138**
1
RULE OF
LAW
.192**
.348**
-.630**
1
LOCAL
STANDARD
.175**
.607**
-.037 .614**
1
**Correlation is significant at the 0.01 level (2-tailed)
Definitions of Variables: Exhibit 1
N = 534-535 throughout.

36
TABLE 4 PEARSON CORRELATIONS
PANEL A: PEARSON CORRELATIONS OF DISC WITH FIRM-LEVEL INDEPENDENT VARIABLES IN YEAR 2002
DISC lnsize leverage ror busseg isalesdum debtraise equityrase auditor indepdir auditctee duald smallsh topsh ctrl30
2002 2002 2002 2002 2002 2002 2002 2002 2002 2002 2002 2002 2002 2002 2002
DISC
2002
1
SIZE
2002
-.005 1
LEV
2002
.008 .149* 1
ROR
2002
-.042 -.263**
-.068 1
BSEG
2002
.327**
.200**
-.046 -.136* 1
ISALDum
2002
.308**
-.044 -.040 -.049 .251**
1
KRDDum
2002
.054 .203**
.180**
-.097 .140* .087 1
KREDum
2002
.236**
-.055 .035 .107 .020 .047 -.027 1
AUDITOR
2002
.257**
-.087 -.050 .000 .039 .160**
.022 .117 1
IDIR
2002
.185**
-.160**
-.019 .031 -.076 -.027 -.213**
.042 .048 1
AC
2002
.266**
-.368**
-.137* .102 -.023 .060 -.154
* .215
** .240
** .503
** 1
DUALD
2002
-.011 -.036 .064 -.122* .022 -.031 .008 .005 .071 .052 .086 1
SSH
2002
-.139* .228
** .052 -.064 .193
** .049 .136
* -.037 -.161
** -.347
** -.476
** .077 1
TOPSH
2002
.101 -.108 -.135* .152
* -.168
** -.053 -.208
** .046 -.012 .301
** .382
** -.148
* -.765
**
FCTL3
2002
.044 .009 -.050 .049 -.084 -.010 -.148* -.025 .013 .328
** .308
** -.156
* -.503
** .599
** 1
**Correlation is significant at the 0.01 level (2-tailed)
Definitions of Variables: Exhibit 1
N=265 throughout, except for TOPSH, where N=263

37
PANEL B: PEARSON CORRELATIONS OF DISC WITH FIRM-LEVEL INDEPENDENT VARIABLES IN YEAR 2007
DISC lnsize leverage ror busseg isalesdum debtraise equityraise auditor indepdir auditctee duald smallsh topsh ctrl30
DISC 1
SIZE -.017 1
LEV .131* .141
* 1
ROR -.021 -.306**
.111 1
BSEG .248**
.246**
.039 .007 1
ISALDum .158* .101 .079 .052 .155
* 1
KRDDum .103 .200**
.137* -.205
** .130
* .057 1
KREDum .207**
.084 -.015 -.093 .094 .137* .200
** 1
AUDITOR .066 -.020 -.026 -.022 .008 .193**
-.104 -.077 1
IDIR .179**
-.059 -.004 -.015 .101 .120 -.012 .185**
.097 1
AC .122* -.095 .007 .033 .063 .081 -.066 .041 .033 .190
** 1
DUALD .038 -.056 .016 -.116 .035 -.064 -.021 -.004 .178**
.078 .038 1
SSH -.121* .043 .113 -.039 -.006 -.036 .101 -.082 .059 -.055 -.046 .066 1
TOPSH -.034 -.087 -.010 .065 -.090 -.091 -.194**
.076 -.003 .206**
.069 -.121* -.135
* 1
FCTL3 .003 -.073 -.124* .028 .005 -.141
* -.114 -.015 -.065 -.064 .116 -.050 -.104 .218
** 1
**Correlation is significant at the 0.01 level (2-tailed)
Definitions of Variables: Exhibit 1
N=262-265 throughout
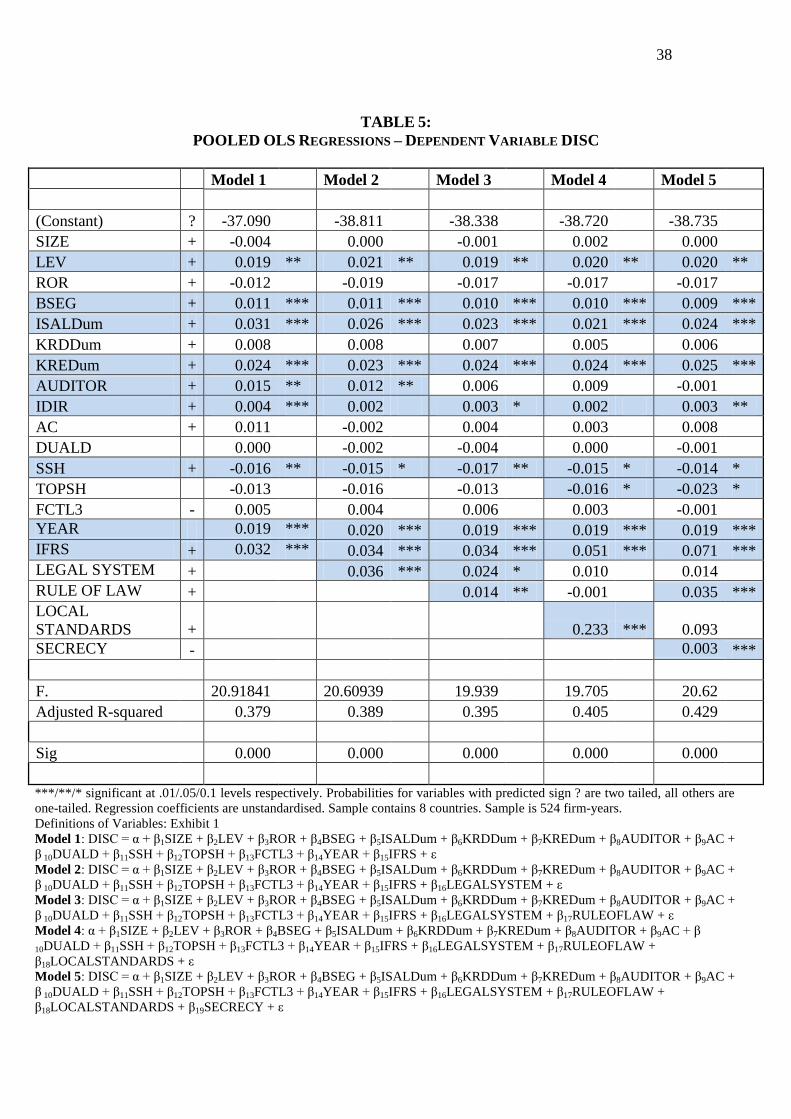
38
TABLE 5:
POOLED OLS REGRESSIONS – DEPENDENT VARIABLE DISC
Model 1 Model 2 Model 3 Model 4 Model 5
(Constant) ? -37.090 -38.811 -38.338 -38.720 -38.735
SIZE + -0.004 0.000 -0.001 0.002 0.000
LEV + 0.019 ** 0.021 ** 0.019 ** 0.020 ** 0.020 **
ROR + -0.012 -0.019 -0.017 -0.017 -0.017
BSEG + 0.011 *** 0.011 *** 0.010 *** 0.010 *** 0.009 ***
ISALDum + 0.031 *** 0.026 *** 0.023 *** 0.021 *** 0.024 ***
KRDDum + 0.008 0.008 0.007 0.005 0.006
KREDum + 0.024 *** 0.023 *** 0.024 *** 0.024 *** 0.025 ***
AUDITOR + 0.015 ** 0.012 ** 0.006 0.009 -0.001
IDIR + 0.004 *** 0.002 0.003 * 0.002 0.003 **
AC + 0.011 -0.002 0.004 0.003 0.008
DUALD 0.000 -0.002 -0.004 0.000 -0.001
SSH + -0.016 ** -0.015 * -0.017 ** -0.015 * -0.014 *
TOPSH -0.013 -0.016 -0.013 -0.016 * -0.023 *
FCTL3 - 0.005 0.004 0.006 0.003 -0.001
YEAR 0.019 *** 0.020 *** 0.019 *** 0.019 *** 0.019 ***
IFRS + 0.032 *** 0.034 *** 0.034 *** 0.051 *** 0.071 ***
LEGAL SYSTEM + 0.036 *** 0.024 * 0.010 0.014
RULE OF LAW + 0.014 ** -0.001 0.035 ***
LOCAL
STANDARDS + 0.233 *** 0.093
SECRECY - 0.003 ***
F. 20.91841 20.60939 19.939 19.705 20.62
Adjusted R-squared 0.379 0.389 0.395 0.405 0.429
Sig 0.000 0.000 0.000 0.000 0.000
***/**/* significant at .01/.05/0.1 levels respectively. Probabilities for variables with predicted sign ? are two tailed, all others are
one-tailed. Regression coefficients are unstandardised. Sample contains 8 countries. Sample is 524 firm-years.
Definitions of Variables: Exhibit 1
Model 1: DISC = α + β1SIZE + β2LEV + β3ROR + β4BSEG + β5ISALDum + β6KRDDum + β7KREDum + β8AUDITOR + β9AC +
β 10DUALD + β11SSH + β12TOPSH + β13FCTL3 + β14YEAR + β15IFRS + ε
Model 2: DISC = α + β1SIZE + β2LEV + β3ROR + β4BSEG + β5ISALDum + β6KRDDum + β7KREDum + β8AUDITOR + β9AC +
β 10DUALD + β11SSH + β12TOPSH + β13FCTL3 + β14YEAR + β15IFRS + β16LEGALSYSTEM + ε
Model 3: DISC = α + β1SIZE + β2LEV + β3ROR + β4BSEG + β5ISALDum + β6KRDDum + β7KREDum + β8AUDITOR + β9AC +
β 10DUALD + β11SSH + β12TOPSH + β13FCTL3 + β14YEAR + β15IFRS + β16LEGALSYSTEM + β17RULEOFLAW + ε
Model 4: α + β1SIZE + β2LEV + β3ROR + β4BSEG + β5ISALDum + β6KRDDum + β7KREDum + β8AUDITOR + β9AC + β
10DUALD + β11SSH + β12TOPSH + β13FCTL3 + β14YEAR + β15IFRS + β16LEGALSYSTEM + β17RULEOFLAW +
β18LOCALSTANDARDS + ε
Model 5: DISC = α + β1SIZE + β2LEV + β3ROR + β4BSEG + β5ISALDum + β6KRDDum + β7KREDum + β8AUDITOR + β9AC +
β 10DUALD + β11SSH + β12TOPSH + β13FCTL3 + β14YEAR + β15IFRS + β16LEGALSYSTEM + β17RULEOFLAW +
β18LOCALSTANDARDS + β19SECRECY + ε
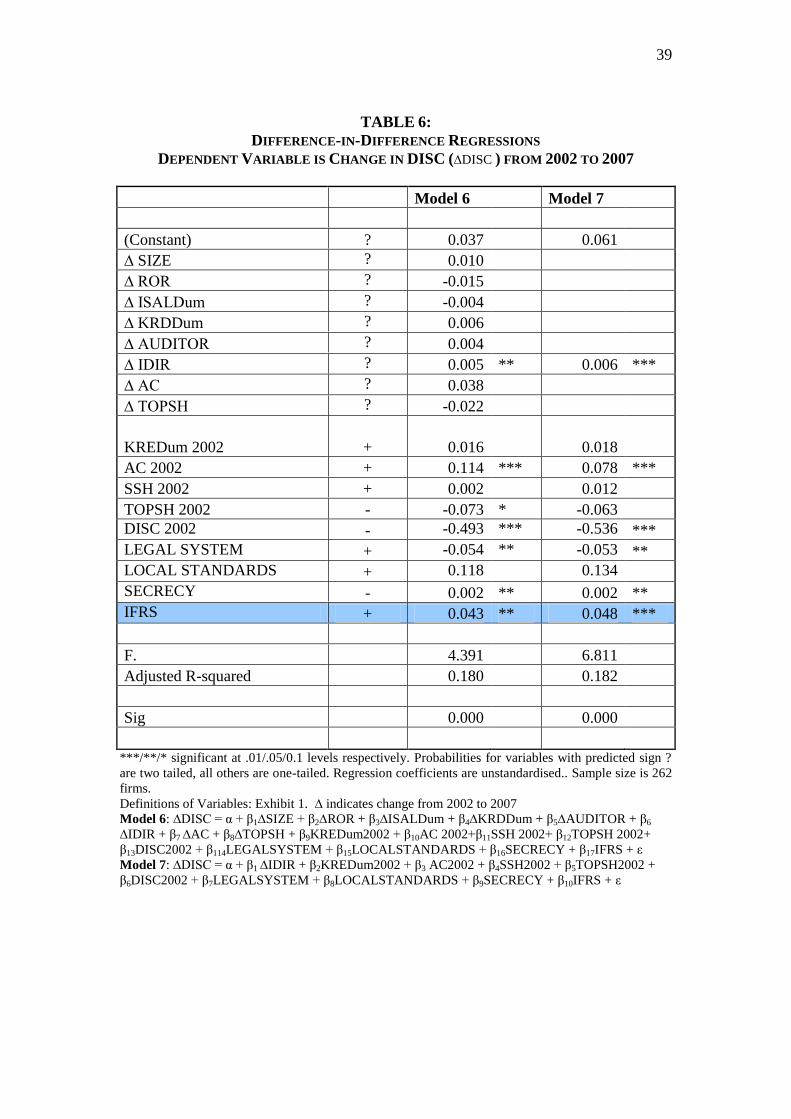
39
TABLE 6:
DIFFERENCE-IN-DIFFERENCE REGRESSIONS
DEPENDENT VARIABLE IS CHANGE IN DISC (∆DISC ) FROM 2002 TO 2007
Model 6 Model 7
(Constant) ? 0.037 0.061
∆ SIZE ? 0.010
∆ ROR ? -0.015
∆ ISALDum ? -0.004
∆ KRDDum ? 0.006
∆ AUDITOR ? 0.004
∆ IDIR ? 0.005 ** 0.006 ***
∆ AC ? 0.038
∆ TOPSH ? -0.022
KREDum 2002 + 0.016 0.018
AC 2002 + 0.114 *** 0.078 ***
SSH 2002 + 0.002 0.012
TOPSH 2002 - -0.073 * -0.063
DISC 2002 - -0.493 *** -0.536 ***
LEGAL SYSTEM + -0.054 ** -0.053 **
LOCAL STANDARDS + 0.118 0.134
SECRECY - 0.002 ** 0.002 **
IFRS + 0.043 ** 0.048 ***
F. 4.391 6.811
Adjusted R-squared 0.180 0.182
Sig 0.000 0.000
***/**/* significant at .01/.05/0.1 levels respectively. Probabilities for variables with predicted sign ?
are two tailed, all others are one-tailed. Regression coefficients are unstandardised.. Sample size is 262
firms.
Definitions of Variables: Exhibit 1. ∆ indicates change from 2002 to 2007
Model 6: ∆DISC = α + β1∆SIZE + β2∆ROR + β3∆ISALDum + β4∆KRDDum + β5∆AUDITOR + β6
∆IDIR + β7 ∆AC + β8∆TOPSH + β9KREDum2002 + β10AC 2002+β11SSH 2002+ β12TOPSH 2002+
β13DISC2002 + β114LEGALSYSTEM + β15LOCALSTANDARDS + β16SECRECY + β17IFRS + ε
Model 7: ∆DISC = α + β1 ∆IDIR + β2KREDum2002 + β3 AC2002 + β4SSH2002 + β5TOPSH2002 +
β6DISC2002 + β7LEGALSYSTEM + β8LOCALSTANDARDS + β9SECRECY + β10IFRS + ε

40
APPENDIX: THE CHECKLIST COMPOSITION AND DATA VALIDITY
The Checklist Composition
We developed our IFRS checklist from a very much larger checklist by Deloitte Touche
Tohmatsu (see http://www.iasplus.com/fs/iaschk01.pdf) which covered disclosure items
in IFRSs at the end of 2001. We carefully abridged that checklist to remove items that we
thought a skilled person could not accurately or reasonably observe when reading a
typical annual report. We also removed items which we considered would not be
applicable to all firms in our sample, obvious examples being Sections 9 and 12 but there
are some items within sections 1-8 that we also excluded. A summary of items in the
checklist appears below, with a cross-reference (by section) to the original Deloitte list.
Deloitte original by sections Number of items
in Deloitte
original checklist
Number in
our checklist
Section 1 Information accompanying financial
statements
5 0
Section 2 General principles of presentation 43 7
Section 3 Income statement 28 16
Section 4 Balance sheet 31 27
Section 5 Changes in equity 14 12
Section 6 Cash flow statement 20 18
Section 7 Accounting policies 46 39
Section 8 Explanatory notes to accounts about the
following:
General matters
Fundamental errors
Changes in accounting estimates
Segment reporting
Revenue
Discontinuing operations
Investment property income and expenses
Other income & expenses
Taxation
Extraordinary items
Other unusual items
Dividends
Property, plant, equipment
Investment property asset
Goodwill
Negative goodwill
Intangible assets
Subsidiaries
Business combinations
Investments in associates
Interests in joint ventures
Accounting for leases by lessors
Impairment of assets
Inventories
12
9
4
46
3
21
3
9
9
2
1
4
20
39
9
9
20
12
19
3
2
11
17
7
4
0
0
28
3
14
3
6
5
2
0
1
18
21
9
0
13
7
9
3
2
2
16
7
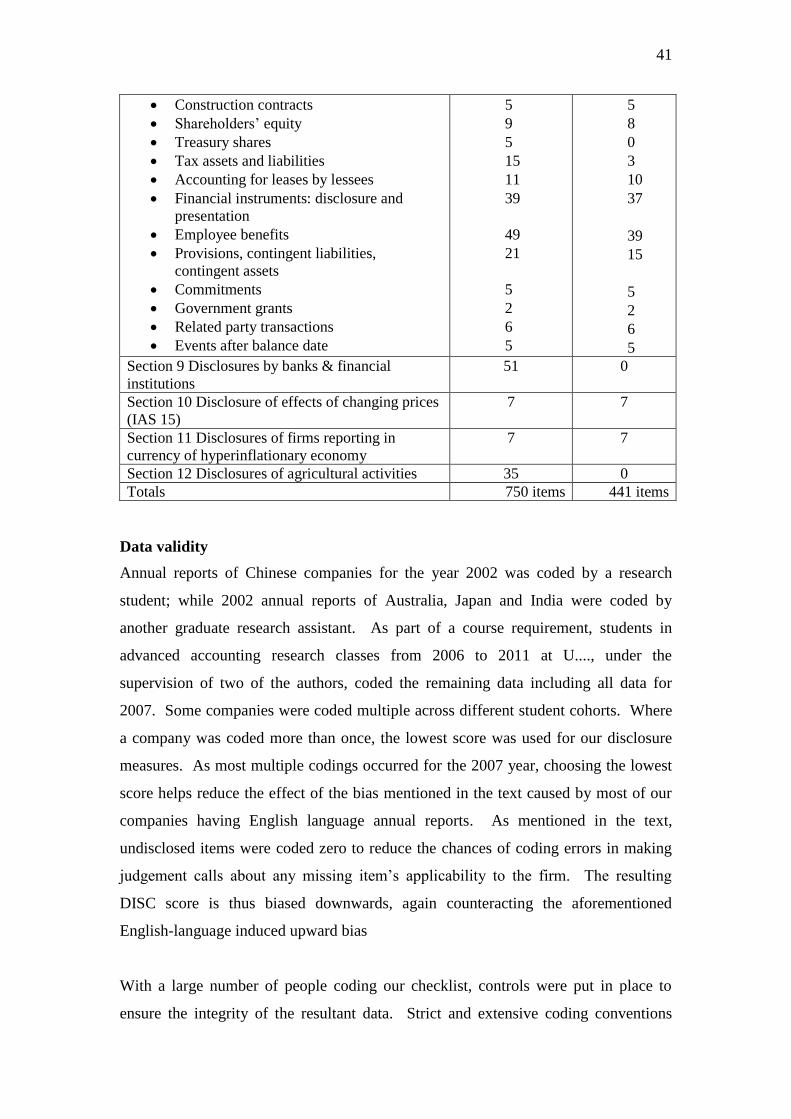
41
Construction contracts
Shareholders‟ equity
Treasury shares
Tax assets and liabilities
Accounting for leases by lessees
Financial instruments: disclosure and
presentation
Employee benefits
Provisions, contingent liabilities,
contingent assets
Commitments
Government grants
Related party transactions
Events after balance date
5
9
5
15
11
39
49
21
5
2
6
5
5
8
0
3
10
37
39
15
5
2
6
5
Section 9 Disclosures by banks & financial
institutions
51 0
Section 10 Disclosure of effects of changing prices
(IAS 15)
7 7
Section 11 Disclosures of firms reporting in
currency of hyperinflationary economy
7 7
Section 12 Disclosures of agricultural activities 35 0
Totals 750 items 441 items
Data validity
Annual reports of Chinese companies for the year 2002 was coded by a research
student; while 2002 annual reports of Australia, Japan and India were coded by
another graduate research assistant. As part of a course requirement, students in
advanced accounting research classes from 2006 to 2011 at U...., under the
supervision of two of the authors, coded the remaining data including all data for
2007. Some companies were coded multiple across different student cohorts. Where
a company was coded more than once, the lowest score was used for our disclosure
measures. As most multiple codings occurred for the 2007 year, choosing the lowest
score helps reduce the effect of the bias mentioned in the text caused by most of our
companies having English language annual reports. As mentioned in the text,
undisclosed items were coded zero to reduce the chances of coding errors in making
judgement calls about any missing item‟s applicability to the firm. The resulting
DISC score is thus biased downwards, again counteracting the aforementioned
English-language induced upward bias
With a large number of people coding our checklist, controls were put in place to
ensure the integrity of the resultant data. Strict and extensive coding conventions

42
were established at the beginning for all coders to follow and all coders were
supervised and encouraged to ask advice of the researchers if coding difficulties
arose.