the impact of immigration and immigration...
TRANSCRIPT

729 15th Street, NW • 2nd Floor• Washington, DC 20005 • Tel: 202.544.9200 • www.newpolicyinstitute.org
The Impact of Immigration and Immigration Reform on the Wages of American Workers
Robert J. Shapiro and Jiwon Vellucci
May 2010

1
729 15th Street, NW • 2nd Floor• Washington, DC 20005 • Tel: 202.544.9200 • www.newpolicyinstitute.org
The Impact of Immigration and Immigration Reform on the Wages of American Workers
Robert Shapiro and Jiwon Vellucci
Executive Summary
As the debate on comprehensive immigration reform has been rejoined, alarming amounts of misinformation are being presented as facts. This report corrects some of this misinformation by reviewing the empirical evidence and evaluating the real economic effects of the recent waves of immigrants into the United States by analyzing the role of immigrants in our labor markets and economy. This report presents an accurate portrait of our immigrant population, dispels misconceptions about undocumented immigrants, and reviews the evidence and analysis regarding the wage and other economic effects of both immigration and reforms to provide undocumented immigrants a path to legal status.
• Immigration Population Demographics: More than one-third of recent immigrants come from Asia
and Europe, while less than 57 percent come from Mexico and Latin America. A substantially larger share of immigrants than native-born Americans lack a high school diploma; but roughly equal shares of both groups -- between 28 percent and 30 percent – hold college or graduate degrees, and more than half of immigrants from Asia are college-educated or better.
• Misconceptions about Undocumented Immigrants: Two-thirds of immigrants are naturalized citizens or legal permanent resident aliens, 4 percent have legal status as temporary migrants, and 30 percent are undocumented. While undocumented male immigrants are generally low-skilled, they also have the highest labor participation rates in the nation: Among men age 18 to 64 years, 94 percent of undocumented immigrants work or actively seek work, compared to 83 percent of native-born Americans, and 85 percent of immigrants with legal status.
• Economic Analysis on the Impact of Immigration on Wages: A careful review shows that high levels of immigration have not slowed overall wage gains by average, native-born American workers. Most studies suggest that recent waves of new immigrants are associated with increases in the average wage of native-born Americans in the short-run and with even larger increases in the long term as capital investment rises to take account of the larger number of workers.
• The Wage Impact of Reforms to Provide a Path to Legal Status for Undocumented Immigrants: The largest effects of such reforms would be felt by immigrants themselves: After the 1986 immigration reforms, wages rose by 6 percent to 15 percent for previously-undocumented male immigrants and by 21 percent for previously-undocumented female immigrants. Those reforms also increased wages of previously legal immigrants. Research also suggests that those reforms led to modest wage gains by native-born Americans.
• Other Economic Effects of Immigration: Studies have found that immigrants are 30 percent more likely to start new businesses than native-born Americans; and even immigrants without high school diplomas, who account for 31 percent of all immigrants, comprise 27 percent of immigrant business owners. Various analyses of the fiscal effects of immigration have produced mixed results on the state and local levels; but studies show that immigrants have a net positive effect on the federal budget. Moreover, immigration reform would enhance these positive fiscal effects by indirectly raising the taxable incomes of immigrants and others.

2
729 15th Street, NW • 2nd Floor• Washington, DC 20005 • Tel: 202.544.9200 • www.newpolicyinstitute.org
The Impact of Immigration and Immigration Reform on the Wages of American Workers1
Robert Shapiro and Jiwon Vellucci
I. Introduction
In recent months and years, the Washington debate about immigration reform has been heated and often uninformed. This essay will attempt to correct this failing by examining the empirical evidence and analysis regarding the real economic effects of the recent waves of immigrants into the United States.
First, we present an accurate portrait of America’s immigrant population: More than one-third of recent immigrants come from Asia and Europe, while less than 57 percent come from Mexico and Latin America. 2 A substantially larger share of immigrants than native-born Americans lack a high school diploma; but about an equal share of both groups, between 28 percent and 30 percent, have college or graduate degrees, and more than half of immigrants from Asia are college educated or better. 3 Some 28 percent of immigrants hold managerial or professional positions, including 38 percent of immigrants who are naturalized citizens, compared to 37.5 percent of native-born Americans; while larger shares of immigrants than native-born Americans work in farming, production and services. 4 Immigrants are highly-concentrated geographically, with nearly 56 percent living in just four states and three-fourths residing in 10 states.5
We also dispel certain misconceptions about undocumented immigrants. Two-thirds of immigrants are naturalized citizens or legal permanent resident aliens, 4 percent have legal status as temporary migrants, and 30 percent are undocumented.6 Moreover, while undocumented male immigrants are generally low-skilled, they also have the highest labor participation rates in the nation: Among men age 18 to 64 years, 94 percent of undocumented immigrants work or are actively seeking work, compared to 83 percent of native-born Americans and 85 percent of immigrants with legal status.7 The principal reason is that undocumented immigrants are more likely to be supporting families with children: 47 percent of undocumented immigrants are part of couples with children, compared to 21 percent of native-born Americans and 35 percent of legal immigrants.8
We next examine the evidence and economic analysis regarding the impact of immigration on wages. A careful review shows that even the high levels of immigration of
1 The authors thank the New Policy Institute for its support of this research. However, all of the analysis and views are solely those of the authors. The authors also want to acknowledge the superb assistance of Krista Ellis. 2 U.S. Census Bureau (2008a): Table 2-17. 3 Ibid., Tables 1-5, 2-5, and 3-5. 4 Ibid., Table 1-7. 5 U.S. Census Bureau (2008b): Table C05001. 6 Passel and Cohn (2009). 7 Ibid. 8 Ibid.
3
729 15th Street, NW • 2nd Floor• Washington, DC 20005 • Tel: 202.544.9200 • www.newpolicyinstitute.org
recent years have not slowed the overall wage growth of the average, non-immigrant American worker. Overall, studies show that the recent waves of new immigrants have increased the average wage of native-born Americans in the short-run, and by even more in the long term as capital investment has increased to take account of the rising number of workers. Behind this broad conclusion, we also find that high immigration produces winners and losers. The biggest winners are the employers in industries and areas with large numbers of low-skilled workers. Among workers, as a general rule, the winners are higher-skilled Americans, and the losers are lower-skilled people who often compete for jobs with recent immigrants, including undocumented immigrants. In both of those cases, the effects are modest.
We also examine the impact on wages of immigration reforms that provide a path to legal status for undocumented immigrants. The largest effects are felt by those immigrants themselves: Following the 1986 immigration reform, wages increased by between 6 percent and 15 percent for previously-undocumented male immigrants and by 21 percent for previously-undocumented female immigrants. 9 Immigration reforms also increased the wages of immigrants who had already obtained legal status. Finally, research confirms that immigration reforms led to modest increases in wages for native-born Americans. One factor is that previously undocumented immigrants who gain legal status can move more freely to labor markets with greater demand for their skills, reducing their competition with native-born Americans with the same skills. The principal reason, however, is that legal status confers protections currently unavailable to undocumented immigrants, including minimum wage and overtime rules. About one-fourth of low-skilled workers in major cities are paid less than the minimum wage, including 16 percent of workers who are native-born Americans, 26 percent who are legal immigrants and 38 percent who are undocumented immigrants.10 Ending the ability of unscrupulous employers to recruit recent immigrants to work for less than the minimum wage would not only raise the incomes of all those currently paid less than minimum wage, but also reduce the downward pressures on the wages of other lower-skilled Americans currently coming from below-minimum wage workers.
Finally, we examine some of the other economic effects of immigration. Studies show, for example, that immigrants are 30 percent more likely to start new businesses; and even immigrants without high school diplomas, who account for 31 percent of all immigrants, comprise 27 percent of all immigrant business owners.11 Analysis also shows, surprisingly, that on a net basis, immigration does not adversely affect most city, state and federal budgets over the long term. Static models that take a one-year snapshot of government and revenues associated with immigration find that the handful of states with large numbers of recent immigrants with children incur a net fiscal burden, associated mainly with educational and medical costs. On a nationwide basis, however, immigration does not impose a net, federal fiscal burden, especially treating national defense as a public good that does not increase as immigration rises. Moreover, research using dynamic models that take account of the long-term fiscal effects of immigration show substantial net fiscal gains at the federal, state and local levels drawn from the lifetime earnings of immigrants, most of whom arrive post-school age and without elderly parents who could collect Social Security and Medicare.
9 Kossoudji and Cobb-Clark (2002); Amuedo-Dorantes et al. (2007); Rivera-Batiz (1999). 10 Bernhardt et al. (2009). 11 Fairlie (2008).

4
729 15th Street, NW • 2nd Floor• Washington, DC 20005 • Tel: 202.544.9200 • www.newpolicyinstitute.org
II. The Composition of Immigration to the United States
The composition of immigration into the United States, by place of origin, has changed dramatically in recent times. In particular, Asians and Latin Americans, especially Mexicans, have played a more dominant role since at least the late-1970s. One reason is the Immigration Act of 1965, which relaxed U.S. quotas on immigration from Latin America and Asia, and granted priority status to immigrants with family already legally in the United States. 12 Apart from the 1965 Act, certain social, economic and political changes also led to higher demand for access to the United States by some Latin Americans and Asians, and to lower demand for the same access by Europeans. As Table 1 (below) shows, the share of U.S. immigrants coming from Europe has declined by more than three-quarters since the 1960s – from nearly 40 percent to about 9 percent from 2000 to 2008 – while increased immigration by Latin Americans and Asians has offset those losses: The share of U.S. immigrants from Asia nearly doubled over this period, from 14.5 percent to 27 percent; and the share from Mexico increased as sharply, from 16.3 percent to 33.7 percent. In the most recent period, from 2000 to 2008, immigrants from Latin America, including Mexico, accounted for 56.3 percent of all new U.S. immigration, and immigrants from Asia accounted for an additional 26.9 percent. Strikingly, the largest changes in the composition of U.S. immigrants by national origin occurred in the 1970s, following the passage of the 1965 immigration legislation. However, the dominance of immigrants from Latin America and Asia has persisted since the 1970s, even as the total numbers of immigrants rose sharply, which testifies to the potentially long-lasting effects of immigration reforms.
Table 1. Immigration to the United States, By Place of Birth Pre-1970 to 2008 (percentage)13
Region of birth Pre-1970 1970-1979 1980-1989 1990-1999 2000-2008
Asia 14.5 30.3 31.1 26.6 26.9 Europe 39.6 12.7 6.7 10.8 8.6
Mexico 16.3 28.5 31.3 34.7 33.7
Other Latin America 19.9 23.4 25.3 21.5 22.6 Other Regions 9.8 5.1 5.7 6.4 8.2
The large share of immigrants from Mexico and other Latin American nations is also the main reason why foreign-born people in the United States, on average, are significantly less educated than native-born Americans. Table 2 (below) shows striking differences in education between both native-born Americans and all immigrants, and between immigrants hailing from different places. Nearly one-third of immigrants lack high school diplomas, compared to 10 percent of Americans; but among immigrants, 61.5 percent from Mexico did not complete high school, compared to 12.5 percent from Asia and 15.6 percent from Europe. The differences are equally great at the high end of the educational scale. While the share of all foreign-born people in the United States with college or graduate school degrees, at 28.5 percent, nearly equals that 12 Card (2005). 13 U.S. Census Bureau (2008a): Table 2-17. Those born in “other regions” include people from Africa, Oceania, Northern America, and those born at sea.

5
729 15th Street, NW • 2nd Floor• Washington, DC 20005 • Tel: 202.544.9200 • www.newpolicyinstitute.org
of native-born Americans at 29.6 percent, the reason is that a much larger share of Asian immigrants have college or graduate degrees, some 52.5 percent, than either native-born Americans at 29.6 percent or immigrants from Mexico and the rest of Latin America, at respectively 5.4 percent and 20.9 percent.
Table 2. Educational Level of Immigrants Age 25 and Over, By Place of Birth, percentage, 2008 14
Educational Attainment Asia Europe Mexico Other Latin
America
Other Areas
Total Foreign Born
Natives
Less than high school 12.5 15.6 61.5 27.4 10.7 30.7 10.2 High school graduate 20.3 28.0 24.1 33.1 24.1 25.6 32.2 Some college or associate degree 14.8 18.9 9.0 18.7 25.0 15.2 28.0
Bachelor's degree 31.1 21.4 3.8 14.5 24.2 17.5 19.4 Master's degree or more 21.4 16.1 1.6 6.4 16.1 11.0 10.2 Total 100.0 100.0 100.0 100.0 100.0 100.0 100
The combination of the low average educational attainment of immigrants from Latin America, especially Mexico, and the relatively large numbers of immigrants from that region has produced extreme educational divides within the overall immigrant population: While nearly 31 percent lack a high school diploma, nearly as many, 28.5 percent, hold college or graduate degrees. This division has been growing more stark over time. Over the last four decades, the share of immigrants lacking a high school education increased by more than one fifth, from 26.2 percent to 31.8 percent, while the share holding bachelor or higher degrees increased by nearly one-quarter, from 26.3 percent to 32.5 percent (Table 3, below). Moreover, from 2000 to 2008, the average educational level of new immigrants rose substantially: The share of new immigrants with college or graduate degrees (32.5 percent) was greater than both the share of new immigrants with less than a high school education (31.8 percent) and the share of native-born Americans with college or graduate degrees (28.5 percent).
Table 3. Educational Level of Immigrants Age 25 and Over, by Year of Entry, 200815
Educational Attainment Pre-1970 1970-79 1980-89 1990-99 2000-08 Average Less than high school diploma 26.2 29.8 31.0 31.8 31.8 30.7 High school graduate 29.1 23.9 26.7 26.2 22.9 25.6 Some college or associate degree 18.4 18.3 15.8 14 12.7 15.2 Bachelor's degree 14.3 17.7 17.6 17.1 19.4 17.5 Master's degree or more 12.0 10.3 9.0 10.9 13.1 11
The sharp differences in education among immigrants are reflected in the jobs they hold in the United States (Table 4, below). These data also show large differences in the occupations 14 Ibid., Tables 1-5 and 3-5. 15 Ibid., Table 2-5.

6
729 15th Street, NW • 2nd Floor• Washington, DC 20005 • Tel: 202.544.9200 • www.newpolicyinstitute.org
of immigrants, depending on whether they have become naturalized U.S. citizens, remain documented non-citizens, or are undocumented immigrants. Some 28 percent of immigrants are managers or professionals, compared to 37.5 percent of native-born Americans; but 38 percent of immigrants who are naturalized citizens are managers or professionals, compared to 20.9 percent of those who are not citizens. Moving down the job ladder, roughly the same share of immigrants and native-born Americans hold jobs in transportation and moving. But compared to native-born Americans, much smaller shares of immigrants, of all kinds, work in offices and sales; much larger shares of immigrants of all kinds hold jobs in farming and production than native-born Americans, and a somewhat larger share of immigrants work in services.
Table 4. Occupation of Employed Workers Age 16 and Over, By Immigration and Citizenship Status, 200816
Occupation Group Native-Born
Immigrants Total
Population All Immigrants
Naturalized Citizens
Non- Citizens
Management, business and financial 15.7 10.4 14.4 7.5 14.9 Professional and related 21.8 17.6 23.6 13.4 21.2 Service 15.5 22.6 18.1 25.8 16.6 Sales and related 11.7 9.0 10.1 8.1 11.3 Office and administrative 14.4 8.6 11.4 6.6 13.5 Farming, fishing, & forestry 0.5 1.7 0.6 2.5 0.7 Construction and extraction 5.0 11.1 5.2 15.2 5.9 Installation, maintenance, & repair 3.6 2.9 3.2 2.7 3.5 Production 5.8 9.1 7.3 10.5 6.3 Transportation & material moving 6.0 7.0 6.0 7.7 6.2 Total 100 100 100 100 100 Immigrants also remain highly concentrated geographically, in a relatively few number of states (see Table 5, below). Almost 56 percent of all foreign-born persons living in the United States reside in just four states (California, New York, Texas, and Florida), compared to 29 percent of native-born Americans. Further, three-fourths of all foreign-born persons living here reside in just ten states, compared to 52 percent of native-born people. Foreign-born people account for 26.8 percent of the population of California and 21.7 percent of New York State residents.17 Immigrants also account for 19.8 percent of New Jersey residents, 18.9 percent of Nevada’s population, 18.5 percent and 17.8 percent, respectively, of the populations of Florida and Hawaii, and between 13.8 percent and 16 percent of the populations of Illinois, Arizona, Massachusetts, and Texas.
16 Ibid, Table 1-7. 17 U.S. Census Bureau (2008b): Table C05001. The breakdowns of non-citizens to legal immigrants and undocumented immigrants are not available from the U.S. Census Bureau. For that information, see Table 7.

7
729 15th Street, NW • 2nd Floor• Washington, DC 20005 • Tel: 202.544.9200 • www.newpolicyinstitute.org
Table 5. Native and Foreign Born Populations in Ten States, As Shares of All Native and Foreign Born People in the United States, 200818
Native-Born Americans Foreign-Born Population
Rank State Share of Native-Born Population Rank State Share of Foreign-Born
in the United States
1 California 10.1% 1 California 26%
2 Texas 7.7% 2 New York 11.2%
3 New York 5.7% 3 Texas 10.2%
4 Florida 5.6% 4 Florida 8.9%
5 Pennsylvania 4.4% 5 Illinois 4.7%
6 Illinois 4.2% 6 New Jersey 4.5%
6 Ohio 4.2% 7 Massachusetts 2.5%
8 Michigan 3.5% 7 Arizona 2.5%
9 Georgia 3.3% 9 Georgia 2.4%
10 North Carolina 3.2% 10 Virginia 2.1% Immigrants by Legal Status Data are less comprehensive on immigrants who are undocumented. The Pew Research Center estimates that 30 percent of all foreign-born people residing here in 2008 lacked legal status, or 11.9 million from a total 39.9 million (Table 6, below).19 Among undocumented immigrants, 6.3 million are adult men, while 4.1 million are adult women and 1.5 million are children born abroad. Undocumented people also are more likely to be working age: Men 18 to 39 years, for example, account for 35 percent of undocumented people, compared to 14 percent of native born and 18 percent of legal immigrants; while 1.2 percent of undocumented persons are age 65 or older, compared to 12 percent of native born and 16 percent of legal immigrants. Table 6. Foreign-Born Population in the United States, By Legal Status, millions, 200820
Total Foreign Born 39.9 100% Legal Immigrants 23.0 70%
Naturalized Citizens 14.2 36% Legal Permanent Resident Aliens 12.3 31%
Legal Temporary Migrants 1.4 4% Undocumented Immigrants 11.9 30%
Furthermore, undocumented working age immigrant men are more likely to work or be looking for work than other groups: Among men age 18 to 64 years, 83 percent of the native
18 Ibid. 19 Passel and Cohn (2009). 20 Ibid.

8
729 15th Street, NW • 2nd Floor• Washington, DC 20005 • Tel: 202.544.9200 • www.newpolicyinstitute.org
born have jobs or are looking for work, compared to 85 percent of male immigrants with legal status and 94 percent of undocumented immigrants (Figure 1, below). However, undocumented women are less likely to be in the labor force: Among all working-age women, 73 percent of native-born American women work or are seeking work, compared to 66 percent of female immigrants with legal status and 58 percent of female immigrants without documentation. Figure 1. Labor Participation Rate of Population Age 18 to 64, By Legal Status, 200821
The primary reason why undocumented, working-age male immigrants have the nation’s highest labor participation rate is that they are more likely to support families with children (Figure 2). Nearly half of undocumented immigrants are in two-parent families with children, compared to a little over one-third of legal immigrants and one-fifth of native-born Americans. By contrast, 15 percent of undocumented persons are in couples without children, compared to 31 percent of both legal immigrants and native-born Americans; and just 13 percent of the undocumented are in single-person households, compared to 30 percent of the native born. The low labor participation rates of undocumented female immigrants also may reflect their greater likelihood of living in households with children, who they take care of.
Figure 2. Share of Households by Type for Household, Age 18-64, 200822
21 Ibid. 22 Ibid.

9
729 15th Street, NW • 2nd Floor• Washington, DC 20005 • Tel: 202.544.9200 • www.newpolicyinstitute.org
Undocumented immigrants also are the fastest-growing segment of the labor force, growing from 6.3 million out of a total labor force of 146.5 million in 2003 to 8.3 million in a labor force of 154.3 million in 2008. This increase of 2 million represented a 31 percent increase in absolute numbers in just five years, and their share of the labor force rose from 4.3 percent to 5.4 percent.23 Further, undocumented workers are much more likely than legal immigrants to work in service jobs, construction and farming, and, to a lesser degree, more likely than legal immigrants or native-born American to hold jobs in production, installation and repair job, and in transportation and the moving materials (Table 7, below).
Table 7. Occupations of Undocumented Immigrants, Legal Immigrants
and Native Born Workers, 200824
Occupation Group Undocumented Immigrants
Legal Immigrants U.S.-born
Services 30% 19% 16% Construction and extraction 21% 8% 5%
Production, installation and repair 15% 11% 9% Transportation and material moving 8% 7% 6%
Farming, fishing and forestry 4% 1% 1% Sales & office and administrative support 13% 19% 26% Professional, management, business & finance 9% 35% 36%
At just 5.4 percent of the labor force, undocumented immigrants account for 25 percent
of agricultural workers, 19 percent of building and grounds-keeping maintenance personnel, 17 percent of construction workers, as well as disproportionate shares of workers in food preparation and service, production, and transportation and moving materials (Table 8, below).25
Table 8. Occupations of Undocumented Working Immigrants, 200826
Occupations Share of Undocumented Immigrants in the Occupation
Farming 25% Building and grounds maintenance 19% Construction 17%
Food preparation & serving 12% Production 10%
Transportation & material moving 7% Other 10%
23 Ibid.; U.S. Census Bureau, Statistical Abstract, 2009 and 2010. 24 Ibid. 25 Passel and Cohn (2009). 26 Ibid.
10
729 15th Street, NW • 2nd Floor• Washington, DC 20005 • Tel: 202.544.9200 • www.newpolicyinstitute.org
III. The Direct Economic Impact of Immigrants in the United States
There is great interest and concern about the economic impact of the large numbers of immigrants to the United States, both legal and undocumented. As we will see, the distribution of immigrants’ education and skills, compared to those of native-born Americans, produces adverse effects on the incomes of low-skilled Americans, positive effects on the incomes of skilled Americans, and overall gains in national income and Gross Domestic Product (GDP). Furthermore, legal changes which enable undocumented immigrants to secure legal status, and thus qualify for minimum wage, would increase the overall gains to GDP or national income, and generate positive wage effects for low-skilled native-Americans.
Economic Theories about How Immigration Affects National Income and Wages
Traditional economic analysis of the economic impact of immigration has found that its effects depend on the skills of the immigrants compared to the skills of the native-born population. An influx of new, unskilled workers will create greater job competition for unskilled native-born workers, which should tend to depress their average wage. However, the influx of new, low-skilled workers also can complement the work of skilled native-born workers, increasing demand for their labor and so tend to drive up their wages. For example, if an influx of low-skilled immigrants settles in the fruit-growing regions of California or Florida, their influx depresses the wages of American fruit pickers, which in turn may reduce the price of the fruit and so increase demand for it. The greater demand for the fruit, in turn, increases demand for the services entailed to manage the fruit operation, which may drive up the wages of those higher-skilled employees.
An influx of new, low-skilled workers also can ultimately produce net overall gains for American workers, from a number of sources. To begin, the wage gains of the highly-skilled workers are usually greater than the wage losses of the unskilled native workers, producing net benefits. Furthermore, the influx expands the labor force and increases total output, in part because many immigrants fill jobs that native-born Americans would not fill, increasing national income.27 However, if the immigrants as a group have the exact same distribution of education and skills as American workers, the influx has no effect on wages: Total demand and all inputs and outputs increase by the same amount with no effect on prices, including the price of labor. The effects of immigration on wages, then, come from the fact that the distribution of their skills and education is so different from the distribution of skills and education among native-born Americans. (See Appendix A for a detailed, technical explanation).
The extent of the overall gains for Americans depends on how much immigrants affect the price of labor, or what economists call the “labor price elasticity.” Research suggests that a 10 percent increase in the labor force by immigrants will reduce wages by 3 percent (an elasticity of -0.3).28 Using that relationship, other researchers have concluded that the mix of immigrant skills produces modest net gains for Americans, equal to one-tenth of one percent of our national
27 See Smith and Edmonston (1997), Chapter 4. 28 Hamermesh (1993).
11
729 15th Street, NW • 2nd Floor• Washington, DC 20005 • Tel: 202.544.9200 • www.newpolicyinstitute.org
income in 2006, or about $14.7 billion ($45 per-person). 29 However, those net gains are captured mainly by employers who pay out lower wages. When researchers analyze the effects in terms of employers versus workers, instead of high-skilled versus low-skilled workers, they have estimated that employers captured large net gains of an estimated $278 billion in 2006 while American workers overall bore significant net losses of an estimated $264 billion.30
These losses may well be offset by even larger, additional economic effects. As the supply of unskilled workers increases, the goods and services produced by them expand, which reduces the price everyone pays. The large numbers of immigrant farm workers, for example, contributes to the relatively low price of many fruits and vegetables in our economy; and other researchers have found that increases in low-skilled immigrant workers in cities have kept down the cost of numerous services, such as housekeeping and gardening.31 Studies have further found that the benefits from lower prices for immigrant-sensitive goods and services are widely distributed: While the top 10 percent of Americans consume a slightly larger relative share of those goods and services, everyone else consumes about equivalent shares of them. 32 Another way in which immigration can raise average wages is the increase in overall demand: Immigrants buy goods and services produced by American workers, so an influx of new immigrants increases demand for everything, which in turn creates more jobs for native-born workers. Immigrants also have certain skills that native-born Americans lack, for example in preparing the foods or producing the crafts of their native countries; and everyone benefits from the broader consumer offerings. It is likely that immigration explains the rapid growth of authentic, foreign-food restaurants across much of the United States in recent years. Finally, competition from immigrants leads some American workers to upgrade their own education and skills, increasing overall productivity and raising GDP and their own incomes.33
Evidence of the Impact of Immigration on Wages
Empirical work on the economic effects of immigration has focused largely on wages. Consistent with the theoretical work, these studies have generally found a small, net impact on the overall wages of native-born workers and much larger distributional effects. A literature review in 2005 examined 344 estimates from 18 studies covering the United States and other advanced nations, and found that when immigrants increase their share of the labor force by one percent (roughly 1.5 million people in the American case), it affects overall wages by just 0.119 percent.34 This modest, even ambiguous result points to the basic fact that immigrants and most native-born Americans do not compete for the same jobs.35
Empirical studies also have found significant effects on the wages of low-skilled Americans. Immigrants with very few skills are often close substitutes for other workers with few skills; and the rising numbers of new immigrants without high-school diplomas (Table 3,
29 Bodvarsson and Van den Berg (2009). 30 Ibid. 31 Cortes (2008); see also Lach (2007) on this effect from large numbers of Russian immigrants to Israel. 32 Smith and Edmonston (1997), Chapter 5. 33 CBO (2005). 34 Longhi et al. (2005). 35 Friedberg and Hunt (1995). In economic terms, immigrants are neither perfect substitutes for native-born workers (because their skills are different) nor perfect complements for American workers.

12
729 15th Street, NW • 2nd Floor• Washington, DC 20005 • Tel: 202.544.9200 • www.newpolicyinstitute.org
above) have clearly affected the wages of low-skilled workers already here. The evidence suggests, however, that the greatest losers are not native-born Americans but other immigrants who arrived earlier, with one study estimating that a 10 percent increase in immigration depresses the wage of other immigrants by 2 percent.36 These results are supported by studies on the impact of new immigrants on wages in particular cities, such as the influx of Cubans to Miami in 1980, and studies comparing cities with and without large numbers of recent immigrants. This research almost uniformly has found very modest or insignificant effects on the jobs and wages of native-born workers, 37 including young African-Americans and Hispanics.38 The study of Miami also found no evidence that the influx of Cubans drove down the wages of low-skilled Miamians, although the Miami economy had an unusually strong demand for unskilled workers, and that the well-publicized influx of new Cuban immigrants may have discouraged immigration there by other groups.39
There is some evidence that such small effects on low-skilled native workers may reflect not only immigrants favoring cities with high demand for their labor, but shortcomings of the studies themselves.40 For example, an adverse effect on wages could be statistically obscured if the places where the new immigrants settled started out with higher wages and just moved closer to the average, or if the competition from new immigrants drove some native, low-skilled workers to move to other places. These critiques are supported by certain domestic migration patterns. One study found that an increase of 10 immigrants in a metropolitan area is associated with an out-migration of three-to-six native born Americans.41 Another study estimated that a one percent increase in the labor force in certain areas derived from immigration between 1975 and 1980 resulted in a 1.2 percent reduction in net migration to those places by native-born Americans, especially by low-skilled and less educated workers.42
On balance, most of the empirical research finds immigration produces some modest overall wages gains and modest adverse effects on the wages of low-skilled workers, including earlier immigrants. One leading study43 found that the waves of new immigrants from 1990 to 2004 increased the average wage of native-born Americans by 0.7 percent in the short-run and 1.8 percent over the long-term, as capital investment increased to take account of the larger number of workers. However, it also estimated that this wave of immigration cost Americans without high school diplomas 2.2 percent of their real wage in the short-run and 1.1 percent over the long-term. Empirical work also has found that immigration is also associated with widening wage gaps based on skills: The wage gap between the lowest-skilled natives and middle-level skilled natives was 3 percent to 5 percent higher in cities with large numbers of recent
36 Grossman (1982); see also Cortes (2008) and Ottaviano and Peri (2006). However, some studies have found contrary results. Altonji and Card (1991) found no evidence that immigrants have a greater impact on the wages of other immigrants than of natives; and LaLonde and Topel (1991) found only a very small negative effect on the wages of other immigrants (a 10 percent increase in immigration reduced the wage of other immigrants by 0.3 percent) which disappeared as the focus moved from recent arrivals to earlier arrivals. 37 Friedberg and Hunt (1995); Bodvarsson and Van den Berg (2009). 38 See LaLonde and Topel (1991); also Altonji and Card (1991). 39 Card (1990). 40 Borjas (2003); Borjas (2004). 41 Borjas (2006). 42 Filer (1992). 43 Ottaviano and Peri (2006).

13
729 15th Street, NW • 2nd Floor• Washington, DC 20005 • Tel: 202.544.9200 • www.newpolicyinstitute.org
immigrants than in places with less immigration. 44 Other studies also have found that immigrants have taken the place of low-skilled Americans in agriculture and certain services,45 but it is not clear whether American workers already were leaving those sectors, perhaps for higher-paying jobs. It is also possible that without low-wage immigrant labor, imports might have displaced some of U.S. domestic agriculture, reducing jobs for Americans and raising the price of food for everyone.
A number of studies have also examined the economic effects of immigration by people with advanced skills. Most of these studies have found no negative income effects for highly-skilled Americans, in part because many high-skill professions have labor shortages. For example, one recent analysis46 found that immigration from 1994 to 2000 led to modest increases in the wages of professionals and service workers. It also found certain negative income effects tied not to new high-skilled immigrants, but to those who had arrived some time ago. This suggests that high-skilled jobs require great proficiency in English and sophisticated institutional knowledge, which makes new, skilled immigrants less than perfect substitutes for Americans; but over time, assimilation makes those immigrants more competitive with native-born workers. Similar results have been found in studies of highly-skilled immigrants in other societies, such as the large influx of well-educated Russians to Israel from 1990 to 1994. 47 However, one analysis which focused on new immigrants to the United States with doctorates in science did estimate that a substantial increase in such immigrants led to lower earnings by American and resident, foreign-born scientists and engineers with the same degrees.48
The Impact of Undocumented Immigrants
The Immigration Reform and Control Act (IRCA) of 1986, which granted legal status to 1.7 million long-term undocumented immigrants, provides a natural setting to examine the effects of legalization on wages and jobs. The Pew Hispanic Center has estimated that undocumented immigrants currently account for 30 percent of the country’s total foreign-born population and five percent of the workforce.49 Much of the relevant research has focused on the impact on the wages of the newly documented immigrants themselves. These studies have found wage gains after four years of 6 percent,50 9.3 percent51 and 15 percent52 for men, and 21 percent for women.53 Other studies, however, have focused on the effect of the immigration reform on Americans and immigrants who already had legal status. One study focused on manufacturing workers found positive but negligible effects, with every one percent increase in the proportion of legal immigrants associated with a one-hundredth of one percent increase in the average manufacturing wage.54
44 Card (2007). 45 Smith and Edmonston (1997), Chapter 5. 46 Orrenius and Zavodny (2006). 47 Friedberg (2001). 48 Borjas (2005). 49 Passel and Cohn (2009). 50 Kossoudji and Cobb-Clark (2002). 51 Amuedo-Dorantes et al. (2007). 52 Rivera-Batiz (1999). 53 Amuedo-Dorantes et al. (2007); Rivera-Batiz (1999). 54 Cobb-Clark et al. (1995).

14
729 15th Street, NW • 2nd Floor• Washington, DC 20005 • Tel: 202.544.9200 • www.newpolicyinstitute.org
Other research tends to confirm that while the new immigrants experience the largest wage increases, the wages of native-born workers also increase. For example, one new study estimates that immigration reforms that create a path to permanent status increase the annual wages of newly-documented immigrants by $4,405 for less-skilled jobs and $6,185 for highly-skilled positions, and also push up the annual wage of Americans by $162 for less skilled jobs and $74 for the more highly skilled ones.55 Another recent study has questioned these positive effects, finding that reforms have neither positive nor negative wage effects unless the previously-undocumented workers are highly-skilled.56 That study, however, examined only the short-term wage effects, four to 13 months following legalization; and its authors acknowledge that wages effects could emerge with more time. Other research supports this view, especially if legal status enables newly-documented immigrants to “move more freely within the US to areas with low unemployment rates and pent-up demand for low-skill workers.”57
The wage effects of immigration reform are also linked to its impact on workplace violations in labor markets with large numbers of low-wage immigrant workers. A recent landmark study of more than 4,000 workers in low-wage industries in Chicago, Los Angeles and New York City found widespread violations of minimum wages and overtime laws as well as “off the clock” and meal-break regulations, affecting both immigrant and American workers.58 Some 26 percent of the workers surveyed were paid less than the minimum wage, including 16 percent of the native-born workers, 26 percent of legal immigrants and 38 percent of undocumented immigrants. The study found that the violations cost an average worker $2,634 annually or about 15 percent of their earnings. Since the violations are significantly more common among undocumented workers, the research supports strongly that immigration reform could significantly increase the wages of formerly undocumented immigrants, which in turn would limit the ability of employers to exploit the undocumented status of some workers and thereby reduce downward pressures on the wages of Americans working in the same occupations and industries. This conclusion is supported by other research which finds that newly-legalized workers invest more in education and efforts to improve their English skills, further raising their wages; and greater competition from these workers can induce some lower-skilled American workers to acquire more skills and education as well, raising their wages. A recent study estimates that these effects could generate gains of $180 billion over time, equal to nearly 1.3 percent of GDP.59
Other Economic Effects of Immigration
Immigration has numerous other economic effects, although many of them have not yet been analyzed carefully. One study found that immigration to an urban area equal to one percent of its population is associated with a one percent increase in rents and housing values;60 but other 55 Hinojosa-Ojeda (2010). 56 Hill et al. (2010). The study divided immigrants into three groups: Those who entered illegally (“crossers”), others who overstayed their visas (“overstayers”), and those who were continuously legal. The differences in formal education across the three groups are striking: Crossers have an average of 9.5 years of formal education, overstayers have 13.7 years of education, and the continuously legal have 14.3 years. Approximately half of America’s current illegal immigrants are crossers, and nearly half are overstayers. 57 Orrenius and Zavodny (2004). 58 Bernhardt et al. (2009). 59 Dixon and Rimmer (2009). 60 Saiz (2006).
15
729 15th Street, NW • 2nd Floor• Washington, DC 20005 • Tel: 202.544.9200 • www.newpolicyinstitute.org
research suggests that such increases in the gross rents of Americans are accompanied by increases in their incomes, leaving the economic burden of their rents unchanged.61 The impact of immigration on entrepreneurship and innovation is clearer. Immigrants are generally people who plan and choose to uproot themselves to another nation and culture, and therefore are commonly considered to be on average more aggressive and entrepreneurial than others in their home countries. One often-cited study found that the share of Silicon Valley start-ups run by immigrants from China and India increased from 12 percent in 1980-1984 to 29 percent in 1995-1998, following large increases in immigration from those countries.62 Other research has found similar results nationwide: Immigrants helped to establish one-quarter of all startups in the engineering and technology sectors from 1995 to 2005; and by 2005, these startups recorded $52 billion in sales and employed some 450,000 workers.63 Other analyses have found that across all industries and sectors, immigrants are 30 percent more likely to start their own businesses than native-born Americans and account for 12.5 percent of all business owners.64 Most of these new businesses are not in technology or science, but in services, construction, wholesale trade, recreation, and arts and entertainment. This entrepreneurial phenomenon is not limited to highly-skilled immigrants: Immigrants without high school diplomas, who account for about 31 percent of all immigrants, comprise an estimated 27 percent of all immigrant business owners.
IV. The Fiscal Effects of Immigration
Immigration also has some significant effects on the federal budget, both positive and negative. Low-skilled immigrants, both legal and undocumented, impose a net burden on government budgets, receiving benefits that exceed the taxes they pay. However, the same holds true for many Americans, especially in a period when federal spending far exceeds federal revenues. Moreover, the tax payments of highly-skilled immigrants exceed the benefits they claim, especially since most immigrants are relatively young; and empirical research generally suggests that their contributions offset the net costs of other immigrants. This phenomenon is not limited to the United States. One recent analysis that reviewed empirical studies of the fiscal effects of immigration in Europe and the United States found that the net fiscal burden or contribution of immigration is equal to a negative one percent to a positive one percent of GDP.65
Many of these studies use a static model to estimate these net costs or contributions, taking a snapshot that usually covers one year and therefore does not take account of how the economic status of immigrants changes over time. More dynamic models attempt to consider the net fiscal effects of immigrants and their descendents over a lifetime.66 For example, the waves of young, payroll-tax-paying immigrants in recent years, with higher labor participation rates than native-born Americans, may relieve some of the long-term fiscal stresses associated with the aging of the American population and the rising attendant costs of Social Security and
61 Greulich et al. (2004). 62 Saxenian (1999). 63 Wadhwa et al. (2008). 64 Fairlie (2008). 65 Rowthorn (2008). 66 Ibid.

16
729 15th Street, NW • 2nd Floor• Washington, DC 20005 • Tel: 202.544.9200 • www.newpolicyinstitute.org
Medicare. The static estimates also do not take account of the taxes paid by U.S.-born children of immigrants who no longer live in immigrant-headed households. 67
A landmark study by the National Research Council employed both static and dynamic analyses of the fiscal effects of immigration.68 The static analysis measured the fiscal impact of immigrants on states and localities, based on estimated costs in New Jersey and California; and the analysis found that immigrants generate a net state and local fiscal burden equivalent to between $166 and $226 per-native household, or less than one-half of one percent of average household income. Furthermore, the analysis found that immigration also produced a net fiscal contribution or surplus at the federal level, when national defense is treated as a pure “public good” that does not increase as the number of immigrants rises.69 This part of the analysis concluded that the average immigrant household in New Jersey and California made an estimated net, annual contribution to the federal budget of $520 and $127, respectively.
The study also analyzed the dynamic, long-term fiscal effects of immigration and found that the average, net present value of the lifetime fiscal effect of immigrants and their descendents was equal to $80,000 per immigrant.70 On an individual basis, the dimensions of this contribution depend on the immigrant’s age arriving in the United States and education: Unsurprisingly, young and highly-educated immigrants generate the largest fiscal contributions. An immigrant who arrives as a young adult typically does not attend American schools, the largest fiscal burden for local and state governments, and works in ways that generate tax revenues. Those who arrive as children do take advantage of taxpayer-financed education, but also face a lifetime of paying taxes equivalent to the taxes paid by Americans with the same education and skills. Furthermore, the second generation of immigrants, on average, is better educated and earns higher incomes than their immigrant parents, producing net fiscal benefits;71 and within two generations, the educational and income characteristics of the descendents of immigrants are indistinguishable from native-born Americans.
The educational level of immigrants when they arrive also, naturally, has powerful fiscal implications. One study estimated that if the share of immigrants who are highly-skilled and age 40 to 44 years old increased from 0.44 percent to 0.62 percent (1.6 million immigrants), the fiscal effects could largely eliminate future budget deficits.72 And the largest fiscal burdens are associated with new, elderly immigrants, who have paid no taxes but may be eligible for Medicaid and Supplemental Security Income (SSI). As a general proposition, therefore, the fiscal effect of immigration is generally positive at the federal level, where benefits are highly concentrated on older recipients, and generally negative for the relative handful of states and localities with large shares of recent immigrants, especially those with school-age children.73
67 Smith and Edmonston (1997). 68 Ibid. 69 Auerbach and Oreopoulos (2000) also note that the overall fiscal impact of immigration depends on the growth of government spending, especially defense spending, relative to increases in immigration. 70 See Smith and Edmonston (1997), chapter 7, for more details. The weighted average net present value of life-time fiscal contribution of immigrants is estimated at $80,000 per immigrant. 71 Card (2005). For a contrary view, see Rector and Kim (2007). 72 Storesletten (2000). 73 Smith and Edmonston (1997).

17
729 15th Street, NW • 2nd Floor• Washington, DC 20005 • Tel: 202.544.9200 • www.newpolicyinstitute.org
V. Conclusion
The evidence and analysis show that the immigrant population in the United States is as varied as native-born Americans and less different than often assumed. Roughly equal shares of immigrants and native-born Americans have college or graduate degrees, for example, and more than one-quarter of current immigrants are managers or professionals. However, the evidence also shows that, as is widely assumed, a larger share of immigrants lack high school diplomas, especially among undocumented immigrants. It is less-widely recognized that undocumented male immigrants have the highest labor participation rates of any group in America principally because, compared to the native born, undocumented immigrants are twice as likely to be in households with spouses and children.
The evidence and analysis also show that high levels of immigration have had no adverse effect on the average wages of native-born Americans. In fact, studies indicate that the recent waves of immigration have positive long-term effects on average wages as capital investment rises to take account of the larger numbers of workers. However, immigration does have distributional wage effects, generally raising the average wage of highly-skilled Americans and reducing the wages or wage gains of some low-skilled Americans, who compete for jobs in places with large numbers of recent immigrants, including undocumented immigrants.
The evidence and analysis further show that immigration reform could reverse these adverse effects. Reforms which create a path to legal status for undocumented immigrants would allow immigrants to move more freely to labor markets with unmet demand for lower-skilled workers, reducing their competition with native-born Americans with the same skills. Moreover, legal status would confer protections which are currently unavailable to undocumented immigrants, especially minimum wage protections. Ending the ability of unscrupulous companies to recruit recent immigrants to work for less than the minimum wage would reduce the downward pressures on the wages of low-skilled natives currently coming from below-minimum wage immigrant workers.
Finally, the evidence and analysis show that taking into account both spending and revenues, immigrants are not a net drain on most state, local and federal budgets. In any year, a handful of states with large numbers of recent immigrants with children incur significant net budget costs, largely from the educational and medical costs associated with the children. At the federal level, however, revenues from immigrants equal or exceed spending on immigrants. Moreover, on a longer-term basis, the lifetime earnings of immigrants, most of whom arrive in America at post school-age and without elderly parents eligible for Social Security and Medicare, are likely to exceed the lifetime government spending they claim. These net fiscal gains also would be enhanced by immigration reform, which would indirectly increase the taxable incomes of both immigrants and native-born Americans.
18
729 15th Street, NW • 2nd Floor• Washington, DC 20005 • Tel: 202.544.9200 • www.newpolicyinstitute.org
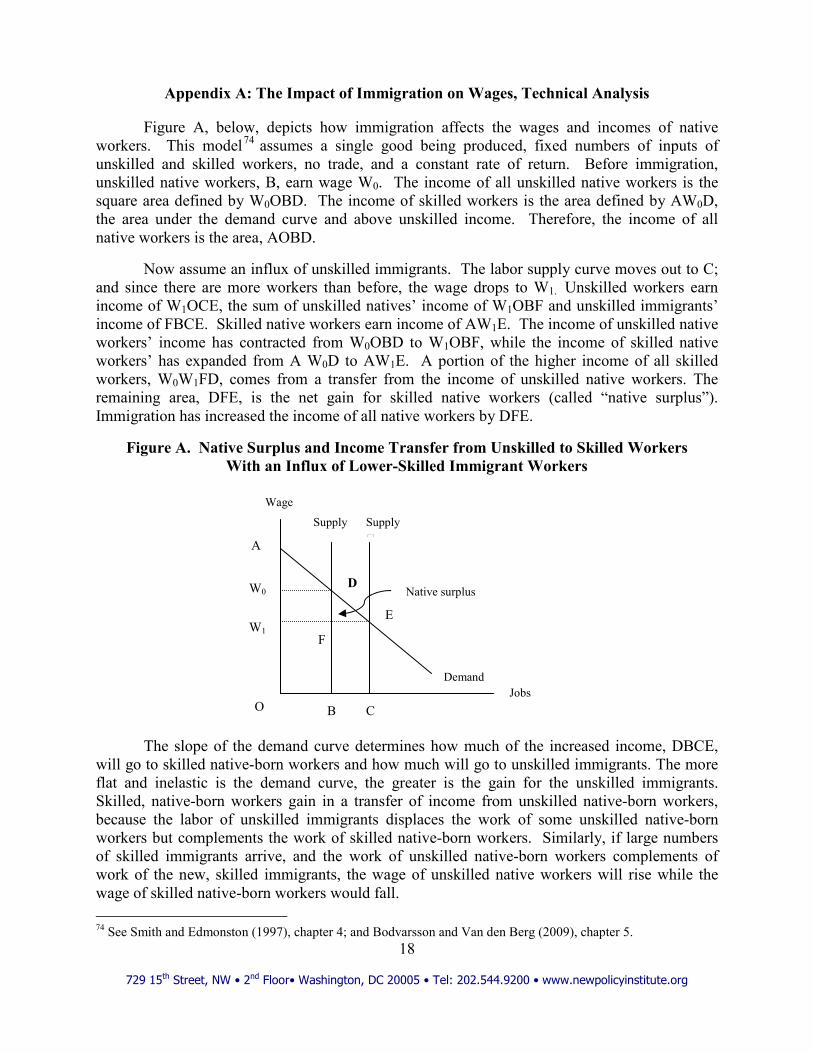
Appendix A: The Impact of Immigration on Wages, Technical Analysis
Figure A, below, depicts how immigration affects the wages and incomes of native workers. This model74 assumes a single good being produced, fixed numbers of inputs of unskilled and skilled workers, no trade, and a constant rate of return. Before immigration, unskilled native workers, B, earn wage W0. The income of all unskilled native workers is the square area defined by W0OBD. The income of skilled workers is the area defined by AW0D, the area under the demand curve and above unskilled income. Therefore, the income of all native workers is the area, AOBD.
Now assume an influx of unskilled immigrants. The labor supply curve moves out to C; and since there are more workers than before, the wage drops to W1. Unskilled workers earn income of W1OCE, the sum of unskilled natives’ income of W1OBF and unskilled immigrants’ income of FBCE. Skilled native workers earn income of AW1E. The income of unskilled native workers’ income has contracted from W0OBD to W1OBF, while the income of skilled native workers’ has expanded from A W0D to AW1E. A portion of the higher income of all skilled workers, W0W1FD, comes from a transfer from the income of unskilled native workers. The remaining area, DFE, is the net gain for skilled native workers (called “native surplus”). Immigration has increased the income of all native workers by DFE.
Figure A. Native Surplus and Income Transfer from Unskilled to Skilled Workers With an Influx of Lower-Skilled Immigrant Workers
The slope of the demand curve determines how much of the increased income, DBCE, will go to skilled native-born workers and how much will go to unskilled immigrants. The more flat and inelastic is the demand curve, the greater is the gain for the unskilled immigrants. Skilled, native-born workers gain in a transfer of income from unskilled native-born workers, because the labor of unskilled immigrants displaces the work of some unskilled native-born workers but complements the work of skilled native-born workers. Similarly, if large numbers of skilled immigrants arrive, and the work of unskilled native-born workers complements of work of the new, skilled immigrants, the wage of unskilled native workers will rise while the wage of skilled native-born workers would fall. 74 See Smith and Edmonston (1997), chapter 4; and Bodvarsson and Van den Berg (2009), chapter 5.
O
F
D
E
Supply SupplyK
Native surplus
A
W0
W1
B C
Wage
Jobs Demand

19
729 15th Street, NW • 2nd Floor• Washington, DC 20005 • Tel: 202.544.9200 • www.newpolicyinstitute.org
References
Altonji, Joseph G., and David Card. 1991. “The Effects of Immigration on the Labor Market Outcomes of Less-Skilled Natives.” In Abowd, John M. and Richard B. Freeman (Eds.), Immigration, Trade and the Labor Market. (Chicago: University of Chicago Press for the National Bureau of Economic Research, 1991). Ameudo-Dorantes, Catalina, Cynthia Bansak, and Steven Raphael. 2007. “Gender Differences in the Labor Market: Impact of IRCA’s Amnesty Provisions.” American Economic Review 97 (2): 412-16.
Auerbach, Alan J. and Philip Oreopoulos. 2000. “The Fiscal Effect of U.S. Immigration: A Generational-Accounting Perspective.” Tax Policy and the Economy, Vol. 14.
Bernhardt, Annette et al. 2009. “Broken Laws, Unprotected workers: Violations of Employment and Labor Laws in America’s Cities.” Center for Urban Economic Development, National Employment Law Project, UCLA Institute for Research on Labor and Employment.
Bodvarsson, Örn B. and Hendrik Van den Berg. 2009. The Economics of Immigration: Theory and Policy. (Berlin: Springer, 2009).
Borjas, George J. 2003. “The Labor Demand Curve is Downward Sloping: Reexamining the Impact of Immigration on the Labor Market.” Quarterly Journal of Economics, 118, 1335-1374.
Borjas, George J. 2004. “Increasing the Supply of Labor through Immigration: Measuring the Impact on Native-born Workers.” Backgrounder of Center for Immigration Studies.
Borjas. George J. 2005. “The Labor Market Impact of High-Skill Immigration.” National Bureau of Economic Research, Working Paper No. 11217.
Borjas, George J. 2006. “Native Internal Migration and the Labor Market Impact of Immigration.” Journal of Human Resources, 41, 221-258.
Card, David. 1990. “The Impact of the Mariel Boatlift on the Miami Labor Market.” Industrial and Labor Relations Review, 43, 245-257.
Card, David. 2005. “Is the New Immigration Really so Bad?” National Bureau of Economic Research, Working Paper 11547.
Card, David. 2007. “How Immigration Affects U.S. Cities.” Center for Research and Analysis of Migration, Discussion Paper Series CDP No. 11/07.
Cobb-Clark, Deborah A., Clinton R. Shiells, Lindsay B. Lowell. 1995. “Immigration Reform: The Effects of Employers Sanctions and Legalization on Wages.” Journal of Labor Economics, Vol. 13, No. 3, pp. 472-498.
Congressional Budget Office (CBO). 2005. The Role of Immigrants in the U.S. Labor Market.

20
729 15th Street, NW • 2nd Floor• Washington, DC 20005 • Tel: 202.544.9200 • www.newpolicyinstitute.org
Cortes, David. 2009. “The Economic Impact of Immigration.” In Coates, David and Peter Siavelis (Eds). Getting Immigration Right: What Every American Needs to Know. (Washington DC: Potomac Books, 2009)
Cortes, Patricia. 2008. “The Effect of Low-skilled Immigration on U.S. Prices: Evidence from CPI Data.” Journal of Political Economy Vol. 116. No. 3.
Dixon, Peter B. and Maureen T. Rimmer. 2009. “Restriction or Legalization? Measuring the Economic Benefits of Immigration Reform.” Cato Institute Trade Policy Analysis.
Fairlie, Robert W. 2008. “Estimating the Contribution of Immigrant Business Owners to the U.S. Economy.” Small Business Administration.
Filer, Randall K. 1992. “The Effect of Immigrant Arrivals on Migratory Patterns of Native Workers.” In Geroge J. Borjas and Richard B. Freeman (Eds). Immigration and the Work Force. (Chicago: University of Chicago Press, 1992).
Friedberg, Rachel. 2001. “The Impact of Mass Migration on the Israeli Labor Market.” Quarterly Journal of Economics, Vol. 116, No. 4, pp. 1373-1408.
Friedberg, Rachel and Jennifer Hunt. 1995. “The Impact of Immigrants on Host Country Wages, Employment and Growth.” Journal of Economic Perspectives, Vol. 9, No. 2: 23-44.
Greulich, Erica, John M. Quigley, Steven Raphael. 2004. “The Anatomy of Rent Burdens: Immigration, Growth, and Rental Housing.” Brookings-Wharton Papers on Urban Affairs, pp.149-205.
Grossman, Jean Baldwin. 1982. “The Substitutability of Natives and Immigrants in Production.” The Review of Economics and Statistics, Vol. 64, No. 4, pp. 596-603.
Hamermesh, Daniel S. Labor Demand. (Princeton, NJ: Princeton University Press, 1996).
Hill, Laura E., Magnus Lofstrom, Joseph M. Hayes. 2010. “Immigrant Legalization: Assessing the Labor Market Effects.” Public Policy Institute of California.
Hinojosa-Ojeda, Raul. 2010. “Raising the Floor for American Workers: The Economic Benefits of Comprehensive Immigration Reform.” Center for American Progress and Immigration Policy Center.
Kossoudji, Sherrie A. and Deborah A. Cobb-Clark. 2002. “Coming Out of the Shadows: Learning about Legal Status and Wages from the Legalized Population.” Journal of Labor Economics, Vol. 20, No. 3, pp. 598-628.
Lach, Saul. 2007. “Immigration and Prices.” Journal of Political Economy, Vol. 115, No. 4.
LaLonde, Robert, and Robert H. Topel. 1991. “Labor Market Adjustments to Increased Immigration.” In Abowd, John M. and Richard B. Freeman (Eds). Immigration, Trade and the Labor Market. (Chicago: University of Chicago Press, 1991).

21
729 15th Street, NW • 2nd Floor• Washington, DC 20005 • Tel: 202.544.9200 • www.newpolicyinstitute.org
Longhi, Simonetta, Peter Nijkamp and Jacques Poot. 2005. “A Meta-Analytic Assessment of the Effect of Immigration on Wages.” Journal of Economic Surveys, Vol. 19, No. 3, pp.451-477.
Orrenius Pia M. and Madeline Zavodny. 2006. “Does Immigration Affect Wages? A Look at Occupation-Level Evidence.” IZA Discussion Paper No. 2481.
Orrenius, Pia M. and Madeline Zavodny. 2004. “What are the Consequences of an Amnesty for Undocumented Immigrants?” Working Paper of Federal Reserve Bank of Atlanta.
Ottaviano, Gianmarco and Giovanni Peri. 2006. “Rethinking the Effects of Immigration on Wages.” National Bureau of Economic Research Working Paper 12497.
Passel, Jeffrey S. and D’Vera Cohn. 2009. “A Portrait of Unauthorized Immigrants in the United States.” Pew Hispanic Center.
Rector, Robert and Christine Kim. 2007. “The Fiscal Cost of Low-skill Immigrants to the U.S. Taxpayer.” Heritage Special Report, the Heritage Foundation.
Rivera-Batiz, Francisco. 1999. “Undocumented Workers in the Labor Market: An Analysis of the Earnings of Legal and Illegal Mexican Immigrants in the United States.” Journal of Population Economics, 12(1), 91-116.
Rowthorn, Robert. 2008. “The Fiscal Impact of Immigration on the Advanced Economies.” Oxford Review of Economic Policy, Vol. 24, No. 3, pp. 560-580.
Saiz, Albert. 2006. “Immigration and Housing Rents in American Cities.” Journal of Urban Economics 61, 345-371.
Saxenian, AnnaLee. 1999. Silicon Valley’s New Immigrant Entrepreneurs. Public Policy Institute of California.
Smith, James P. and Barry Edmonston (Eds). The New Americans: Economic, Demographic and Fiscal Effects of Immigration. (Washington, DC: National Research Council, National Academic Press, 1997).
Storesletten, Kjetil. “Sustaining Fiscal Policy through Immigration.” Journal of Political Economy, Vol. 108, No. 2.
U.S. Census Bureau. (2008a). “Foreign-born Populations of the United States.” Current Population Survey.
U.S. Census Bureau. (2008b). American Community Survey: 1-Year Estimates. U.S. Census Bureau. Statistical Abstract 2009. (Washington DC: Commerce Department, US Census Bureau, 2008).
U.S. Census Bureau. Statistical Abstract 2010. (Washington DC: Commerce Department, US Census Bureau, 2009).

22
729 15th Street, NW • 2nd Floor• Washington, DC 20005 • Tel: 202.544.9200 • www.newpolicyinstitute.org
Wadhwa, Vivek, AnnaLee Saxenian, Ben Rissing and Gary Gereffi. 2008. “Skilled Immigration and Economic Growth.” Applied Research in Economic Development, Vol. 5, No. 1.
About the Authors
Robert J. Shapiro is the chairman of the Globalization Initiative of NDN. He is also chairman of Sonecon, LLC, a private firm that advises U.S. and foreign businesses, governments and non-profit organizations. Dr. Shapiro has advised, among others, U.S. President Bill Clinton and British Prime Ministers Tony Blair and Gordon Brown; private firms including Amgen, AT&T, Cisco, Gilead Sciences, Google, MCI, Inc., SLM Corporation, Nordstjernan of Sweden, and Fujitsu of Japan; and non-profit organizations including the American Public Transportation Association, the Education Finance Council, BIO, and the U.S. Chamber of Commerce. He is also a senior fellow of the Georgetown University Business School, a member of the Advisory Board for the Western Hemisphere of the International Monetary Fund, chair of the U.S. Climate Task Force, co-chairman of American Task Force Argentina, and a director of the Ax:son-Johnson Foundation in Sweden. From 1997 to 2001, he was U.S. Under Secretary of Commerce for Economic Affairs, where he directed economic policy for the U.S. Commerce Department and oversaw the nation’s major statistical agencies. Prior to that, he was co-founder and Vice President of the Progressive Policy Institute. Dr. Shapiro also served as principal economic advisor in William Clinton’s 1991-1992 presidential campaign, senior economic advisor to the presidential campaigns of Albert Gore, Jr. in 2000 and John Kerry in 2004, Legislative Director for Senator Daniel P. Moynihan, and Associate Editor of U.S. News & World Report. In 2008, he advised the campaign and presidential transition of Barack Obama. He has been a Fellow of Harvard University, the Brookings Institution, and the National Bureau of Economic Research. He holds a Ph.D. and M.A. from Harvard, as well as an A.B. from the University of Chicago and a M.Sc. from the London School of Economics and Political Science.
Jiwon Vellucci is a senior policy analyst at Sonecon, LLC. Prior to joining Sonecon, Ms. Vellucci, who is fluent in Mandarin and Korean, served as research analyst at the Peterson Institute for International Economics, where her work focused on the Chinese economy and U.S.-China economic relations. She received an M.A. in Asian Studies from the Elliott School of International Affairs at George Washington University and her B.A. with Magna Cum Laude honors from Ewha Woman’s University in South Korea. Ms. Vellucci is currently working on her M.S. in finance at the Johns Hopkins University Carey School of Business.