the impact of income tax over financial performance of ...online-cig.ase.ro/jcig/art/17_4_6.pdfthe...
TRANSCRIPT

Accounting and Management Information Systems
Vol. 17, No. 4, pp. 626-640, 2018
DOI: http://dx.doi.org/10.24818/jamis.2018.04006
The impact of income tax over financial
performance of companies listed
on the Bucharest Stock Exchange
Aurelia Ștefănescua, Ileana Cosmina Pitulicea1
and Viorica Georgiana Mînzua
aBucharest University of Economic Studies, Romania
Abstract: By its multiple facets, income tax is a subject of great interest both for
academic and professional environment, on a microeconomic and macroeconomic
level. After analyzing the relevant literature in the field, in order to demonstrate the
influence of income tax over a company’s performance, two econometric models
were designed, having as dependent variables return on equity and net profit’s
margin rate. For applying multiple regressions we used a sample of companies listed
on Bucharest Stock Exchange and the analysed indicators were extracted from their
annual financial statements. Econometric modelling used for return on equity and
net profit’s margin demonstrated that effective tax rate influences in a negative way
a company’s financial performance. Limits of research have been evidenced as
being methodological, such as the small size of the sample.
Keyword: empirical research, income tax, financial performance, listed
companies, Romania
JEL Classification: M41, C58, G31, M10, H32
1. Introduction
The aspects regarding companies’ income tax are of great interest both for the
European and national environment, considering the impact of this indicator on
1 Corresponding author: Ileana Cosmina Pitulice, Bucharest University of Economic
Studies, 6 Piata Romana, Bucharest, phone number: +40786557172, e-mail:

The impact of income tax over financial performance of companies listed
on the Bucharest Stock Exchange
Vol. 17, No. 4 627
budgeratry revenues and Gross Domestic Product. From the perspective of GDP
per capita, there are studies that demonstrate a convergence trend at European
Union level. Convergence is significant in new integrated member states and lower
in existing EU’s member states (Albu, 2012).
The divergences regarding the prevailing of EU’s interest over the national one for
what the income tax is concerned creat dissensions in the individual tax system and
the European one. The divergences between tax systems in the EU’s member states
are also determined by the different economic and social structures as well as
conceptual differences regarding the role of tax system in general and a certain tax
in particular (Georgescu, 2009).
The disparity of tax systems in the EU’s member states is validated by the results
of the study performed on the average tax rate by Devereux and Loretz (2008).
They have evidenced that there is a significant difference of the effective tax rate,
form 26.3% in Bulgaria (the minimum value) and 40.1% in Malta (the maximum
value), while the average value at Europen level is around 30%. Also, the authors
have tested the hypothesis of implementing the common tax base, in the same
circumstances and they found out that the value of this indicator would be
significantly reduced, the maximum value being reached in the same country,
Malta (29.9%) and the minimum one in Italy 18.3%. Devereux and Loretz (2008)
argue that the fiscal systems in EU would converge to a common denominator, thus
generating a neutral tax system.
In order to achieve the harmonization of the tax systems in EU, European
Commission has presented in 2001 the difficulties generated by the disparity of
taxing in EU member states: influencing (disstorsion) of resource allocation
negatively impacting on valuing the advantages of a real unique market as well as
the international repartition of income tax which can disadvantage certain member
states; the embrittlement of budgetary cash flow inputs by losses associated to fical
competition; the trend of increasing tax systems inequity by a privileged treatment
of mobile tax bases; the double taxing risk (Matei & Pîrvu, 2010).
The purpose of European Commission of harmonizing the fiscal systems at a
European level is known as the Common Consolidated Corporate Tax Base. It was
elaborated in 2011 and it is focused on the partially harmonization of income taxes
paid by companies that operate activites in the European space. The adoption of
this common income tax framework would be a value-added generator for: the
correlation of complexity and economic environment globalization to a correct,
efficient and fair tax system; coherent tax systems at EU’s member states lavel; the
decreasing trend of income tax non-payment intention; the elimination of double
taxation; social and economic effects by increasing investments and the decrease in
the unemploymetn rate.

Accounting and Management Information Systems
628 Vol. 17, No. 4
Several studies revealed that in Central and Eastern Europe, the average income tax rate is of approximately 17%. At EU’s level, in 2013-2014, only three member states have reduced the income tax percentage: Denmark (from 25% to 24.5%), United Kingdom (from 23% to 21%) and Slovakia (from 23% to 22%). From the EU’s member states, Romania has the lowest income tax percentage (16%) (Schöb & Geageac, 2014). Romania has introduced the income tax percentage of 16% in 2010, three years after of achieving the full EU membership status, the same percentage being used up to present. On the opposite side, income tax regulations (Fiscal Code) have been modified very often. Among the changes in income tax regulations, operated in the past five years, we can enumerate: fiscal concepts, contributors typology, fiscal year, declaration and payment procedure, correlation between fiscal rules and accounting regulations, the content of non-taxable revenues, the content of non-deductible expenses, the limits of deductible expenses, criteria for deductible expenses, particular aspects for fiscal depreciation, specific documents for fiscal procedures, procedures for correction of income tax calculation errors, fiscal losses. The research results performed by Pitulice et al. (2016) have validated the negative impact of income tax on financial position and performance of companies listed on Bucharest Stock Exchange (BVB). Thus, the two econometric models constructed for net profit and return on assets have validated the research hypotheses, that is the negative impact of income tax on financial position and performance. In this context, we empirically investigated the tax on profit’s impact over the company’s financial performance. Based on literature review performed in the first part of the paper, our research is developed on two coordinates – return on equity and net profit’s margin rate-, each one of them aiming to demonstrate and assess the tax impact over the selected indicators. For both econometric models, the effective tax rate has passed the significance test and it also has a negative influence ver performance indicators. This finding can represent a premise for future studies of a larger breadth, with results that can be generalized. This paper includes four structural components. The first one is dedicated to literature review by analyzing ideas published on this particular subject. Literature review is followed by research methodology. The third component presents research results while the fourth one is dedicated to final conclusions limits of research and future research directions.
2. Literature review From the literature review we might say that income tax is approached on different levels. Studies have revealed the fact that external financing is favoring companies by contrast to self-financing, considering the deductible interest expenses and the

The impact of income tax over financial performance of companies listed
on the Bucharest Stock Exchange
Vol. 17, No. 4 629
increased value of return on equity. Complementary, under the taxation context, the average cost of capital is dependent of three components: the discount rates used, tax percentage and the percentage of liabilities in the capital structure (Modigliani & Miller, 1963). Wu and Yue (2009) have researched the relationship between income tax percentages and the financing decision of economic entities in China. The research has considered the special taxation of income tax, that is 15% (the general taxation percentage being of 33%), facility of which certain economic entities have benefited based the area they acted in, but which was repealed later on. Thus, on a sample of 2.182 entities that benefited from special taxation of income, authors have analysed the changes in financial leverage from two perspectives: the maintenance of liabilities at the samel level and the decrease in equity, and contracting new loans with the increase in liabilities value. The results of the study have proved that financial leverage of these companies has increased with 3.3% following the increase of 18% in the tax percentage, and the degree of access on bank financing could be seen as a significant factor of financial structure. Sterdyniak (2015) approaches the relationship between tax income and social taxes. He considers that reducing social taxes can be compensated by an increase in income taxation of companies, effects being measured for short and medium term. On short term, companies’ return is not changed as the increase on income tax is compensated by reducing the workforce taxation. On medium term, entities use more workforces and less capital. Therefore, the global cost, calculated based on workforce’s cost and capital cost, does not change. An interesting approach of income tax is represented by financial performance. Ngobo and Stefani (2001) validates that financial performance is correlated to the activity sector, diversity and heterogeneity of economic entities based on a model that includes return on assets (ROA), return on investment (ROI) and q Tobin indicators. The results of the research performed by Njaya (2014) have evidenced that financial performance of economic entities is positively influenced by their social responsibility and adopting a responsible behavior does not involve a smaller profit. Another approach of income tax is generated by the fiscal aspects. From this point of view, there are numerous states that, for the income taxation of companies have adopted the possibility of deducting losses from the future fiscal years’ profits. However, this provision can impact on the performance of direct investments projects and implicitly on the investment decisions adopted by an economic entity. Several studies have evidenced that, although a certain investment project would be rejected based on the negative net present value determined by its adoption, the decision can radically change if the entity can recover a previous fiscal loss. In this

Accounting and Management Information Systems
630 Vol. 17, No. 4
respect, two entities have been analysed, one having a loss to recover while the other one didn’t both of them analyzing the adoption of an investment project with identical costs and cash-flows. Although individually, the net present value of the project is negative, the influence of recovering the previous loss is reflected in generation of a potential cash flow due to the tax economy which would be materialized only if the project is adopted (Dragotă & Ţâţu, 2011). Consequently, if an investor has to choose between two options, that is, setting up a new company and the acquisition of an existing one with a right to recover a previous loss, the investor would choose the second one.
The research results performed by Buijink et al. (2002) concerning the effective tax
rates applied during 1990-1996 by 15 companies – EU’s residents – have
evidenced the fact that certain incentives both permanent and temporary are
substantially different in EU member states and their effect is not the equalisation
of real tax burdens at EU level.
As to the fiscal competition, Gondor (2011) claims that it has a positive effect for
integration on EU’s market, and the goal of harmonizing direct taxes must be
staged from total harmonization to structural harmonization. Masso et al. (2013)
analyse the advantages and risks of cancellation of retained earnings and
maintaining taxation only for distributed profits, based on Estonia’s case. Among
the advantages of this reform with a greater impact over small entities there are
ennumerated the increase in assets with greater liquidity and the decrease in
companies financing through loans/liabilities. The risk involved by this fiscal
policy is that of the trend of keeping the liquidity surplus in assets with minimum
risk instead of making investments in equipments or research&development
activities.
Da Rin et al. (2011) analyse the impact of fiscal policies over the setting up of new
companies, considering the proportionate relationship between economic growth
and new companies’ set up by entrepreneurs. The research results proved a
significantly negative impact over the new companies setting up rate. As the effect
is a concave one, reducing taxes would influence the companies setting up rate
only if the taxation level is under a certain limit.
Devereux and Griffith (2002) research income tax from a multinational view.
Considering the increase of capital mobility between countries, the authors analyse
the impact of income tax on capital localization. They consider that income tax is
fundamental for attraction and maintaining capital by states’ governments. Thus,
the tax percentage used by one country influence a company’s decision to activate
or invest in that country.
Another approach of income tax is that correlated to the accounting regulations. Da
Rin et al. (2011) sustain that reducing income tax rate is more efficient in countries

The impact of income tax over financial performance of companies listed
on the Bucharest Stock Exchange
Vol. 17, No. 4 631
where accounting standards are of high quality. They argue the fact that the quality
of accounting standards used influence the possibility of hiding profit from taxation
by manipulation of income statement. Epps and Cleaveland (2009) identify the
difficulties of income taxation that accounting regulations, standards’
interpretations and FASB try to give pertinent solutions: the lack of transparency
for particular fiscal transactions, the difficulty in reconciliating income statement to
the income tax fiscal statement, low disclosure of information on fiscal
contingencies inside financial statements, the impact of internal control over the
reliability of income tax fiscal statement.
Reffering to the tax rates, the study conducted by Gondor (2011) has evidenced
that România has the lowest percentage of direct taxation; among the arguments
there can be enumerated the lower tax rates for income tax and the single tax rates
that generally assume a powerful minimization of direct rates comparing to the
indirect ones.
The revision of the presented approaches evidence the fact that income tax is an
integrated concept, considering its correlation with financing of entities, financial
performance, social responsibility, fiscal and social policies, accounting
regulations, macroeconomic and multinational aspects.
3. Research methodology
The sample we used comprised of a number of 20 companies listed at Bucharest
Stock Exchange, whose financial-accounting information were analysed for the
period 2013-2015. Selection of companies inside the sample depended on the
access to financial information therefore only quoted entities were included. The
selection criteria were:
the selection of a single industry in which companies operated, in order to
minimize as much as possible the action of certain factors characteristic
only to specific areas; manufacturing industry was considered;
we included in the sample only companies registered for the first and the
second category of Bucharest Stock Exchange;
we eliminated from the sample those quoted companies whose financial
statements were not available (their state was suspended) or they were only
partially available, in order to collect enough information for the empirical
study;
we retained only companies disclosing profit for the analysed period – this
adjustment was considered necessary so that no distortions were created
inside the econometric model.
In order to quantify the impact that income tax has over financial performance, we
used multiple regression analysis, using the Excel’s Data Analysis module and
Accounting and Management Information Systems
632 Vol. 17, No. 4
Eviews 9 program. Based on the results obtained, we performed significance tests,
corrections of the model where necessary and interpretations of these, in order to
be able to express pertinent conclusions at the end of the paper.
Literature review revealed several factors impacting on a company’s results. In this
respect, for the construction of the analysis model, the following variables were
used:
endogenous: return on equity (ROE), profit’s net margin rate (RMN);
exogenous: the effective tax rate (RIE), company’s size (DIM), assets’
structure (STRA), long-term debts rate (RDatTL), financial leverage (LEV).
The calculation formulas for the variables are listed in Appendix 1.
4. Research results
For each of the two endogenous variables, a multiple regression was performed, the
obtained results being interpreted for each one of them.
The Econometric Model of Return on Equity (ROE)
ROE = β1 + β2RIE + β3DIM + β4STRA + β5RDatTL + β6LEV + et
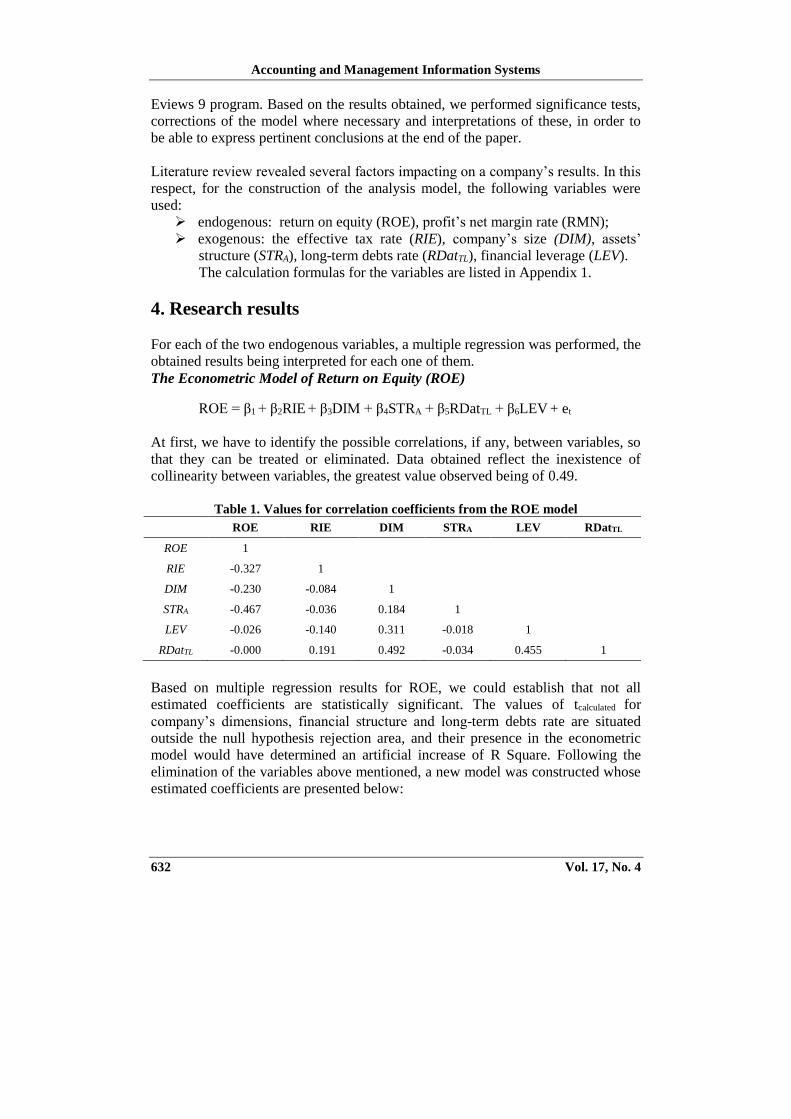
At first, we have to identify the possible correlations, if any, between variables, so
that they can be treated or eliminated. Data obtained reflect the inexistence of
collinearity between variables, the greatest value observed being of 0.49.
Table 1. Values for correlation coefficients from the ROE model
ROE RIE DIM STRA LEV RDatTL
ROE 1
RIE -0.327 1
DIM -0.230 -0.084 1
STRA -0.467 -0.036 0.184 1
LEV -0.026 -0.140 0.311 -0.018 1
RDatTL -0.000 0.191 0.492 -0.034 0.455 1
Based on multiple regression results for ROE, we could establish that not all
estimated coefficients are statistically significant. The values of tcalculated for
company’s dimensions, financial structure and long-term debts rate are situated
outside the null hypothesis rejection area, and their presence in the econometric
model would have determined an artificial increase of R Square. Following the
elimination of the variables above mentioned, a new model was constructed whose
estimated coefficients are presented below:

The impact of income tax over financial performance of companies listed
on the Bucharest Stock Exchange
Vol. 17, No. 4 633
Table 2. Estimated values for ROE model’s coefficients
Coefficients Standard Error t Stat P-value Lower 95% Upper 95%
Intercept 0.246 0.031 7.943 0.000 0.184 0.308
RIE -0.313 0.099 -3.145 0.002 -0.513 -0.113
STRA -0.210 0.048 -4.375 0.000 -0.306 -0.114
The t test confirms the fact that there are also other factors influencing the dependent variables and P-value is lower than the significance level α, therefore the coefficient is statistically significant.
The effective tax rate has an unfavourable effect over the analysed variable, as an increase of it with 1% determines a decrease of ROE with 0.3135 percentage points, if the other variables are kept on a constant level. The value of tcalculated is -3.1457, so RIE variable impacts over ROE.
The non-current assets percentage in total assets is the other independent variable and the estimated coefficient equals -0.2105. If assets structure is increasing by one percent, ROE will decrease by 0.2105 percentage points. The t test confirmed the fact that STRA variable has an impact over ROE, and by interpreting P-value, the coefficient can be considered significant.
Following the substitution of estimated coefficients, the model becomes: ROE = 0.246 – 0.313RIE – 0.210STRA
Table 3. Estimated values for quality analysis coefficients of ROE model
Regression Statistics
Multiple R 0.581
R Square 0.337
Adjusted R
Square 0.313
Standard Error 0.058
Observations 58
Anova
df SS MS F Significance F
Regression 2 0.094 0.047 14.038
Residual 55 0.185086 0.003365
Total 57 0.279573
The connection between analysed variables can be established at a medium level,
as a result of the 0.5813 value of Multiple R. Even more, a percentage of 33.79%
of the ROE’s variation is determined by the effective tax rate and assets’ structure.

Accounting and Management Information Systems
634 Vol. 17, No. 4
Considering that the econometric model we analysed is based only on these two
independent variables, this value is appreciated as acceptable. As the role of the
systematic factors is superior of the residual ones, the F statistics has a value that
exceeds the critical one (3.164). Thus, ROE’s variation is more determined by the
action of the determinant factors than by the role of happening. The probability
associated to the previous test is closing 0, which determines the econometric
model to be included in the category of statistically relevant models.
Test of the normality of errors
Figure 1. Histogram of errors in ROE model
Histogram of errors reveals an abnormal situation, as their variation is very high.
Also, the Jarque-Bera test has a high value that compared to the critical value
selected from the χ2 distribution with 2 freedom degrees, determines the hypothesis
of a normal distribution of errors. The residues of the model do not reveal a normal
distribution.
Autocorrelation of errors test
Following the performance of initial regression, which was added the êt-1 regressor,
the Lagrange Multiplier test determines the acceptance of alternative hypothesis,
that of the existence of autocorrelation of errors. The decision was made based on
P-value = 0.044 for the coefficient estimated for êt-1, probability which was lower
than the significance level α. In this respect, econometric model correction is
needed, so that we can obtain unbiased estimations of coefficients, as the following
table reveals.
Table 4. Estimated values for ROE Model’s coefficients in absence of autocorrelation
Coefficients
Standard
Error t Stat P-value Lower 95% Upper 95%
Intercept 0.241 0.035 6.859 0.000 0.170 -0.099
RIE -0.295 0.098 -3.014 0.003 -0.491 -0.099
STRA -0.205 0.052 -3.895 0.000 -0.310 0.311

The impact of income tax over financial performance of companies listed
on the Bucharest Stock Exchange
Vol. 17, No. 4 635
Test of heteroscedasticity of errors
The White test statistics has registered a value of 15.15 and it is higher than the
critical one selected from χ2 = 11.07, which determines the rejection of
homoscedasticity null hypothesis H0. Therefore, the serie presents
heteroscedasticity which will be presented as a limit of the research.
The Econometric Model of Profit’s Net Margin Rate (RMN)
RMN = β1 + β2RIE + β3DIM + β4STRA + β5RDatTL + β6LEV + et
In the table below, the obtained correlation coefficients are presented with
relatively low values, fact that concludes the lack of multicollinearity. The highest
identified value is 0.4921 that of the correlation coefficient established between
company’s dimension and long-term debts rate.
Table 5. Values of correlation coefficients from the RMN model
RMN RIE DIM STRA LEV RDatTL
RMN 1
RIE -0.355 1
DIM -0.047 -0.084 1
STRA -0.466 -0.036 0.184 1
LEV -0.260 -0.140 0.311 -0.018 1
RDatTL -0.046 0.191 0.492 -0.034 0.455 1
Following the performance of the initial regression, the output offers enough
arguments for restriction of the model, as not all of the five coefficients are
statistically significant. The unsignificant coefficients (company’s dimension and
long-term debts rate) will be excluded from the model. Variables that will be tested
for their influence over the analysed RMN are effective tax rate, assets’ structure
and financial leverage. The interpretation of their action is based on the estimated
coefficients presented below:
Table 6. Estimated values of RMN model’s coefficients
Coefficients Standard Error t Stat P-value Lower 95% Upper 95%
Intercept 0.224 0.023 9.394 0.000 0.176 0.272
RIE -0.286 0.068 -4.163 0.000 -0.424 -0.148
STRA -0.160 0.032 -4.883 0.000 -0.226 -0.094
LEV -0.050 0.015 -3.260 0.001 -0.081 -0.019
The value of Intercept represents, as in ROE’s model, the only estimation of
regression that determines a positive influence over the analysed indicator. There

Accounting and Management Information Systems
636 Vol. 17, No. 4
can be concluded that there are other factors, not included in the model,
determining the positive variation of profit’s net margin rate.
The effective tax rate variable influences the endogenous variable in a decreasing
direction. When effective tax rate increases by 1%, the RMN will count for a
decrease of 0.2868 percentage points. The t test proved the fact that RIE has an
effect on endogenous variable, its calculated value (-4.1632) being lower than the
critical one. The coefficient can be considered as statistically significant, due to P-
value lower than 0.05.
The estimated coefficient for STRA variable has a negative value, indicating that the
increase by 1% of assets’ structure rate determines a decrease of RMN by 0.1608
percentage points. The t test (-4.8835) value being lower than the critical one, it
can be concluded that the percentage of non-current assets in total assets has an
effect over the dependent variable modifications. Even more, the estimated
coefficient is statistically significant due to P-value being close to 0.
The financial leverage is the variable influencing the less RMN variable. However,
this is the only model in which this variable is significant which determines its
keeping in the final regression model. The estimated coefficient of LEV variable is
-0.0507, therefore an increase in it with 1%, will determine a decrease of
endogenous variable by the same value. By comparing the calculated value of the
report (tcalculated = -3.2605) with the critical value (tcritical = -2.3056) it can be
appreciated that part of the RMN’s variation is due to LEV variation. Although,
P-value equal to 0.0019 is under the significance level α, which means that the
coefficient is statistically significant.
Following the substitution of estimated coefficients, the model becomes:
ROA = 0.224 – 0.286RIE – 0.160STRA – 0.050LEV
The table below offers the information necessary for validating the model in its
whole, so that a subsequent opinion over the quality of the estimations could be
formulated. The variation of RMN is divided in two elements: the explained
variance, provided by the effect of the factors included in the model, with the value
of 0.073 and the unexplained variance provided by the model’s errors, with the
value of 0.085. As the role of the systematic factors is higher than that of the
residual factors, that is 0.024>0.001, the F statistics value is higher than the critical
one (Ftabled= 2.775) and thus, the rejection of the null hypothesis is evident. The
action of determinant factors over the RMN is significantly different of the role of
happening. The analysis of the probability associated to Fisher-Snedecor test
reveals a favourable circumstance, the Significance F value being lower than the
significance level α, thus confirming the statistical relevance of the model.

The impact of income tax over financial performance of companies listed
on the Bucharest Stock Exchange
Vol. 17, No. 4 637
Table 7. Estimated values for quality analysis coefficients of RMN model
Regression Statistics
Multiple R 0.680
R Square 0.462
Adjusted R Square 0.432
Standard Error 0.039
Observations 58
Anova
df SS MS F Significance F
Regression 3 0.073 0.024 15.487 2.17E-07
Residual 54 0.085 0.001
Total 57 0.158
Test of the normality of errors
The errors variation in RMN model is high, their histogram indicating an abnormal
situation. Although, the analysis of the results in Jarque-Bera test confirms the
conclusion based on graphic method, its calculated value of 110.808 being higher
than the critical value of 5.991 (based on χ2 distribution with 2 freedom degrees).
Therefore, conclusion is that the residues of the model are not normally distributed.
Figure 2. Histogram of errors in RMN model
Autocorrelation of errors test
Following the performance of initial regression, which was added the êt-1 regressor,
the Lagrange Multiplier test determines the acceptance of null hypothesis, that of
the inexistence of autocorrelation of errors. The decision was made based on
P-value=0.082 for the estimated coefficient of êt-1, which is higher than the
significance level α. It can be concluded that the results obtained are the best
unbiased estimations of coefficients.

Accounting and Management Information Systems
638 Vol. 17, No. 4
Test of heteroscedasticity of errors
The White test represented the testing method for heteroscedasticity of RMN
model. The test’s statistics is 31.827, higher than the critical one selected from the
repartition χ2=16.918 (for α=0.05 and 9 degrees of freedom), so the null hypothesis
H0 of homoscedasticity will be rejected in favour of alternative H1. The serie
presents heteroscedasticity which is one limit of the research.
5. Conclusions
The research performed evidence that, on a conceptual level, income tax is
approached in an integrated manner, based on its dimensions focused on fiscal
policies, accounting regulations, performance, social responsibility, investors and
macroeconomic policies.
The purpose of this research was that of identifiying a possible influence of income
tax over company’s financial performance and position. Following the analysis of
performance concept, two representative indicators were selected in this respect
that is ROE and RMN. For each one of these an econometric model was
constructed in order to explain the variation of the performance indicator, also
determined (more or less) by the effective tax rate variable. It was essential that tax
impact is identified in its correlation with other factors and not on an individual
basis, thus using multiple regressions.
For the Return on Equity model several insignificant variables were excluded as
keeping them inside the model would have artificially increased the determination
report. Model’s coefficients, except the free term, were estimated as negative,
reflecting the fact that none of the selected variables positively influences the
sampled companies’ performances. However, the purpose of analyzing the income
tax effect was fulfilled, the estimated coefficient for this variable being significant.
Performance indicator variation is generated in a 31.39% percentage by the
determined factors, considered as significantly different from the role of
happening.
The second model we have studied, that of net profit’s margin, was different from
the previous one by the appearance of financial leverage variable, its influence over
the analysed indicator being a negative one. As to the effective tax rate, the same
conclusion as for the previous model was reached: income tax negatively
influences the net profit’s margin rate. If looking at the whole of the econometric
model, it can be assessed that the action of determinant factors over the net profit’s
margin model is significantly different from the role of happening.
As to the limits of the research, these are of methodological nature. First of all, the
sample was formed of only 20 companies listed on Bucharest Stock Exchange,

The impact of income tax over financial performance of companies listed
on the Bucharest Stock Exchange
Vol. 17, No. 4 639
which can be appreciated as a low number. Also, considering the fact that analysis
could not be performed over one single sector of the manufacturing industry due to
the insufficiency of data, there could be particularities specific to each sector that
are not taken into account. Even more, limits due to econometric modeling as well
as those provided by the authors’ analysis are inherent in an empirical research. As
the research results provided, for the limits of the research we have to take into
consideration the homoscedasticity tests results delivered for each of the two
models.
References
Albu, L.L. (2012) “The Convergence Process in the EU Estimated by Gini
Coefficients”, Journal of Economic Forecasting, 15(4): 5-16
Buijink, W., Janssen, B. & Schols, Y. (2002) “Evidence of the effect of domicile
on corporate average effective tax rates in the European Union”, Journal of
International Accounting Auditing and Taxation, 11(2):115-130
Devereux, M.P. & Loretz, S. (2008) “Increased efficiency through consolidation
and formula apportionment in the European Union?”, Oxford University
Centre for Business Taxation Working Pape 08/12, http://www.sbs.ox.ac.uk
/sites/default/files/Business_Taxation/Docs/Publications/Working_Papers/Se
ries_08/WP0812.pdf [on-line access: September 1th 2016]
Devereux, M.P. & Griffith, R. (2002) “The impact of corporate taxation on the
location of capital: A review”, Swedisch economic policy Review, 9: 79-102
Dragotă, V. & Ţâţu L. (2011) “Capital Budgeting: a Tax Shields’ ‘Mirage’”?,
Theoretical and Applied Economics, 3(556): 29-38
Epps, K.K. & Cleaveland, M.K. (2009) “Insiders’ perspectives of the effects of
recent regulation on corporate taxation”, Research in Accounting Regulation,
21(1): 34-47
Georgescu, M.A. (2009) “The tax burden in EU-27”, Studia Universitats Babes-
Bolyai, Negotia, LIV(1), available at ftp://ftp.repec.org/opt/R eDIF/RePEc/
bbn/journl/2009_1_8_Georgescu.pdf [on-line access: September 1th 2016]
Gondor, M. (2011) “Reglemented harmonization vs fiscal competition in the field
of direct European direct taxation, Studia Universitatis Petru Maior, Series
Oeconomica, vol. 1, no. 1(13), http://www.annals. seap.usv.ro/index.php
/annals/ article/ view File/393/403 [on-line access: September 1th 2016]
Masso, J., Meriküll, J. & Vahter, J. (2013) “Shift from gross profit taxation to
distributed profit taxation: Are there effects on firms?, Journal of
Comparative Economics, 41(4): 1092-1105
Marco, Da Rin, M., Di Giacomo, M. & Sembenelli, A. (2011) “Entrepreneurship,
firm entry, and the taxation of corporate income: Evidence from Europe”, Journal of Public Economics, vol. 95(9-10): 1048-1066

Accounting and Management Information Systems
640 Vol. 17, No. 4
Matei, G. & Pîrvu, D. (2010) “Controversies regarding the corporate tax
harmonization trend in the European Union”, Theoretical and Applied
Economics, 8(549): 27-37
Modigliani, F. & Miller, M. (1963) “Corporate income taxes and the cost of
capital: a correction”, American Economic Review, 53(3): 433-443
Njaya, J.B. (2014) “L’impact de la responsabilité sociale (RSE) sur la performance
financière des entreprises (PFE) au Cameroun”, Revue Congolaise de
Gestion, 1(19): 89-112
Ngobo, P.V. & Stefani, E. (2001) “Les différences de performance financière entre
les entreprises: résultats du marché français”, Finance Contrôle Stratégie,
4(1): 89-121
Romania’s Parliament (2015) Legea nr. 227/2015 privind Codul Fiscal [Law no.
227/2015 regarding the Fiscal Code], published inthe Official Monitor of
Romania no. 688/10.09.2015, updated with all modifications and subsequent
completions
Pitulice, I.C., Ștefănescu, A., Mânzu, G., Popa, F., A., Niculescu (Diaconu), A.
(2016) “Reserch of corporate tax impact on financial performance. Case of
companies listed on Bucharest Stock Exchange”, Management and Economics
Review, 1(2): 203-261
Schöb, R. & Geageac, E. (2014) Studiu regional MAZARS Central Eastern
European Tax Brochure 2014, http://rum.mazars.ro/Prima-pagina/Stiri/Presa
/Comunicate-de-presa/Studiul-Fiscal-Regional-Mazars-2013-2014/ [on-line
access: September 1th 2016]
Sterdyniak, H. (2015) “La grande réforme fiscale, un mythe français”, Revue de
l'OFCE, 3 (139): 327-397
Wu, L. & Yue, H. (2009) “Corporate tax, capital structure, and the accessibiliy of
bank loans: Evidence from China”, Journal of Banking & Finance, 33(1):
30-38
Appendix 1 Calculation formulas for variables
Variable Calculation Formula
Return on Equity (ROE) Net profit/Equity * 100
Effective Tax Rate (RIE) Tax/Gross profit * 100
Assets’ Structure (STRA) Non-curent assets/Total assets * 100
Financial Leverage (LEV) Total liabilities/Equity * 100
Long-term Debts Rate (RDatTL) Long-term liabilities/Total assets * 100
Profit’s net Margin Rate (RMN) Net profit/Turnover * 100