the impact of inquiry learning on students by andrew …
TRANSCRIPT
THE IMPACT OF INQUIRY LEARNING ON STUDENTS’
ABILITY TO ANALYZE DATA AND
DRAW CONCLUSIONS
by
Andrew Paul Heller
A professional paper submitted in partial fulfillment
of the requirements for the degree
of
Master of Science
in
Science Education
MONTANA STATE UNIVERSITY
Bozeman, Montana
July 2015
©COPYRIGHT
by
Andrew Paul Heller
2015
All Rights Reserved
ii
TABLE OF CONTENTS
1. INTRODUCTION AND BACKGROUND ....................................................................1
2. CONCEPTUAL FRAMEWORK ....................................................................................3
3. METHODOLOGY ..........................................................................................................8
4. DATA AND ANALYSIS ..............................................................................................14
5. INTERPRETATIONS AND CONCLUSIONS .............................................................30
6. VALUE ..........................................................................................................................33
REFERENCES CITED ......................................................................................................37
APPENDICES ...................................................................................................................39
APPENDIX A: Impact Cratering...........................................................................40
APPENDIX B: Tables and Graphs Test ...............................................................44
APPENDIX C: Performance Assessment Rubric .................................................58
APPENDIX D: Crustal Sinking Performance Assessment ..................................61
APPENDIX E: Scale Model of the Solar System Performance Assessment .......66
APPENDIX F: Time on Task Recording Chart ....................................................72
APPENDIX G: Attitudes towards Science Survey ...............................................74
APPENDIX H: Interview Questions ....................................................................80
APPENDIX I: Data Collection Timeline ..............................................................83
APPENDIX J: IRB Form ......................................................................................86

iii
LIST OF TABLES
1. Data Matrix ....................................................................................................................10
2. Raw Score Average Growth on Tables and Graphs ......................................................18
3. Results of Time on Task Observations ..........................................................................21

iv
LIST OF FIGURES
1. Tables and Graphs Test Scores for All Student Groups ................................................15
2. Performance Task Average Raw Scores ........................................................................19
3. Science Attitude Survey Results for Student Engagement Items ..................................23
4. Science Attitude Survey Results for Student Motivation Items ....................................24
5. Science Attitude Survey Results for Student Confidence Items ....................................25
6. Science Attitude Survey Results for Impact on the Teacher .........................................28

v
ABSTRACT
Previous research suggests that involving students in real world inquiry projects
improves their understanding of science content. Some particular features that inquiry
teachers use include being a facilitator, modeling inquiry, encouraging student thinking,
and engaging students in self-directed learning in which students solve problems,
hypothesize, interpret data, create experiments, and explain findings. The primary focus
of this study was to determine the impact of inquiry learning on sixth grade students’
ability to analyze science data and draw conclusions. The 5E’s inquiry teaching model
was used during the research. The 5E’s include engage, explore, explain, elaborate and
evaluate. They are a series of steps when lesson planning that involves creating
excitement, asking questions and designing ways to answer questions, sharing
information and then taking investigations a step further or to the next level. Activities
that were appropriate for Earth Science were selected. Each successive inquiry activity
utilized a gradual release of inquiry components. The outcomes of a five week inquiry
unit were compared to the results of a five week traditional teaching unit. The results of
this study suggested both traditional and inquiry teaching are important to develop well-
rounded science students. Inquiry teaching improves students’ ability to apply science
skills to data and analysis and drawing conclusions tasks. This produces strong science
thinkers. Traditional teaching improves students’ ability to demonstrate data analysis and
drawing conclusions skills on traditional tests. Because students need all of these skills,
both teaching methods should continue to be an integral part of teaching.

1
INTRODUCTION AND BACKGROUND
In my classroom I have found that students struggle with data analysis and
drawing conclusions. This seems to be especially true when they are working with data
and numbers that they don't find meaningful. When students are presented with data
tables or graphs from an outside source that they have difficulties relating to, they don't
seem motivated to explore and to draw valid conclusions about the data. Students seem
more motivated when they have been involved in asking the questions or collecting the
data. I can make scientific data and numbers more meaningful to students by involving
them in inquiry tasks that require them to take ownership of the science lab or activity.
I’ve learned that although utilizing an inquiry teaching method during lab type activities
is an important step to developing young science minds, it is not in itself enough. I must
also strive to teach students to think like scientists by having them analyze how the
results of theirs and others research and data impact science knowledge and
understanding. I need to teach them what inquiry is and means. I feel like discussions
about data analysis and drawing conclusions could be a great way to do this.
This study is significant to my classroom because, The Next Generation Science
Standards (NGSS) lists Analyzing and Interpreting Data and Constructing Explanations
as Science and Engineering Practices that all students need to master. It is important for
me to find effective methods for teaching data analysis and drawing conclusions.
Students in Wisconsin will continue to take the Wisconsin Knowledge and
Concepts Exam (WKCE) as a state-wide standardized test in the science area. This test
focuses largely on data analysis and drawing conclusions. Students are often asked to use
2
general science background knowledge and apply it to analyze and draw conclusions
about data from tables, charts, graphs and diagrams. In addition to Analyzing and
Interpreting Data and Constructing Explanations, the NGSS also lists six other Science
and Engineering Practices that are necessary for students. Several of these practices such
as Asking Questions and Defining Problems, Developing and Using Models, and
Planning and Carrying Out Investigations are inherent in the inquiry process. By using
inquiry to teach data analysis and drawing conclusions I feel that I am preparing students
for high stakes testing and they are learning the Science Practices from The NGSS. My
classroom experiences have led me to the question, how can I improve students' ability to
analyze data and draw conclusions?
My primary research question is “What is the impact of an inquiry-based unit
which emphasizes data analysis and drawing conclusions in a 6th grade Earth Science
classroom?” The following are sub-questions:
1. How does the outcome of inquiry as a teaching method for data analysis and drawing
conclusions compare to the outcome of more traditional teaching methods for data
analysis and drawing conclusions?
2. How do students react to inquiry learning (confidence, engagement, and motivation?)
3. How does inquiry teaching affect the teacher?
My support team included Val Williams, Karl Ascher, Tom Rheinheimer, and
Kristin Heller. Val is another teacher on my sixth grade team. She is the math teacher so
she also does significant teaching of data analysis and drawing conclusions based on data.
Val and I will be collaborating to write a proposal for a new STEM class for our sixth
3
grade students next year. Karl is the eighth grade science teacher at Parkside where I
teach. He has been teaching for many years and has had many great insights from a
science perspective. Tom was the principal at Parkside. Tom is a very data driven
person. A lot of our past school decisions were made based on the numbers. He is also a
very goal driven individual. Tom has recently moved to the high school and is the
principal there. Deb Premo is the new principal at Parkside. I have looked to her for
input and support also. Kristin is my wife and a fellow teacher. She is a language arts
teacher and she has had valuable advice about the written portion of my final project. I
have selected these people because they are the ones that I find myself naturally going to
when I when I need advice or just to talk about something at school. They are all very
supportive in nature, yet have been able to provide me with constructive feedback in a
positive way so that I can continually improve my project.
CONCEPTUAL FRAMEWORK
Research Studies
In a research study of 94 tenth grade science students Tarirab and Khalaf Al-
Naqbi (2003) found that students struggle more during qualitative analysis (finding
trends) than quantitative reading (reading points and identifying values) of graphs. The
authors suggested that a possible reason for this was that students are more frequently
asked to work with graphs quantitatively than qualitatively. The researchers then
consulted commonly used textbooks to confirm this. I included both quantitative and
qualitative analysis practice in my action research study, specifically focusing instruction
on finding trends qualitatively.
4
In addition, Tarirab and Khalaf Al-Naqbi (2003) interviewed students to find
strategies that students used to interpret and construct graphs. Their interview results
revealed that students’ performance were sometimes hindered by their inability to
correctly identify the types of graphs they were interpreting. In my action research
students were exposed to a variety of types of graphs and tables.
In a study of 59 inner city sixth grade students, Lee and Butler (2003) found that
involving students in real world inquiry projects improves their understanding of science
content when three important criteria have been met. The first is that the inquiry project
matches student’s content knowledge and past activities. The second condition is that
content knowledge is taught while real science thinking is taking place. The final
criterion is that students need guidance in order to meet both the content and inquiry
goals. I focused my action research inquiry methods on real world situations that relate
to students’ background and growing knowledge.
Bilbrey and Taylor (2012) conducted a study in a rural Alabama school with
1,210 students about the impact of inquiry on fifth grade science students. The study
measured state test scores of fifth grade students for three years with traditional teaching
methods. Then compared it to three years with inquiry teaching methods. The school
used a method known as the Alabama Mathematics, Science, and Technology Initiative.
These methods include extensive professional development for teachers along with the
implementation of inquiry based learning units and necessary supplies. Researchers
found no significant impact from inquiry on the fifth grade group as a whole. However
when completing further analysis the study found significant impact for certain

5
subgroups. The subgroups who showed significant growth during inquiry were male
students, students living in poverty, and African American students.
Theoretical Background
According to the Center for Science, Mathematics, and Engineering Education
(2000), inquiry standards were described as including both abilities and understandings.
The National Science Education Standards include both Fundamental Abilities Necessary
to do Scientific Inquiry and Fundamental Understandings about Scientific Inquiry.
Reforms were made to shift from inquiry as simply a set of skills to inquiry as
both skills and an understanding of inquiry. It doesn’t appear that this shift has been
carried out in classrooms (Abd-El-Khalick et al 2004). Instead it seems the focus is still
on students doing independent inquiries. To stress the importance of understanding
inquiry Abd-El-Khalick et al (2004) explain
Indeed, do we expect citizens to execute a scientific investigation every time a
decision on a science-related personal or social issue is needed: Of course not,
rather our citizens are expected to know enough about science content, inquiry,
and the NOS to be able to understand scientific claims and make informed
decisions (p. 402).
While studying the effects of inquiry learning on students’ ability to analyze and
interpret data, I used our data analysis as an opportunity to discuss how scientists look at
the work of other scientists and make decisions about the value of the research as well as
asking new questions that stem from the results.
6
Anderson (2002) says that there is not a clear definition of what inquiry teaching
is in the research that has been done. “While research says inquiry teaching can produce
positive results, it does not, by itself, tell teachers exactly how to do it” (Anderson, 2002,
p. 4). Some particular features that inquiry teachers use include being a facilitator,
modeling inquiry, encouraging student thinking, and engaging students in self-directed
learning in which students solve problems, hypothesize, interpret data, create
experiments, and explain findings.
The Center for Science Mathematics, and Engineering (2000) has identified
common components in several inquiry based learning models, the basis of which can be
traced back to Piaget’s theory of development. The components include a question that
creates inconsistency with their thinking and motivates them to learn more, exploration
that leads to hypotheses and explanations, data analysis and interpretation that puts their
ideas together, extending their learning to new situations, and reflection. I used the 5E’s
inquiry teaching model as my treatment method during my action research. The 5E’s
include engage, explore, explain, elaborate and evaluate. They are a series of steps when
lesson planning that involves creating excitement, asking questions and designing ways
to answer questions, sharing information and then taking investigations a step further or
to the next level.
Research Methodologies
In her research about the impact of small groups, Moyer (2011) used a data
collection matrix to show the 3 data sources she used to evaluate each of her research

7
questions. I used the matrix tool as I planned for multiple methods of data collection for
each of my research sub questions.
Additionally, Moyer (2011) used several graphs to make her data very visual and
easy to understand. When recording and reporting observational data, she used a
numbering system to match with desirable behavior in order to quantify student behavior.
Zero was no data, 1 meant no, 2 was some of the time, 3 meant most of the time, and 4
was all of the time. Both of these strategies made the data accessible and easy to
understand. I have used graphs in my action research data analysis to visually display my
data. I will also use a numbering system to make my observational data more
understandable.
Tarirab and Khalaf Al-Naqbi (2003) provided some valuable information on how
to validate questions used in an assessment piece. The authors involved other science
teachers to determine which questions should be used in the final assessment tool. In
creating my pre and post assessments I sought input from other teachers in my school
district.
In his research about the impact of iPads in science education Benson (2013) used
a numerically coded Likert scale to assess students’ motivation to learn science. I used a
similar method to assess students’ confidence and motivation relating to data analysis.
Benson (2013) also utilized a data triangulation matrix and bar graph to make data easy
to follow and comprehend. As I mentioned earlier, these are valuable tools I incorporated
into my research project.
8
METHODOLOGY
Treatment
First, I used a five week unit that incorporated data analysis and drawing
conclusions using traditional teaching methods. At this time students were made aware
that they were participants in the research I was completing on teaching methods. Then I
taught a five week unit that incorporated data analysis and drawing conclusions using an
inquiry teaching method. Each unit was the same length in terms of the number of class
periods students were engaged in the specific teaching method. I had one science
colleague and one math colleague review the units to help ensure that they were of equal
difficulty.
The traditional teaching method used was teacher centered instruction. Short
lectures were used as a primary mode of instruction. Science labs and activities that were
performed were highly structured and guided students step by step through the lab or
activity. The topics I covered during this traditional teaching were related to plate
tectonics. During the unit, students worked with analyzing data and drawing conclusions
in one of two ways. They completed structured lab activities that walked them through
each step in the procedure and then analyzed the data and drew conclusions based on the
lab. The other type of activity completed was the students worked with data that was
given to them by the teacher. Students were asked to analyze the data and draw
conclusions from it.

9
The treatment method I used was the 5E’s model for teaching inquiry. The first
inquiry activity was solar system argumentation. The second inquiry method involved
students exploring the role of gravity in the solar system. The third inquiry project was
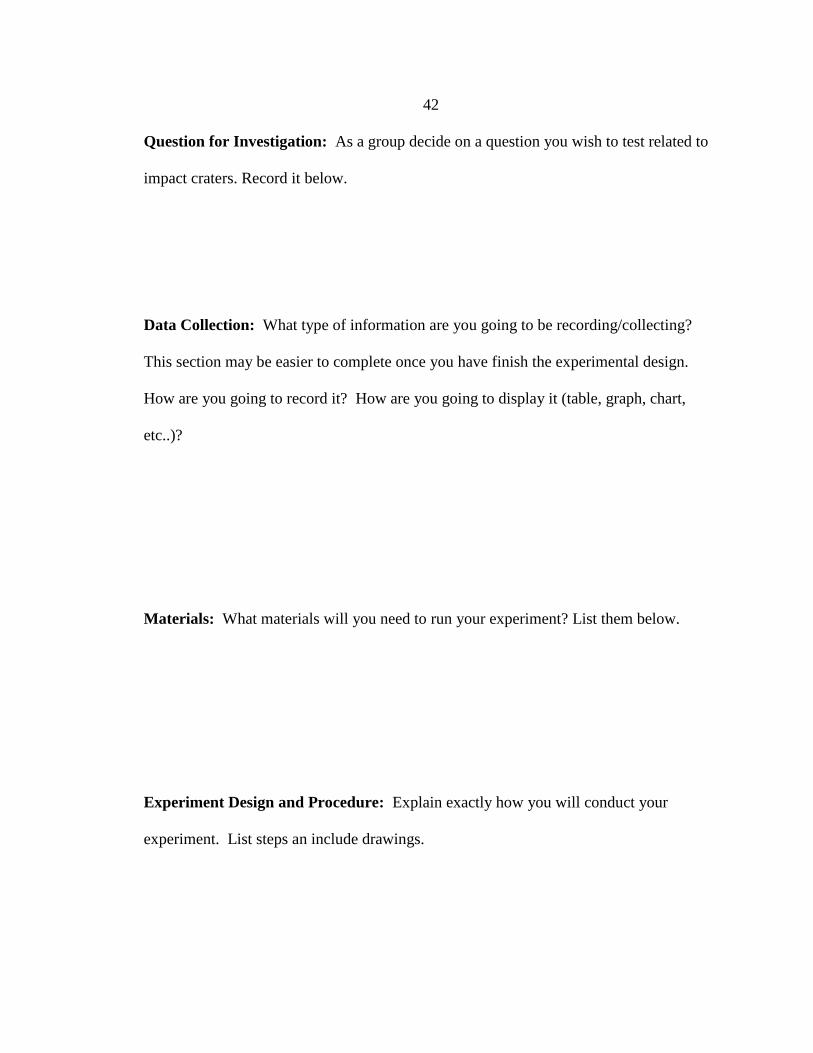
an investigation of impact cratering. Student instructions for the impact cratering project
have been included as Appendix A. I used a gradual release of responsibility method for
introducing each of the inquiry projects as my students had limited experience with self-
directed inquiry. All students performed all the steps of the 5E’s model. However,
during the first inquiry project students performed some of the steps as a class and some
in small groups. The second project had students complete most of the steps in groups.
The last inquiry project had students completing all of the 5E’s steps in their groups with
the final data analysis and conclusions drawn on their own.
During these 5E’s lessons the majority of students’ time was spent on the explore,
explain, and evaluate steps. The explore step typically took about two 90 minute class
periods. This included brainstorming questions, investigating the materials, designing the
experiment, and finally carrying out the experiment. The explanation step typically took
about one class period. This involved constructing graphs and tables, analyzing data, and
drawing conclusions. The evaluation step also took about one class period. This was
when students shared their findings. They were required to question their peers and
defend their own evidence. Both the engage and extend steps took significantly less time
ranging between 15 and 45 minutes. Most of this was done as whole group
demonstrations and discussions or small group activities.
10
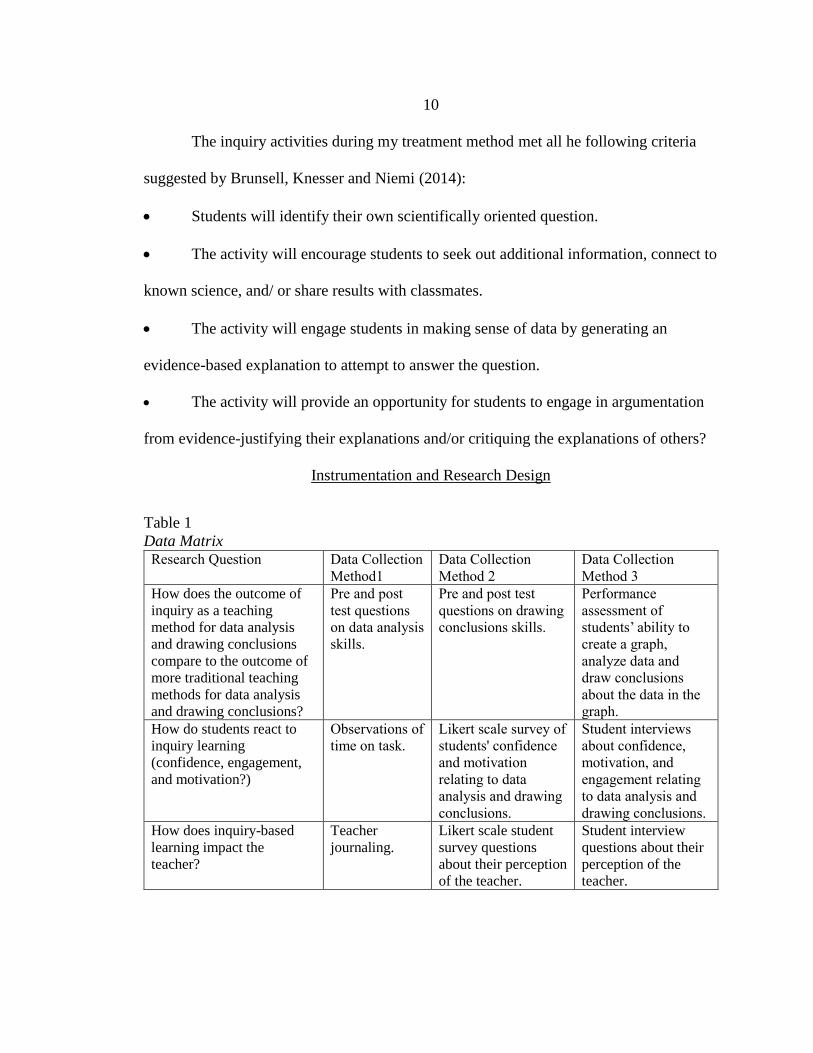
The inquiry activities during my treatment method met all he following criteria
suggested by Brunsell, Knesser and Niemi (2014):
Students will identify their own scientifically oriented question.
The activity will encourage students to seek out additional information, connect to
known science, and/ or share results with classmates.
The activity will engage students in making sense of data by generating an
evidence-based explanation to attempt to answer the question.
The activity will provide an opportunity for students to engage in argumentation
from evidence-justifying their explanations and/or critiquing the explanations of others?
Instrumentation and Research Design
Table 1
Data Matrix Research Question Data Collection
Method1
Data Collection
Method 2
Data Collection
Method 3
How does the outcome of
inquiry as a teaching
method for data analysis
and drawing conclusions
compare to the outcome of
more traditional teaching
methods for data analysis
and drawing conclusions?
Pre and post
test questions
on data analysis
skills.
Pre and post test
questions on drawing
conclusions skills.
Performance
assessment of
students’ ability to
create a graph,
analyze data and
draw conclusions
about the data in the
graph.
How do students react to
inquiry learning
(confidence, engagement,
and motivation?)
Observations of
time on task.
Likert scale survey of
students' confidence
and motivation
relating to data
analysis and drawing
conclusions.
Student interviews
about confidence,
motivation, and
engagement relating
to data analysis and
drawing conclusions.
How does inquiry-based
learning impact the
teacher?
Teacher
journaling.
Likert scale student
survey questions
about their perception
of the teacher.
Student interview
questions about their
perception of the
teacher.

11
The pre and post test questions were well suited to assess the outcome of inquiry
teaching compared to the outcome of more traditional teaching because I compared
student growth during an inquiry unit to growth during a traditional unit. The Tables and
Graphs Test is included as Appendix B. This quantitative data showed me the impact of
inquiry on students' ability to analyze data and draw conclusions. Each of the pretest and
post test questions has been assigned a Bloom's Taxonomy level. The rubric used to
assess the performance tasks has also been aligned to Bloom's Taxonomy. The
Performance Assessment Rubric is included as Appendix C. This allowed me to further
analyze if students made gains, stayed the same, or went down in both areas of higher and
lower level thinking skills. Using both multiple choice questions on the pretest and
posttest as well as assessing student's skills through performance assessments provided
me with a picture of how students have grown in both evaluating science data and doing
science. In order to help insure validity I had the eighth grade science teacher, the sixth
grade math teacher, and the building principal read the test and give me feedback on the
value and skill level of each item. I made slight modification to the wording of some
questions based on their feedback. In order to help insure reliability I had a group of
students that I had last year take the test. These students scored approximately how I
predicted they would based on my knowledge of their science ability from last year.
The performance assessment rubric was used to assess students’ performance on a
skills based learning task. Students completed one performance task, Crustal Sinking,
during the non-treatment unit and one performance task, Scale Model of the Solar
System, during the treatment unit. The Crustal Sinking Performance Assessment and the

12
Scale Model of the Solar System are included as Appendix D and E. For each task
students constructed a data table and a graph. In addition, students completed three
questions. One question required them analyze the information in their graph. A second
question required them to synthesize the information from the graph with their
background knowledge. The evaluation question required students to take the
information from the graph and apply it to a unique scenario. The performance
assessments provided quantitative data as I used a rubric to score students skills after the
traditional and inquiry units. I also analyzed these qualitatively looking for patterns in
the way they supported their findings and areas of strength or weakness. In order to help
insure validity and reliability both of these came from the Performance Assessment Links
in Science (PALS) resource bank which is a vetted website source.
Additionally, I used time on task observations, Likert surveys, interviews and
journaling to gather data about students’ confidence, engagement and motivation and the
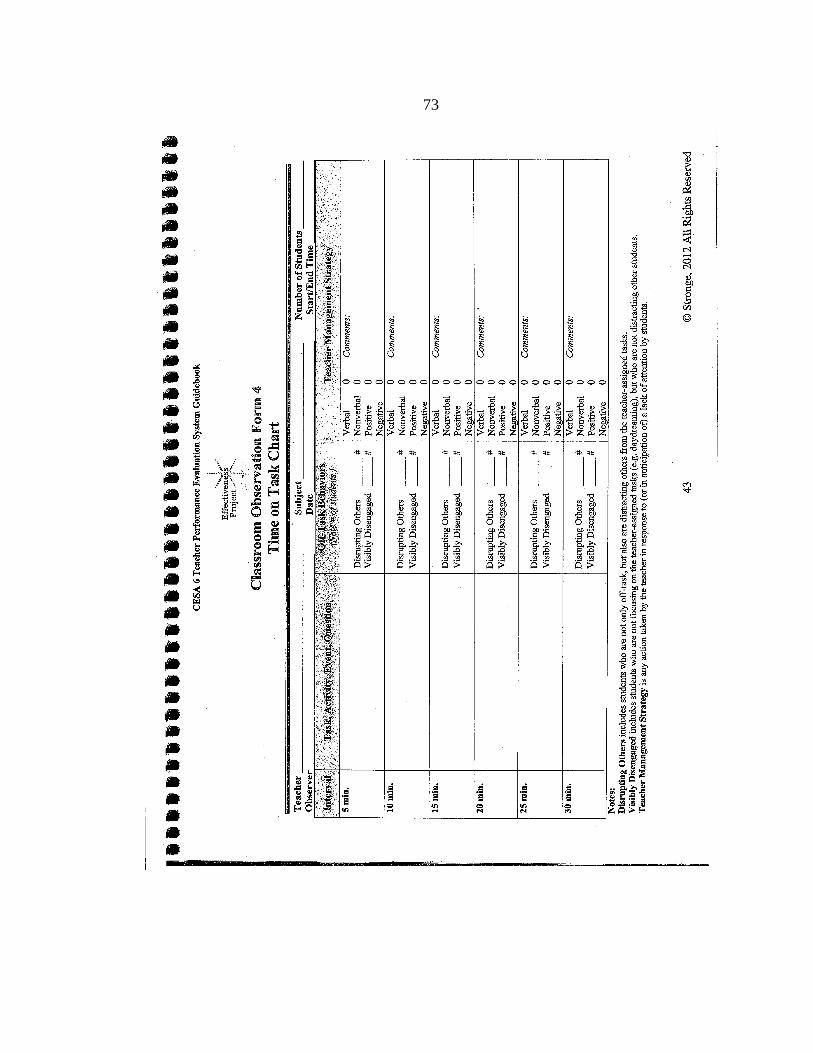
impact on the teacher. I used time on task recording instrument from Dr. Stronge’s
Educator Effectiveness Project. The Time on Task Recording Chart is included as
Appendix F. I chose this tool because it is used by the administrators at my school to
observe student engagement when they visit teachers’ classrooms. I video recorded ten
minute sessions during class. Then for every five minute interval I wrote down the total
number of students, the number of students visibly disengaged, and the number of
students distracting others. I also recorded the class activity taking place and how
disruptions were handled by the teacher. I developed my Likert survey by modifying
several questions from the Program in Education, Afterschool and Resiliency (PEAR)
13
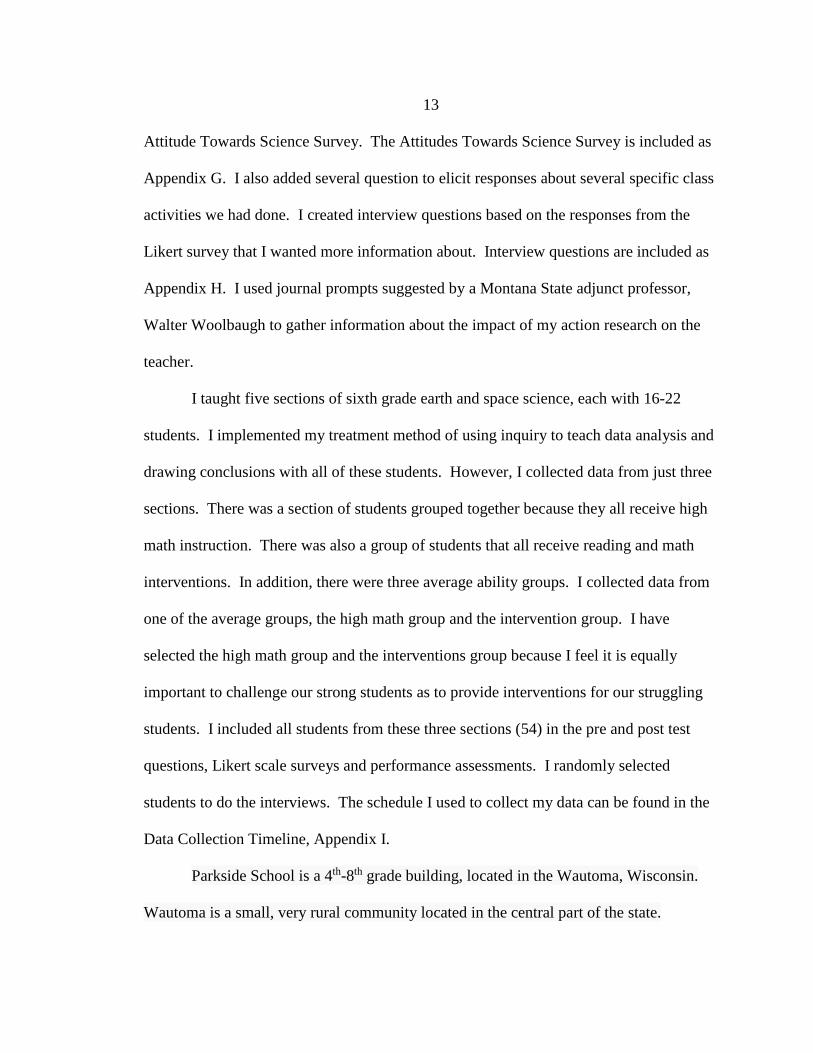
Attitude Towards Science Survey. The Attitudes Towards Science Survey is included as
Appendix G. I also added several question to elicit responses about several specific class
activities we had done. I created interview questions based on the responses from the
Likert survey that I wanted more information about. Interview questions are included as
Appendix H. I used journal prompts suggested by a Montana State adjunct professor,
Walter Woolbaugh to gather information about the impact of my action research on the
teacher.
I taught five sections of sixth grade earth and space science, each with 16-22
students. I implemented my treatment method of using inquiry to teach data analysis and
drawing conclusions with all of these students. However, I collected data from just three
sections. There was a section of students grouped together because they all receive high
math instruction. There was also a group of students that all receive reading and math
interventions. In addition, there were three average ability groups. I collected data from
one of the average groups, the high math group and the intervention group. I have
selected the high math group and the interventions group because I feel it is equally
important to challenge our strong students as to provide interventions for our struggling
students. I included all students from these three sections (54) in the pre and post test
questions, Likert scale surveys and performance assessments. I randomly selected
students to do the interviews. The schedule I used to collect my data can be found in the
Data Collection Timeline, Appendix I.
Parkside School is a 4th-8th grade building, located in the Wautoma, Wisconsin.
Wautoma is a small, very rural community located in the central part of the state.
14
Parkside School is a Title 1 School with a free and reduced lunch student population of
67%. A Title 1 label is a federal government label given to schools who educate higher
numbers of disadvantaged students. Parkside received a Wisconsin School of Promise
Award in 2014, in recognition of performing within the top 25% of higher poverty
schools.
The three sections of students used in my action research all had different
demographics. The higher ability section had eight male and eight female students. This
section contained two Hispanic students both who were English Language Learners
(ELL) and the rest of the students were Caucasian. The average ability section of students
contained 10 males and eight females. This group was comprised of five Hispanic
students three which are labeled as ELL, one African American student and 12 Caucasian
students. The lower ability learner group was made up of nine male students and ten
female students. This section was comprised of eight Hispanic students in which five
were labeled as ELL, two African American students and ten Caucasian students. This
group contains six students who received special education services. All sections of
students have had minimal experience with inquiry learning.
The research methodology for this project received an exemption by Montana
State University's Institutional Review Board and compliance for working with human
subjects was maintained. A copy of the IRB exemption can be found in Appendix J.
DATA AND ANALYSIS
My primary research question sought to find the impact of an inquiry teaching
method on students’ ability to analyze data and draw conclusions. In other words, what
15
would be the results of inquiry teaching on student achievement, motivation, confidence
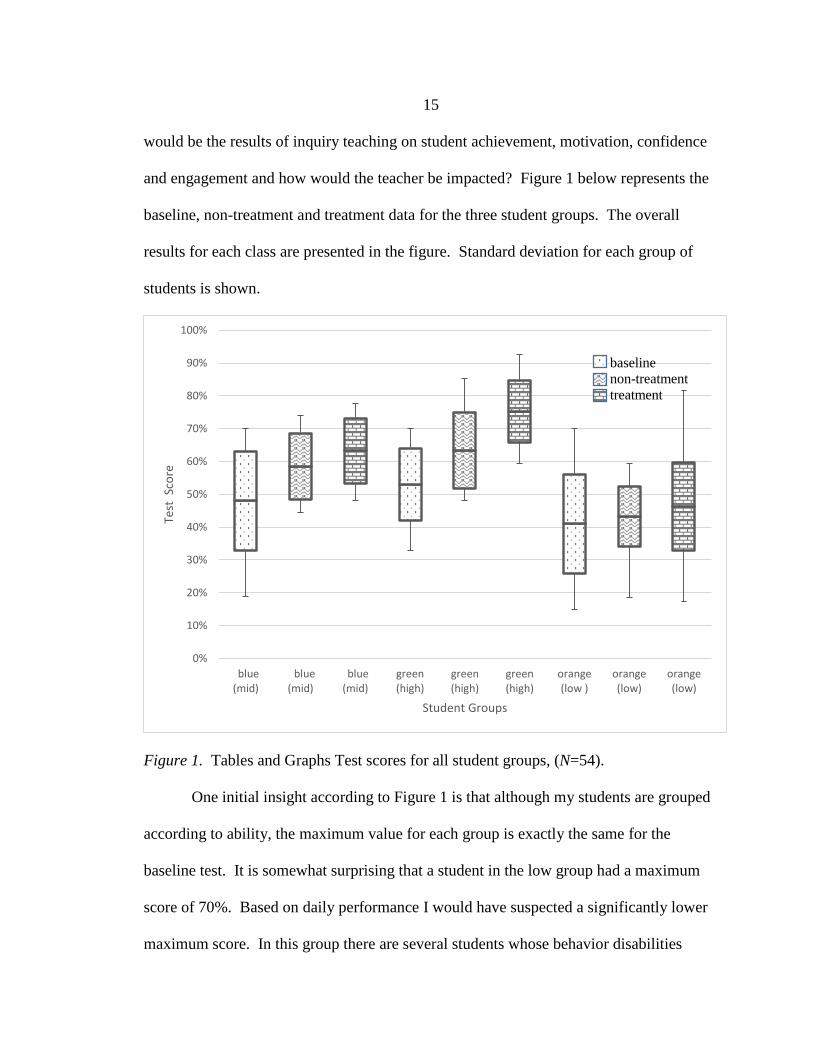
and engagement and how would the teacher be impacted? Figure 1 below represents the
baseline, non-treatment and treatment data for the three student groups. The overall
results for each class are presented in the figure. Standard deviation for each group of
students is shown.
Figure 1. Tables and Graphs Test scores for all student groups, (N=54).
One initial insight according to Figure 1 is that although my students are grouped
according to ability, the maximum value for each group is exactly the same for the
baseline test. It is somewhat surprising that a student in the low group had a maximum
score of 70%. Based on daily performance I would have suspected a significantly lower
maximum score. In this group there are several students whose behavior disabilities
0%
10%
20%
30%
40%
50%
60%
70%
80%
90%
100%
blue(mid)
blue(mid)
blue(mid)
green(high)
green(high)
green(high)
orange(low )
orange(low)
orange(low)
Test
Sco
re
Student Groups
baseline
non-treatment
treatment
16
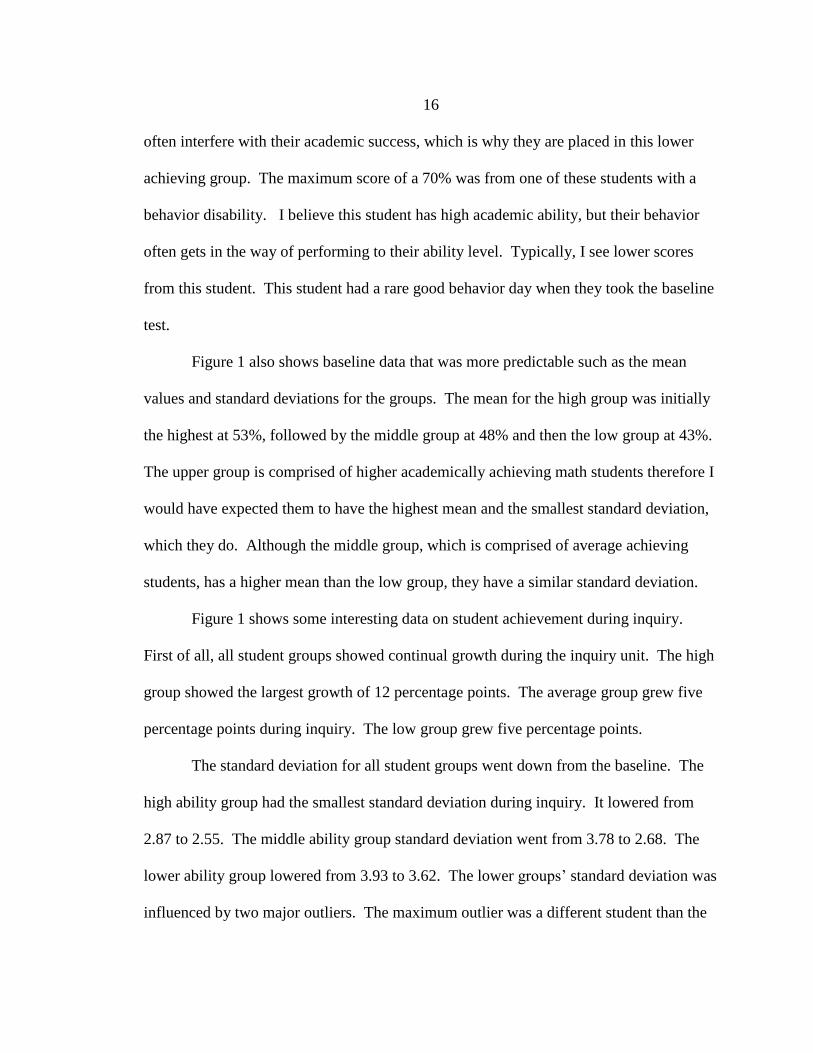
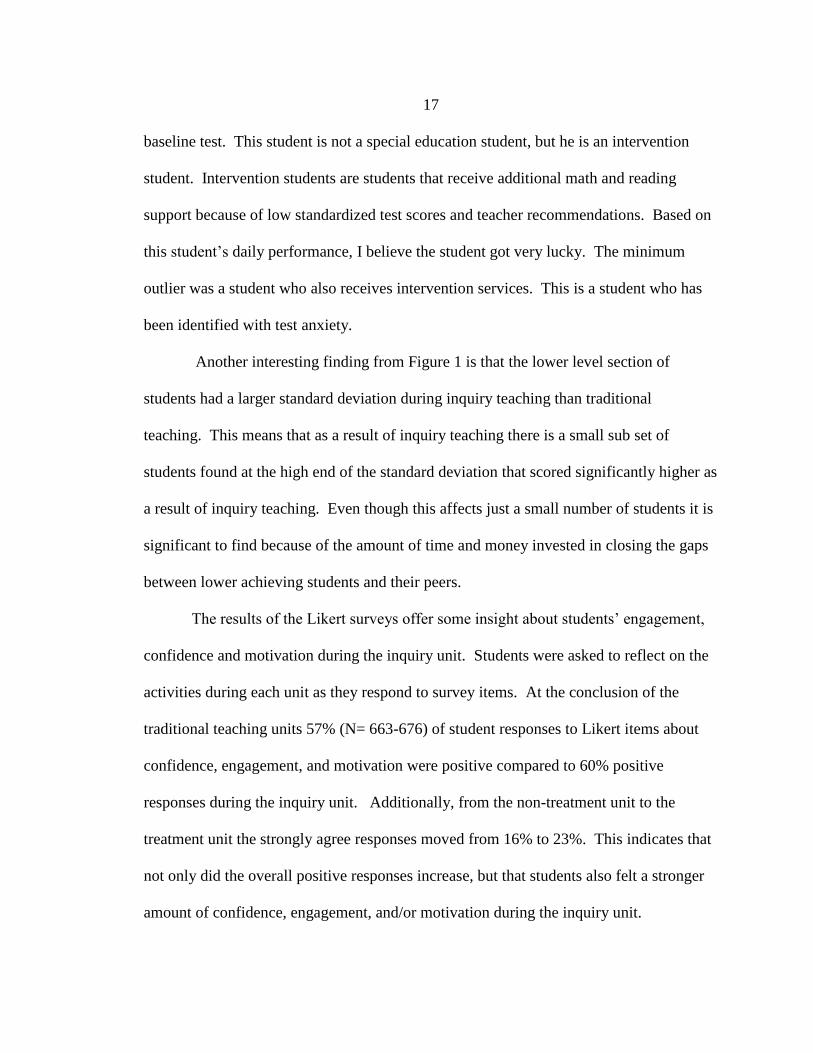
often interfere with their academic success, which is why they are placed in this lower
achieving group. The maximum score of a 70% was from one of these students with a
behavior disability. I believe this student has high academic ability, but their behavior
often gets in the way of performing to their ability level. Typically, I see lower scores
from this student. This student had a rare good behavior day when they took the baseline
test.
Figure 1 also shows baseline data that was more predictable such as the mean
values and standard deviations for the groups. The mean for the high group was initially
the highest at 53%, followed by the middle group at 48% and then the low group at 43%.
The upper group is comprised of higher academically achieving math students therefore I
would have expected them to have the highest mean and the smallest standard deviation,
which they do. Although the middle group, which is comprised of average achieving
students, has a higher mean than the low group, they have a similar standard deviation.
Figure 1 shows some interesting data on student achievement during inquiry.
First of all, all student groups showed continual growth during the inquiry unit. The high
group showed the largest growth of 12 percentage points. The average group grew five
percentage points during inquiry. The low group grew five percentage points.
The standard deviation for all student groups went down from the baseline. The
high ability group had the smallest standard deviation during inquiry. It lowered from
2.87 to 2.55. The middle ability group standard deviation went from 3.78 to 2.68. The
lower ability group lowered from 3.93 to 3.62. The lower groups’ standard deviation was
influenced by two major outliers. The maximum outlier was a different student than the
17
baseline test. This student is not a special education student, but he is an intervention
student. Intervention students are students that receive additional math and reading
support because of low standardized test scores and teacher recommendations. Based on
this student’s daily performance, I believe the student got very lucky. The minimum
outlier was a student who also receives intervention services. This is a student who has
been identified with test anxiety.
Another interesting finding from Figure 1 is that the lower level section of
students had a larger standard deviation during inquiry teaching than traditional
teaching. This means that as a result of inquiry teaching there is a small sub set of
students found at the high end of the standard deviation that scored significantly higher as
a result of inquiry teaching. Even though this affects just a small number of students it is
significant to find because of the amount of time and money invested in closing the gaps
between lower achieving students and their peers.
The results of the Likert surveys offer some insight about students’ engagement,
confidence and motivation during the inquiry unit. Students were asked to reflect on the
activities during each unit as they respond to survey items. At the conclusion of the
traditional teaching units 57% (N= 663-676) of student responses to Likert items about
confidence, engagement, and motivation were positive compared to 60% positive
responses during the inquiry unit. Additionally, from the non-treatment unit to the
treatment unit the strongly agree responses moved from 16% to 23%. This indicates that
not only did the overall positive responses increase, but that students also felt a stronger
amount of confidence, engagement, and/or motivation during the inquiry unit.

18
Categorical survey results for confidence, motivation, and engagement will be discussed
later on.
Table 2
Raw Score Average Growth on Tables and Graphs Test (N=54)
My first sub question compared the results of inquiry to the results of a traditional
or teacher centered science unit. According to Table Two the results from the Tables and
Graphs Test showed that students’ scores increased by 2.09 points during the traditional
teaching unit. During the inquiry unit students’ scores increased by 1.67 points. The data
analysis type of questions showed students grew 1.54 points during the traditional unit
and grew .91 during the inquiry unit. Likewise drawing conclusion type of questions
showed that students grew .83 during the traditional unit and only .57 during the inquiry
unit. Traditional teaching had a larger impact on student achievement than inquiry on
students’ ability to answer traditional data analysis and drawing conclusion test questions.
I think this is because the traditional teaching activities are well structured to prepare
students for traditional multiple choice test questions. The highly structured nature of
traditional teaching matches the highly structured nature of objective test questions.
Total Growth Analyzing Data Drawing Conclusion
Non Treatment 2.09 1.54 0.83
Treatment 1.67 0.91 0.57

19
Figure 2. Performance task average raw scores, (N=54).
Although overall growth on the Tables and Graphs Test does not indicate an
advantage to inquiry teaching a further analysis of sub groupings supports the use of
inquiry with certain groups of students. On the Tables and Graphs Test the higher level
students achieved more growth during the inquiry unit. During inquiry the higher ability
group, with students selected for stronger math skills, grew an average of 3.21 points on
the test compared to only 2.5 during the traditional unit. By contrast, students in the
middle ability group grew 3.28 points during the traditional unit compared to only 1.33
points during the inquiry unit. The lower ability group had virtually the same growth for
both the non-treatment and treatment units at .7 points and .75 points respectively.
20
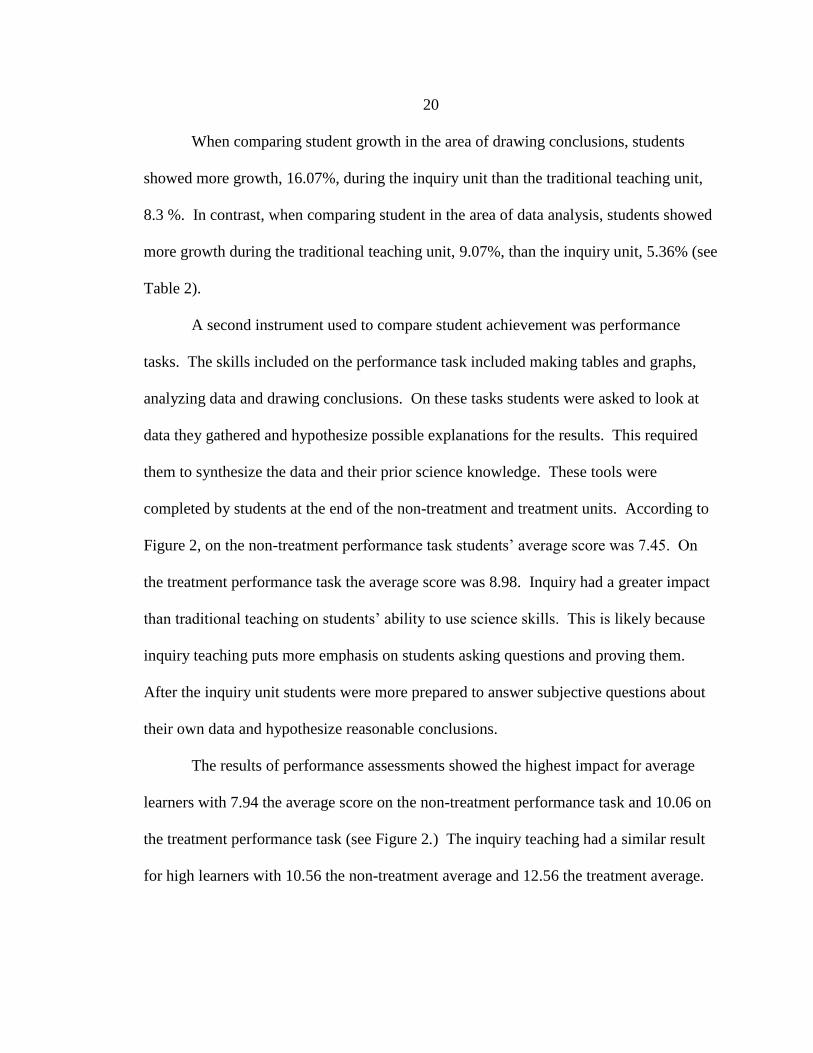
When comparing student growth in the area of drawing conclusions, students
showed more growth, 16.07%, during the inquiry unit than the traditional teaching unit,
8.3 %. In contrast, when comparing student in the area of data analysis, students showed
more growth during the traditional teaching unit, 9.07%, than the inquiry unit, 5.36% (see
Table 2).
A second instrument used to compare student achievement was performance
tasks. The skills included on the performance task included making tables and graphs,
analyzing data and drawing conclusions. On these tasks students were asked to look at
data they gathered and hypothesize possible explanations for the results. This required
them to synthesize the data and their prior science knowledge. These tools were
completed by students at the end of the non-treatment and treatment units. According to
Figure 2, on the non-treatment performance task students’ average score was 7.45. On
the treatment performance task the average score was 8.98. Inquiry had a greater impact
than traditional teaching on students’ ability to use science skills. This is likely because
inquiry teaching puts more emphasis on students asking questions and proving them.
After the inquiry unit students were more prepared to answer subjective questions about
their own data and hypothesize reasonable conclusions.
The results of performance assessments showed the highest impact for average
learners with 7.94 the average score on the non-treatment performance task and 10.06 on
the treatment performance task (see Figure 2.) The inquiry teaching had a similar result
for high learners with 10.56 the non-treatment average and 12.56 the treatment average.

21
The inquiry unit showed the lowest impact on the below average learners with scores of
4.37 and 4.95 on the traditional and inquiry units respectively.
Additionally, inquiry teaching had a larger impact on males than females. This
was evident in both the Tables and Graphs Test and performance tasks. During the
inquiry unit males grew 2.70 points versus 1.52 points on the Tables and Graphs Test and
performed 2.27 points higher on the inquiry performance task. On the other hand, female
students grew only .67 points during inquiry versus 2.67 points during traditional
teaching on the Tables and Graphs Test. Female students did perform better on the
inquiry performance task, but their score was only .82 points higher than the traditional
teaching method performance task score. They were also 1.45 points behind the male
average score for the inquiry performance task. Interestingly, female students averaged
7.44 points on the traditional teaching performance task, which was nearly identical to
the male score for the same task of 7.46 points. I think the reason for the discrepancy in
scores is that boys and girls do not learn in the same way because of their different
strengths and weaknesses.
Table 3
Results of Time on Task Observations (N=51-54)
Student Negative Behaviors Non-Treatment Total Treatment Total
Blue (mid) Disrupting Others 3 2
Green (high) Disrupting Others 1 0
Orange (low) Disrutpting Others 7 6
Total Occurences of Disruption 11 8
Blue (mid) Visibly Disengaged 10 5
Green (high) Visibly Disengaged 6 4
Orange (low) Visibly Disengaged 18 21
Total Occurences of Disengagement 34 30
22
The second sub question I investigated focused on the impact of inquiry teaching
on students’ engagement, motivation and confidence in my classroom. The first
instrument used to measure the impact of inquiry was time on task observations. The
results of the observations showed that overall disruptions were more frequent during the
non-treatment unit versus the treatment unit by a total of three disruptions, as shown by
Table 3. The total number of overall occurrence of students being disengaged was also
more frequent during the non-treatment unit compared to the treatment unit by a total of
four occurrences.
A closer look at time on task data revealed that the different student groups were
impacted differently in the area of class engagement. The average ability group had a
drop in disengaged occurrences. They went from ten during the non-treatment to five
during the treatment unit. The upper group saw a small drop in disengagement from six
occurrences during the non-treatment to only four during the treatment. The lower ability
group had much higher levels of disengagement occurrences than the other two groups.
They also differed than the other groups because they had an increase in disengagement
occurrences from non-treatment to treatment unit. During the non-treatment unit there
were 18 occurrences of disengagement and it increased to 21 during the treatment unit. I
would attribute this increase during the inquiry unit to students not possessing the needed
skills to complete these less structured activities without major guidance from the
teacher. The skills and confidence of the low group may limit their ability to be self-
guided and self-motivated. Therefore when they believe a problem is beyond their
23
abilities, they often exhibit disruptive behaviors or become disinterested in what they are
supposed to be accomplishing.
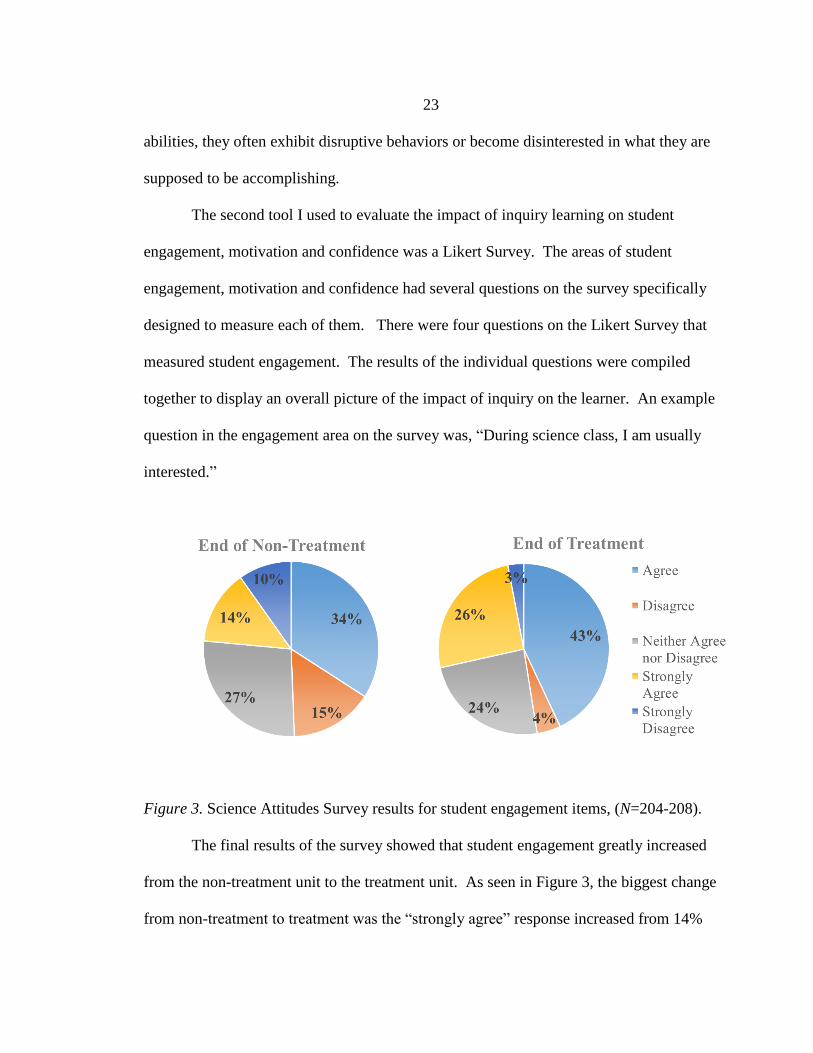
The second tool I used to evaluate the impact of inquiry learning on student
engagement, motivation and confidence was a Likert Survey. The areas of student
engagement, motivation and confidence had several questions on the survey specifically
designed to measure each of them. There were four questions on the Likert Survey that
measured student engagement. The results of the individual questions were compiled
together to display an overall picture of the impact of inquiry on the learner. An example
question in the engagement area on the survey was, “During science class, I am usually
interested.”
Figure 3. Science Attitudes Survey results for student engagement items, (N=204-208).
The final results of the survey showed that student engagement greatly increased
from the non-treatment unit to the treatment unit. As seen in Figure 3, the biggest change
from non-treatment to treatment was the “strongly agree” response increased from 14%
24
to 26%. The next biggest increase from non-treatment to treatment in terms of student
engagement was the “agree” response went from 34% to 43%. At the end of the inquiry
unit 69% of student responses about engagement in science class were positive,
compared to 48% at the end of the traditional unit. There was a large decrease in the
number of student responses that showed negative feelings about being engaged in
science at the end of the inquiry unit. At the end of the inquiry unit only 7% of student
responses showed negative feelings towards being engaged in the science classroom. I
believe when students are given choices and freedom during classroom activities they
feel more engaged in the learning process.
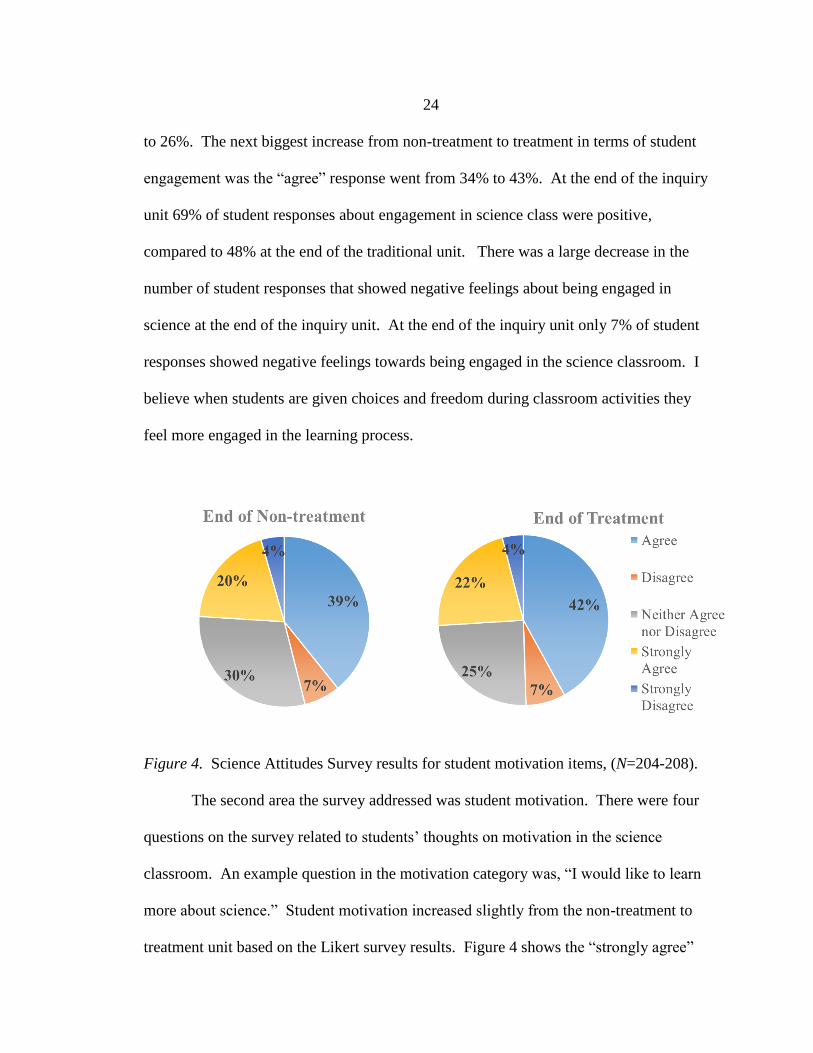
Figure 4. Science Attitudes Survey results for student motivation items, (N=204-208).
The second area the survey addressed was student motivation. There were four
questions on the survey related to students’ thoughts on motivation in the science
classroom. An example question in the motivation category was, “I would like to learn
more about science.” Student motivation increased slightly from the non-treatment to
treatment unit based on the Likert survey results. Figure 4 shows the “strongly agree”

25
responses increased from 20% to 22% the “agree” responses increased from 39% to 42%.
Overall positive responses increased from 59% to 64%. Negative responses pertaining to
motivation were exactly the same in the non-treatment and treatment units. The percent
of neutral responses went down from 30% to 25%. I feel when students are authentically
engaged in an activity they are motivated to work hard in order to analyze the results and
reach conclusions.
Figure 5. Science Attitudes Survey results for student confidence items, (N=255-260).
A third area the Science Attitude Survey addressed was student confidence in the
science classroom. There were five questions on the survey that were related to
confidence. Examples of these types of items were, “Science is challenging for me” and
“Graphs are difficult for me to understand.” According to Figure 5 the largest change
from non-treatment to treatment was in the “strongly agree” response, which increased
from 14% to 22% (N=50-54). The number of responses that showed positive feelings
about confidence in science was virtually unchanged from non-treatment to treatment
unit. Likewise the number of responses that showed negative feelings about confidence

26
in science was virtually unchanged from non-treatment to treatment. The results
demonstrate that learning through inquiry produces questioning. The inherent unknowns
of an inquiry activity did not increase confidence in students’ science ability. Likewise, it
did not lower students’ confidence.
Another tool used to assess student’s confidence, motivation, and engagement
was student interviews. The interviews were conducted with three students from each
class at the end of the non-treatment and treatment units. I chose students at random,
however, I made sure I had at least one female and male student in each interview group.
During each interview students were asked to reflect on the specific activities involved in
each unit.
The first theme I found when analyzing the data in regards to student engagement
was in response to the question, “In the past five weeks, what was the most exciting thing
we did in science class?” During the non-treatment unit students were split in their
responses, with four students choosing the CSI activity, followed by two choosing ocean
floor mapping, two choosing sinking mountains, and one choosing an iPad mapping
activity. By contrast, at the end of the treatment unit eight students picked the impact
cratering with only one student choosing the planet activity. This is significant because
the impact cratering activity was both the most open ended of the inquiry activities and
the most student directed.
Additionally, in response to the follow up to this question, “What did you like
about this activity?” students were readily able to list several items they liked after the
inquiry unit. Responses included “You got to do it by yourself,” “You got to do
27
whatever you wanted,” “I liked to figure out what went wrong and how to fix it,” “It was
fun,” “I liked testing the materials before designing the experiment,” and “It made a huge
mess.” After the non-inquiry unit I had to do a lot of probing and still students weren’t
able to come up with very many things they liked about the activities. Responses
included, “computing the composition,” “manipulating,” “matching the sample
numbers,” and “the video about the museum.” The inquiry activities were more
memorable to students and left a lasting positive impression.
Additional analysis of the interviews revealed another theme, this time in regards
to student confidence. Students were asked to rate their confidence at making, reading
and drawing conclusions from science graphs. During the non-treatment unit students
rated themselves at an average of 6.33 for making graphs. They rated themselves at an
average of 7.33 during the treatment unit. Their confidence in drawing conclusion also
increased as a result of the inquiry unit. They rated themselves at an average of 5.28 at
the conclusion of the traditional unit compared to 7.44 at the conclusion of the inquiry
unit. Students’ confidence in reading graphs declined. During the non-treatment unit
students rated themselves at an average of 7.41 compared to 6.61 during the treatment
unit. Students’ confidence in reading graphs may have gone down due to the fact that
there was less direct instruction in reading graphs during inquiry. During the traditional
unit activities, students collected the same data and experienced similar results, which led
to entire class instruction of reading graphs. The freedom offered during the inquiry
learning led to less of these whole class discussions.
28
Student motivation was a third area where a theme became obvious from the
interviews. The question students responded to was, “What activities made you curious
or want to know more in the last 5 weeks?” In student responses during the non-
treatment unit, students stated an activity but even with further probing were not able to
articulate something they wanted to learn more about. During the inquiry unit students
showed genuine motivation by stating a clear idea that they wanted to learn more about.
Examples of student responses were, “I want to learn what other planets exist,” “I want to
know more about objects further out in space,” and “I want to try to run someone else’s
experiment.”
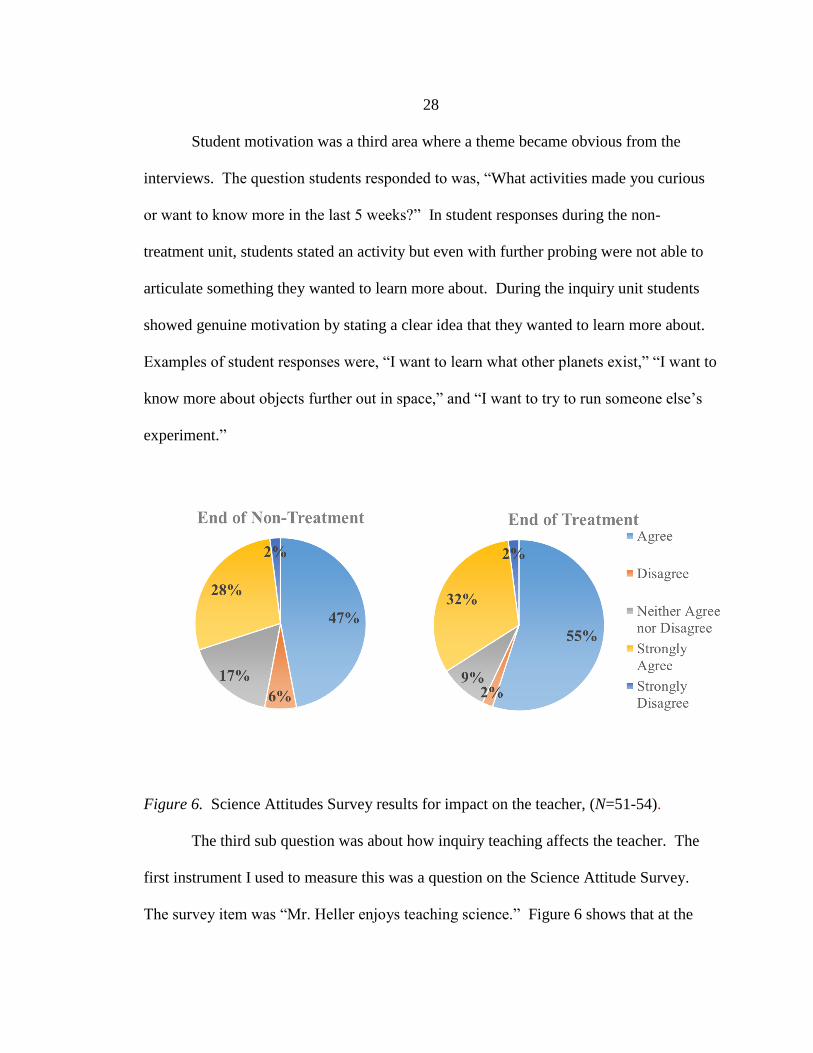
Figure 6. Science Attitudes Survey results for impact on the teacher, (N=51-54).
The third sub question was about how inquiry teaching affects the teacher. The
first instrument I used to measure this was a question on the Science Attitude Survey.
The survey item was “Mr. Heller enjoys teaching science.” Figure 6 shows that at the
29
end of the traditional unit 47% of students agreed and 28% strongly agreed. By the end
of the inquiry unit 55% of students agreed and 32% of students strongly agreed.
The interview results also backed this up. At the conclusion of the traditional unit eight
students said that Mr. Heller enjoys teaching science and 1 student said he kind of does.
The reasons they gave included, “He laughs,” “He tries to make it fun,” and “It seems
like he enjoys helping kids.” Although these were good reasons, students were much
more convincing with their reasons after the inquiry unit. All students said that Mr.
Heller enjoys teaching science and some of their reasons included, “Oh my gosh, he loves
teaching science,” “He likes watching us doing the science on our own and making our
own improvements,” and “It was like he was watching his kids walk for the first time.”
Inquiry activities provided students with opportunities to experience “ah ha” moments
when their research or experiments led to new learning. Some of the new learning was
surprising for me and led to several “ah ha” moments for myself.
One theme I found is that I had fewer entries during the inquiry unit than the
traditional teaching unit. A possible explanation for this is that the inquiry activities took
longer to set up and prepare for than the activities during the traditional unit. This left me
less time for completing journal entries. Perhaps once these inquiry activities become
routine parts of my classroom they will not require as much prep time, but right now they
are still a bit new to me. So I am still really creating the activities.
A second theme I found from my journaling was that during the inquiry unit I
more regularly checked in with small groups or individual students. This was evident
through journal quotes like, “I really enjoyed traveling between groups today.” By
30
checking with students more regularly I felt I had a better pulse on my students learning.
Because the students were self-directed I checked in with each group approximately three
times during a class period.
A third theme I noticed in my journaling was frustration at the inability of the
lower ability group to direct their own learning. This can be evidenced by journal quotes
such as, “Behavior got in the way a couple times. Groups with students labeled with
Emotional Behavioral Disorders (EBD) struggle when there is a disagreement. The
group then doesn’t function well until Mr. Heller solves the problem.” Even with myself
and a special education teacher in the classroom, we were not able to keep all groups
moving forward with their learning. This leads me to believe that the lower level
students may see more benefit from inquiry if they were not all placed in the same class.
If these students were paired with stronger ability students, the groups may socially
function more efficiently, allowing a higher degree of learning to take place.
Overall, students showed more growth on traditional multiple choice questions
during the traditional teaching unit. However, on a performance task assessment students
performed higher after the inquiry instruction. Student engagement and motivation
increased during inquiry teaching, but confidence stayed relatively the same. The overall
impact on the teacher was that my engagement and enthusiasm was increased.
INTERPRETATIONS AND CONCLUSIONS
The overall research question asked how inquiry impacted student’s ability to
analyze data and draw conclusions. As measured by both the Tables and Graphs Test and
the Performance Tasks, inquiry learning improved students’ ability to analyze data and

31
draw conclusions. Inquiry teaching had the largest impact on higher achieving learners’
and males’ ability to analyze data and draw conclusions. It had a smaller impact on
average, lower level and female learners.
Although students showed growth during both the traditional teaching unit and
inquiry teaching unit, on the Tables and Graphs Test students improved more during the
traditional teaching unit than during the inquiry unit. The Tables and Graphs Test was a
very traditional multiple choice assessment. Traditional instruction had a higher impact
than inquiry instruction on students’ ability to analyze data and draw conclusions on
traditional multiple choice test questions.
In contrast, on the performance assessment tasks students showed a greater ability
to draw conclusions and analyze data at the end of the inquiry unit than after the
traditional unit. The performance assessment tasks required students to use science skills
to synthesize prior knowledge and data from the current task. Inquiry instruction had a
higher impact than traditional instruction on students’ ability to analyze data and draw
conclusions on these skills and reasoning based assessments.
Inquiry teaching had a larger impact on boys than girls. While both boys and girls
improved as a result of the inquiry unit boy’s scores went up significantly more during
inquiry. Girls’ scores went up significantly more during the traditional teaching unit.
These achievement differences can likely be attributed to the fact that boys and girls learn
differently. According to Gurian and Stevens (2004) while girls thrive with language
tasks, boys prefer mechanical activities. Traditional teaching has a larger focus on
reading and writing and inquiry teaching centers around manipulating and doing.

32
In regard to student ability, inquiry instruction had the largest impact on the high
level students. These students performed better on both the Tables and Graphs Test and
the performance assessment during the inquiry unit. Middle level learners did better on
the performance assessment during the inquiry unit, but showed more growth on the
Tables and Graphs Test during the traditional teaching unit. The struggling learners
performed almost the same on both assessments during both teaching units. The lower
level students had a higher level of off task behavior during the inquiry unit. I feel this
may have contributed to the small growth during the inquiry unit. Grouping these
students with high and mid-level learners may decrease the off task behavior and allow
for more growth to take place.
Student engagement increased during the inquiry unit. When students were given
choices about what to study and how to design an experiment that would prove or
disprove their questions they showed a high level of commitment to reaching an answer.
As engagement increased so did student motivation. When students were working on
self-selected topics they were very motivated to work hard to get their questions
answered. Student confidence remained about even during both units. I feel this is
because while students were posing questions and designing ways to answer these
questions it is hard to feel completely confident in yourself. Inquiry naturally lends itself
to questioning. Student confidence may increase as they get use to this learning through
questioning approach.
Inquiry learning had a greater positive impact on the teacher than traditional
teaching. Although traditional teaching allowed for quicker set up of lessons and

33
materials, the positive impact of inquiry teaching outweighed this savings in time. The
students saw the teacher enjoying science more during the inquiry unit. This increased
excitement by the teacher can be then passed on to the learners. Another positive that
was shown during the inquiry unit was the teacher’s ability to check-in and conference
with students as an ongoing means of formative assessment. These check-ins allowed me
to immediately differentiate for high and low level learners. I could quickly get a
struggling group back on track or challenge a high group to investigate further.
VALUE
This action research project has helped me learn many valuable lessons as I
continue my teaching. I learned that it will be important to develop my repertoire of
inquiry activities and the easiest way to do this will be to modify many of existing
activities. I also learned that I will need to plan for my learning space and materials.
Additionally, students are eager to share the results of their inquiry projects. Finally,
when using inquiry it will be important to consider how students are grouped.
As a result of this action research I have realized that both traditional and inquiry
teaching are important to develop well-rounded science students. Inquiry teaching
improves students’ ability to apply science skills to data and analysis and drawing
conclusions tasks. This produces strong science thinkers. Traditional teaching improves
students’ ability to demonstrate data analysis and drawing conclusions skills on
traditional tests. Because students need all of these skills, both teaching methods should
continue to be an integral part of my teaching. Students will continue to need solid test
taking skills to continue their science education at both the high school and post-
34
secondary levels. Students also need these skills to perform on the increasing number of
standardized tests required in their schooling. The ability to draw valid conclusions will
be necessary for many students with a desire to continue into science and many other
fields for their career. Drawing conclusions is also a skill that all students will need in
order to interpret information from a variety of sources that they may encounter in their
daily lives i.e. advertisements, newspapers, internet, books, etc.
My past instruction has focused more on traditional teaching so for me this means
I will need to continue to improve my inquiry instruction. My curriculum currently
entails a lot of hands on instruction that is teacher directed. I will work to modify these
activities to allow students to explore their own questions. As a result of this study I have
found that many of the activities I currently do can easily be made into inquiry based
activities. I need to modify my planning by spending some time before the activity
thinking about what different questions students could ask and what materials they may
need to investigate these questions.
It is important to have adequate classroom space available for effective inquiry
learning. My classroom is smaller than the other 7th and 8th grade science classrooms in
my building. It does not have lab tables or counter space for lab work to take place on.
During the inquiry unit students needed space to explore materials and run experiments.
This is especially true because students are not all going to explore questions in the same
manner or with the same materials. My classroom didn’t always have the adequate space
to do this. This made it more difficult for students and myself to pursue answers to
multiple questions at the same time. In order overcome the lack of space students were

35
able to configure our tables in any manner to provide the space they required. I also had
many students use the hallway as their learning space.
During inquiry it is crucial that as students generate questions for investigation the
teacher has sufficient materials for them to use. The last activity of my inquiry unit was
very much open inquiry and student directed. In order to do inquiry activities like this I
need to be able to utilize my budget effectively so that I have adequate materials
available for students to explore for multiple inquiry units. In addition, I needed to be
creative in finding places to store the many new materials used in my units. I borrowed
space in elementary storage rooms, along with space in our guidance teacher’s storage
closest and storage in our old home economics room. To help with materials I also
encouraged students to bring in their own to enhance their investigations.
Students were eager to communicate their results with others during the various
inquiry activities. Since students were not all investigating the same questions, they were
more eager to complete a lab write up in order to share results with me and their peers. I
could tell they were eager because I had many students ask to use electronic devices to
record videos and pictures during the data collection process. They used these pictures
and videos in their write up to make their arguments stronger.
My results were shared directly with my sixth grade teacher colleagues and
building administrators during our weekly team meeting. This was a great chance for me
discuss with my coworkers how students are grouped. During the inquiry unit the lower
level group of students had more off task behaviors than they did during the traditional
unit. During the traditional unit students were teacher guided enough that they were able

36
to stay on task and complete the activities. During the inquiry unit, when they were
required to use more high level thinking skills, their off task behaviors increased. They
were not self-directed enough to complete the activities without major teacher guidance.
This did not allow them to get as much out of the activities as they could have. As a
result of our discussions, we are mixing these lower levels students with the higher and
middle level students in the next year. If the students who struggle with behavior were in
an inquiry group with students off mixed abilities, their behaviors may not surface as
frequently because other students would be modeling more focused thinking. Then their
behaviors may not be as large of an influence on their achievement. Over time, if only
grouped with low level learners or students with behavioral issues these students may
lose many opportunities to develop skills that students in mixed groups will more
frequently being working on.
Inquiry learning has proven to be a valuable way for students to learn in the
science classroom. In my science classroom inquiry improved students’ scores,
engagement and motivation. Inquiry learning produces students who are able to do more
than just take tests. They can authentically use science skills to solve problems.
Inquiry learning will increasingly play an important role in my science classroom.

37
REFERENCES CITED

38
Abd-El-Khalick, F., BouJaoude, S., Duschl, R., Lederman, N. G., Mamlok-Naaman, R.,
Hofstein, A., . . . Tuan, H. (2004). Inquiry In Science Education: International
Perspectives. Science Education, 88(3), 397-419.
Anderson, R. D. (2002). Reforming science teaching: what research says about inquiry.
Journal of Science Teacher Education, 13(1), 1-12.
Benson, C.L. Jr. (2013). The iPad: novelty or breakthrough for science and education.
Unpublished research paper, Montana State University-Bozeman.
Brunsell, E., Kneser, D., Niemi, K. (2014). Introducing teachers + administrators to the
NGSS: A professional development facilitator guide. Arlington, VA: NSTA Press.
Gurian, M., Stevens, K. (2004) With Boys and Girls in Mind. Educational Leadership,
62(3), 21-26.
Lee, H., & Butler, N. (2003). Making authentic science accessible to students. International
Journal of Science Education, 25(8), 923-948.
Moyer, K. (2011). The impact on student achievement within small groups based on
learning styles, interest, and student readiness. Unpublished research paper,
Margygrove College.
Science, M. (2000). Inquiry and the National Science Education Standards: a guide for
teaching and learning. Washington, D.C.: National Academy Press.
Tairab, H and Kalaf Al-Naqbi, A. (2004). How do secondary science students interpret and
construct scientific graphs? Journal of Biological Education, 38 (3), 127-132.
Taylor, J., & Bilbrey, J. (2012). Effectiveness of inquiry based and teacher directed
instruction on an Alabama elementary school. Journal of Instructional Pedagogies,
8, 1-16.

39
APPENDICES

40
APPENDIX A
IMPACT CRATERING

41
Investigating Impact Cratering
Have you ever wondered why the moon has so many more visible impact craters
than the Earth? Do they form differently than craters on Earth? This activity will allow
you to investigate many questions you might have about impact craters and how they
shape objects in our solar system. It will be your task, as a group, to brainstorm questions
for investigation, design an experiment, run your experiment, collect data and
communicate your results through a lab report.
Exploration of Materials and Question Brainstorming: Experiment with the materials
around the room to help you generate questions about impact cratering. Record them
below.
Background Information: As a group decide what parts of the website each member is
to read. Record several important pieces of information you learned below. You will
share this information with your group. It may be used to help write your background
information section of the lab report.
http://www.lpi.usra.edu/education/explore/shaping_the_planets/impact_cratering.shtml
42
Question for Investigation: As a group decide on a question you wish to test related to
impact craters. Record it below.
Data Collection: What type of information are you going to be recording/collecting?
This section may be easier to complete once you have finish the experimental design.
How are you going to record it? How are you going to display it (table, graph, chart,
etc..)?
Materials: What materials will you need to run your experiment? List them below.
Experiment Design and Procedure: Explain exactly how you will conduct your
experiment. List steps an include drawings.

43
Experiment Design and Procedure continued…
Once you have completed this sheet and had it approved by the teacher then you are
able actually run your experiment! Once you have collected all your data, put your
materials away and begin the lab.

44
APPENDIX B
TABLES AND GRAPHS TEST

45

46

47

48

49

50
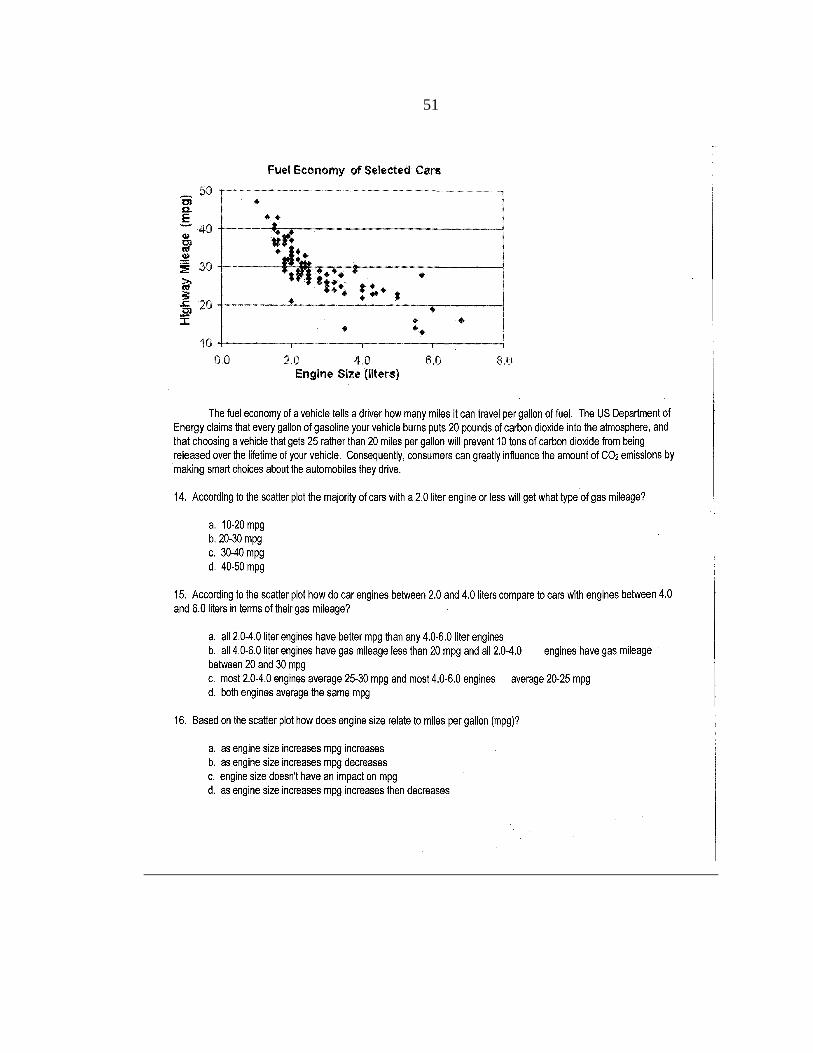
51

52
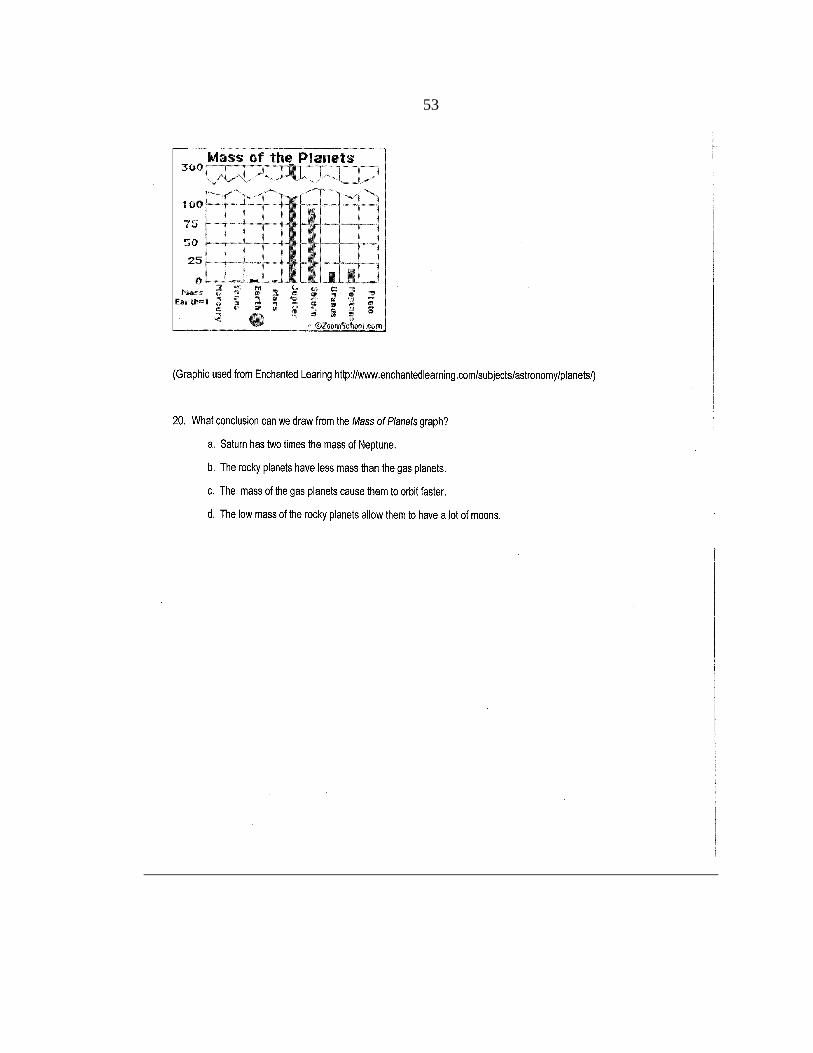
53

54

55
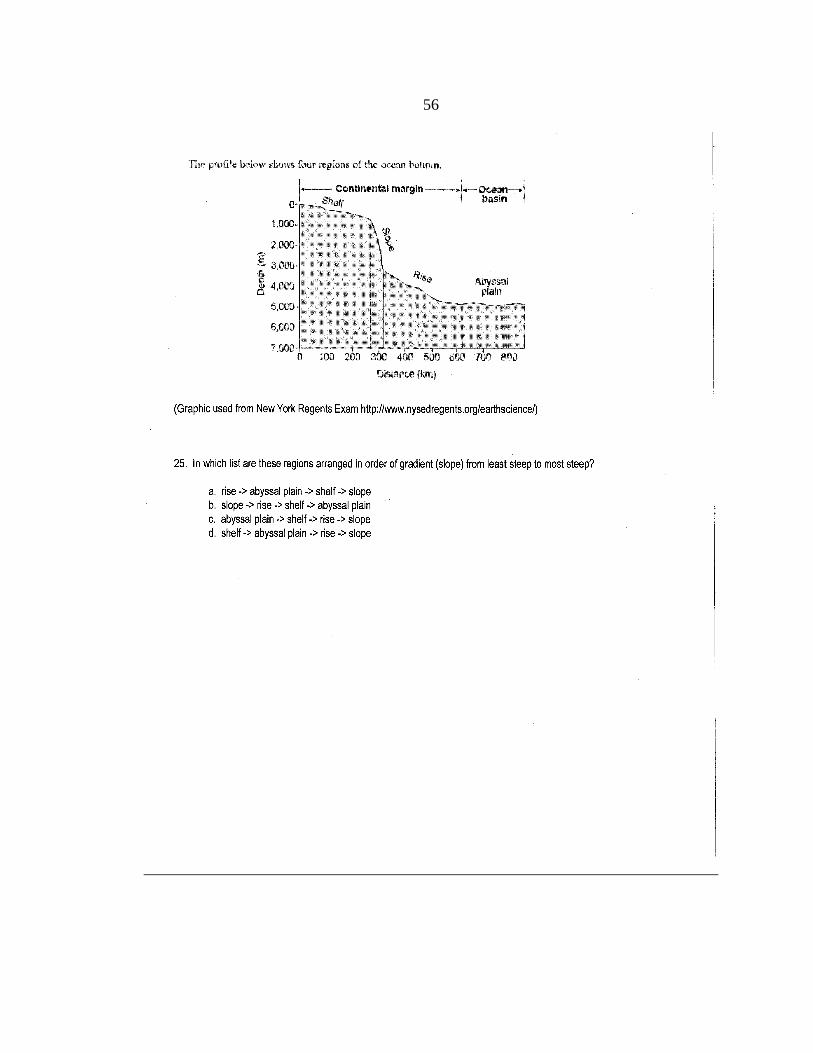
56
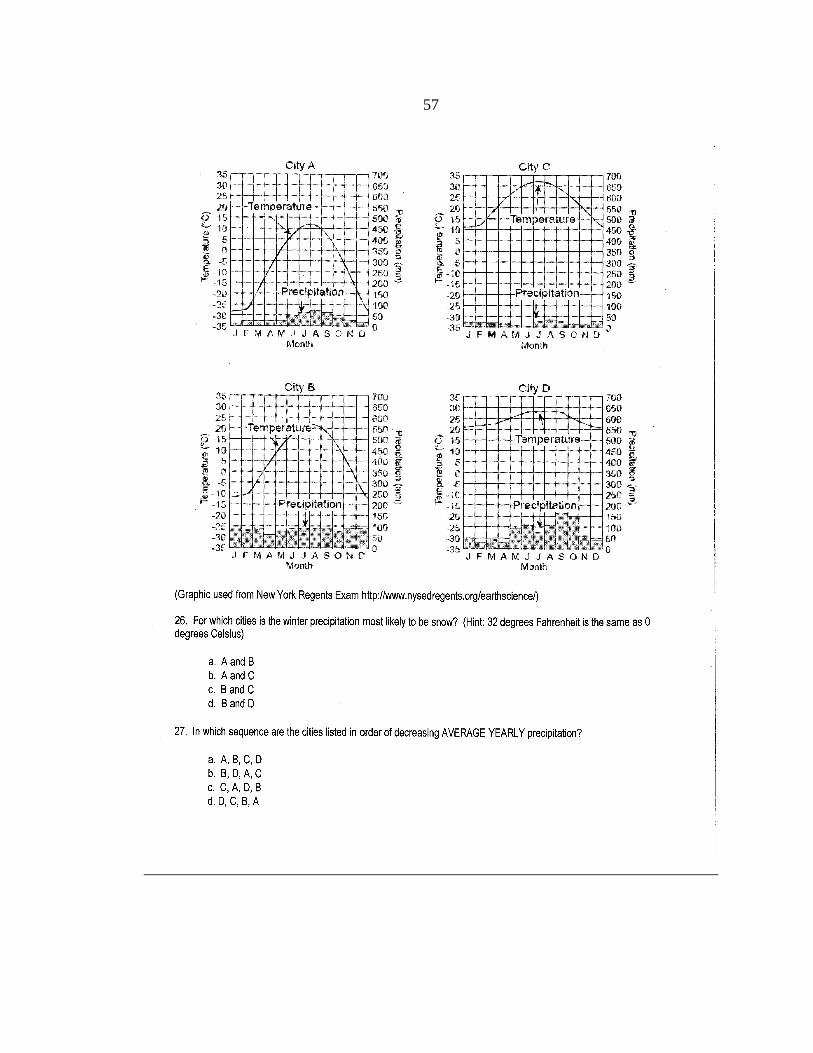
57

58
APPENDIX C
PERFORMANCE ASSESSMENT RUBRIC
59
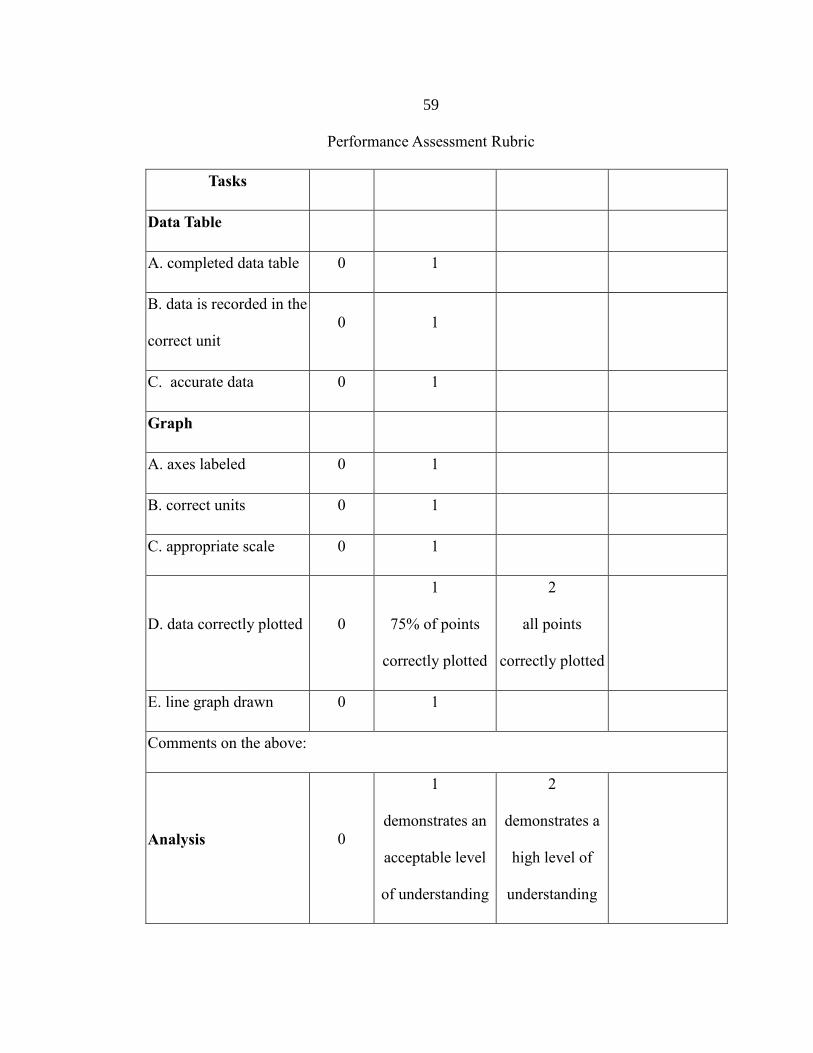
Performance Assessment Rubric
Tasks
Data Table
A. completed data table 0 1
B. data is recorded in the
correct unit
0 1
C. accurate data 0 1
Graph
A. axes labeled 0 1
B. correct units 0 1
C. appropriate scale 0 1
D. data correctly plotted 0
1
75% of points
correctly plotted
2
all points
correctly plotted
E. line graph drawn 0 1
Comments on the above:
Analysis 0
1
demonstrates an
acceptable level
of understanding
2
demonstrates a
high level of
understanding
60
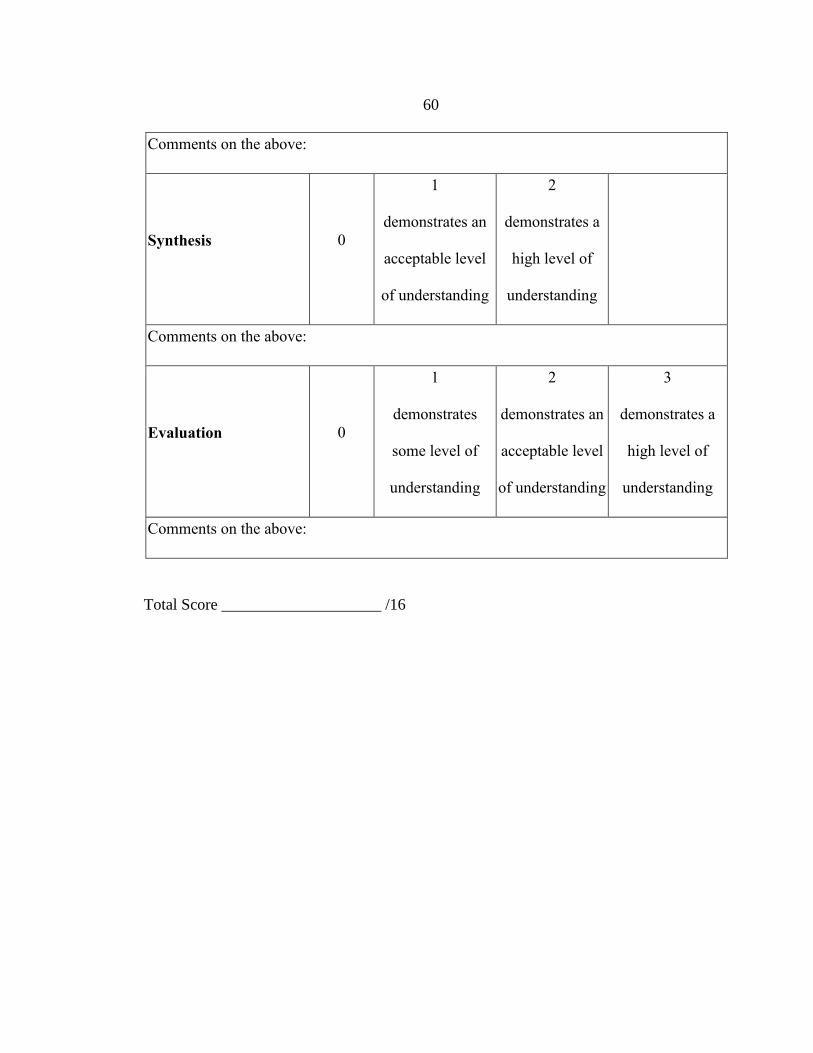
Comments on the above:
Synthesis 0
1
demonstrates an
acceptable level
of understanding
2
demonstrates a
high level of
understanding
Comments on the above:
Evaluation 0
1
demonstrates
some level of
understanding
2
demonstrates an
acceptable level
of understanding
3
demonstrates a
high level of
understanding
Comments on the above:
Total Score ____________________ /16

61
APPENDIX D
CRUSTAL SINKING PERFORMANCE ASSESSMENT
62
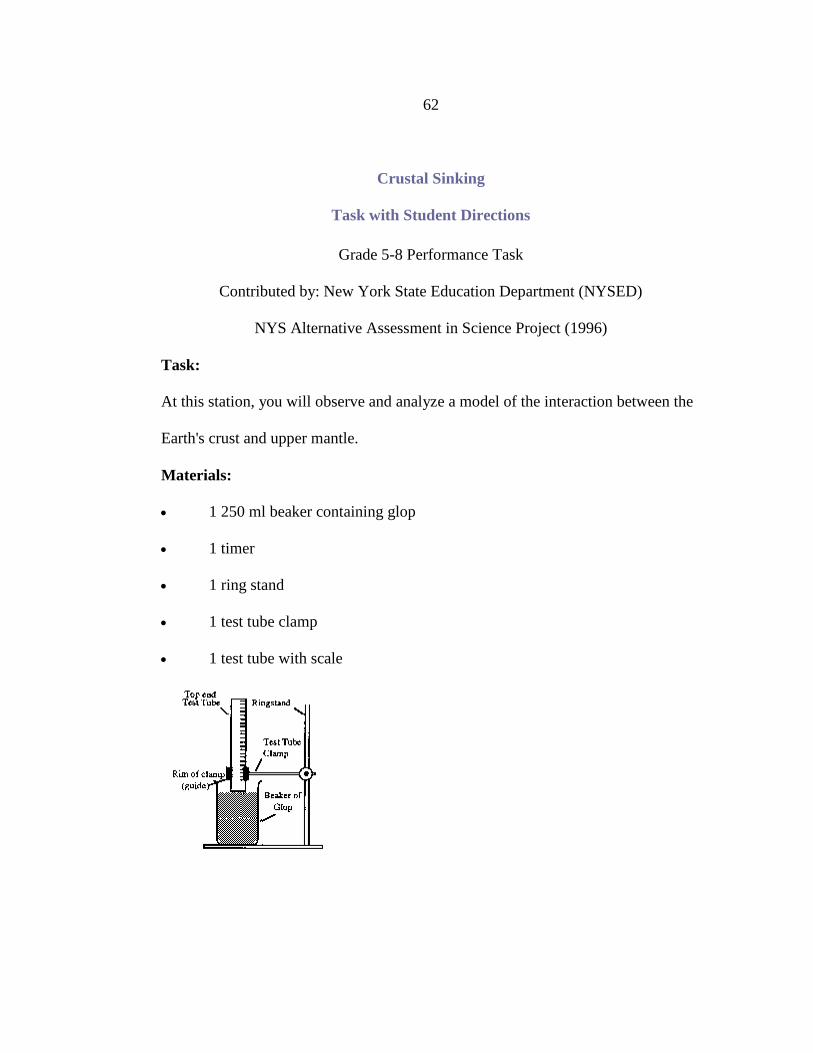
Crustal Sinking
Task with Student Directions
Grade 5-8 Performance Task
Contributed by: New York State Education Department (NYSED)
NYS Alternative Assessment in Science Project (1996)
Task:
At this station, you will observe and analyze a model of the interaction between the
Earth's crust and upper mantle.
Materials:
1 250 ml beaker containing glop
1 timer
1 ring stand
1 test tube clamp
1 test tube with scale
63
Background:
Some geologists believe the theory that there is a semi-fluid layer 100 to 300
kilometers below the Earth's surface. Due to high temperature and pressure, the rock
in this region behaves both like a solid and a liquid. Slow movements in this region
are thought to be related to changes in the upper crust and to fractures in the Earth's
surface. The model in this activity may demonstrate how these changes can occur.
Directions:
1. Set up the equipment exactly as it appears in the diagram above.
2. Before installing the test tube clamp on the ring stand, adjust the opening of
the clamp so that the test tube will slide easily through it. **The clamp will not be
used to hold the test tube, but rather to guide its movement.**
3. Place the test tube within the clamp and directly over the glop in the beaker.
Hold the test tube above the glop, but do not allow it to rest on the glop yet.
4. Turn the test tube so that the lines and numbers can be read easily.
5. Carefully hold the test tube so that it just touches the surface of the glop.
Using the bottom rim of the clamp as your guide, make sure that the scale on the
test tube reads zero.
6. Release the test tube and start the timer.
7. Read the level of the test tube to the nearest tenth of a centimeter every half
minute. For each reading, record the level using the rim of the clamp as your guide
(refer to above diagram). Take readings for a maximum of 5 minutes.

64
8. Record your observations regarding the level of the graduated test tube in
the table below. Make a line graph of your data using time and change in level as
your variables. Label both axes. Include proper units.
9. Assume that your data is an accurate model for the behavior of a mountain
range such as the Himalayas or the Adirondacks. How would the rate of sinking of
the mountains early in their formation compare with the rate late in their
development? Answer in complete sentences.
65
10. Based on your observations of this model, explain one possibility why the
crust is usually pushed deeper into the earth below old mountains than under newly
formed mountains. Answer in complete sentences.
11. List at least three factors in the natural world that have not been accounted
for in this model.

66
APPENDIX E
SCALE MODEL OF THE SOLAR SYSTEM PERFORMANCE ASSESSMENT

67
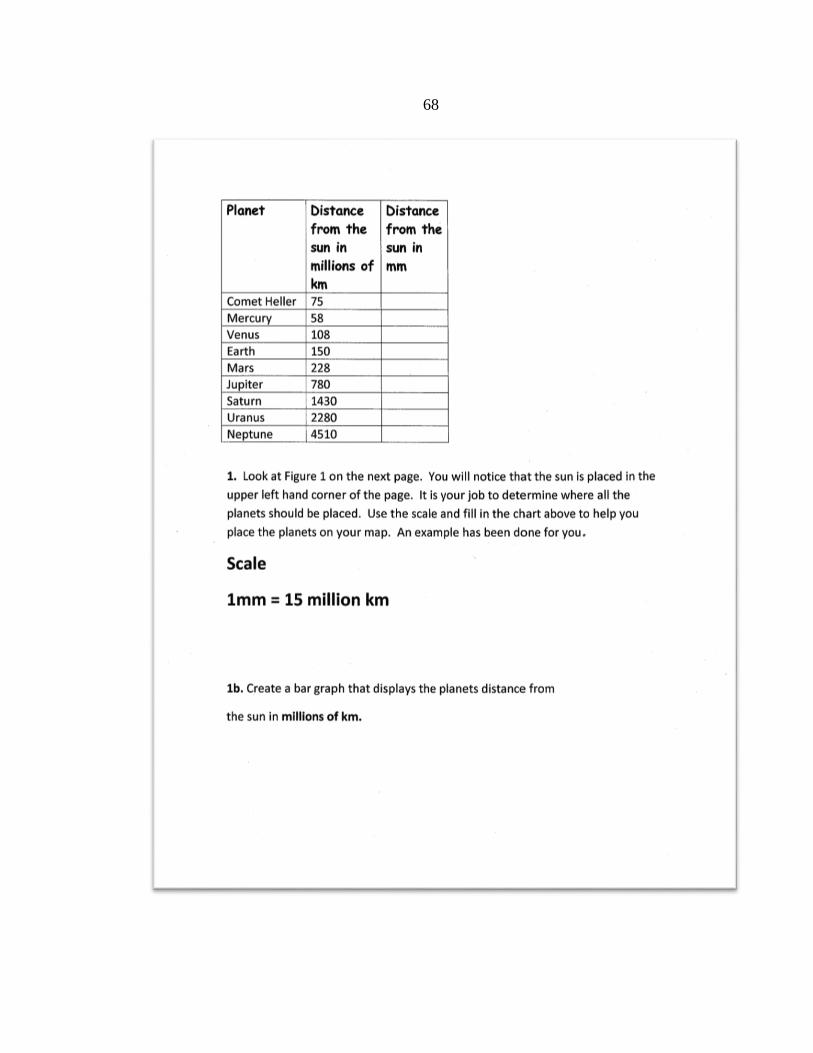
68
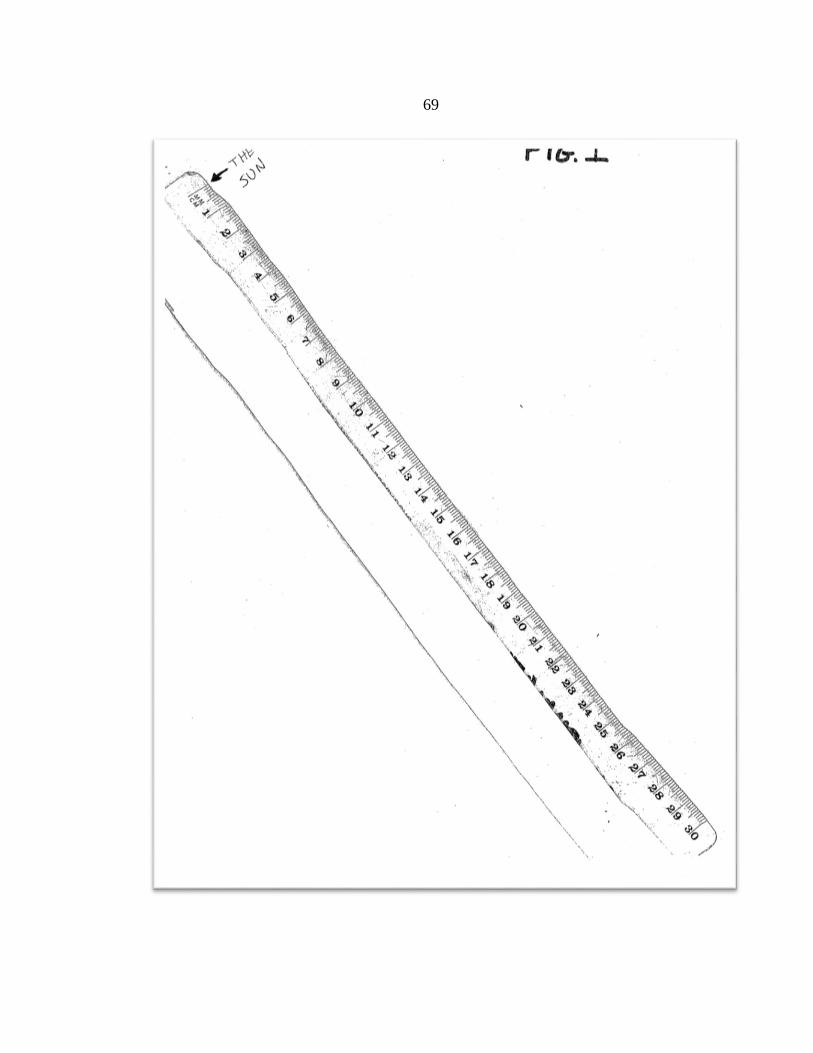
69

70
71

72
APPENDIX F
TIME ON TASK RECORDING CHART
73
74
APPENDIX G
ATTITUDES TOWARDS SCIENCE SURVEY
75
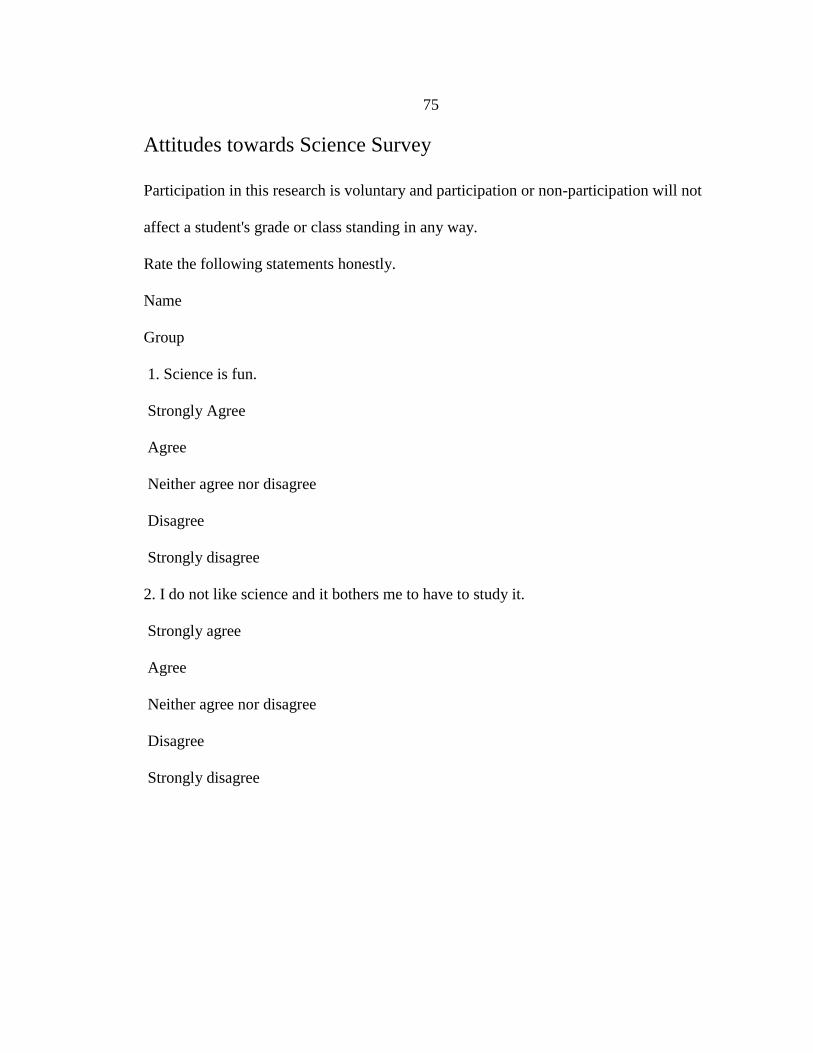
Attitudes towards Science Survey
Participation in this research is voluntary and participation or non-participation will not
affect a student's grade or class standing in any way.
Rate the following statements honestly.
Name
Group
1. Science is fun.
Strongly Agree
Agree
Neither agree nor disagree
Disagree
Strongly disagree
2. I do not like science and it bothers me to have to study it.
Strongly agree
Agree
Neither agree nor disagree
Disagree
Strongly disagree

76
3. During science class, I am usually interested.
Strongly agree
Agree
Neither agree nor disagree
Disagree
Strongly disagree
4. I would like to learn more about science.
Strongly Agree
Agree
Neither agree nor disagree
Disagree
Strongly disagree
5. Science is challenging to me.
Strongly agree
Agree
Neither agree nor disagree
Disagree
Strongly disagree

77
6. Using math makes science more difficult.
Strongly agree
Agree
Neither agree nor disagree
Disagree
Strongly disagree
7. Graphs are difficult for me to understand.
Strongly agree
Agree
Neither agree nor disagree
Disagree
Strongly disagree
8. Science data is boring.
Strongly Agree
Agree
Neither agree nor disagree
Disagree
Strongly disagree

78
9. When I see science data, I am eager to understand it.
Strongly agree
Agree
Neither agree nor disagree
Disagree
Strongly disagree
10. When I collect science data, I am confident I will come up with a possible solution.
Strongly agree
Agree
Neither agree nor disagree
Disagree
Strongly disagree
11. Mapping the ocean floor was exciting to me.
Strongly agree
Agree
Neither agree nor disagree
Disagree
Strongly disagree
79
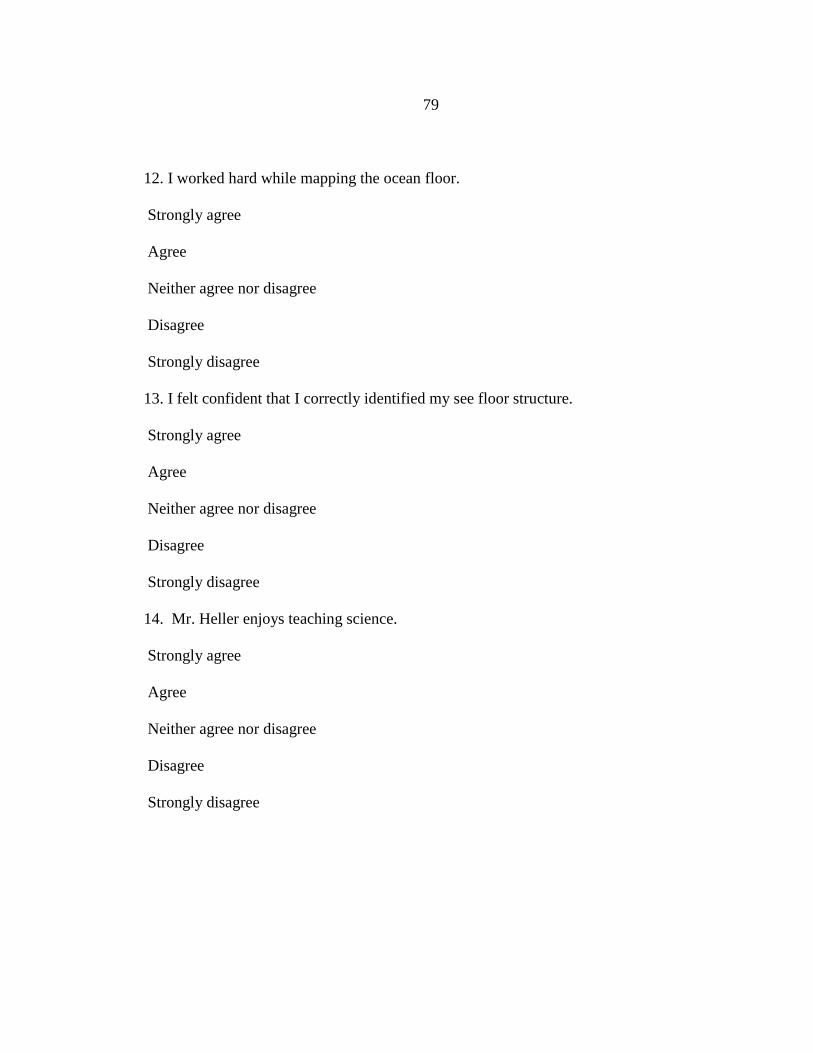
12. I worked hard while mapping the ocean floor.
Strongly agree
Agree
Neither agree nor disagree
Disagree
Strongly disagree
13. I felt confident that I correctly identified my see floor structure.
Strongly agree
Agree
Neither agree nor disagree
Disagree
Strongly disagree
14. Mr. Heller enjoys teaching science.
Strongly agree
Agree
Neither agree nor disagree
Disagree
Strongly disagree

80
APPENDIX H
INTERVIEW QUESTIONS
81
Interview questions on student motivation, engagement, confidence and effect on the
teacher.
To be used at the end of non-treatment and treatment units.
Participation in this research is voluntary and participation or non-participation will not
affect a student’s grade or class standing in any way.
1. In the past 5 weeks what is the most exciting thing we did in science class?
What did you like about this activity?
2. In the past 5 weeks what is the least exciting thing we did in science class?
What did you dislike about this activity?
3. In the past 5 weeks what is the hardest or most difficult thing we did in science
class?
What would have made it easier to do?
4. Do you think you are good at making graphs?
Reading a graph?
Making a conclusion based on a graph?
What do you think I could do to help you get better at these?
5. What activities made you curious or want to know more in the last 5 weeks?
6. What things were boring to you?
7. Do you think Mr. Heller likes teaching science?
How can you tell?
8. In the last 5 weeks what activities did Mr. Heller seem most excited about?

82
Least excited about?
9. Which activities seemed to make Mr. Heller the most frustrated?
83
APPENDIX I
DATA COLLECTION TIMELINE
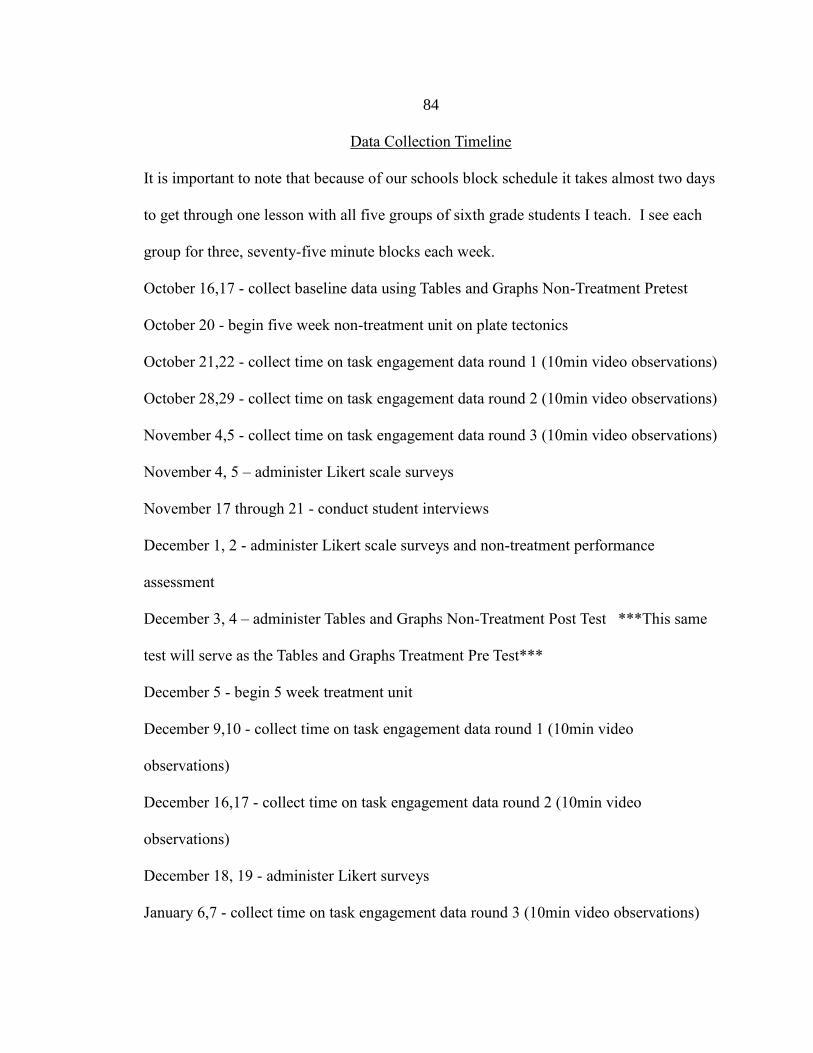
84
Data Collection Timeline
It is important to note that because of our schools block schedule it takes almost two days
to get through one lesson with all five groups of sixth grade students I teach. I see each
group for three, seventy-five minute blocks each week.
October 16,17 - collect baseline data using Tables and Graphs Non-Treatment Pretest
October 20 - begin five week non-treatment unit on plate tectonics
October 21,22 - collect time on task engagement data round 1 (10min video observations)
October 28,29 - collect time on task engagement data round 2 (10min video observations)
November 4,5 - collect time on task engagement data round 3 (10min video observations)
November 4, 5 – administer Likert scale surveys
November 17 through 21 - conduct student interviews
December 1, 2 - administer Likert scale surveys and non-treatment performance
assessment
December 3, 4 – administer Tables and Graphs Non-Treatment Post Test ***This same
test will serve as the Tables and Graphs Treatment Pre Test***
December 5 - begin 5 week treatment unit
December 9,10 - collect time on task engagement data round 1 (10min video
observations)
December 16,17 - collect time on task engagement data round 2 (10min video
observations)
December 18, 19 - administer Likert surveys
January 6,7 - collect time on task engagement data round 3 (10min video observations)

85
January 12 through 16 - conduct student interviews
January 22, 23 – administer treatment unit performance task
January 26, 27 – administer Tables and Graphs Treatment Post test

86
APPENDIX J
IRB FORM

87