the impact of ispm 15 on trade performance (the case of
TRANSCRIPT

The Impact of ISPM 15 on Trade Performance (The case of: Botswana, Cameroon, Ethiopia, Kenya and
Mozambique) A Research Paper presented by: Meron Endale Hailu (Ethiopia) in partial fulfillment of the requirements for obtaining the degree of
MASTER OF ARTS IN DEVELOPMENT STUDIES
Major:
Economics of Development (ECD)
Specialization: Econometric Analysis of Development Policies Members of the Examining Committee: Dr. Elissaios Papyrakis (Supervisor) Dr. Luca Tasciotti (Second Reader) The Hague, The Netherlands November 2016
i
Disclaimer: This document represents part of the author’s study programme while at the Institute of Social Studies. The views stated therein are those of the author and not necessarily those of the Institute. Inquiries: Postal address: Institute of Social Studies P.O. Box 29776 2502 LT The Hague The Netherlands Location: Kortenaerkade 12 2518 AX The Hague The Netherlands Telephone: +31 70 426 0460 Fax: +31 70 426 0799
ii
Contents List of Tables iv
List of Figures v
List of Appendices vi
List of Acronyms vi
Acknowledgement viii
Chapter 1 1
Introduction 1
1.1 Background 1
1.2 Statement of the Problem 2
1.3 Research Objectives and Questions 3
1.4 Scope and Limitation of the Study 4
1.5 Organization of the Paper 5
Chapter 2 6
Background 6
2.1 Conceptual Framework 6
2.2 Problems and Potential Benefits Faced by Developing Countries 11
2.3 Overview of Economic and Trade Performance of Botswana, Cameroon,
Ethiopia, Kenya and Mozambique 13
Chapter 3 19
Literature Review 20
3.1 Theoretical Review 20
3.2 Empirical Review 21
3.3 Economic Impact of Invasion Species 27
Chapter 4 28
Methodology and Data Descriptive 28
4.1 Data Sources 28
4.2 Methodology 28
4.3 Descriptive Statistics 32
Chapter 5 37
Data Analysis 37
5.1 Comparative Commodity and Country Analysis on Ethiopia and Kenya 37

iii
5.2 Analysis on the top Agricultural Export Commodity of Botswana,
Cameroon and Mozambique to EU Market 44
5.3 Trade performance analysis of the five African countries with all trading
partner countries (the rest of the world) 45
Chapter 6 50
Conclusion and Policy Implications 50
6.1 Conclusion 50
6.2 Policy Implication 51
6.3 Recommendation for further studies 51

iv
List of Tables
Table 3.1 Summary of empirical literature review 25
Table 4.1: Summary of previous studies on SPS and variables under 31
consideration
Table 4.2 Summary of statistics for Botswana before the implementation of 33
ISPM 15 in 2009
Table 4.3 Summary of statistics for Cameroon before and after the 33
implementation of ISPM 15 in 2006
Table 4.4 Summary of statistics for Ethiopia before the implementation of 34
ISPM 15 in 2006
Table 4.5 Summary of statistics for Kenya before the implementation of 34
ISPM 15 in 2006
Table 4.6 Summary of statistics for Mozambique before the implementation of 35
ISPM 15 in 2009
Table 4.7 Top export trading partner countries export percent share before 36
and after the implementation of ISPM 15
Table 5.1 Regression result on trade value for ‘coffee, tea, mate and spices’ product 39
group export to EU and OECD countries
Table 5.2 Regression result on trade value for ‘live trees, plants, bulbs, roots, cut 41
flowers’ product group export to EU and OECD countries
Table 5.3 Regression result on trade value for Ethiopia’s major trading partner 42
countries
Table 5.4 Regression result on trade value for Kenya’s major export trading 43
partner countries
Table 5.5 Regression on trade value of Botswana, Cameroon and Mozambique 44
top agricultural export commodities to EU countries
Table 5.6 Summary of regression result coefficient for ISPM 15 impact on 49
export to EU countries and all trading partner countries
v
List of Figures
Figure 1.1: Tariff and non-tariff barriers to trade 2
Figure 2.1: Analytical framework 8
Figure 2.2: Sample ISPM 15 logo 9
Figure 2.3: Trend of export performance for Botswana, Cameroon, Ethiopia, 13
Kenya and Mozambique
Figure 2.4: Botswana’s top export commodities value in 2012 14
Figure 2.5: Botswana’s top import commodities value in 2012 14
Figure 2.6: Cameroon’s top export commodities value from 2010 to 2012 15
Figure 2.7: Cameroon’s top import commodities value from 2010 to 2012 16
Figure 2.8: Ethiopia’s top export goods value in 2015 17
Figure 2.9: Ethiopia’s top ten import goods in 2015 17
Figure 2.10: Kenya’s top export commodities value in 2014 18
Figure 2.11: Kenya’s top import goods value in 2014 18
Figure 2.12: Mozambique’s top export commodities value in 2015 19
Figure 2.13: Mozambique’s top import commodities value in 2015 19
Figure 5.1 Regression result (fixed effect) coefficient for ISPM 15 on export 45
Figure 5.2Regression result (Random effect) coefficient for ISPM 15 on Export 46
Figure 5.3 Regression result (fixed effect) coefficient for ISPM 15 on import 46
Figure 5.4 Regression result (Random effect) coefficient for ISPM 15 on import 47
vi
List of Appendices
Appendix 1: List of variables and Data sources 60
Appendix 2: Descriptive statistics for Ethiopia’s export of ‘Coffee, tea, mate and 60 spices’ product group Appendix 3: Descriptive statistics for Kenya’s export of ‘Coffee, tea, mate and 61 spices’ product group Appendix 4: Descriptive statistics for Ethiopia’s export of ‘live trees, plants, 61 bulbs, roots, cut flowers’ product group Appendix 5: Descriptive statistics for Kenya’s export of ‘live trees, plants, bulbs, 61 roots, cut flowers’ product group Appendix 6: Descriptive statistics of Ethiopia’s trade interaction with EU 62 and OECD countries Appendix 7: Descriptive statistics of Ethiopia’s trade interaction with EU 63 and OECD countries Appendix 8: Descriptive statistics of Ethiopia’s trade interaction with EU 64 and OECD countries Appendix 9: Regression on trade value for Cameroon’s top Export and Import 65 commodities Appendix 10: Regression on trade value for Ethiopia’s top Export and Import 66 commodities Appendix 11: Regression on trade value for Kenya’s top Export and Import 67 commodities Appendix 12: Regression on trade value for Mozambique’s top Export and 68 Import commodities Appendix 13: List of selected commodity group 69
Appendix 14: List of trading partner countries 72
vii
List of Acronyms
CODEX Codex Alimentarius Commission
DC Developed Countries
EBA Everything But Arms
EU European Union
FAO Food and Agriculture Organization of the United Nations
FDI Foreign Direct Investment
FE Fixed Effect model
GDP Gross Domestic Product
HT Heat Treatment
IPPC International Plant Protect Convention
ISO International Organization for Standardization
ISPM 15 International Standards for Phytosanitary Measures Publication No.
15 (ISPM 15)
LDCs Least Developed Countries
MB Methyl Bromide
NPPO National Plant Protection Organizations
NTB Non-Tariff Barriers
OECD Organisation for Economic Co-operation and Development
RE Random Effect
SPS Sanitary and Phytosanitary Standard
SSA Sub-Saharan African countries
TBT Technical Barriers to Trade
WPM Wood Packaging Materials
WTO World Trade Organization
viii
Acknowledgement
My first gratitude goes to God, my lord, who guide me in all my ways and who have
made my dreams to come true. Secondly, I thank my family and friends for their
support and encouragement, more importantly, my cousins Tsion and Abe. I also
thank my best friends, Bethelhem, Sujuin, Margarita and Ellelan.
I would like to acknowledge the support I received from my supervisor Dr. Elissaios
Papyrakis. I am grateful for his patience, time and guidance. I wish to thank my
second reader Dr. Luca Tasciotti for his useful comments and advice. I must say it is
their constructivr remarks and encouragement that made it possible to complete this
study. My gratitude also goes to NUFFIC scholarship.

ix
Abstract
International Standards for Phytosanitary Measures Publication No. 15 (ISPM 15) is a subset of harmonised Sanitary and Phytosanitary (SPS) measure on Wood Packaging Materials (WPM). The standard impact on trade volume is considered large, as WPM is commonly used in international shipment for the majority of commodities. This paper analyzes to what extent ISPM 15 standard implemented by the five African countries, Botswana, Cameroon, Ethiopia, Kenya and Mozambique, affects trade performance. Gravity model approach employed to assess the impact of the standard between the years 1992 to 2014. The result shows, food products’ export of the selected African countries’ to EU countries are highly sensitive to ISPM 15 standard. The direction and extent of the standard effect varies depending on country and product group mix under consideration. With regard to trade interaction of the selected African countries with all trading partners, the standard has trade distortion effect on both export and import of agricultural and non-agricultural product groups’. Interestingly, meeting the requirement of the standard does not necessarily improve or ensure these countries’ better trade performance. The study findings have implication that other factors such as political stability, absence of terrorism as well as other SPS and NTB measures predominantly regulate trade interaction with EU countries.
Relevance to Development Studies
The analysis of this study contributes to the general literature that assesses trade
implication of Sanitary and Phytosanitary Standards (SPS) using gravity model. The
paper relevance stems from the fact that though WPM has significant importance to
the global trade, there is limited research conducted regarding the impact of ISPM 15
on bilateral trade flow. In contrast to previous studies on SPS, the paper is pioneer in
using socio economic determinant variables effect on bilateral trade flow. In addition,
the paper give new insight study in assessing the effect of ISPM 15 standard by
taking in to account of other SPS and NTB measures effect on bilateral trade flow.
The findings of this paper can contribute to fill the existing knowledge gap and
giving insight for further policy analysis, since there are no researches conducted
about the effect of the standard in African countries context.
Keywords
ISPM No. 15, SPS, Non-tariff barriers (NTB), Gravity Model, WPM
1
Chapter 1
Introduction
1.1 Background
The ability of Sub Saharan Africa countries (SSA) to maintain or increase their market share in the world market highly depends on their capacity to meet, international and country specific, quality and safety standards (Henson and Loader 2001:87). There is a growing concern among developing countries that as tariff and quantitative restrictions decline, non-tariff trade barriers such as SPS standards will become an impediment for trade (Henson et al. 2000, Jensen 2002). One of the common features of traditional trade barriers is their classification as quantifiable trade barriers, these includes “tariffs, export subsidies, embargoes, import bans, quotas, licensing and exchange controls” (Henson and Loader 2001:85). On the other hand, non-quantifiable tariffs that are considered as equivalent of tariff barriers includes, “bilateral agreements, state trading, customs procedures, administrative practices and technical barriers to trade” (Beghin and Bureau 2001:4).
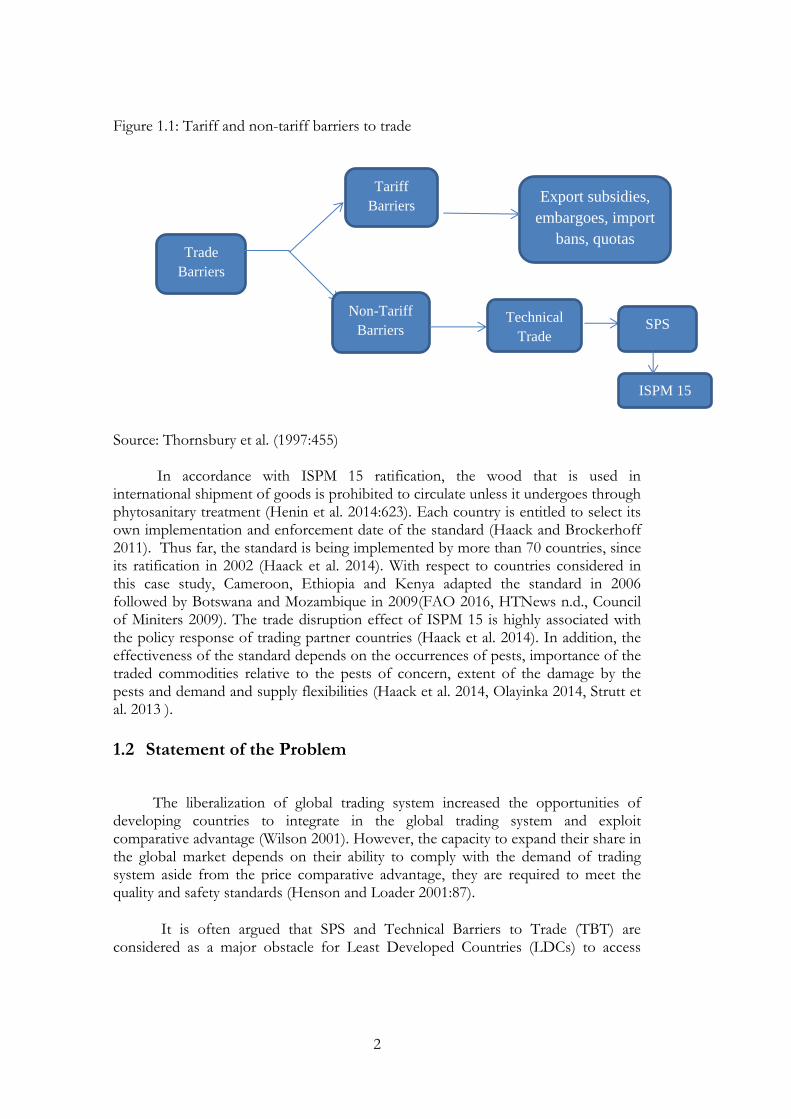
NTBs are policy measures, other than quantifiable trade barriers that can potentially impede international trade reducing traded quantities or prices (UNCTAD 2013). The agreement on the implementation of SPS sets out basic rules to protect plant, human and potential environmental damage that arise from the introduction, establishment and spread of pests or disease causing organisms. The expansion of international trade in recent decades has been accompanied by an increase in movement of WPM, which are recognized as one of the pathways for invasive insects between trading countries (Haack et al. 2014). The introduction and expansion of pests in non-native areas result negative consequences on environmental, economic or human welfare by establishing new territory and spread at the expense of native species (Coluatti et al. 2006). ISPM 15 is a harmonised SPS measure of international standard for the treatment of wood packaging material (FAO 2009). The standard has been ratified in 2002 to reduce the risk associated with the introduction and expansion of quarantine pests, as well as significantly minimize the risk of other pests (FAO 2002, FAO 2009, Haack et al. 2014:2). Figure 1.1 presents the classification of ISPM 15 as part of non-tariff trade barrier and SPS measure. In addition, since WPM is a means of transportation for the majority of global merchandize trade, ISPM 15 potentially affects wider range of trade volume in comparison to other SPS measures (Strutt et al. 2013). WPM used commonly in international shipment of goods because of its affordability, abundance, accessibility and repaired advantages (Liebhold et al. 2012). The standard implemented through issuing official stamps that certifies the application of treatment on WPM such as, “dunnage, crating, packing blocks, drums, cases, load boards, pallet collars, skids or pallets which secure, protect or assist the shipment of commodities” (FAO 2009:7, Leal et al.. 2010).
2
Figure 1.1: Tariff and non-tariff barriers to trade
Source: Thornsbury et al. (1997:455) In accordance with ISPM 15 ratification, the wood that is used in international shipment of goods is prohibited to circulate unless it undergoes through phytosanitary treatment (Henin et al. 2014:623). Each country is entitled to select its own implementation and enforcement date of the standard (Haack and Brockerhoff 2011). Thus far, the standard is being implemented by more than 70 countries, since its ratification in 2002 (Haack et al. 2014). With respect to countries considered in this case study, Cameroon, Ethiopia and Kenya adapted the standard in 2006 followed by Botswana and Mozambique in 2009(FAO 2016, HTNews n.d., Council of Miniters 2009). The trade disruption effect of ISPM 15 is highly associated with the policy response of trading partner countries (Haack et al. 2014). In addition, the effectiveness of the standard depends on the occurrences of pests, importance of the traded commodities relative to the pests of concern, extent of the damage by the pests and demand and supply flexibilities (Haack et al. 2014, Olayinka 2014, Strutt et al. 2013 ).
1.2 Statement of the Problem
The liberalization of global trading system increased the opportunities of developing countries to integrate in the global trading system and exploit comparative advantage (Wilson 2001). However, the capacity to expand their share in the global market depends on their ability to comply with the demand of trading system aside from the price comparative advantage, they are required to meet the quality and safety standards (Henson and Loader 2001:87).
It is often argued that SPS and Technical Barriers to Trade (TBT) are considered as a major obstacle for Least Developed Countries (LDCs) to access
Tariff
Barriers
ISPM 15
15
Trade
Barriers
Non-Tariff
Barriers
Export subsidies,
embargoes, import
bans, quotas
Technical
Trade
Barriers
SPS

3
global market, as they add transaction cost (Fontagné et al. 2005). Even if the intention of standards rely on scientific evidence or international sanitary standards, the effect is not guaranteed that such standards always have negative impact or no effect on trade at all ( Fontagné et al. 2005). Developing countries are facing difficulties in meeting the increasingly tight SPS measures, as costs of implementing these measures are higher for developing countries in comparison to developed countries (Olayinka 2014). ISPM 15 as part of SPS regulations seen differently among tariff and NTBs as they often complicate the analysis of trade flow and welfare impacts (Disdier et al. 2008).
Although the trade distortion effect of SPS measures attempted to overcome through SPS agreements, most developing countries lack scientific and technical infrastructure to exploit the opportunities offered by the agreement (Henson and Loader 2001). As a result, the standards are incompatible or hardly applicable given the existing production system of developing countries. Most of the empirical studies in the field of SPS are restricted to a certain number of products (Fontagne et al. 2005). There are limited number of studies conducted in the area of ISPM 15 and environmental standards, and no study has been conducted in the context of African countries. Previous studies findings regarding the impact of environmental measures in reducing international trade flow is highly correlated with the accuracy of model specification and inclusiveness of commodity type under consideration (Fontagné et al. 2005). This study seeks to investigate the economic or trade effect of ISPM 15 on five African countries; Botswana, Cameroon, Ethiopia, Kenya and Mozambique.
1.3 Research Objectives and Questions
The objective of the paper is to assess the effect of ISPM15 on bilateral trade flow performance of five African countries; Botswana, Cameroon, Ethiopia, Kenya and Mozambique, over the period 1992-2014. In general, the study investigates two main questions;
To what extent does ISPM 15 significantly impact bilateral trade flow?
Which product group does the standard affect most? The analysis is composed of three subsections. The first part of the analysis examines commodity and country case analysis on Ethiopia and Kenya. Based on 2-digit level Harmonised System (HS), the two product groups that have been selected for the analysis are; ‘coffee, tea, mate and spices’ and ‘live trees, plants, bulbs, roots, cut flowers’. The harmonized System is international standard nomenclature classification of traded goods for common customs purposes (UN Trade Statistics n.d.). HS comprises 2-digit, 4-digit and 6-digit level classification. The rationale for selecting these two countries and commodity categories rely considering their competitiveness as well as leading position as exporters of coffee and cut flower in Africa. In addition, the three major export destination countries are selected based on their standard implementation status. Besides the inclusion of European Union (EU) and
4
Organisation for Economic Co-operation and Development (OECD) is worthwhile considering their major export destination share and import potential. Second section of the analysis looks at the possible effect of ISPM 15 to EU countries for the top agricultural export commodities of Botswana, Cameroon and Mozambique. The reason to focus on EU countries arises from the fact that, it is highly argued EU countries implement more stringent requirement of SPS measures (Otsuki et al. 2001). The third part assesses the effect of ISPM 15 on the three top export and import product groups of the five African countries. Sub questions for the first section (comparative case study on Ethiopia and Kenya)
To what extent does the standard impact ‘coffee, tea, mate and spices’ and ‘live trees, plants, bulbs, roots and cut flower’ product groups’ export to EU and OECD countries?
Sub question for the second and third section
Does the standard have trade distortion effect on the selected African countries’ major export commodities to EU market?
Whether ISPM 15 has significant effect on both export and import trade flow of the five African countries with all trading partners (the rest of the world)?
Is the impact similar for the three major export and import product groups’?
1.4 Scope and Limitation of the Study
The scope of the study is limited on the standard impact of five African
countries focusing on Botswana, Cameroon, Ethiopia, Kenya and Mozambique. The
four case study countries, Botswana, Cameroon, Kenya and Mozambique have been
chosen considering the availability of data at hand for the analysis. Furthermore,
Ethiopia has been selected given the fact that it is one of the fastest growing
economies in Africa. The paper has limitation in capturing the effect of other
possible factors that would likely to influence bilateral trade flow including Foreign
Direct Investment (FDI) and economic diplomacy as well as market volatility
indicators such as volatility of commodity price and exchange rate. Due to time and
resource constraints, selection of the product group classification is restricted to 2-
digit level of HS. In addition, the methodology used in this paper, gravity model
approach, has weakness in obtaining the separate estimate of compliance cost
associated with ISPM 15 and identifying the demand and supply effect of the
standard.
5
1.5 Organization of the Paper
The study is organized in to five sections. Chapter 1 discusses about
background of the paper, statement of the problem, research objectives and
questions, and scope and limitation of the study. Chapter 2 explore in detail the
background information about the ISPM 15 emphasising on the conceptual
framework of the standard and problems and potential challenges faced by
developing countries. Then, Chapter 3 discusses Literature review comprising
theoretical review, empirical review and findings on economic costs of invasive
species. Chapter 4 presents about Methodology and Descriptive statistics. The next
chapter, Chapter 5 focuses on Data Analysis and Discussion. Then the last Chapter,
presents conclusions and policy implications.

6
Chapter 2
Background
This chapter is divided in to three sections. The first section gives overview on the conceptual framework of implementing ISPM 15. The second presents drawbacks and potential benefits faced by developing countries in implementing SPS measures. The final section provides outlook on the economic and trade performance of the five African countries over the years after the implementation of ISPM 15.
2.1 Conceptual Framework
Globalization and international trade aggravated the movement and spread of foreign species to importing countries by imposing potential threat to the ecosystem and biodiversity (Leal et al. 2010). An invasive alien species is defined as “species introduced beyond its native range that has adverse consequences for economic, environmental or human welfare” (Leal et al. 2010:1) International standards for physio sanitary measure (ISPM) and International plant protect convention (IPPC) of harmonised guidelines provide international standards and regulations to conserve biodiversity and ecosystem from foreign species threat (Clarke 2004). The significance of phytosanitary measures is expected to grow following the growth of timber production in the world trade over the next decade (Clarke 2004). About 50–80% of the world merchandise trade is exported or imported using WPM (Haack et al. 2014).The annual global environment damage and economic cost as a result of the spread of invasive alien pests is estimated to reach trillions of dollars (Leal et al. 2010). The majority of the spread is explained by expansion of trade which significantly increased the potential and probability of invasive alien pests as they could be transported along with cargo (Klapwijk et al. 2016, Leal et al. 2010:1). The introduction and establishment of bark beetles and wood boring insects has significantly accelerated since 1990’s (Ciesla 2014). As Leal et al. (2010) stated forest products could potentially introduce and cause phytosanitary risks posing environmental threat for the importing countries. Hence, the invasion of new species alters the forest ecosystem causing adverse impact on the environment (Haack et al. 2014). Solid wood packaging materials transported with commodities are one of the pathways for the introduction and establishment of invasive insects, which has the capacity to cause sever destruction in new locations. The terminology “pathway” according to the International Plant Protection Convention implies “any means that allow the entry or spread of a pest” (Humble 2010:58). Whereas pest risk analysis is defined as “the process of evaluating biological or other scientific and economic evidence to determine whether an organism is a pest, whether it should be regulated and the strength of any phytosanitary measures to be taken against it” (FAO 2009 ,
7
Humble 2010 :58). Higher phytosanitary risks are linked with international trade of untreated and live forest products such as round bark wood (Leal et al. 2010). However, the risk could be decreased significantly undertaking the raw wood through further production process for instance the production of swan wood from that of round bark wood.
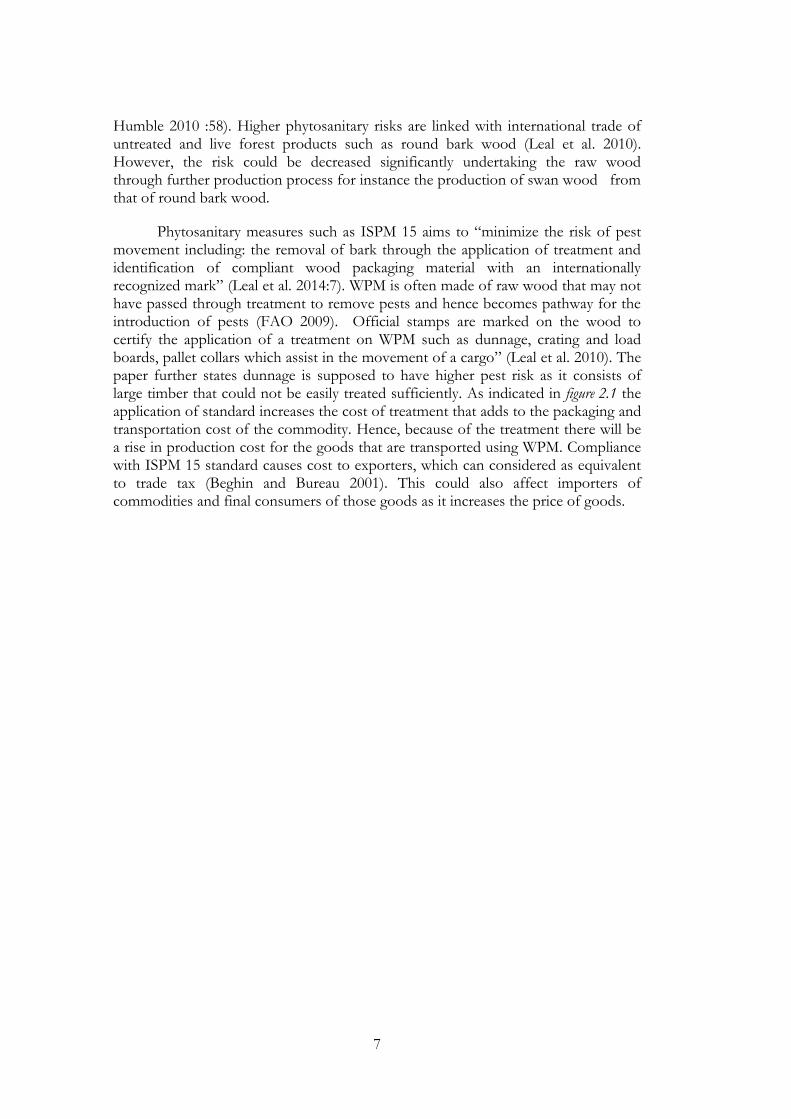
Phytosanitary measures such as ISPM 15 aims to “minimize the risk of pest movement including: the removal of bark through the application of treatment and identification of compliant wood packaging material with an internationally recognized mark” (Leal et al. 2014:7). WPM is often made of raw wood that may not have passed through treatment to remove pests and hence becomes pathway for the introduction of pests (FAO 2009). Official stamps are marked on the wood to certify the application of a treatment on WPM such as dunnage, crating and load boards, pallet collars which assist in the movement of a cargo” (Leal et al. 2010). The paper further states dunnage is supposed to have higher pest risk as it consists of large timber that could not be easily treated sufficiently. As indicated in figure 2.1 the application of standard increases the cost of treatment that adds to the packaging and transportation cost of the commodity. Hence, because of the treatment there will be a rise in production cost for the goods that are transported using WPM. Compliance with ISPM 15 standard causes cost to exporters, which can considered as equivalent to trade tax (Beghin and Bureau 2001). This could also affect importers of commodities and final consumers of those goods as it increases the price of goods.
8
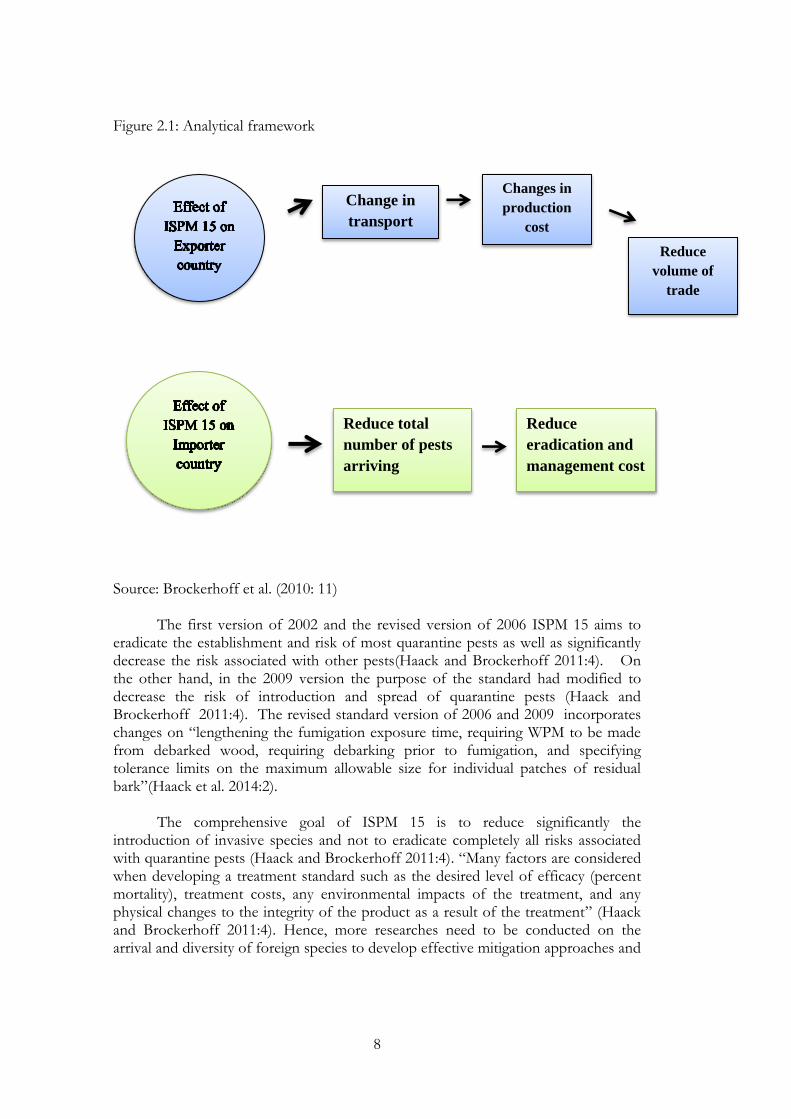
Figure 2.1: Analytical framework
Source: Brockerhoff et al. (2010: 11) The first version of 2002 and the revised version of 2006 ISPM 15 aims to eradicate the establishment and risk of most quarantine pests as well as significantly decrease the risk associated with other pests(Haack and Brockerhoff 2011:4). On the other hand, in the 2009 version the purpose of the standard had modified to decrease the risk of introduction and spread of quarantine pests (Haack and Brockerhoff 2011:4). The revised standard version of 2006 and 2009 incorporates changes on “lengthening the fumigation exposure time, requiring WPM to be made from debarked wood, requiring debarking prior to fumigation, and specifying tolerance limits on the maximum allowable size for individual patches of residual bark”(Haack et al. 2014:2). The comprehensive goal of ISPM 15 is to reduce significantly the introduction of invasive species and not to eradicate completely all risks associated with quarantine pests (Haack and Brockerhoff 2011:4). “Many factors are considered when developing a treatment standard such as the desired level of efficacy (percent mortality), treatment costs, any environmental impacts of the treatment, and any physical changes to the integrity of the product as a result of the treatment” (Haack and Brockerhoff 2011:4). Hence, more researches need to be conducted on the arrival and diversity of foreign species to develop effective mitigation approaches and
Change in
transport
costs
Changes in
production
cost
Reduce
volume of
trade
Reduce total
number of pests
arriving
Reduce
eradication and
management cost
9
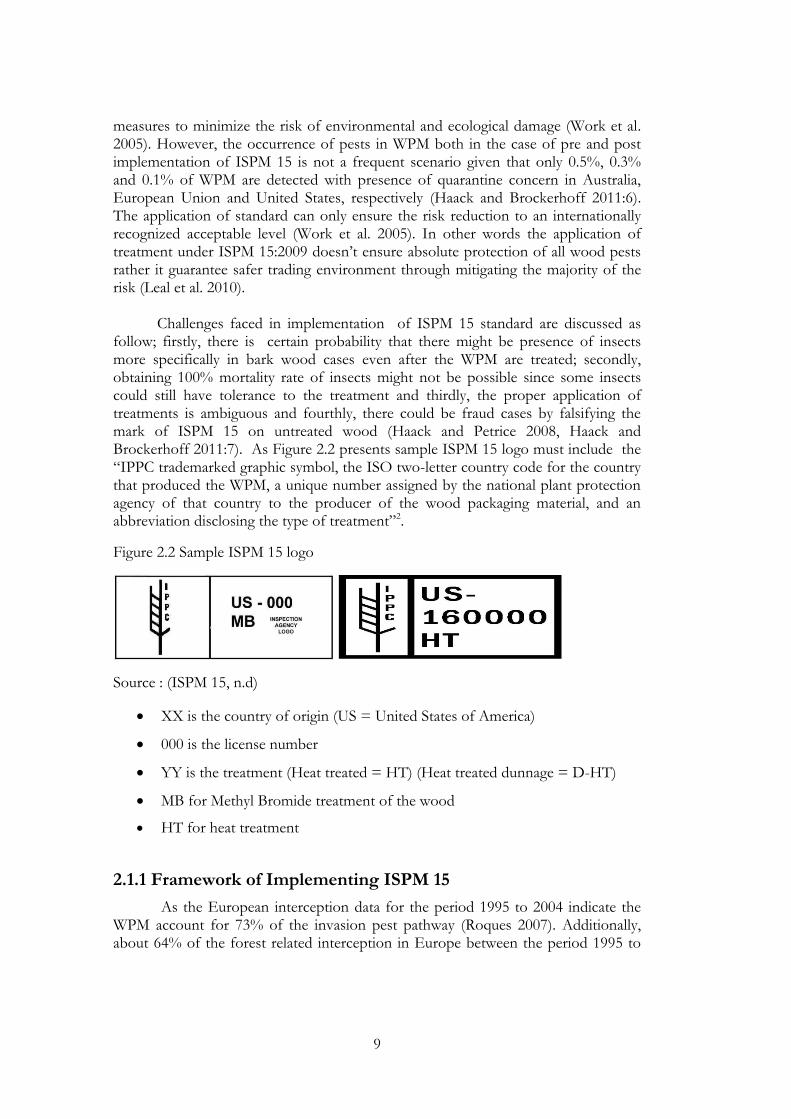
measures to minimize the risk of environmental and ecological damage (Work et al. 2005). However, the occurrence of pests in WPM both in the case of pre and post implementation of ISPM 15 is not a frequent scenario given that only 0.5%, 0.3% and 0.1% of WPM are detected with presence of quarantine concern in Australia, European Union and United States, respectively (Haack and Brockerhoff 2011:6). The application of standard can only ensure the risk reduction to an internationally recognized acceptable level (Work et al. 2005). In other words the application of treatment under ISPM 15:2009 doesn’t ensure absolute protection of all wood pests rather it guarantee safer trading environment through mitigating the majority of the risk (Leal et al. 2010). Challenges faced in implementation of ISPM 15 standard are discussed as follow; firstly, there is certain probability that there might be presence of insects more specifically in bark wood cases even after the WPM are treated; secondly, obtaining 100% mortality rate of insects might not be possible since some insects could still have tolerance to the treatment and thirdly, the proper application of treatments is ambiguous and fourthly, there could be fraud cases by falsifying the mark of ISPM 15 on untreated wood (Haack and Petrice 2008, Haack and Brockerhoff 2011:7). As Figure 2.2 presents sample ISPM 15 logo must include the “IPPC trademarked graphic symbol, the ISO two-letter country code for the country that produced the WPM, a unique number assigned by the national plant protection agency of that country to the producer of the wood packaging material, and an abbreviation disclosing the type of treatment”2.
Figure 2.2 Sample ISPM 15 logo
Source : (ISPM 15, n.d)
XX is the country of origin (US = United States of America)
000 is the license number
YY is the treatment (Heat treated = HT) (Heat treated dunnage = D-HT)
MB for Methyl Bromide treatment of the wood
HT for heat treatment
2.1.1 Framework of Implementing ISPM 15
As the European interception data for the period 1995 to 2004 indicate the WPM account for 73% of the invasion pest pathway (Roques 2007). Additionally, about 64% of the forest related interception in Europe between the period 1995 to
10
2004 were not fully identified (Roques 2007). Strengthening sanitary inspection at the border is the safest and cheapest method to prohibit the risk of invasive species (Kaiser 1999). Waring and O’Hara (2005) further implied that the approach to eradicate invasive pests after its settlement in foreign region is ineffective in terms of cost as well as ecological welfare. Some of the limitations related to National plant protection organisations inspection in checking up the presence of plant pests on imported goods includes: 1. the inspection database target mainly high risk commodity and pathways instead of random sampling; 2. technical gaps during inspection are not recorded; 3. it is difficult to estimate the pest loads per shipment since the inspection ceases after identifying the first organism as pest quarantine significant; 4. the inspection doesn’t cover full shipment; 5. there is a possibility not to fully discover immature (larvae) stage of species (Humble 2010:59) There are three internationally acceptable effective treatments against quarantine pests that are heat treatments, micro wave treatment and a fumigation treatment using methyl bromide under (Leal et al. 2010). However, due to its noticeable advantages usage of microwave treatment is increasing over the time.
Methyl Bromide Fumigation
Methyl bromide has been widely used for quarantine treatment purpose since 1930s due to its capacity to kill pests rapidly and limited effect in contaminating commodities (Henin et al. 2008, Fields and White 2002). However, the implementation of methyl bromine fumigation as treatment is declining due to its depletion side effect on the Ozone layer (Fields and White 2002). “Methyl bromide acts rapidly, controlling insects in less than 48 h in space fumigations, and it has a wide spectrum of activity, controlling not only insects but also nematodes and plant-pathogenic microbes” (Fields and White 2002:331). The chemical will be prohibited from enforcement in developed countries, with the exception of quarantine purpose, due to its extreme depleting effect on Ozone in the atmosphere (Fields and White 2002). Other alternative chemical treatment solutions that are being tested to replace methyl bromide include phosphine, sulfuric fluoride, and carbonyl sulfide. “Methyl bromide is a widely used fumigant because it rapidly kills insects, mites, microflora, and nematodes; it penetrates commodities including wood; it usually does not taint commodities; and it is noncorrosive and non-flammable” (Fields and White 2002: 333) Heat Treatment
The heat treatment application are conducted through heating the wood under the temperature condition of 56˚C for the period of 30 continuous minutes or through applying dielectric heating for 60 seconds under the temperature of 60˚C or using the latest of 2.45 GHz wavelength microwaves treatment (Henin et al. 2008). The disadvantage of the heat treatment includes, “the estimated cost of treatment is expensive i.e. the per unit cost of pallet exceed US$ 2: the process take several hours
11
and the effectiveness of the treatment is uncertain; and it is difficult to ensure whether a piece of wood or pallet is effectively treated” (Henin et al. 2008:76) Microwave Treatment In recent decades, the usage of microwave treatment as alternative treatment for Wood packaging is increasing due to the following main advantages; firstly, it is a quick treatment of infected wood (Fleming et al. 2003); secondly, it is highly effective; and lastly, it can be applied for all type of forest pests and it is harmless for the environment. In order to eradicate potential treat organisms, the wood is required to be kept in temperature higher than 60 0C for about 60 seconds (FAO 2009).
2.2 Problems and Potential Benefits Faced by Developing
Countries
Developing countries argue that the environmental policies and regulations create barrier to the sectors in which they have comparative advantage (Fontagne et al. 2005). In general, the application of SPS measures is strict in developed countries as compare to developing countries (Henson et al. 2000). In addition, in certain circumstances the SPS requirements are incompatible to the existing production and marketing system of developing countries (Henson et al. 2000: 9). “Particular concerns are that developed countries do not take in to account the needs of developing countries when setting SPS requirements, the time given between notification and implementation of SPS requirements is insufficient, and the technical assistance given to developing countries is inadequate” (Henson et al. 2000: 10). In certain circumstances if the product do not compliance with SPS requirements either the product face rejection at the point of entry or the supplier pays for the treatment cost. In repetitive cases, the supplier could possibly even prevent from exporting. Furthermore, in the case of certain commodities such as coffee and cocoa, exporters are obligated to export at lower price unless the custom requirements are meet and it impose significant loss on the value of products (Henson et al. 2000). Although SPS measures encourage countries to apply internationally recognized standards, it also give alternative that countries may introduce SPS measures with higher protection level based on scientific justification or level of risk assessment (Ogunkola et al. 2000:4). This in turn creates challenges for developing countries as they are required to comply with different level of SPS measures for the same product given the context of each countries specification. In general, the major problems faced by developing countries includes; lack of clear information and awareness about SPS standard, lack of technical expertise and appropriate technologies (if the treatment resources are not locally available there arise additional cost of compliance), limited access to compliance resources, existence of incompatible production system and logistic problems (Henson et al. 2000).
12
The imposition of physio-sanitary standards raises trading cost limiting the ability of LDCs competency to standards (Raballand and Aldazba-Carroll 2007). For instance, the increment on per unit of pallet price due to the ISPM 15 treatment exceeds $1.00. Exporters are concerned with additional cost of treatment for WPM at the same time maintaining market competency and customers’ preferences (Hassler et al. 2010: 310). Hence, looking for alternative, cost effective and close substitute of WPM is beneficial for end users of WPM. Products that are exempted from ISPM 15 treatment requirement, such as plastic and engineered wood products, could be considered as alternatives of WPM (Hassler et al. 2010: 310). Hence, policy makers should be aware of the ISPM 15 implication on the change of magnitude and value of international trade as well as WPM industry performance (Hassler et al. 2010).
On the other hand, the potential benefits of SPS agreements for developing countries includes,
enhance transparency, reduce transaction costs associated with exports to countries with divergent SPS measures; increase transparency and clearly structured procedures for the settlement of disputes on the legitimacy of divergent national SPS measures; enhance international harmonisation of national SPS measures; potentially increase levels of technical assistance from developed countries (Henson et al. 2000:53).

13
2.3 Overview of Economic and Trade Performance of Botswana,
Cameroon, Ethiopia, Kenya and Mozambique
The economy of SSA mainly rely on the export of agricultural and food products. The export composition of SSA agricultural products is less diversified; mainly composed of oilseeds, coffee, cocoa, fruits and vegetables (Nyangito 2004). However, they only have a dominant share in the export of coffee accounting 80% of total world coffee export (Henson and Loader 2001). The study further argues that their market share for commodities such as cocoa and sugar has also declined significantly in recent years. In addition, although intra Africa trade has accelerated because of regional integration agreements over the past decade, few EU countries still dominate the market for major export destination and market concentration of these products (Nyangito 2004). As illustrated in Figure 2.3, Mozambique and Ethiopia have by large expanded their volume of export over the years from 2000 to 2014, in comparison to the other three countries. Figure 2.3: Trend of export performance for Botswana, Cameroon, Ethiopia, Kenya and Mozambique
Source: WDI (2016); Export Value index (2000=100)
Botswana Botswana is heavily endowed with precious metals more specifically, with diamond as the world-leading producer. Before the discovery of diamond in 1967, which has transformed the country’s economy, the economy was highly dependent on Agriculture (SADC Trade n.d.). Its GDP per capita is recorded as one of the highest in SSA (International Trade & Investment Review n.d.). EU emerges as major hub of Botswana’s export, more importantly UK, as dominant importer of diamond and beef products, while South Africa as major source of the country import (SADC
0
200
400
600
800
1000
1200
1400
Botswana Ethiopia Kenya Mozambique Cameroon

14
Trade n.d.). In the 2000s, Botswana was growing by 3% yearly followed by a quarter of points less in 2010s (International Trade & Investment Review, n.d.). Botswana’s exports is highly dominated concentrated on primary products, especially diamonds, gold and copper/nickel, and to a lesser extent meat and meat products, textiles and clothing (International Trade & Investment Review, n.d.) .As figure 2.4 illustrates ‘Precious and semi-precious stone’ and ‘Nickle and articles thereof’ account 80% of total export in 2010 (Southern African Custom Union 2010).
Figure 2.4: Botswana’s top export commodities value in 2012
Source: South African Custom Union
Figure 2.5: Botswana’s top import commodities value in 2012
Source: South African Custom Union
Pearls and precious metals
70%
Nickel and articles thereof
11%
Meat and edile meat
offals 4%
Ores, slag and ash 2%
Articles of apparel
3%
Vehicles 2%
Others 8%
Mineral fuels and oils 15%
Pearls and precious stones 12%
Machinery and mechanical appliances
11% Vehicles 9%
Electrical machinery
7%
Articles or iron and
steel 4%
Others 42%
15
Cameroon
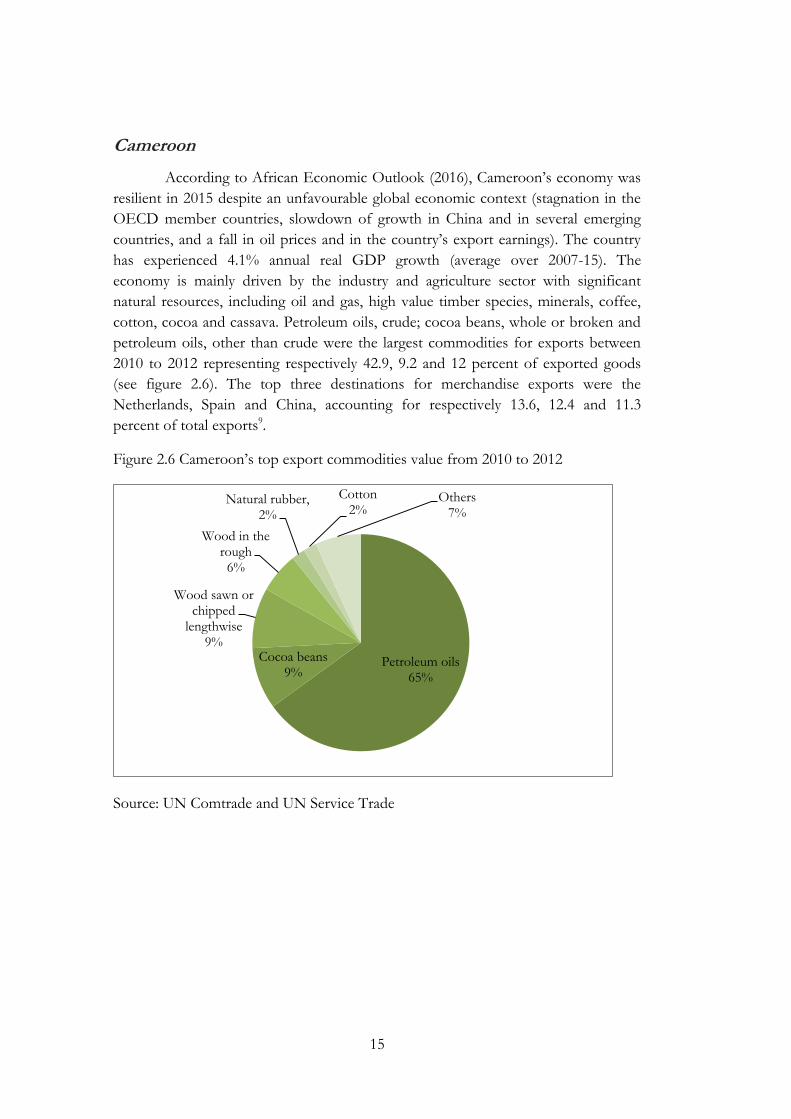
According to African Economic Outlook (2016), Cameroon’s economy was
resilient in 2015 despite an unfavourable global economic context (stagnation in the
OECD member countries, slowdown of growth in China and in several emerging
countries, and a fall in oil prices and in the country’s export earnings). The country
has experienced 4.1% annual real GDP growth (average over 2007-15). The
economy is mainly driven by the industry and agriculture sector with significant
natural resources, including oil and gas, high value timber species, minerals, coffee,
cotton, cocoa and cassava. Petroleum oils, crude; cocoa beans, whole or broken and
petroleum oils, other than crude were the largest commodities for exports between
2010 to 2012 representing respectively 42.9, 9.2 and 12 percent of exported goods
(see figure 2.6). The top three destinations for merchandise exports were the
Netherlands, Spain and China, accounting for respectively 13.6, 12.4 and 11.3
percent of total exports9.
Figure 2.6 Cameroon’s top export commodities value from 2010 to 2012
Source: UN Comtrade and UN Service Trade
Petroleum oils 65%
Cocoa beans 9%
Wood sawn or chipped
lengthwise 9%
Wood in the rough 6%
Natural rubber, 2%
Cotton 2%
Others 7%

16
Figure 2.7 Cameroon’s top import commodities value from 2010 to 2012
Source: UN Comtrade and UN Service Trade
Ethiopia
Ethiopia has succeeded to become top ten fastest growing economies in the world and `the emerging economic engine of Africa with an average growth rate of 10% (Tiwari 2015). Based on statistics from the International Monetary Fund’s World Economic Outlook Database, Ethiopia’s total Gross Domestic Product amounted to $170.5 billion in 2015. Led by the expansion of agriculture and services sectors, the country has experienced double-digit economic growth, averaging 10.8% for a decade. Until recently, agriculture was the dominant sector in the economy but the service sector has recently outstripped agriculture in terms of its share of GDP. However, agricultural products are still the dominant commodities exported; accounting 84% of Ethiopia’s export earnings (African Economic Outlook 2016). Coffee, tea and spices; vegetables; live trees and plants were the largest commodities for exports between 2010 to 2015 representing respectively 20.9, 17.9 and 14.7 percent of exported goods( see figure 2.8).
Petroleum oils 29%
Rice 5%
Fish 1%
Wheat and meslin
3%
Medicaments 3%
Others 60%

17
Figure 2.8 Ethiopia’s top export goods value in 2015
Source: Global Edge, Michigan State University Figure 2.9 Ethiopia’s top ten import goods in 2015
Source: Global edge, Michigan State University
Kenya Kenya owns the largest economy in East Africa. Over the last 5 years,
Kenya’s GDP grew on average by 3.7% annually. Its economy is service-based, with
a relatively small industrial sector: in 2013, service sector contributed 63.4% of real
GDP followed by agriculture sector 20.7% and industrial sector 15.9% (African
Development Bank Group 2014). The report also implies about 91% of Kenya’s
Coffee, tea and spice
21%
Vegetables 18%
Live plants 15% Oil & mineral
fuels 14%
Oil seeds 11%
Others 21%
Oil and Mineral Fuels 18%
Industrial Machinery
13%
Electrical Machinery
9% Motor Vehicles
& Parts 8%
Iron & Steel
Articles 5%
Others 47%
18
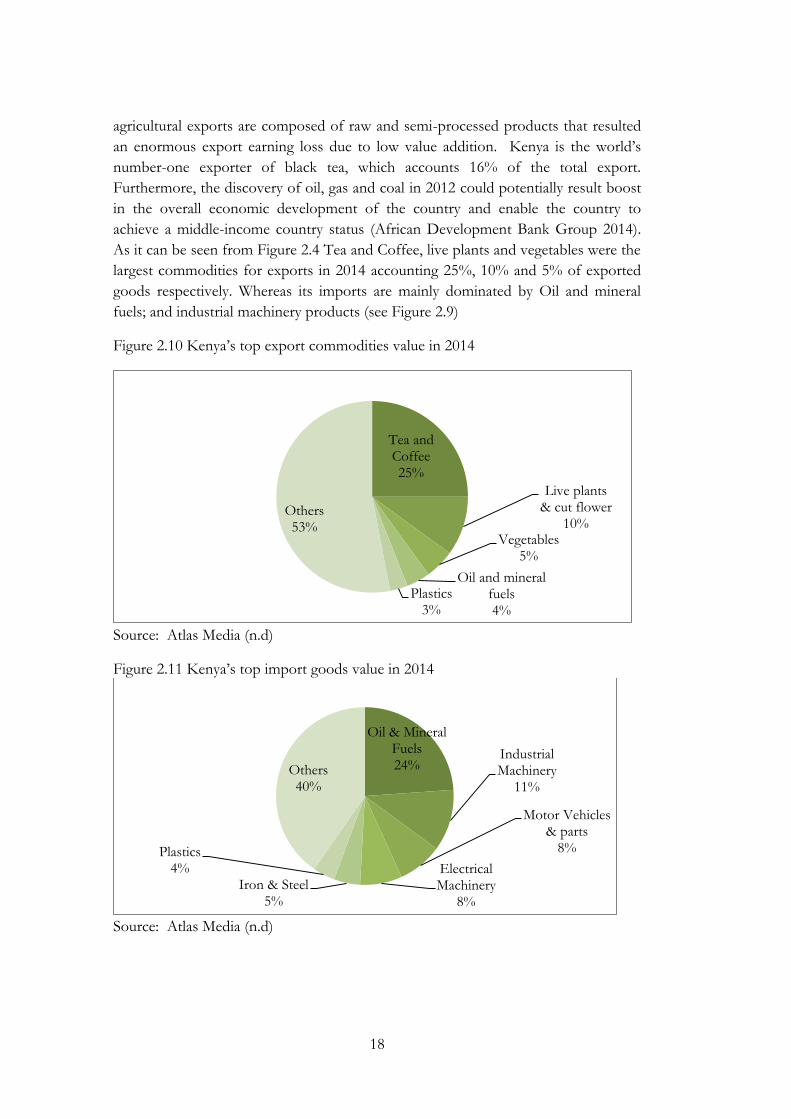
agricultural exports are composed of raw and semi-processed products that resulted
an enormous export earning loss due to low value addition. Kenya is the world’s
number-one exporter of black tea, which accounts 16% of the total export.
Furthermore, the discovery of oil, gas and coal in 2012 could potentially result boost
in the overall economic development of the country and enable the country to
achieve a middle-income country status (African Development Bank Group 2014).
As it can be seen from Figure 2.4 Tea and Coffee, live plants and vegetables were the
largest commodities for exports in 2014 accounting 25%, 10% and 5% of exported
goods respectively. Whereas its imports are mainly dominated by Oil and mineral
fuels; and industrial machinery products (see Figure 2.9)
Figure 2.10 Kenya’s top export commodities value in 2014
Source: Atlas Media (n.d)
Figure 2.11 Kenya’s top import goods value in 2014
Source: Atlas Media (n.d)
Tea and Coffee 25%
Live plants & cut flower
10% Vegetables
5%
Oil and mineral fuels 4%
Plastics 3%
Others 53%
Oil & Mineral Fuels 24%
Industrial Machinery
11%
Motor Vehicles & parts
8%
Electrical Machinery
8%
Iron & Steel 5%
Plastics 4%
Others 40%

19
Mozambique
According to African Economic outlook (2016), Mozambique’s GDP growth has slow down to 6.3% in 2015 from a decade average annual growth rate of 7%. Major factors that contributed for the decline of the economy include economic and political uncertainties; and depressed international commodity prices that in turn result a decline in the value of exports. Tertiary activities accounts 54% of GDP followed by secondary and primary sector representing 16% and 29% respectively. In 2015 Oil and mineral fuels; and Aluminum accounted for 60% of export composition12 (see figure 2.11)
Figure 2.12 Mozambique’s top export commodities value in 2015
Source: Global edge, Michigan State University
Figure 2.13 Mozambique’s top import commodities value in 2015
Source: Global edge, Michigan State University
Oil and Mineral Fuels
24%
Aluminum 24%
Chemical Products
7%
Tobacco 4%
Ores 3%
Wood 2%
Others 36%
Oil & Mineral Fuels 19%
Industrial Machinery
13%
Motor Vehicles & Parts 10%
Electrical Machinery
8% Aluminum
7%
Cereals 4%
Others 39%

20
Chapter 3
Literature Review
In the first section, this chapter presents theoretical literature review. It further indicates the empirical literature review of previous studies conducted in the area of ISPM 15 and SPS measures. Lastly, it discusses studies related to economic impact of invasion species.
3.1 Theoretical Review
The effect of NTBs on trade or economic welfare is highly associated with the magnitude and scope of dataset as well as type of regulation under consideration. The effect of NTB has two conceptual approach either as trade-oriented or welfare –oriented. Assessing the impacts based on trade-oriented perspective is limited to trade effect of regulations whereas the welfare-oriented approach has broader perspective on economic and environment welfare (Beghin and Bureau 2001). The implementation of SPS and NTB has cost effect on supply side by hampering the export potential of foreign suppliers. Compliance with SPS measures result cost to foreign suppliers, which could be seen as equivalent to trade tax causing a deadweight loss in the importing country along with transfers from consumers to producers. Since there is no tariff revenue, the welfare loss is possibly higher than tariff equivalent measure. Hence, methods that apply a tariff equivalent technique in measuring NTB are appropriate in measuring trade volume effect rather than welfare implications (Beghin and Bureau 2001:5). On the contrary, the demand side effect is highly associated with information transmission and transparency regarding the standard consequences. However, if the demand enhancing effect over weights the cost effect, the adoption of NTM will affect producer’s competitiveness resulting increment in export price and quantity. Trade effect of different SPS measures varies depending on type of industries under consideration and origin of Exporter Company (Fugazza 2013). As political-economy theories state NTBs are determined not only by industry or country specific factors rather countries tend to impose trade protection in order to protect weak industries. Large industries, which perceived as politically vital face protection as a form of NTBs (Lee and Swagel 1997: 372). It is strongly argued that country specific product and standards could potentially result trade barrier effect while harmonized standards have trade enhancing effect (Moenius 2004). This in turn has further implications that country specific standards decrease import of agricultural products.
21
Difficulties faced by developing countries to integrate in international trade arise from their incompetency in meeting requirements of standards. Furthermore, if exports are compatible to the regulations of the importing country, then the NTBs have insignificant effect on their trade performance. However, if the standard gap between the exporter and importer country is broader then, either the exporter country will adopt the standard of importer country or both will apply internationally accepted harmonized regulations (Ababouch et al. 2005).
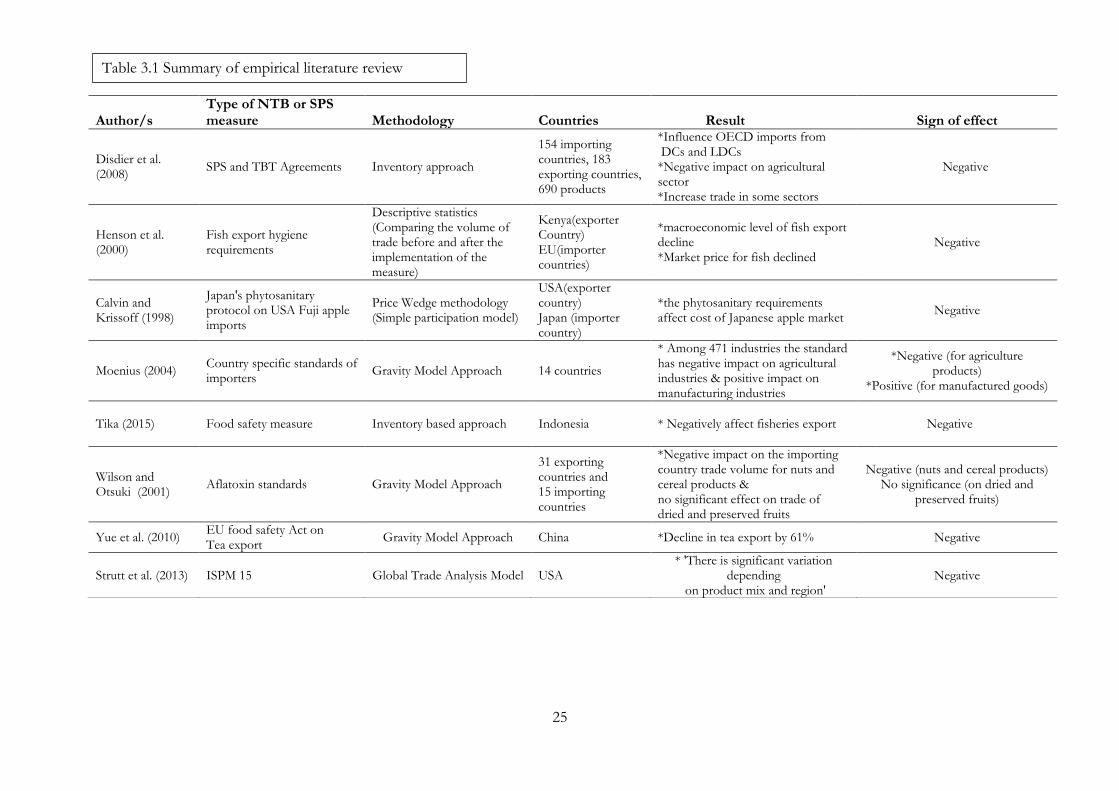
3.2 Empirical Review
Different measures have been used in literatures to examine non-tariff barriers to trade and estimate their impact (Disdier et al. 2008). Some of the difficulties in measuring NTB’s impact on trade arise due to quantification and modeling problem in analysing the trade impact as well as lack of transparency in implementing the standards (Fugazza 2013). The extent of a particular SPS measure effect on trade flow depends on the established regulatory system, risk assessment and protection level requirements. Estimating the impact of SPS measures could be difficult since the standards are product and firm specific as well as under certain circumstances countries may introduce strict or higher level of protection (Ogunkola et al. 2000). As cited on Beghin and Bureau (2001), “measuring the effect of NTB requires a simplification process of a complex effect into one measurable indicator that sufficiently represents and reflects the effect of NTB” (Tika 2015). Assessing the quantitative effect of SPS to trade is not an easy task due to data limitation, in adequate information, lack of transparency and lack of consistency in implementing SPS (Ababouch et al. 2005). Although, SPS agreements by themselves targets to facilitate and enhance trade interaction between developed and developing countries through strengthening transparency and promoting harmonization of standards, the negative impact of SPS regulations tend to emerge as the implementation of SPS is less transparent than tariff or quotas (Jongwanich 2009).
The existing methodologies used to model and quantify non-tariff trade barriers such as sanitary, phytosanitary and technical regulations impact on trade includes the price wedge method, inventory based approaches, survey based approaches, gravity based approaches, risk assessment based cost-benefit measures, stylized microeconomic approaches and quantification using sectoral or multi-market models. Using price wedge method Calvin and Krissoff (1998) conducted analyses on tariff rate equivalents of technical regulations on US apple trade. Similarly, Nimenya (2010) applied the method to investigate the effect of tariff equivalent food safety standards on Kenya, Tanzania, Uganda and Zambia exports of horticultural and fish products to EU countries. He argues food safety standards highly distort imports of fresh peas from Zambia; and green bean and avocado products from Kenya. Although the method is useful in quantifying the effect of NTBs on trade, it has certain limitation such as difficulties in analysing and precisely identifying NTBs effect without the availability of large dataset.

22
On the other hand, inventory based approach combines both qualitative and quantitative perspective to examine the effect of NTB’s as trade barrier. Swann et al. (1996), Moenius (2004), Otsuki et al. (2000), Henson et al. (2001) and Fontagne et al. (2001) applied the method to assess the impact of food safety standards and environmental regulation on trade. Though the method is useful in indicating the effect of NTB’s on specific sector’s and countries, it has methodological limitation in presenting clearly the correlation between the number of measures and their counter effect on trade. While survey based- approach has importance in providing narrow scope of analysis in conducting counterintuitive assessment of trade barriers. Henson et al. (1999) and Henson et al. (2001) applied the method concerning the SPS requirements and capacity of developing countries firms complying with regulations by conducting in-depth interview and surveys. One of the weaknesses concerning the approach is quantification of survey outcome, but the method has its own advantage when there is lack of information from other sources (Beghin and Bureau 2001). Henson and Loader (2001) examine the impact of SPS regulation on trade by applying mainly qualitative approach. They strongly argue SPS regulations play a dominant role in hampering trade performance of developing countries. As a way forward, they recommend actions need to be taken to bridge the gap or shortcomings of developing countries such as role of developed countries in assistance to developing countries in order to encourage and increase their ability to cope. Gravity Model Approach One of the most common approaches used in quantifying the forgone trade value of NTB’s is gravity model approach. Moenius (2004) and Otsuki et al. (2000) used the approach to assess EU standards (voluntary norms) to measure trade effect of European aflatoxin standards on African agricultural exports, respectively. Although the approach has advantage in estimating the share of regulations by taking in to consideration border effect, it has limitations since the prediction of trade value is highly correlated to the assumption of the model and it has weakness in explaining all trade flows accurately. The other drawback of the method is related to its scope as it mainly focuses on the trade impact of NTB’s rather than welfare impact that overlook the importance of the regulations in correcting market failures but have adverse effect on trade. Risk assessment based cost-benefit measures and stylized microeconomic approaches are least used methods in analyzing the effect of NTB’s (Beghin and Bureau 2001). Some of the studies that have applied gravity model will be discussed as follow. The econometric study conducted by Wilson and Otsuki (2004), which analyse the impact of pesticide chlorpyrifos SPS regulation on banana export of 21 developing countries to 12 OECD countries, indicated the significant negative impact of the regulation on the performance of the banana trade. Similarly, the study conducted by Wilson and Otsuki (2001) assesses the effect of aflatoxin standards on cereals, dried and preserved fruits and nuts between 31 exporting countries and 15 importing countries. The result shows adopting the standard for aflatoxin B1 have

23
negative impact on the importing country trade volume for nuts and cereal products while it has no significant effect on trade of dried and preserved fruits. Otsuki et al. (2000) finding also point out similar negative impact result for both cereal and dried fruit and nuts, after analysing the same three products on eight African countries export to EU market. Furthermore, the empirical analyses conducted by Moenius (2004) on the impact of environmental standard on 471 industries over the period of 16 years confirms the adverse effect of the standard on most agricultural products and positive on manufacturing industries. Nevertheless, the scope of the study is limited to 12 OECD member countries. Similarly, Gebrehiwet et al. (2007) findings on South Africa aflatoxin level of food components shows stringent SPS standards applied by developed countries could potentially offset the gain of agricultural trade. The result indicate if the five OECD countries (Germany, Italy, Ireland, Sweden and USA) adopt CODEX recommended level of aflatoxin, South Africa would have obtain an estimated trade value of US$ 69 million revenue for food export between 1995 to 1999. However, since some of the countries applied stringent standard the value is considered as South Africa’s forgone export gain. Likewise, the study result of Yue et al. (2010) argue that the implementation of EU’s new 134 maximum residue levels pesticide regulations of tea export ‘limit market entry opportunities as it will lead to a decrease in exports from developing countries’ (745). This research applied Gravity Model of empirical analysis and the outcome shows the new EU food safety Act has impacted tea export trade flow significantly which resulted a decline in export volume by 61.6%. The study conducted by Jongwanich (2009) examined the effect of food safety standards on developing countries processed food exports by using gravity model based on 79 developing countries over the period 1990-2006. The paper argued that food safety standard regulations of developed countries could potentially hamper developing countries processed food export. This is because; developing countries have limited supply side capacity in comparison to developed countries to conduct latest testing and certification procedures so as to upgrade their export competitiveness. The study further states developing countries shouldn’t consider the task of complying with SPS standards as trade barrier rather as an opportunity to upgrade their supply side capacity and quality standard. The study also recommended that additional financial and technical assistance is needed outside WTO to enhance the capacity of developing countries supply side and help local suppliers to penetrate international market. Fontagne et al. (2005) examined SPS environmental regulation has negative impact on particular agricultural products were as it has positive effect on manufactured products. Manufactured products are not adversely affected, since SPS regulations focuses on hygiene and sanitation of products (Pedroza et al. 2014). This could be seen as a justification for the results of previous studies that argue there is negative relationship between SPS and agricultural product trade. The result shows out of 5,134 products about 516 with trade worth of US$ 665 billion are affected by the environmental standard whereas about 1,022 products are not affected by the
24
regulation. Furthermore the study stated that only 11% of the world imports comply with the required criterions of environment standard and it is also concentrated mainly on manufacturing industries. Strikingly, for some of primary goods such as Brazilian fish and fruit products, NTM have insignificant effect which implies NTM should not be entirely considered as barrier of agricultural products (Fontagne et al. 2005; Pedroza et al. 2014). There are limited number of researches conducted on the area of ISPM 15 and environmental standards. Most of the empirical studies in the field of SPS are restricted to a certain number of products (Fontagne et al. 2005; Beghin and Bureau 2001). Additionally the existing studies on ISPM 15 are biased toward welfare or environmental effect of invasive species and the significance of the standard in tackling the risk of introduction of quarantine pests with less emphasis on trade or economic impact of the standard. A preliminary study by Strutt et al. (2013) shows overall ISPM 15 has small negative impact on economic welfare and trade flow of export but the result is highly sensitive to export product mix and corresponding pallet size as well as regional and sectoral variation. He argues EU and West African countries are most affected by the standard due their application of higher pallet margin for processed foods and agricultural products. The effects on United States would likely to be strong if the standard requirements are extended to local trade.
25
Author/s Type of NTB or SPS measure Methodology Countries Result Sign of effect
Disdier et al. (2008)
SPS and TBT Agreements Inventory approach
154 importing countries, 183 exporting countries, 690 products
*Influence OECD imports from DCs and LDCs *Negative impact on agricultural sector *Increase trade in some sectors
Negative
Henson et al. (2000)
Fish export hygiene requirements
Descriptive statistics (Comparing the volume of trade before and after the implementation of the measure)
Kenya(exporter Country) EU(importer countries)
*macroeconomic level of fish export decline *Market price for fish declined
Negative
Calvin and Krissoff (1998)
Japan's phytosanitary protocol on USA Fuji apple imports
Price Wedge methodology (Simple participation model)
USA(exporter country) Japan (importer country)
*the phytosanitary requirements affect cost of Japanese apple market
Negative
Moenius (2004) Country specific standards of importers
Gravity Model Approach 14 countries
* Among 471 industries the standard has negative impact on agricultural industries & positive impact on manufacturing industries
*Negative (for agriculture products)
*Positive (for manufactured goods)
Tika (2015)
Food safety measure Inventory based approach Indonesia * Negatively affect fisheries export Negative
Wilson and Otsuki (2001)
Aflatoxin standards Gravity Model Approach
31 exporting countries and 15 importing countries
*Negative impact on the importing country trade volume for nuts and cereal products & no significant effect on trade of dried and preserved fruits
Negative (nuts and cereal products) No significance (on dried and
preserved fruits)
Yue et al. (2010) EU food safety Act on Tea export
Gravity Model Approach China *Decline in tea export by 61% Negative
Strutt et al. (2013) ISPM 15 Global Trade Analysis Model USA * 'There is significant variation
depending on product mix and region'
Negative
Table 3.1 Summary of empirical literature review

26
Author/s Type of NTB or SPS measure Methodology Countries Result Sign of effect
Gebrehiwet et al. (2007:14)
Food Export
Gravity Model Approach
5 OECD (Ireland, Italy, Sweden , Germany & USA)-Importer countries South Africa- Exporter
South Africa's forgone trade value due to elasticity of aflatoxin recommended by CODEX is estimated to US$ 69 million per year during the period 1995-1999
Negative
Henson et al. (2000)
Fish export
Comparative Descriptive statistics
Kenya export to EU market
Negative significant impact on fish processors and local fishing community
Negative
Nimenya (2010)
Horticultural and Fish export
Price wedge method
Kenya, Tanzania, Uganda and Zambia export to EU market
Decrease exports of fresh peas from Zambia and; green beans and avocados
from Kenya to EU market Negative
Fontagne et al. (2005)
Environmental regulation on 161 product groups
Gravity Model Approach
LDC, DC and OECD countries
Negative impact on trade of fresh and processed food whereas insignificant or even positive impact on manufactured products
*Negative (for agriculture industries)
*Positive or insignificant (for manufactured industries)
Jongwanich (2009)
Food safety standards
Gravity Model Approach
79 developing countries
* Decrease food export of developing countries
Negative
Otsuki et al. (2001)
Aflatoxin standard(food standard) focused on groundnuts
Gravity Model Approach
14 member states of EU, Switzerland and 9 African countries
* 11% reduction of export on edible groundnuts whereas it has insignificant trade effect in groundnuts for oilseed.
Negative
Otsuki et al. (2000)
Aflatoxin B1 standard
Gravity Model Approach
15 European countries and 9 African countries
*Negative impact on export of cereals, dried fruits and nuts
Negative
Wilson and Otsuke (2004)
chlorpyrifos pesticide standards
Gravity Model Approach
21 developing countries export to major
importing OECD countries
*A 1% tighter restrictions of pesticide result 1.63% decline in import of Banana
Negative
Table 3.1 Summary of empirical literature review (continued)
rerereviewreccco(continued)rereview

27
3.3 Economic Impact of Invasion Species
The cost associated with invasion insects regarded as ‘externality’ or ‘market failure’ effect of international trade, since the price covers only the production and transport expense of the exporter (Perrings et al. 2005). It neglects the environmental damage that could potentially arise because of invasive insects as well as the eradication or control cost. Ways on how to deal and internalize the externalities is an ongoing discussion in international trade agreement arena (Perrings et al. 2005). Due to uncertainty and difficulties in measuring death or loss of forest quality, it is problematic to estimate the future economic impact of pests on global scale (Leal et al. 2010:1). In USA around 400 out of 958 list of endangered species threat arise from competition of exotic invasive species (Wilcove et al. 1998).
According to Nowak et al. (2001), the spread of this pest would result a loss of 35 % of canopy cover ($ 669 billion worth value loss) and estimated potential loss of $41 billion of forest product, nursery and tourist industries. The annual environmental damage cost due to the establishment of invasion species in USA is estimated to be US $120 billion (Pimentel et al. 2005). Similarly, the estimated cost of damage for New Zealand over the coming four decades is predicted to reach $20 billion (NZ dollars) (Turner et al. 2004). For instance following the European Union ban to import untreated wood from Canada and USA in 1993, the annual wood export of Canada has dropped by 80% and for that of US, it resulted about US $69 million worth loss of export the next five years (Lealet al. 2010). Furthermore as stated by Colautti et al. (2006) due to forest pests, roughly it is predicted that Canada could potentially lose CDN $10 billion export earnings. Similarly, as result of invasive forest pathogens and pests, USA is expected to lose $4.2 billion per year reduced timber production and expanded cost of control and management (Pimental et al. 2005).
The three main economic impacts of invasive species are: 1) reduction in the value and volume of forest products due to tree death or reduction in timber quality (Krcmar- Nozic et al. 2000); 2) increment of environmental welfare cost and monetary expense to eradicate and control of foreign insects (Coluatti et al. 2006): and lastly it affects trade flow between countries depending on the rate of pest risk outbreak, the relative importance of trade commodities as comparison to pest introduction and extent of pest damage in the ecosystem (FAO 2002).
28
Chapter 4
Methodology and Data Descriptive
This chapter presents data sources, methodology and descriptive statistics of the paper. It also presents explanation about model specification, justification of chosen variables and hypothesis of the explanatory variables under methodology section.
4.1 Data Sources
The data used in this paper is secondary data from different sources. The data sources that has been used to extract dependent and independent variables are illustrated in Appendix 1.The data set tracks bilateral trade flow between each African country and all trading partners for all commodities the standard comply with. As it can be seen on Appendix 13, the product groups are classified at the 2-digit level of HS. The time period of the data for each country varies; for Botswana from 2000 to 2014, Cameroon from 1995 to 2014, Ethiopia from 1995 to 2014 with a one year gap in 1996, Kenya from 1992 to 2013 and Mozambique from 1994 to 2014. The inconsistency in time period among countries arises from the lack of availability of data for the missing years. To answer the aforementioned research questions, gravity model approach will be used in the analysis.
4.2 Methodology
4.2.1 The Gravity Model
One of the commonly used approaches in quantifying technical regulations on aflatoxins, antibiotic use, pest infestation and pesticide residues is gravity model (Beghin and Bureau 2001). It is potentially useful in estimating the forgone trade value that cannot be interpreted by tariffs (Otsuki et al. 2001). Gravity model is used to explain trade flow between countries relying on the Newton’s “Law of Universal Gravitation” formula. In econometric analysis the formula estimate the trade flow Vij from country origin i to destination j considering the relevant economic size of two countries as well as distance between countries (Beghin and Bureau 2001). Otsuki et al. (2000) supports the argument that the method is considered as most useful since it takes in to account of bilateral trade flows in examining different SPS measures influence on trade flows. One of the advantages of using gravity model arises from its ability to examine the correlation between policy variables and bilateral trade flows (Otsuki et al. 2001). In addition, it is consistent in estimating the effect of the standard on trade value. The direction and magnitude of SPS measure effect is highly correlated with the accuracy of model specification and products/commodities under consideration (Fontagné et al. 2005).
29
In general, it is difficult to quantify the impact of SPS measures and the interpretation of the data should be conducted with care (Henson et al. 2000). Given its validity, common application, limited data requirement and its advantage in estimating the effect of SPS measures on trade value, gravity model will be used for the analysis.
Model Specification
ln(Vij)tk(Import/Export) = b0 + b1ln(GDPij)t +b2RISPMi +b3Govefi
+b4Plsti + b5Distij + b6Colangij + b7Colhisij + ij
where b – coefficients to be estimated; Vij denotes bilateral trade value in product k from African country i to trading partner country j; lnGDPij represents log multiplied GDP of reporter and partner country; RISPMi is the year ISPM has been adopted or implemented by the reporter African country (1 if the five countries implemented, 0 otherwise) ; Distij is geographical distance between country i and j; Govefi is government effectiveness of the reporter country; Plsti is political stability and absence of violence; Colangij is common official primary language (1 if the trading partners have common language, 0 otherwise); Colhisij is ever in colonial relationship
(1 if the trading partners have colonial tie, 0 otherwise); ij stands for error term.
Trading partner countries ISPM 15 implementation year variable is omitted in the analysis given the fact that the major export hub of these African countries is EU countries and they have adopted the standard at the same year in 2005. Additionally, the inclusion of this variable along with reporter countries implementation year brings inconsistency in the interpretation of results. Likewise, the variables for government effectiveness and political stability are captured for the five African countries only.
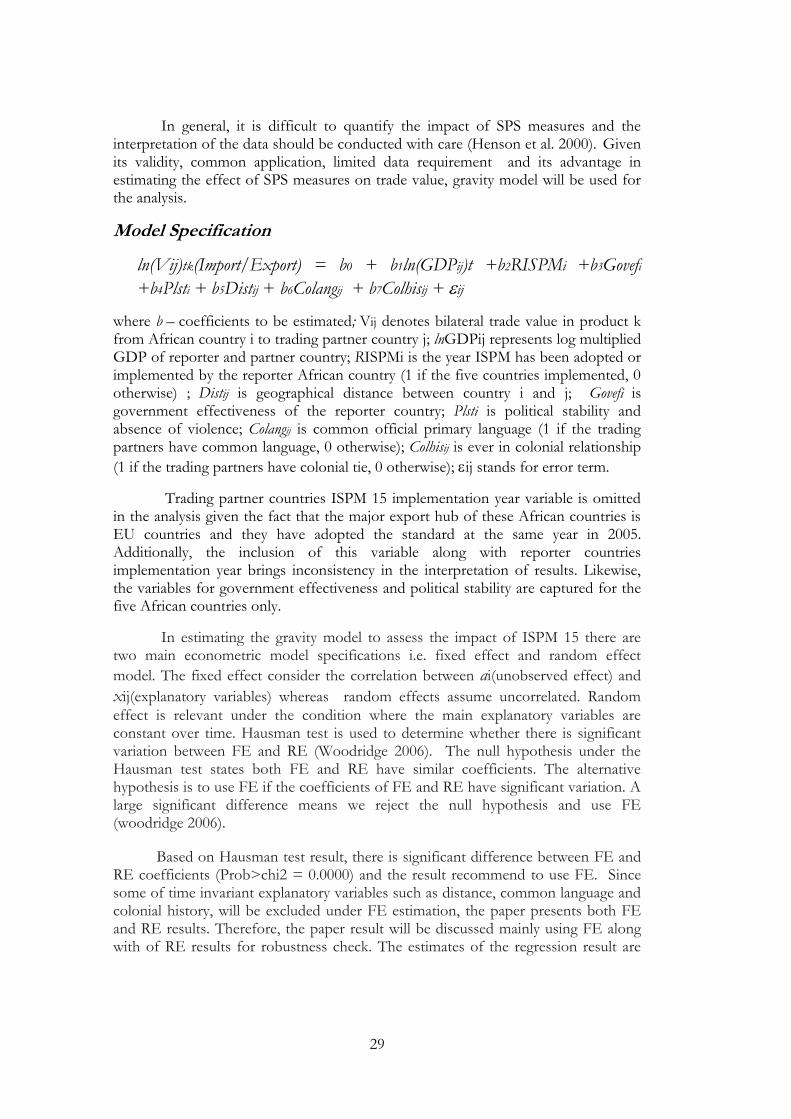
In estimating the gravity model to assess the impact of ISPM 15 there are two main econometric model specifications i.e. fixed effect and random effect
model. The fixed effect consider the correlation between ai(unobserved effect) and
xij(explanatory variables) whereas random effects assume uncorrelated. Random
effect is relevant under the condition where the main explanatory variables are constant over time. Hausman test is used to determine whether there is significant variation between FE and RE (Woodridge 2006). The null hypothesis under the Hausman test states both FE and RE have similar coefficients. The alternative hypothesis is to use FE if the coefficients of FE and RE have significant variation. A large significant difference means we reject the null hypothesis and use FE (woodridge 2006).
Based on Hausman test result, there is significant difference between FE and RE coefficients (Prob>chi2 = 0.0000) and the result recommend to use FE. Since some of time invariant explanatory variables such as distance, common language and colonial history, will be excluded under FE estimation, the paper presents both FE and RE results. Therefore, the paper result will be discussed mainly using FE along with of RE results for robustness check. The estimates of the regression result are
30
explicitly controlled for trade flow, partner country, product groups and reporter country fixed effects.
4.2.2 Justification of Chosen Variables
The empirical model considers a number of explanatory variables which are relevant in determining the impact of ISPM 15 on bilateral trade flow between trading partner countries. The chosen dependent variable for the model is bilateral trade value of export and import data of the reporter country i to trading partner country j. The term GDP in this study represents GDP in constant 2011 US$. GDP of trading partner countries determine trade flow between them signifying the production and consumption capacity of the two countries (Gebrehiwet et al. 2007). In line with this, the model consider multiplied natural log of GDP of the reporter and partner country. This is because as supplier of the commodity, the exporter country determines the production capacity. Likewise, the importer country GDP signifies the demand capacity of the economy. Economic factors, such as global recession in 2007/8 and global trade slow down, that would likely affect the trade flow and performance of both exporter and importer countries, tried to be captured using multiplied GDP variable as it is assumed to affect both the production and consumption (supply and demand) capacity of trading partners.
Distance variable included to explain the transaction cost associated with trade flow between the reporter and partner countries. Higher transport cost result lower trade flow between countries (Fontagne et al. 2005). Countries at close by distance are predictable to trade more due to lower transaction cost (Otsuki et al. 2001). In addition, distance could also represent proxy for quality control of perishable goods and their risk of being infected by the pests from WPM.
Government effectiveness of reporter country variable is included to capture the institutional and governance quality. According to De Groot et al. (2004) finding institutional quality significantly affects the bilateral trade flow and it is also considered as informal barriers to trade. This is because the effectiveness of institution and governance is correlated with informal norms and interpersonal trust of domestic parties in securing property right and norms in doing business. The other explanatory variable important to determine bilateral trade flow is political stability and absence of violence of reporter country. It is reasonable to expect that terrorism and high scale political instability will negatively affect international trade. ‘Higher risks, additional security measures and direct destruction raise the transactions costs and should thereby lower the volume of international trade’ (Nitsch and Schumacher 2004:432). On the other hand, similar language and cultural integration have important implication on trade flow since they strengthen trade interactions by reducing transaction cost and enhancing smooth business relation. Likewise, colonial tie affects trade patterns as it create a strong export dependency on countries that had colonial history (Fontagne et al. 2005). Table 4.1 presents summary of previous studies conducted on SPS measures using gravity model and the chosen variables under consideration.
31
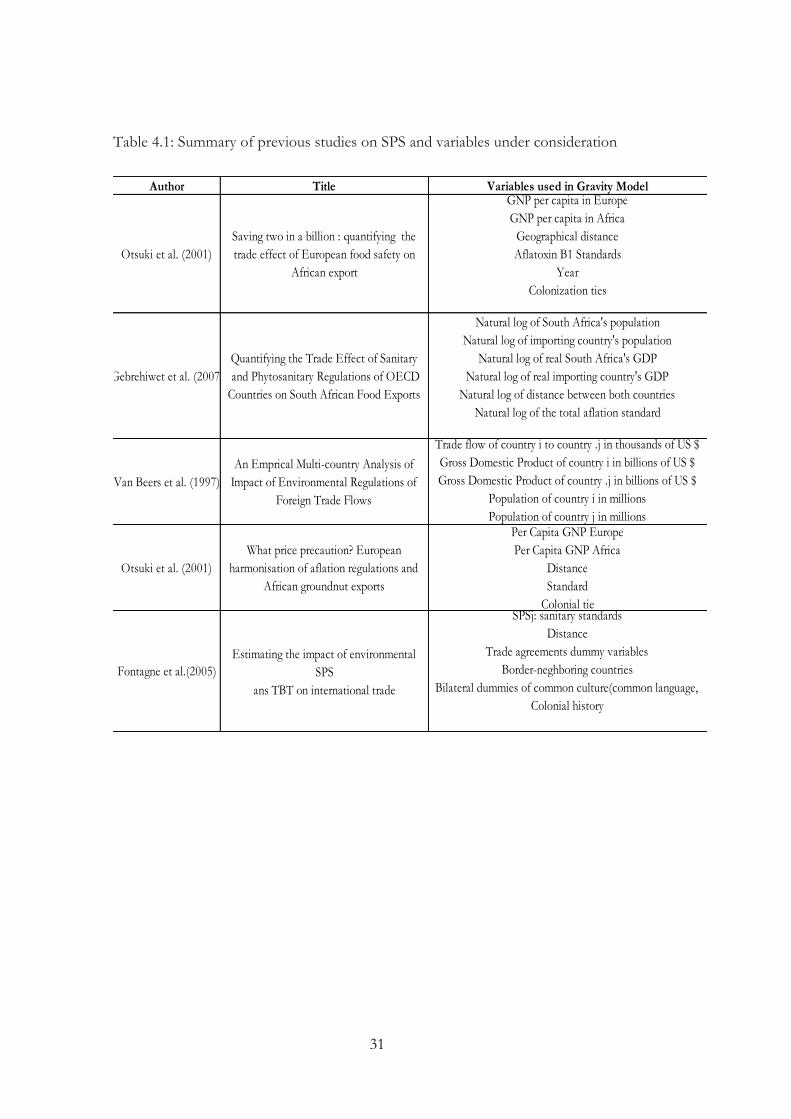
Table 4.1: Summary of previous studies on SPS and variables under consideration
Title
Estimating the impact of environmental
SPS
ans TBT on international trade
GDP per capita of exporting country
SPSj: sanitary standards
Distance
Trade agreements dummy variables
Border-neghboring countries
Bilateral dummies of common culture(common language,
Colonial history
Fontagne et al.(2005)
Gebrehiwet et al. (2007)
Quantifying the Trade Effect of Sanitary
and Phytosanitary Regulations of OECD
Countries on South African Food Exports
Natural log of South Africa's population
Natural log of importing country's population
Natural log of real South Africa's GDP
Natural log of real importing country's GDP
Natural log of distance between both countries
Natural log of the total aflation standard
Van Beers et al. (1997)
An Emprical Multi-country Analysis of
Impact of Environmental Regulations of
Foreign Trade Flows
Trade flow of country i to country .j in thousands of US $
Gross Domestic Product of country i in billions of US $
Gross Domestic Product of country .j in billions of US $
Population of country i in millions
Population of country j in millions
Otsuki et al. (2001)
What price precaution? European
harmonisation of aflation regulations and
African groundnut exports
Per Capita GNP Europe
Per Capita GNP Africa
Distance
Standard
Colonial tie
Author Variables used in Gravity Model
Otsuki et al. (2001)
Saving two in a billion : quantifying the
trade effect of European food safety on
African export
GNP per capita in Europe
GNP per capita in Africa
Geographical distance
Aflatoxin B1 Standards
Year
Colonization ties

32
4.2.3 Hypothesis
The alternative hypothesis for the chosen explanatory variable states, there is significant effect of ln(GDPij)t, RISPMi, Govefi, Plsti, ln(Distij), Colangij and Colhisij. The expected sign of the variables are
GDPij is expected to have positive sign (b1>0). It implies the greater the GDP of
reporter and partner country the greater the bilateral trade value.
RISPMi is expected to have positive sign (b2>0). It infers the implementation of
ISPM 15 by reporter country will be expected to increase bilateral trade value.
Govefi is expected to have positive sign (b3>0). The higher government effectiveness
rate of the reporter country the higher bilateral trade value
Plsti is expected to have positive sign (b4>0). The higher Political Stability and
absence of violence rate of the reporter country the higher bilateral trade value.
Distij is expected to have negative sign (b5<0). The higher the geographical distance
between trading partner countries the lower bilateral trade value.
Colangij is expected to have positive sign (b6>0). Reporter countries are expected to
have higher trade flow with countries that have the common language.
Colhisij is expected to have positive sign (b7>0). Reporter countries are expected to
have higher trade flow with countries that have the colonial link.
4.3 Descriptive Statistics
The descriptive statistics presents the mean, standard deviation, number of observation, minimum and maximum values for bilateral trade value, reporter country GDP, trading partner countries GDP, governance effectiveness and; political stability and absence of terrorism variables. Table 4.2 shows summary of descriptive statistics for Botswana before and after the adoption of ISPM 15 in 2006. In general, the mean bilateral trade value has shown increment after 2009 from 2,967 million of dollars to 4,042 million of dollars. Moreover, the mean for partner countries GDP has increased from 1.08 trillion to 1.2 trillion dollar.
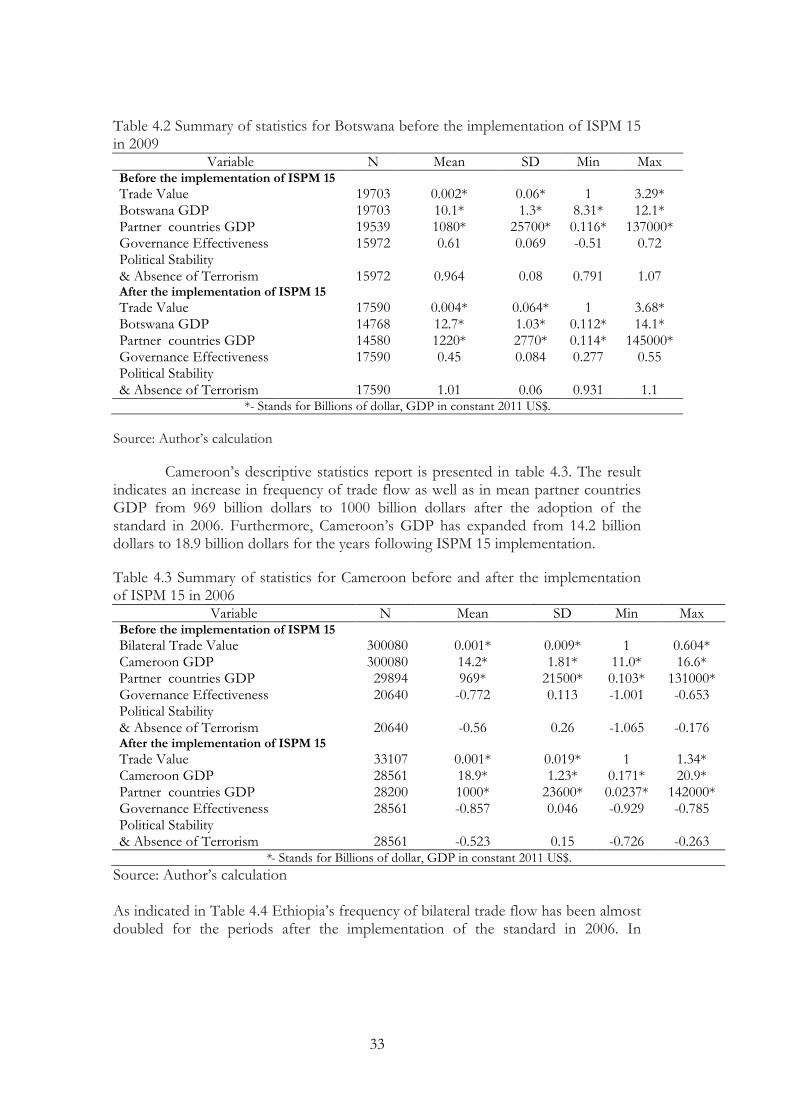
33
Table 4.2 Summary of statistics for Botswana before the implementation of ISPM 15 in 2009
Variable N Mean SD Min Max Before the implementation of ISPM 15
Trade Value 19703 0.002* 0.06* 1 3.29* Botswana GDP 19703 10.1* 1.3* 8.31* 12.1* Partner countries GDP 19539 1080* 25700* 0.116* 137000* Governance Effectiveness 15972 0.61 0.069 -0.51 0.72 Political Stability & Absence of Terrorism 15972 0.964
0.08
0.791
1.07
After the implementation of ISPM 15
Trade Value 17590 0.004* 0.064* 1 3.68* Botswana GDP 14768 12.7* 1.03* 0.112* 14.1* Partner countries GDP 14580 1220* 2770* 0.114* 145000* Governance Effectiveness 17590 0.45 0.084 0.277 0.55 Political Stability & Absence of Terrorism 17590 1.01
0.06
0.931
1.1
*- Stands for Billions of dollar, GDP in constant 2011 US$.
Source: Author’s calculation
Cameroon’s descriptive statistics report is presented in table 4.3. The result indicates an increase in frequency of trade flow as well as in mean partner countries GDP from 969 billion dollars to 1000 billion dollars after the adoption of the standard in 2006. Furthermore, Cameroon’s GDP has expanded from 14.2 billion dollars to 18.9 billion dollars for the years following ISPM 15 implementation.
Table 4.3 Summary of statistics for Cameroon before and after the implementation of ISPM 15 in 2006
Variable N Mean SD Min Max Before the implementation of ISPM 15
Bilateral Trade Value 300080 0.001* 0.009* 1 0.604* Cameroon GDP 300080 14.2* 1.81* 11.0* 16.6* Partner countries GDP 29894 969* 21500* 0.103* 131000* Governance Effectiveness 20640 -0.772 0.113 -1.001 -0.653 Political Stability & Absence of Terrorism 20640 -0.56
0.26
-1.065
-0.176
After the implementation of ISPM 15
Trade Value 33107 0.001* 0.019* 1 1.34* Cameroon GDP 28561 18.9* 1.23* 0.171* 20.9* Partner countries GDP 28200 1000* 23600* 0.0237* 142000* Governance Effectiveness 28561 -0.857 0.046 -0.929 -0.785 Political Stability & Absence of Terrorism 28561 -0.523
0.15
-0.726
-0.263
*- Stands for Billions of dollar, GDP in constant 2011 US$.
Source: Author’s calculation As indicated in Table 4.4 Ethiopia’s frequency of bilateral trade flow has been almost doubled for the periods after the implementation of the standard in 2006. In
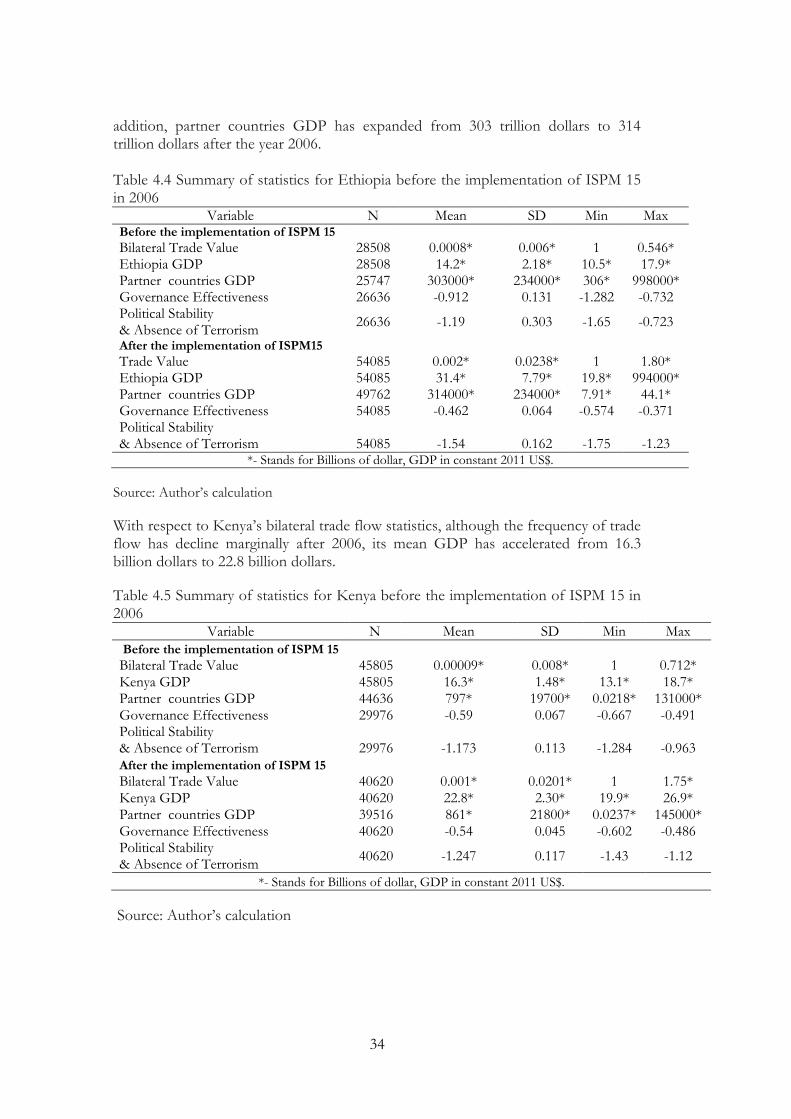
34
addition, partner countries GDP has expanded from 303 trillion dollars to 314 trillion dollars after the year 2006. Table 4.4 Summary of statistics for Ethiopia before the implementation of ISPM 15 in 2006
Variable N Mean SD Min Max Before the implementation of ISPM 15
Bilateral Trade Value 28508 0.0008* 0.006* 1 0.546* Ethiopia GDP 28508 14.2* 2.18* 10.5* 17.9* Partner countries GDP 25747 303000* 234000* 306* 998000* Governance Effectiveness 26636 -0.912 0.131 -1.282 -0.732 Political Stability & Absence of Terrorism
26636 -1.19 0.303 -1.65 -0.723
After the implementation of ISPM15
Trade Value 54085 0.002* 0.0238* 1 1.80* Ethiopia GDP 54085 31.4* 7.79* 19.8* 994000* Partner countries GDP 49762 314000* 234000* 7.91* 44.1* Governance Effectiveness 54085 -0.462 0.064 -0.574 -0.371 Political Stability & Absence of Terrorism 54085 -1.54
0.162
-1.75
-1.23
*- Stands for Billions of dollar, GDP in constant 2011 US$.
Source: Author’s calculation
With respect to Kenya’s bilateral trade flow statistics, although the frequency of trade flow has decline marginally after 2006, its mean GDP has accelerated from 16.3 billion dollars to 22.8 billion dollars.
Table 4.5 Summary of statistics for Kenya before the implementation of ISPM 15 in 2006
Variable N Mean SD Min Max
Before the implementation of ISPM 15
Bilateral Trade Value 45805 0.00009* 0.008* 1 0.712* Kenya GDP 45805 16.3* 1.48* 13.1* 18.7* Partner countries GDP 44636 797* 19700* 0.0218* 131000*
Governance Effectiveness 29976 -0.59 0.067 -0.667 -0.491 Political Stability & Absence of Terrorism 29976 -1.173
0.113
-1.284
-0.963
After the implementation of ISPM 15
Bilateral Trade Value 40620 0.001* 0.0201* 1 1.75* Kenya GDP 40620 22.8* 2.30* 19.9* 26.9* Partner countries GDP 39516 861* 21800* 0.0237* 145000* Governance Effectiveness 40620 -0.54 0.045 -0.602 -0.486 Political Stability & Absence of Terrorism
40620 -1.247 0.117 -1.43 -1.12
*- Stands for Billions of dollar, GDP in constant 2011 US$.
Source: Author’s calculation

35
As indicated on table 4.6, given the fact that Mozambique’s implementation of the standard lately in 2009, its trade flow frequency has declined after the standard adoption in comparison to previous periods. However, its mean bilateral trade value has accelerated from 782,322 dollars to 2.4 million dollars for the period after 2009.
Table 4.6 Summary of statistics for Mozambique before the implementation of ISPM 15 in 2009
Variable N Mean SD Min Max
Before the implementation of ISPM 15
Bilateral Trade Value 28259 0.0007* 0.0129* 1 1.45*
Mozambique GDP 28259 59.1* 1.49* 2.93* 8.02*
Partner countries GDP 27831 10200* 22600* 0.0978* 137000*
Governance Effectiveness 21048 -0.466 0.086 -0.559 -0.144
Political Stability & Absence of Terrorism
21048 0.16 0.196 -0.154 0.492
After the implementation of ISPM 15
Bilateral Trade Value 20659 0.002* 0.0276* 1 1.35*
Mozambique GDP 16642 9.91* 0.99* 8.52* 11.3*
Partner countries GDP 16049 10700* 24400* 0.0238* 145000*
Governance Effectiveness 20659 -0.591 0.055 -0.648 -0.495
Political Stability & Absence of Terrorism
20659 0.251 0.272 -0.271 0.589
*- Stands for Billions of dollar, GDP in constant 2011 US$.
Source: Author’s calculation
Table 4.7 presents top export trading partner countries percentage share of export value for the years before and after the implementation of ISPM 15 standard in 2000 and 2013, respectively. In general, the share of intra African countries trade has increased after the implementation of the standard. Moreover, few EU countries dominate top export destination market share.

36
Table 4.7 Top export trading partner countries export percent share before and after the implementation of ISPM 15
Source: Author’s calculation from UN comtrade database
Year
Exporter country
Top export
trading partner
countries
Percentage
of export value
Top export
trading partner
countries
Percentage of
export value
United Kingdom 70% United Kingdom 49%
Switzerland 13% Belgium 13%
South Africa 7% South Africa 11%
Italy 29% Portugal 25%
France 13% Spain 13%
Spain 8% Netherlands 11%
Germany 20% Somalia 16%
Japan 12% Netherlands 12%
Djibouti 11% Saudi Arabia 10%
United Kingdom 16% Uganda 11%
Uganda 14% United Kingdom 8%
Pakistan 13%United Rep. of
Tanzania8%
Zimbabwe 18% Netherlands 29%
South Africa 16% South Africa 22%
Portugal 12% India 17%
Mozambique
2000 2013
Botswana
Cameroon
Ethiopia
Kenya
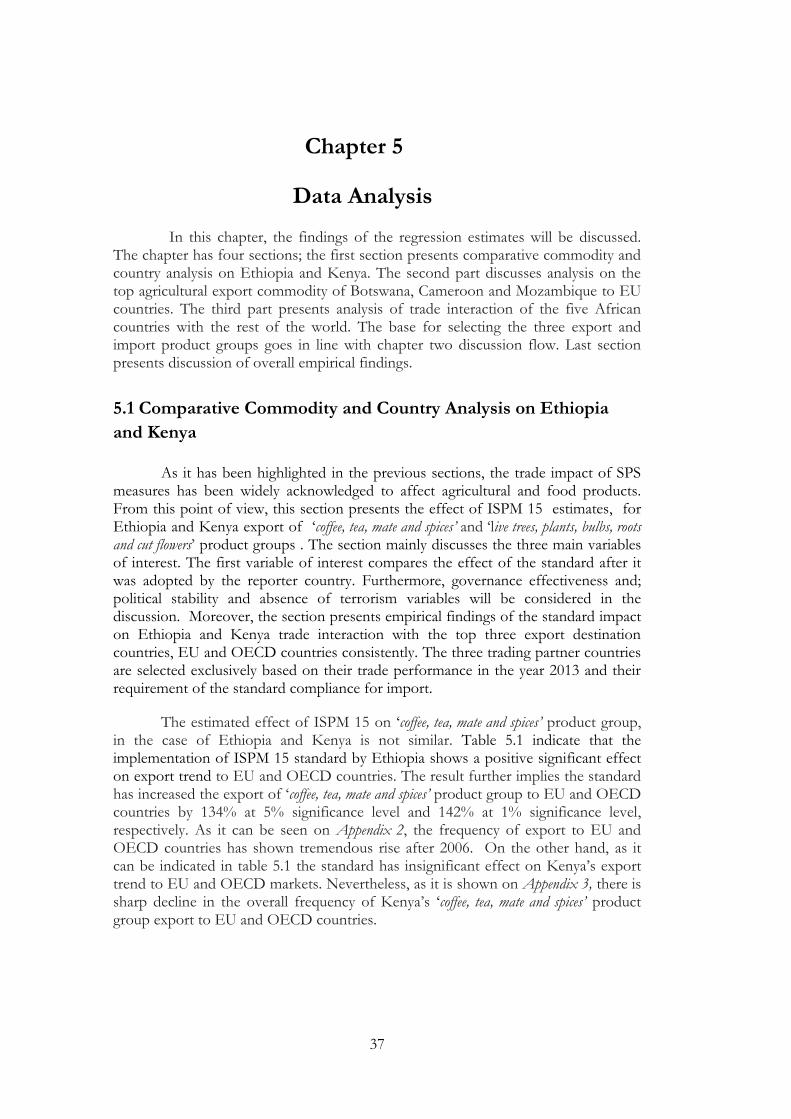
37
Chapter 5
Data Analysis
In this chapter, the findings of the regression estimates will be discussed. The chapter has four sections; the first section presents comparative commodity and country analysis on Ethiopia and Kenya. The second part discusses analysis on the top agricultural export commodity of Botswana, Cameroon and Mozambique to EU countries. The third part presents analysis of trade interaction of the five African countries with the rest of the world. The base for selecting the three export and import product groups goes in line with chapter two discussion flow. Last section presents discussion of overall empirical findings.
5.1 Comparative Commodity and Country Analysis on Ethiopia
and Kenya
As it has been highlighted in the previous sections, the trade impact of SPS measures has been widely acknowledged to affect agricultural and food products. From this point of view, this section presents the effect of ISPM 15 estimates, for Ethiopia and Kenya export of ‘coffee, tea, mate and spices’ and ‘live trees, plants, bulbs, roots and cut flowers’ product groups . The section mainly discusses the three main variables of interest. The first variable of interest compares the effect of the standard after it was adopted by the reporter country. Furthermore, governance effectiveness and; political stability and absence of terrorism variables will be considered in the discussion. Moreover, the section presents empirical findings of the standard impact on Ethiopia and Kenya trade interaction with the top three export destination countries, EU and OECD countries consistently. The three trading partner countries are selected exclusively based on their trade performance in the year 2013 and their requirement of the standard compliance for import.
The estimated effect of ISPM 15 on ‘coffee, tea, mate and spices’ product group, in the case of Ethiopia and Kenya is not similar. Table 5.1 indicate that the implementation of ISPM 15 standard by Ethiopia shows a positive significant effect on export trend to EU and OECD countries. The result further implies the standard has increased the export of ‘coffee, tea, mate and spices’ product group to EU and OECD countries by 134% at 5% significance level and 142% at 1% significance level, respectively. As it can be seen on Appendix 2, the frequency of export to EU and OECD countries has shown tremendous rise after 2006. On the other hand, as it can be indicated in table 5.1 the standard has insignificant effect on Kenya’s export trend to EU and OECD markets. Nevertheless, as it is shown on Appendix 3, there is sharp decline in the overall frequency of Kenya’s ‘coffee, tea, mate and spices’ product group export to EU and OECD countries.

38
While looking at the estimated coefficient of governance effectiveness variable, it has statistically significant correlation with Ethiopia’s trade flow performance. This finding goes in line with other literatures which claim Ethiopia’s economic diplomacy effort over the past successive years; enhanced efficient trade environment through facilitating information access and reducing or avoiding trade barriers (van Bergeijk, and Moons 2010). Thus, apart from quality and price competitiveness of two countries, their governance effectiveness and economic diplomacy effort play dominant role in influencing trade interaction with EU and OECD.
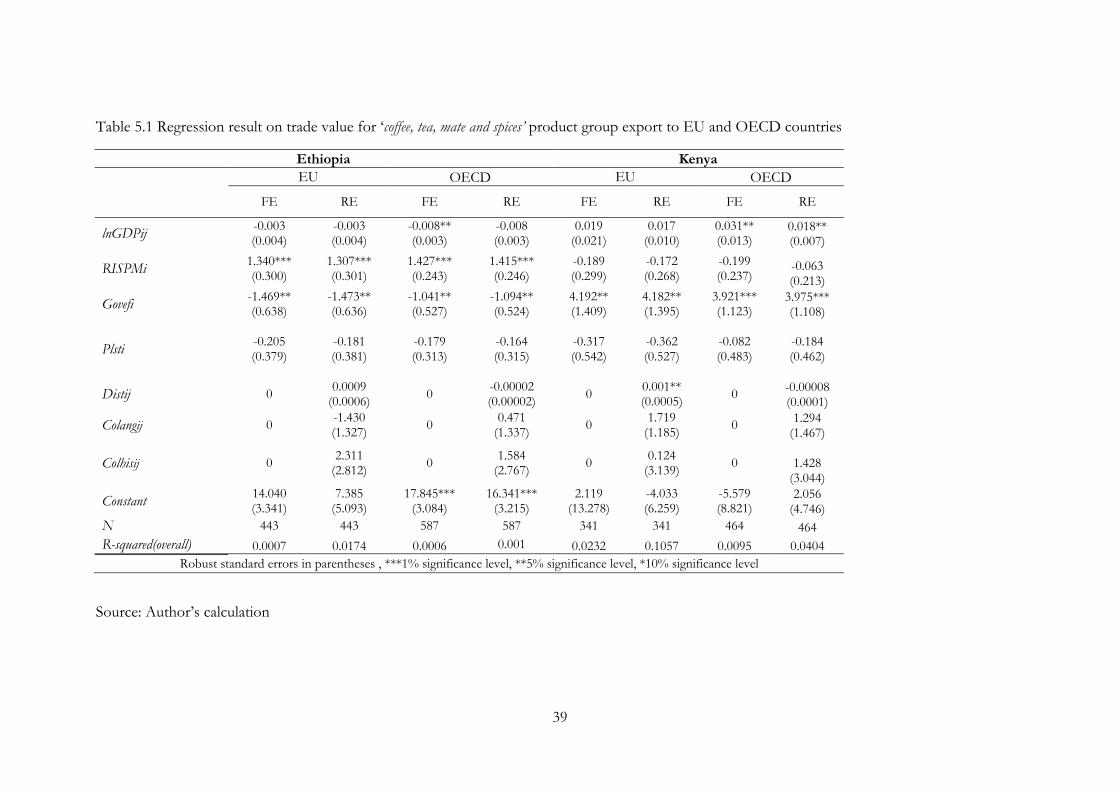
39
Table 5.1 Regression result on trade value for ‘coffee, tea, mate and spices’ product group export to EU and OECD countries
Ethiopia Kenya
EU OECD EU OECD
FE RE FE RE FE RE FE RE
lnGDPij -0.003 (0.004)
-0.003 (0.004)
-0.008** (0.003)
-0.008 (0.003)
0.019 (0.021)
0.017 (0.010)
0.031** (0.013)
0.018** (0.007)
RISPMi 1.340*** (0.300)
1.307*** (0.301)
1.427*** (0.243)
1.415*** (0.246)
-0.189 (0.299)
-0.172 (0.268)
-0.199 (0.237)
-0.063 (0.213)
Govefi -1.469** (0.638)
-1.473** (0.636)
-1.041** (0.527)
-1.094** (0.524)
4.192** (1.409)
4.182** (1.395)
3.921*** (1.123)
3.975*** (1.108)
Plsti -0.205 (0.379)
-0.181 (0.381)
-0.179 (0.313)
-0.164 (0.315)
-0.317 (0.542)
-0.362 (0.527)
-0.082 (0.483)
-0.184 (0.462)
Distij 0 0.0009
(0.0006) 0
-0.00002 (0.00002)
0 0.001** (0.0005)
0 -0.00008 (0.0001)
Colangij 0 -1.430 (1.327)
0 0.471
(1.337) 0
1.719 (1.185)
0 1.294
(1.467)
Colhisij 0 2.311
(2.812) 0
1.584 (2.767)
0 0.124
(3.139) 0 1.428
(3.044)
Constant 14.040 (3.341)
7.385 (5.093)
17.845*** (3.084)
16.341*** (3.215)
2.119 (13.278)
-4.033 (6.259)
-5.579 (8.821)
2.056 (4.746)
N 443 443 587 587 341 341 464 464
R-squared(overall) 0.0007 0.0174 0.0006 0.001 0.0232 0.1057 0.0095 0.0404
Robust standard errors in parentheses , ***1% significance level, **5% significance level, *10% significance level
Source: Author’s calculation

40
Table 5.2 presents that the bilateral trade value of commodity group ‘live trees, plants, bulbs, roots and cut flowers’ is not influenced by ISPM 15 standard. Moreover, as it can be seen in Appendix 4 and 6, Ethiopia experienced a tremendous rise in the frequency of export to EU and OECD countries. In the case of Kenya, as indicated in Appendix 5, though there is a rise in the mean export value for ‘live trees, plants, bulbs, roots and cut flowers’ product group after the implementation of the standard, the occurrence of export flow to EU and OECD countries has declined.
Table 5.3 illustrates the regression result of bilateral trade value effect for Ethiopia’s three top trading partner countries, Netherlands, Saudi Arabia and China as well as EU and OECD countries. The result suggests that the bilateral trade value to EU and OECD countries has positively affected after the implementation of the standard. As indicated in Appendix 7, even though the mean trade value of bilateral trade value did not show substantial increase, the number of trade occurrence tripled after the adoption of the standard.
Table 5.4 presents regression results on trade value effect for Kenya’s major export destination countries, UK, Netherlands and USA, along with EU and OECD countries. The empirical result strongly supports that the possible impact of ISPM 15 on Kenya’s export trend to EU and OECD countries is negative. Additionally, as it can be seen in Appendix 8, the frequency of export flow has dropped in the years following the adoption of the standard.
In line with previous section, the result confirms political stability and absence of terrorism is a key determinant factor that influence export to EU and OECD countries. In addition to economic and trade interest, both EU and US diplomacy relation with Ethiopia is highly associated to its contribution in the biggest peace keeping mission in Horn Africa by combating terrorists (Al-Shabaab) as well as its military strength (Tiwari 2015: 130). Hence, the discussion thus far highlighted the differential impact of the standard on two countries has arisen from their political stability and government effectiveness status.
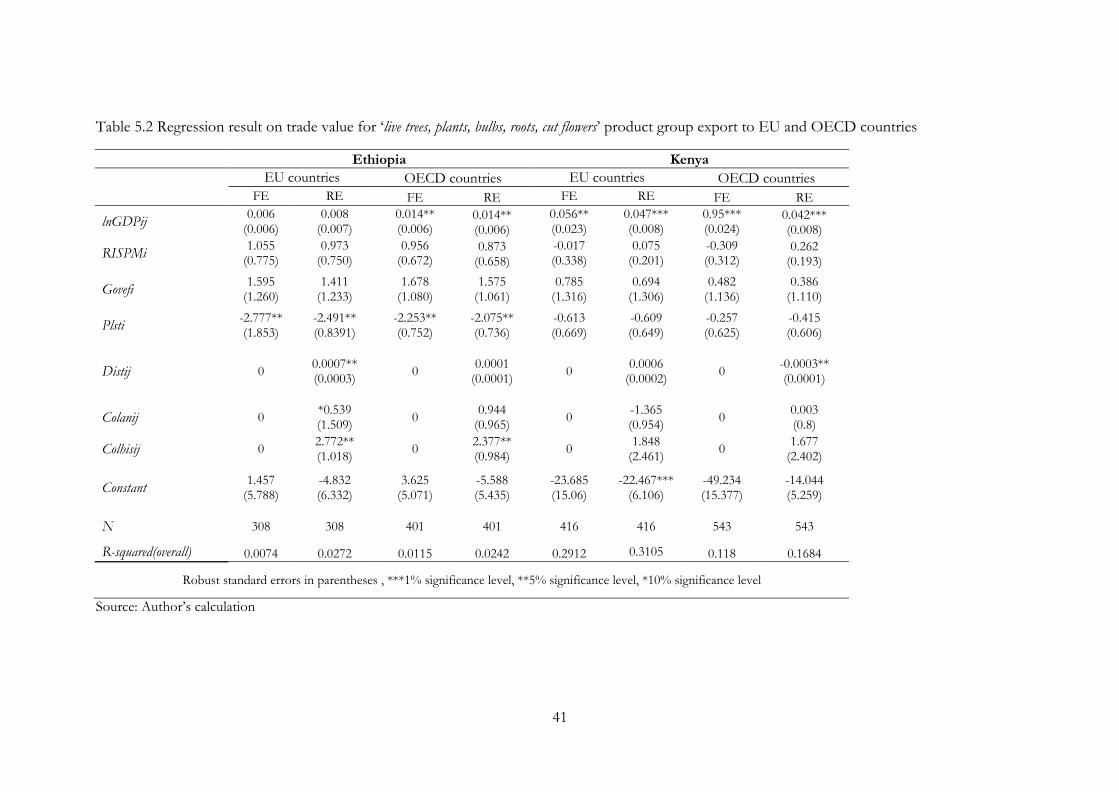
41
Table 5.2 Regression result on trade value for ‘live trees, plants, bulbs, roots, cut flowers’ product group export to EU and OECD countries
Ethiopia Kenya
EU countries OECD countries EU countries OECD countries
FE RE FE RE FE RE FE RE
lnGDPij 0.006
(0.006) 0.008
(0.007) 0.014** (0.006)
0.014** (0.006)
0.056** (0.023)
0.047*** (0.008)
0.95*** (0.024)
0.042*** (0.008)
RISPMi 1.055
(0.775) 0.973
(0.750) 0.956
(0.672) 0.873
(0.658)
-0.017 (0.338)
0.075 (0.201)
-0.309 (0.312)
0.262 (0.193)
Govefi 1.595
(1.260) 1.411
(1.233) 1.678
(1.080) 1.575
(1.061) 0.785
(1.316) 0.694
(1.306) 0.482
(1.136) 0.386
(1.110)
Plsti -2.777** (1.853)
-2.491** (0.8391)
-2.253** (0.752)
-2.075** (0.736)
-0.613 (0.669)
-0.609 (0.649)
-0.257 (0.625)
-0.415 (0.606)
Distij 0 0.0007** (0.0003)
0 0.0001
(0.0001) 0
0.0006 (0.0002)
0 -0.0003** (0.0001)
Colanij 0 *0.539 (1.509)
0 0.944
(0.965) 0
-1.365 (0.954)
0 0.003 (0.8)
Colhisij 0 2.772** (1.018)
0 2.377** (0.984)
0 1.848
(2.461) 0
1.677 (2.402)
Constant 1.457
(5.788) -4.832 (6.332)
3.625 (5.071)
-5.588 (5.435)
-23.685 (15.06)
-22.467*** (6.106)
-49.234 (15.377)
-14.044 (5.259)
N 308 308 401 401 416 416 543 543
R-squared(overall) 0.0074 0.0272 0.0115 0.0242 0.2912 0.3105 0.118 0.1684
Robust standard errors in parentheses , ***1% significance level, **5% significance level, *10% significance level
Source: Author’s calculation

42
Table 5.3 Regression result on bilateral trade value for Ethiopia’s major trading partner countries
Netherlands Saudi Arabia China EU countries OECD countries
FE RE FE RE FE RE FE RE FE RE
lnGDPij 0.031
(0.017) 0.027
(0.016) 0.001
(0.001) 0.002
(0.001)
0.036** (0.011)
0.027** (0.010)
0.002** (0.001)
0.001 (0.001)
0.003 (0.001)
0.001 (0.001)
RISPMi 0.047
(0.502) -0.110 (0.509)
0.261 (0.523) 0.116
(0.511)
-0.187 (0.936)
0.007 (0.904) 0.355**
(0.172) 0.181
(0.167) 0.58*** (0.146)
0.477*** (0.143)
Govefi -0.789 (0.665)
-0.728 (0.631)
1.466** (0.861)
1.238 (0.82)
0.365 (1.745)
-0.238 (1.695)
0.365 (0.332)
0.128 (0.324)
0.192 (0.266)
*0.066 (0.260)
Plsti -1.051** (0.589)
-1.025** (0.581)
0.719 (0.543)
0.738 (0.537)
-0.332 (0.957)
-0.615 (0.927)
0.474** (0.167)
0.412** (0.164)
0.700*** (0.141)
0.641*** (0.138)
Distij 0 0
0 0 0 0 0
0.0003** (0.0001) 0
0.00007** (0.00003)
Colangij 0 0 0 0 0 0 0 *0.367 (0.258) 0
-0.04 (0.194)
Colhisij 0 0 0 0 0 0 0 1.293*** (0.362) 0
1.13** (0.348)
Constant -18.252 (14.43)
0 10.558***
(1.666) 0 -19.68
(9.79) 0 7.641***
(1.27) 5.325*** (1.329)
6.803*** (1.101)
6.836*** (1.068)
N 442 442 501 501 403 403 6000 6000 8691 8691
R-squared (overall)
0.0444 0.0397 0.0077 0.0028 0.0206 0.02 0.0381 0.0009 0.0269 0
Robust standard errors in parentheses , ***1% significance level, **5%significance level, *10%significance level
Source: Author’s calculation
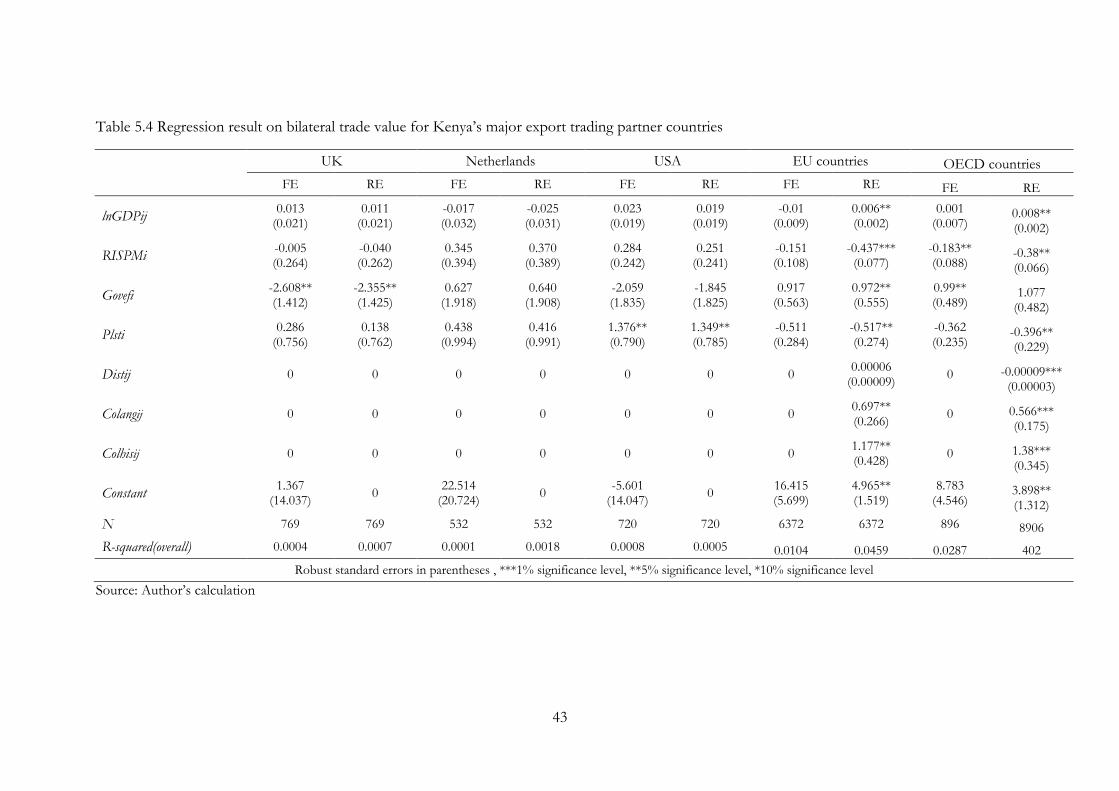
43
Table 5.4 Regression result on bilateral trade value for Kenya’s major export trading partner countries
UK Netherlands USA EU countries OECD countries
FE RE FE RE FE RE FE RE FE RE
lnGDPij 0.013
(0.021) 0.011
(0.021) -0.017 (0.032)
-0.025 (0.031)
0.023 (0.019)
0.019 (0.019)
-0.01 (0.009)
0.006** (0.002)
0.001 (0.007)
0.008** (0.002)
RISPMi -0.005 (0.264)
-0.040 (0.262)
0.345 (0.394)
0.370 (0.389)
0.284 (0.242)
0.251 (0.241)
-0.151 (0.108)
-0.437*** (0.077)
-0.183** (0.088)
-0.38** (0.066)
Govefi -2.608** (1.412)
-2.355** (1.425)
0.627 (1.918)
0.640 (1.908)
-2.059 (1.835)
-1.845 (1.825)
0.917 (0.563)
0.972** (0.555)
0.99** (0.489)
1.077 (0.482)
Plsti 0.286
(0.756) 0.138
(0.762) 0.438
(0.994) 0.416
(0.991) 1.376** (0.790)
1.349** (0.785)
-0.511 (0.284)
-0.517** (0.274)
-0.362 (0.235)
-0.396** (0.229)
Distij 0 0 0 0 0 0 0 0.00006
(0.00009) 0 -0.00009***
(0.00003)
Colangij 0 0 0 0 0 0 0 0.697** (0.266)
0 0.566*** (0.175)
Colhisij 0 0 0 0 0 0 0 1.177** (0.428)
0 1.38*** (0.345)
Constant 1.367
(14.037) 0
22.514 (20.724)
0 -5.601
(14.047) 0
16.415 (5.699)
4.965** (1.519)
8.783 (4.546)
3.898** (1.312)
N 769 769 532 532 720 720 6372 6372 896 8906
R-squared(overall) 0.0004 0.0007 0.0001 0.0018 0.0008 0.0005 0.0104 0.0459 0.0287 402
Robust standard errors in parentheses , ***1% significance level, **5% significance level, *10% significance level
Source: Author’s calculation

44
5.2 Analysis on the top Agricultural Export Commodity of Botswana,
Cameroon and Mozambique to EU Market
It is widely argued that SPS measures are major trade distortion factors that imped agricultural and food export potential of developing countries to developed countries markets, specifically to EU countries (Henson and Loader 2001, Disdier et al. 2008, Gebrehiwet et al. 2007). The regression results for the three countries top agricultural products also support the argument accordingly. As indicated in Table 5.5, Botswana’s export potential for ‘meat and edible meat offal’ commodity group has declined following the years after the implementation of standard. Similarly, Mozambique’s export of ‘sugars and sugar confectionery’ product group to EU market has shown reduction remarkably. One major finding worth noting here is that the standard effect for Cameroon’s ‘cocoa and cocoa preparations’ commodity group is not significant. The result further substantiates the argument that agricultural and food commodities where African countries have competitive climate and production advantage are not affected by the standard. This in turn gives insight to an ongoing discussion of EU countries’ protectionist agenda, as they require strict compliance with SPS standards. The result also indicates the effect of the standard across commodities is inconsistent.
Table 5.5 Regression on trade value of Botswana, Cameroon and Mozambique top agricultural export commodities to EU countries
Botswana Cameroon Mozambique
(Meat and edible meat
offal) (Cocoa and cocoa
preparations) (Sugars and sugar confectionery)
FE RE FE RE FE RE
ln GDP 0.009
(0.032) 0.017
(0.022) 0.106** (0.031)
0.043** (0.016)
0.470** (0.170)
0.02 (0.014)
Reporter implementation of ISPM 15
0.814** (0.34)
0.847** (0.365)
0.021 (0.769)
0.662 (0.697)
3.258** (1.064)
0.523 (0.556)
Governance Effectiveness
2.319 (1.821)
2.251 (1.668)
1.236 (2.140)
2.196 (2.071)
12.776** (5.730)
15.766** (7.353)
Political stability and Absence of violence
2.578 (1.541)
2.573** (1.541)
2.281 (1.260)
1.630 (1.364)
0.150 (0.922)
0.243 (1.320)
Distance 0 0.001
(0.001) 0
0.0004 (0.001)
0 0.0009
(0.0006)
Common Language 0 1.730
(2.198) 0
1.064 (1.600)
0 0.624
(0.758)
Colonial History 0 2.70** (1.578)
0 2.691** (1.005) 0
0
Constant 12.205
(20.816) 17.029
(10.723) 54.127** (21.098)
14.888 (14.958)
267** (102.464)
1.439 (13.093)
N 77 77 85 85 42 42 R-squared(overall) 0.0362 0.2317 0.0368 0.1122 0.0435 0.3325
Robust standard errors in parentheses , ***1% significance level, **5% significance level, *10% significance level
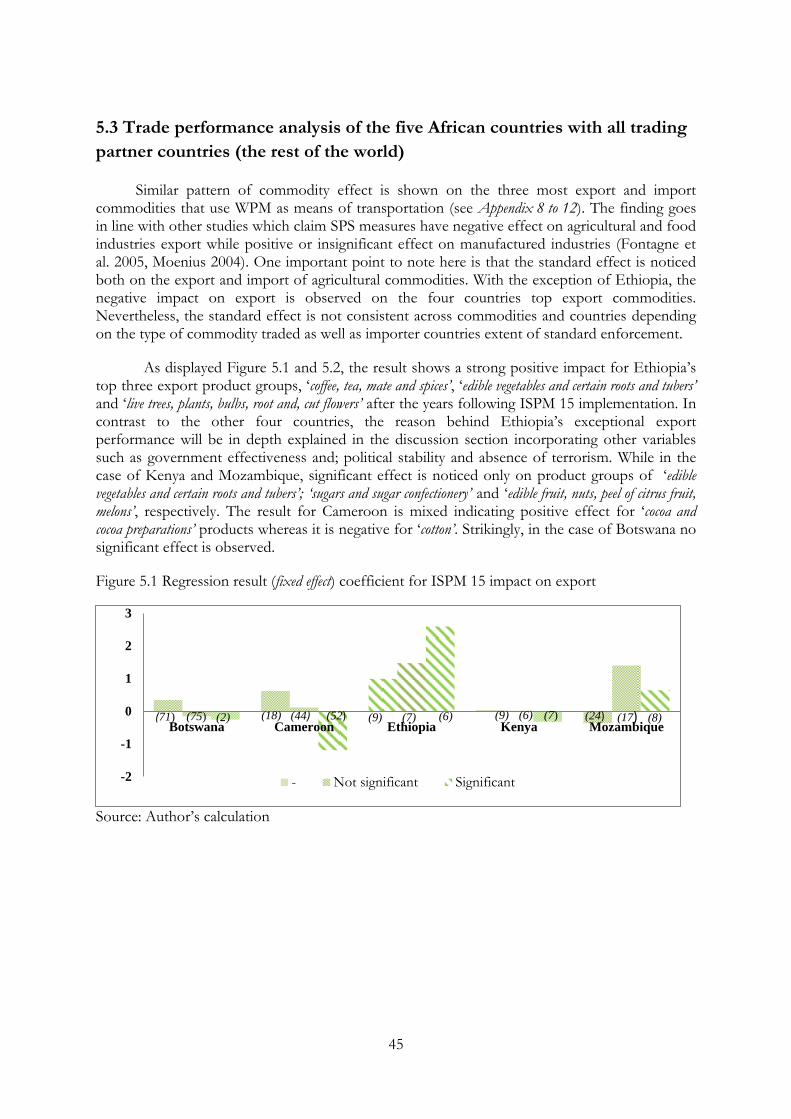
45
5.3 Trade performance analysis of the five African countries with all trading
partner countries (the rest of the world)
Similar pattern of commodity effect is shown on the three most export and import commodities that use WPM as means of transportation (see Appendix 8 to 12). The finding goes in line with other studies which claim SPS measures have negative effect on agricultural and food industries export while positive or insignificant effect on manufactured industries (Fontagne et al. 2005, Moenius 2004). One important point to note here is that the standard effect is noticed both on the export and import of agricultural commodities. With the exception of Ethiopia, the negative impact on export is observed on the four countries top export commodities. Nevertheless, the standard effect is not consistent across commodities and countries depending on the type of commodity traded as well as importer countries extent of standard enforcement.
As displayed Figure 5.1 and 5.2, the result shows a strong positive impact for Ethiopia’s top three export product groups, ‘coffee, tea, mate and spices’, ‘edible vegetables and certain roots and tubers’ and ‘live trees, plants, bulbs, root and, cut flowers’ after the years following ISPM 15 implementation. In contrast to the other four countries, the reason behind Ethiopia’s exceptional export performance will be in depth explained in the discussion section incorporating other variables such as government effectiveness and; political stability and absence of terrorism. While in the case of Kenya and Mozambique, significant effect is noticed only on product groups of ‘edible vegetables and certain roots and tubers’; ‘sugars and sugar confectionery’ and ‘edible fruit, nuts, peel of citrus fruit, melons’, respectively. The result for Cameroon is mixed indicating positive effect for ‘cocoa and cocoa preparations’ products whereas it is negative for ‘cotton’. Strikingly, in the case of Botswana no significant effect is observed.
Figure 5.1 Regression result (fixed effect) coefficient for ISPM 15 impact on export
Source: Author’s calculation
-2
-1
0
1
2
3
Botswana Cameroon Ethiopia Kenya Mozambique
- Not significant Significant
(6) (7) (9) (7) (6) (9) (52) (44) (18) (2) (75) (71) (24) (17) (8)
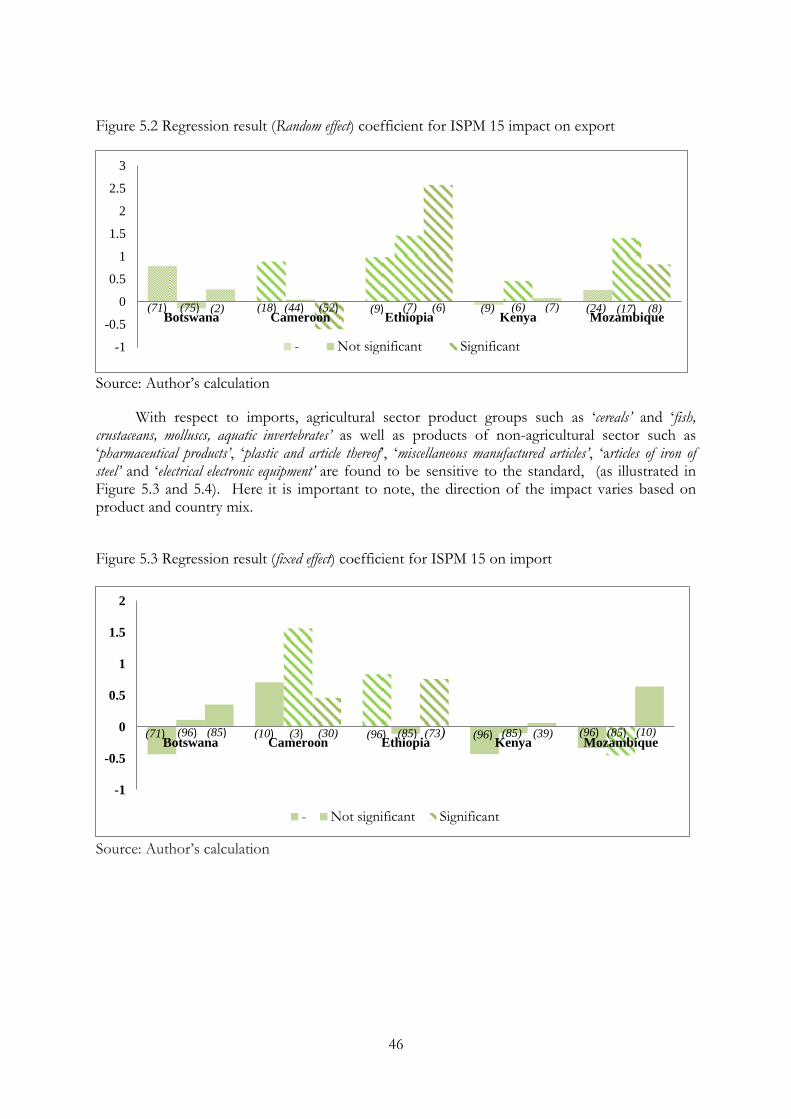
46
Figure 5.2 Regression result (Random effect) coefficient for ISPM 15 impact on export
Source: Author’s calculation
With respect to imports, agricultural sector product groups such as ‘cereals’ and ‘fish, crustaceans, molluscs, aquatic invertebrates’ as well as products of non-agricultural sector such as ‘pharmaceutical products’, ‘plastic and article thereof’, ‘miscellaneous manufactured articles’, ‘articles of iron of steel’ and ‘electrical electronic equipment’ are found to be sensitive to the standard, (as illustrated in Figure 5.3 and 5.4). Here it is important to note, the direction of the impact varies based on product and country mix.
Figure 5.3 Regression result (fixed effect) coefficient for ISPM 15 on import
Source: Author’s calculation
-1
-0.5
0
0.5
1
1.5
2
2.5
3
Botswana Cameroon Ethiopia Kenya Mozambique
- Not significant Significant
(8) (17) (24) (7) (6) (9) (6) (7) (9) (52) (44) (18) (2) (75) (71)
-1
-0.5
0
0.5
1
1.5
2
Botswana Cameroon Ethiopia Kenya Mozambique
- Not significant Significant
(10) (85) (39) (96) (85) (96) (73) (85) (96) (30) (3) (10) (85) (96) (71)
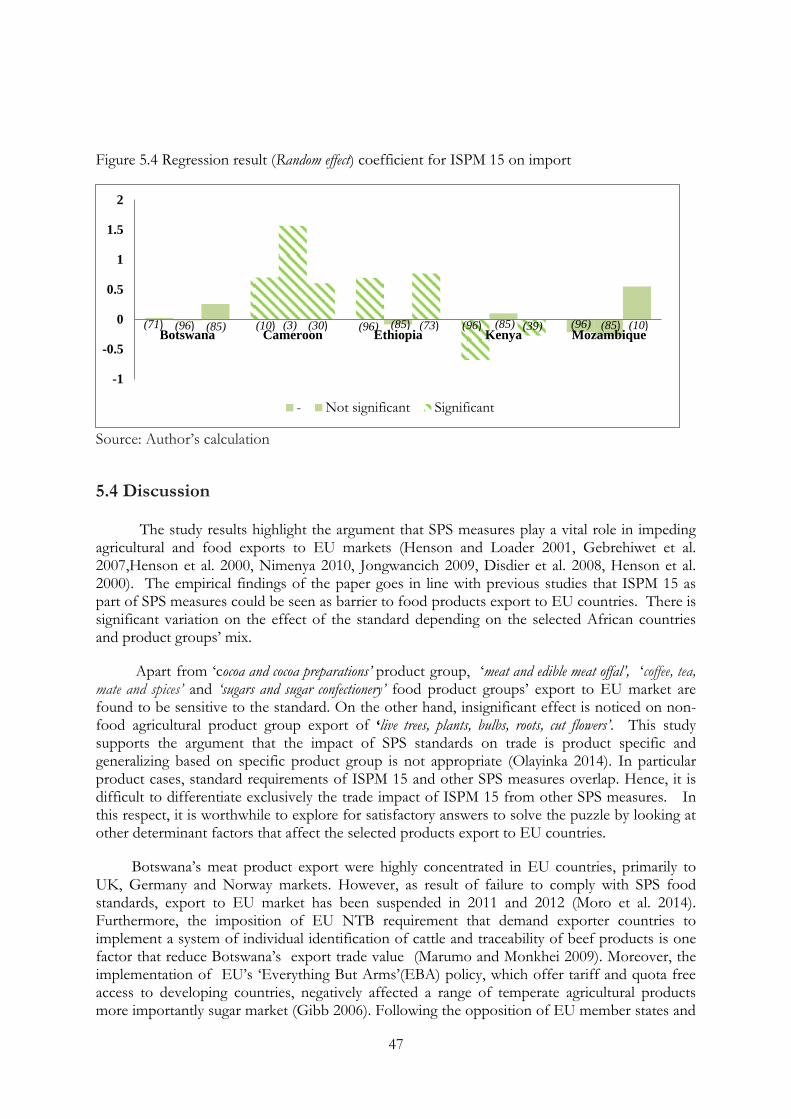
47
Figure 5.4 Regression result (Random effect) coefficient for ISPM 15 on import
Source: Author’s calculation
5.4 Discussion
The study results highlight the argument that SPS measures play a vital role in impeding agricultural and food exports to EU markets (Henson and Loader 2001, Gebrehiwet et al. 2007,Henson et al. 2000, Nimenya 2010, Jongwancich 2009, Disdier et al. 2008, Henson et al. 2000). The empirical findings of the paper goes in line with previous studies that ISPM 15 as part of SPS measures could be seen as barrier to food products export to EU countries. There is significant variation on the effect of the standard depending on the selected African countries and product groups’ mix.
Apart from ‘cocoa and cocoa preparations’ product group, ‘meat and edible meat offal’, ‘coffee, tea, mate and spices’ and ‘sugars and sugar confectionery’ food product groups’ export to EU market are found to be sensitive to the standard. On the other hand, insignificant effect is noticed on non-food agricultural product group export of ‘live trees, plants, bulbs, roots, cut flowers’. This study supports the argument that the impact of SPS standards on trade is product specific and generalizing based on specific product group is not appropriate (Olayinka 2014). In particular product cases, standard requirements of ISPM 15 and other SPS measures overlap. Hence, it is difficult to differentiate exclusively the trade impact of ISPM 15 from other SPS measures. In this respect, it is worthwhile to explore for satisfactory answers to solve the puzzle by looking at other determinant factors that affect the selected products export to EU countries.
Botswana’s meat product export were highly concentrated in EU countries, primarily to UK, Germany and Norway markets. However, as result of failure to comply with SPS food standards, export to EU market has been suspended in 2011 and 2012 (Moro et al. 2014). Furthermore, the imposition of EU NTB requirement that demand exporter countries to implement a system of individual identification of cattle and traceability of beef products is one factor that reduce Botswana’s export trade value (Marumo and Monkhei 2009). Moreover, the implementation of EU’s ‘Everything But Arms’(EBA) policy, which offer tariff and quota free access to developing countries, negatively affected a range of temperate agricultural products more importantly sugar market (Gibb 2006). Following the opposition of EU member states and
-1
-0.5
0
0.5
1
1.5
2
Botswana Cameroon Ethiopia Kenya Mozambique
- Not significant Significant
(85) (96) (71) (30) (3) (10) (73) (85) (96) (96) (85) (39) (96) (85) (10)
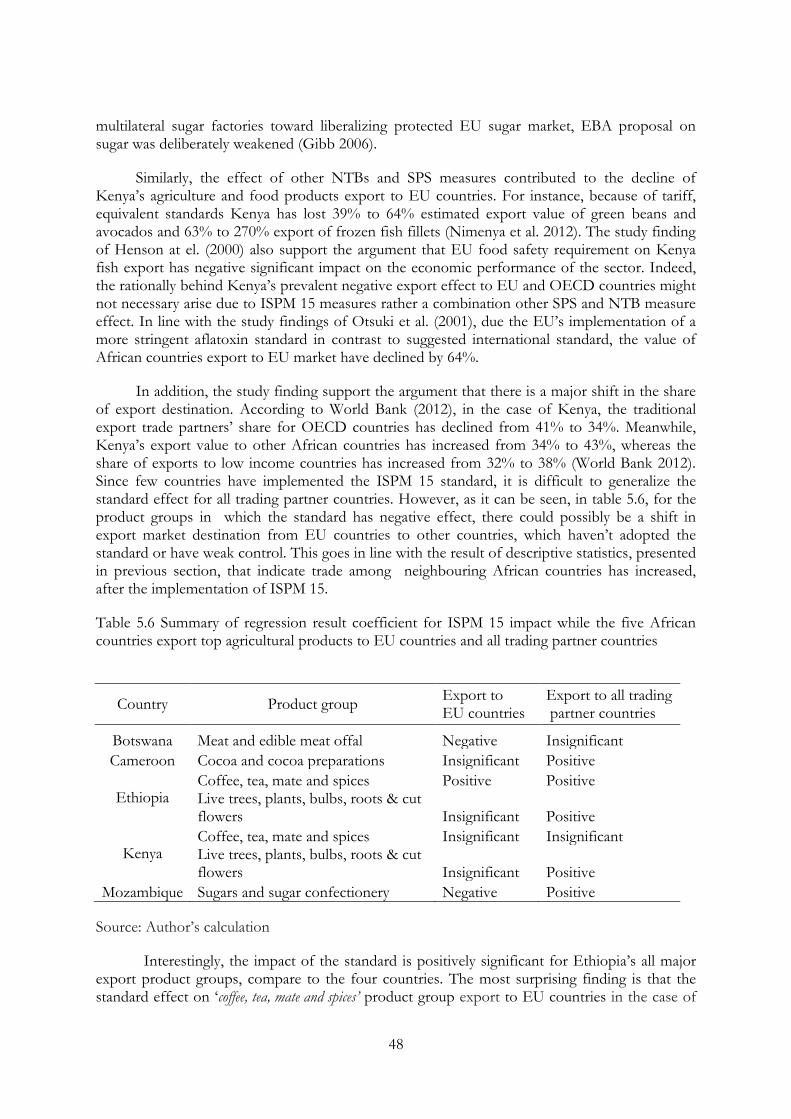
48
multilateral sugar factories toward liberalizing protected EU sugar market, EBA proposal on sugar was deliberately weakened (Gibb 2006).
Similarly, the effect of other NTBs and SPS measures contributed to the decline of Kenya’s agriculture and food products export to EU countries. For instance, because of tariff, equivalent standards Kenya has lost 39% to 64% estimated export value of green beans and avocados and 63% to 270% export of frozen fish fillets (Nimenya et al. 2012). The study finding of Henson at el. (2000) also support the argument that EU food safety requirement on Kenya fish export has negative significant impact on the economic performance of the sector. Indeed, the rationally behind Kenya’s prevalent negative export effect to EU and OECD countries might not necessary arise due to ISPM 15 measures rather a combination other SPS and NTB measure effect. In line with the study findings of Otsuki et al. (2001), due the EU’s implementation of a more stringent aflatoxin standard in contrast to suggested international standard, the value of African countries export to EU market have declined by 64%.
In addition, the study finding support the argument that there is a major shift in the share of export destination. According to World Bank (2012), in the case of Kenya, the traditional export trade partners’ share for OECD countries has declined from 41% to 34%. Meanwhile, Kenya’s export value to other African countries has increased from 34% to 43%, whereas the share of exports to low income countries has increased from 32% to 38% (World Bank 2012). Since few countries have implemented the ISPM 15 standard, it is difficult to generalize the standard effect for all trading partner countries. However, as it can be seen, in table 5.6, for the product groups in which the standard has negative effect, there could possibly be a shift in export market destination from EU countries to other countries, which haven’t adopted the standard or have weak control. This goes in line with the result of descriptive statistics, presented in previous section, that indicate trade among neighbouring African countries has increased, after the implementation of ISPM 15.
Table 5.6 Summary of regression result coefficient for ISPM 15 impact while the five African countries export top agricultural products to EU countries and all trading partner countries
Country Product group Export to EU countries
Export to all trading partner countries
Botswana Meat and edible meat offal Negative Insignificant
Cameroon Cocoa and cocoa preparations Insignificant Positive
Ethiopia Coffee, tea, mate and spices Positive Positive Live trees, plants, bulbs, roots & cut flowers Insignificant Positive
Kenya Coffee, tea, mate and spices Insignificant Insignificant Live trees, plants, bulbs, roots & cut flowers Insignificant Positive
Mozambique Sugars and sugar confectionery Negative Positive
Source: Author’s calculation
Interestingly, the impact of the standard is positively significant for Ethiopia’s all major export product groups, compare to the four countries. The most surprising finding is that the standard effect on ‘coffee, tea, mate and spices’ product group export to EU countries in the case of
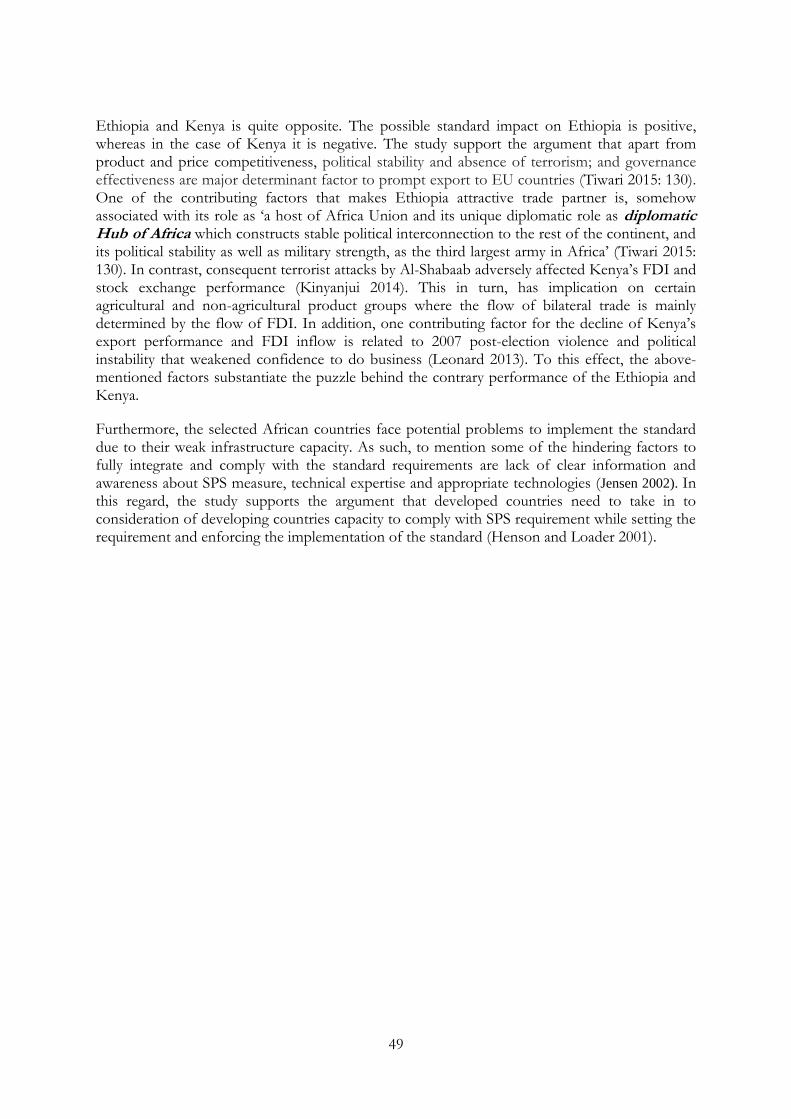
49
Ethiopia and Kenya is quite opposite. The possible standard impact on Ethiopia is positive, whereas in the case of Kenya it is negative. The study support the argument that apart from product and price competitiveness, political stability and absence of terrorism; and governance effectiveness are major determinant factor to prompt export to EU countries (Tiwari 2015: 130). One of the contributing factors that makes Ethiopia attractive trade partner is, somehow associated with its role as ‘a host of Africa Union and its unique diplomatic role as diplomatic Hub of Africa which constructs stable political interconnection to the rest of the continent, and its political stability as well as military strength, as the third largest army in Africa’ (Tiwari 2015: 130). In contrast, consequent terrorist attacks by Al-Shabaab adversely affected Kenya’s FDI and stock exchange performance (Kinyanjui 2014). This in turn, has implication on certain agricultural and non-agricultural product groups where the flow of bilateral trade is mainly determined by the flow of FDI. In addition, one contributing factor for the decline of Kenya’s export performance and FDI inflow is related to 2007 post-election violence and political instability that weakened confidence to do business (Leonard 2013). To this effect, the above-mentioned factors substantiate the puzzle behind the contrary performance of the Ethiopia and Kenya.
Furthermore, the selected African countries face potential problems to implement the standard due to their weak infrastructure capacity. As such, to mention some of the hindering factors to fully integrate and comply with the standard requirements are lack of clear information and awareness about SPS measure, technical expertise and appropriate technologies (Jensen 2002). In this regard, the study supports the argument that developed countries need to take in to consideration of developing countries capacity to comply with SPS requirement while setting the requirement and enforcing the implementation of the standard (Henson and Loader 2001).
50
Chapter 6
Conclusion and Policy Implications
6.1 Conclusion
The objective of the research is to analyze to what extent ISPM 15 standard implemented by the selected African countries, Botswana, Cameroon, Ethiopia, Kenya and Mozambique, affect trade performance. With respect to trade interaction of the selected African countries’ with all trading partner countries, the standard affects both export and import of agricultural and non-agricultural product groups’. However, the standard effect is not consistent across all the selected countries’ and product groups’ depending on the type of commodity traded and importer countries extent of standard enforcement. The result of this empirical finding should be interpreted with some caution; given the standard has correlation effect on product groups under consideration. The paper draws the following conclusions, based on the results of this empirical investigation.
First, ISPM 15 standard tend to impede export of most food products’ to EU countries. Apart from ‘cocoa and cocoa preparations’ and ‘live trees, plants, bulbs, roots and cut flowers’ product groups, the standard negatively affect bilateral trade value of ‘meat and edible meat offal’ and ‘sugars and sugar confectionery’ product groups export to EU market. This is because in particular circumstances, if the product fails to comply with the standard requirement, the product face rejection at the point of entry or exporters will be obligated to sale at lower price (Henson et al. 2000). This in turn result significant loss on the value of products.
Second, the study result suggests that the trade distortion effect of ISPM 15 is not limited to export of agricultural products to EU countries; rather it also affects the import of food products to the selected African countries as well. The standard has positive impact on agricultural products import trade value for ‘fish, crustaceans, molluscs, and aquatic invertebrates’ and ‘cereals’ product groups. Furthermore, non-agricultural products such as ‘pharmaceutical products’, ‘plastics and articles thereof’, ‘miscellaneous manufactured articles’, ‘articles of iron or steel; and ‘electrical electronic equipment’ import flow to these African countries also face trade distortion effect.
Third, it is highly ambiguous to state that by complying with the standard requirements will improve the market competitiveness of these African countries. This is bacuase other factors such as, other SPS and NTB measures predominantly regulate trade flow to developed countries, more importantly to EU countries. There are many applicable SPS and NTBs standards on every product, although a particular standard requirement might dominate for reasons of reduction in bilateral trade value.
Fourth, the impact of the standard for Ethiopia’s export of ‘coffee, tea, mate and spices’ product group to EU and OECD countries is positive while it is negative in the case of Kenya. Similar effect is also noticed for all traded commodities export of Ethiopia and Kenya to EU and OECD countries. The study finding indicates that, apart from price and commodity competitiveness, other factor socio economic factors such as political stability and government effectiveness dominantly influence export to EU and OECD countries.
Fifth, the study result has further implication that these countries have diverted their exports to other market destinations, which have less standard requirements or weak control. Thus, the share of trade among neighbouring African countries has accelerated for the years

51
following the implementation of ISPM 15. This could be considered as a measure taken by these countries to minimize the effect of ISPM 15 & other SPS measure.
Finally, theoretically the implementation of ISPM 15 will facilitate economic growth via expanding export and enhancing these countries competitiveness. However, it could only be achieved if the country has sufficient resources required to comply with. In this regard, the five African countries have limitation to sufficiently access scientific and technical expertise in implementing the standards. Hence, consideration should be also given to build the capacity of these countries to comply with standard requirements given their limited access to financial, technical and scientific resources.
6.2 Policy Implications
The policy implications of this study is important especially to developing countries and international standard setting organizations. WTO, NPPO, FAO and other international standard setting organizations need to ensure developing countries are able to participate effectively in standard development activities. In addition, these African countries need to strengthen their institutional structure and procedural capacity to increase their benefits of adopting the ISPM 15 standard.
Further researches need to be conducted to assess which regions and countries have higher risk level of pest occurrence threat and extent of possible damage. Moreover, emphasis need to be given to strengthen research and policy analysis network in the area of ISPM 15. This enable governments and standard setting international organizations make informed policy decision about the trade distortion effect of the standard.
6.3 Recommendation for further studies
The paper further proposes directions for future researches to take in to consideration of additional explanatory variables such as ISPM 15 implementation year for trading partner countries, size of forest land, FDI, economic diplomacy and extent pests’ incidence threat level. Moreover, the study could also be replicated for other African countries. In addition, gravity model has weakness to exclusively single out the effect of ISPM 15 among other SPS and NTB measures and other related trade distorting factors. Thus, the paper recommends future studies to apply cost benefit analysis, as to weigh the cost associated with standard implementation and its trade distortion effect on the selected African countries. The method has greater advantage to capture the magnitude effect of ISPM 15 implementation. For further development of this research, the study recommends to analyse each product group in depth, using more specific product classification at 4-digit or 6-digit level of HS.
52
References
Ababouch, L., G. Gandini and J. Ryder (2005) Causes of Detentions and Rejections in International Fish Trade. Food & Agriculture Org. Accessed 20 September 2016 African Development Bank Group (2014) Country Strategy Paper 2014-2018 Accessed 20
August 2016 < file:///C:/Users/Tadesse/Downloads/2014-2018_-
_Kenya_Country_Strategy_Paper.pdf>
African Economic outlook (2016) Accessed 20 August 2016<
file:///C:/Users/Tadesse/Downloads/Mozambique_Africa_Economic_Outlook%20_%20Moz
ambique%202016.pdf>
Agritrade(n.d.)’Informed Analysis, Expert Opinions’. Acessed 21 October 2016<http://agritrade.cta.int/>.
Atlas Media(n.d.)’Kenya’. Accessed 20 September 2016< http://atlas.media.mit.edu/>
Atlas of colonialism. Accessed 20 August2016<https://commons. wikimedia.org/wiki/Atlas_of_colonialism/>
Australian Government Department of Agriculture and Water Resource: <http://www.agriculture.gov.au/export/certification/wood-packaging/implementation-dates> (accessed August 2016)
Beghin, J.C. and J. Bureau (2001) 'Quantitative Policy Analysis of Sanitary, Phytosanitary and Technical Barriers to Trade', Économie internationale (3): 107-130.
Beghin, J.C. and J. Bureau (2001) 'Measurement of Sanitary, Phytosanitary and Technical Barriers to Trade', Consultants’ report prepared for the Food, Agriculture and Fisheries Directorate, OECD : 17-18
Bigsby, H.R. (1998) 'Quantification of phytosanitary barriers to trade', Lincoln University. Commerce Division No. 50. Canterbury:New Zealand
Brockerhoff, E.G., A.M. Liebhold, B. Richardson and D.M. Suckling (2010) 'Eradication of Invasive Forest Insects: Concepts, Methods, Costs and Benefits', New Zealand Journal of Forestry science. Accessed 9 August 2016< http://www.nrs.fs.fed.us/pubs/jrnl/2010/nrs_2010_brockerhoff_001.pdf?>
Calvin, L. and B. Krissoff (1998) 'Technical Barriers to Trade: A Case Study of Phytosanitary
Barriers and US-Japanese Apple Trade', Journal of Agricultural and Resource Economics : 351-
366.Accessed on 16 August 2016< http://www.waeaonline.org/jareonline/archives/23.2%20-
%20December%201998/JARE,Dec1998,pp351,Calvin.pdf/>
Ciesla, W.M. (2004) 'Wood and Wood Products as Pathways for Introduction of Exotic Bark Beetles and Woodborers', Crop Protection Compendium .

53
Clarke, M. (2004) 'Phytosanitary measures: preventing the introduction of exotic pests and pathogens occurring from the global trade of wood products',: the fifth International BIOECON Conference,Helsinki, Finland (15th-16th January) Colautti, R.I., S.A. Bailey, C.D. Van Overdijk, K. Amundsen and H.J. MacIsaac (2006)
'Characterised and Projected Costs of Nonindigenous Species in Canada', Biological Invasions 8(1):
45-59.
Council of Miniters’(2009)Accessed 21 August 2016<http://pflanzengesundheit.jki.bund.de/>
Coluatti, R.I.; Bailey, S.A.; van Overdijk, C.D.A.; Amundsen, K.; MacIsaac, H.J. 2006.
‘Characterised and projected costs of nonindigenous species in Canada’. Biological Invasions
8:45–59
De Groot, H.L., G. Linders, P. Rietveld and U. Subramanian (2004) 'The Institutional Determinants of Bilateral Trade Patterns', Kyklos 57(1): 103-123.
Disdier, A., L. Fontagné and M. Mimouni (2008) 'The Impact of Regulations on Agricultural Trade: Evidence from the SPS and TBT Agreements', American Journal of Agricultural Economics 90(2): 336-350.
DistanceFromTo’Distance from Ethiopia to other countries’<
http://www.distancefromto.net/country-distance-from/Ethiopia/>
FAO (2002) 'International Standards for Phytosanitary Measures: Guidelines for Regulating Wood Packaging Material in International Trade' Italy, Food and Agriculture Organization. Accessed on 12 July 2016 < ftp://ftp.fao.org/docrep/FAO/006/y4838e/y4838e00.pdf> Food and agricultural organization of the united nations (n.d.)’Implementation of ISPM 15’(Accessed on 21 August 2016)<https://www.ippc.int>
Food and agricultural organization of the united nations (2009)’Internantional Standard for
Phytosanitary Measures-Regulation of Wood Packaging Material in International
Trade’.Accessed on 12 July 2016< http://www.ispm15.com/ISPM15_Revised_2009.pdf>
Fields, P.G. and N.D. White (2002) 'Alternatives to Methyl Bromide Treatments for Stored-
Product and Quarantine Insects 1', Annual Review of Entomology 47(1): 331-359.
Fleming, M.R., K. Hoover, J.J. Janowiak and Y. Fang (2003) 'Microwave Irradiation of Wood
Packing Material to Destroy the Asian Longhorned Beetle', Forest Products Journal 53(1): 46
Fontagné, L., M. Mimouni and J. Pasteels (2005) 'Estimating the Impact of Environmental SPS and TBT on International Trade', Integration and Trade Journal 22(3): 7-37.
Fontagné, L., G. Orefice, R. Piermartini and N. Rocha (2015) 'Product Standards and Margins of Trade: Firm-Level Evidence', Journal of International Economics 97(1): 29-44.
Fontagné, L., F. von Kirchbach and M. Mimouni (2001) A First Assessment of Environment-Related TradeBarriers. CEPII .Accessed 21 August
54
2016<https://www.researchgate.net/profile/Friedrich_Von_Kirchbach/publication/4815645_A_First_Assessment_of_EnvironmentRelated_Trade_Barriers/links/54bf69750cf2f6bf4e04e895.pdf/>
Fugazza, M. (2013) The Economics Behind Non-Tariff Measures: Theoretical Insights and Empirical Evidence.(No.57)’United Nations Conference of Trade and Development..
Gebrehiwet, Y., S. Ngqangweni and J.F. Kirsten (2007) 'Quantifying the Trade Effect of Sanitary and Phytosanitary Regulations of OECD Countries on South African Food Exports', Agrekon 46(1): 1-17.
Gibb, R. (2006) 'The European Union's ‘Everything but Arms’ Development Initiative and Sugar: Preferential Access Or Continued Protectionism?', Applied Geography 26(1): 1-17.
Globaledge Michigan State University(n.d.)’Ethiopia:Trade Statistics’. Acessed 20 September
2016<http://globaledge.msu.edu/>
Globaledge Michigan State University(n.d.)’Mozambique:Trade Statistics’. Acessed 20 September
2016<http://globaledge.msu.edu/>
Government Communication Affairs Office (2012)`Ethiopia’s Foreign Policy and its
Achievements`. Accessed 14 March 2016<
http://www.ethdiaspora.org.et/phocadownloadpap/Publications/ethiopiafpachievements.pdf/
>
Haack, R.A., K.O. Britton, E.G. Brockerhoff, J.F. Cavey, L.J. Garrett, M. Kimberley et al. (2014) 'Effectiveness of the International Phytosanitary Standard ISPM no. 15 on Reducing Wood Borer Infestation Rates in Wood Packaging Material Entering the United States', Accessed 21 August 2016< http://journals.plos.org/plosone/article/asset?id=10.1371/journal.pone.0096611.PDF/>
Haack, R.A. and E.G. Brockerhoff (2011) 'ISPM no. 15 and the Incidence of Wood Pests: Recent Findings, Policy Changes, and Current Knowledge Gaps'. Paper presented in symposium at Michigan (8-12 May)
Haack, R.A. and T.R. Petrice (2008) 'How Risky is Bark that is Associated with Treated Wood Packing Material’ paper presented at 42nd Annual Meeting Queenstown, New Zealand(18-12 May)
Hassler, C.C., S. Grushecky, J.J. Slahor and P. Turk (2010) 'An Assessment of the Impacts of a Domestic Phytosanitary Treatment Regulation for Wood Packaging Material Manufacturers', Forest Products Journal 60(4): 309.
Henin, J., S. Charron, P.J. Luypaert, B. Jourez and J. Hebert (2008) 'Strategy to Control the Effectiveness of Microwave Treatment of Wood in the Framework of the Implementation of ISPM 15', Forest Products Journal 58(12): 75.
Henin, J., M. Leyman, A. Bauduin, B. Jourez and J. Hébert (2014) 'Phytosanitary Treatment of European Pallets by Microwave: Developing a Program to Ensure Compliance with ISPM 15

55
and Monitoring its Efficacy on the House Longhorn Beetle (Hylotrupes Bajulus L.)', European Journal of Wood and Wood Products 72(5): 623-633.
Henson, S., A. Brouder and W. Mitullah (2000) 'Food Safety Requirements and Food Exports from Developing Countries: The Case of Fish Exports from Kenya to the European Union', American Journal of Agricultural Economics 82(5): 1159-1169.
Henson, S. and R. Loader (2001) 'Barriers to Agricultural Exports from Developing Countries: The Role of Sanitary and Phytosanitary Requirements', World Development 29(1): 85-102.
Henson, S., R. Loader, A. Swinbank, M. Bredahl and N. Lux (2000) Impact of Sanitary and Phytosanitary Measures on Developing Countries. University of Reading, Department of Agricultural & Food Economics. Accessed 18 July 2016.
Hooker, N.H. and J.A. Caswell (1999) 'A Framework for Evaluating Non‐Tariff Barriers to Trade Related to Sanitary and Phytosanitary Regulation', Journal of Agricultural Economics 50(2): 234-246.Accessed 16 July 2016< http://onlinelibrary.wiley.com/doi/10.1111/j.1477-9552.1999.tb00810.x/abstract.Pdf/>
Humble, L. (2010) 'Pest risk analysis and invasion pathways-insects and wood packing revisited: What have we learned', New Zealand Journal of Forestry Science, New Zealand Forest Research Institute ppS57-S72.Acessed 20 August 2016<http://www.scionresearch.com/__data/assets/pdf_file/0017/17090/NZJFS40Suppl.2010S57-S72HUMBLE..pdf/>
HT News (n.d.)’ISPM 15 country update’ Accessed on 21 August 2016<http://tpinspection.com/>
‘ISPM 15’(Image)(n.d.)Accessed 28 August 2016< https://www.google.com/>.
International Trade & Investment Review(n.d.)’ Assessing Botswana’s Trade Performance’. Accessed 31 August 2016<http://www.tradeeconomics.com/>
Jensen, M.F. (2002) Reviewing the SPS Agreement: A Developing Country Perspective. University of Copenhagen.Center for Udviklingsforskning. Accessed 16 July 2016.
Jongwanich, J. (2009) 'The Impact of Food Safety Standards on Processed Food Exports from Developing Countries', Food Policy 34(5): 447-457. Kaiser, J. (1999) 'Stemming the Tide of Invading Species', Science 285(5435): 1836-1841. Kaiser, J. (1999) 'Stemming the Tide of Invading Species', Science 285(5435): 1836-1841.
Klapwijk, M.J., A.J. Hopkins, L. Eriksson, M. Pettersson, M. Schroeder, Å. Lindelöw et al. (2016) 'Reducing the Risk of Invasive Forest Pests and Pathogens: Combining Legislation, Targeted Management and Public Awareness', Ambio 45(2): 223-234.
56
Kinyanjui, S. (2014) 'The Impact of Terrorism on Foreign Direct Investment in Kenya', International Journal of Business Administration 5(3): 148.Accessed 20 October< file:///C:/Users/Tadesse/Downloads/4772-15134-1-SM%20(1).pdf/>
Krcmar-Nozic, E.; Wilson, W.R.; Arthur, L. 2000. The potential impacts of exotic forest pests in
North America: a synthesis of research. Natural Resources Canada, Canadian Forest Service,
Pacific Forestry Centre, Victoria, BC. Information Report BC-X-387. Accessed 2 August 2016.
Leonard Wanyama (2013) `The Economic Diplomacy of Kenya’s Regional Interests (Excerpt)`
The international relations and security network. Accessed 14 March 2016 http://www.isn.ethz.ch
Liebhold, A.M. (2012) 'Forest Pest Management in a Changing World', International Journal of Pest
Management 58(3): 289-295.
Leal, I., E. Allen, L. Humble, S. Sela and A. Uzunovic (2010) Phytosanitary Risks Associated with the Global Movement of Forest Products: A Commodity-Based Approach. Vol. 419. Pacific Forestry Centre. Acessed 25 August 2016. Lee, J. and P. Swagel (1997) 'Trade Barriers and Trade Flows Across Countries and Industries', Review of Economics and Statistics 79(3): 372-382. List of countries where English is an official language (n.d.) Accessed on 10 July
2016<http://www.emmir.org/fileadmin/user_upload/admission/Countries_where_English_is_
an_official_language.pdf>
Marumo, D. and M. Monkhel (2009) 'The Effects of the European Union-Imposed Livestock
Identification and Traceback System on Botswana’s Beef Exports, Revenue and Rural
Poverty'”s”Trek 6: Referencing, not Plagiarism’..Accessed 16 August 2016<
http://www.tips.org.za/>.
Moenius, J. (2004) 'Information Versus Product Adaptation: The Role of Standards in Trade'
.Northwetern University Accessed 18 August 2016<
file:///C:/Users/Tadesse/Downloads/SSRN-id608022%20(3).pdf/>,
Moro,P.,S.Chatterj,S.Hatzipetros,S.Ghanie,C.Tsopito(2014)’’’S’Trek6:Referencing,not Plagiarism’. Accessed 21 October 2016),< http://www.bitc.co.bw/>
Nimenya, N. (2010) , Effects of non-tariff measures on European horticultural and fish imports from African
countries . Dial.pr Research publications
Nimenya, N., P. Ndimira and B.H. de Frahan (2012) 'Tariff Equivalents of Nontariff Measures:
The Case of European Horticultural and Fish Imports from African Countries', Agricultural
Economics 43(6): 635-653.
Nitsch, V. and D. Schumacher (2004) 'Terrorism and International Trade: An Empirical
Investigation', European Journal of Political Economy 20(2): 423-433.
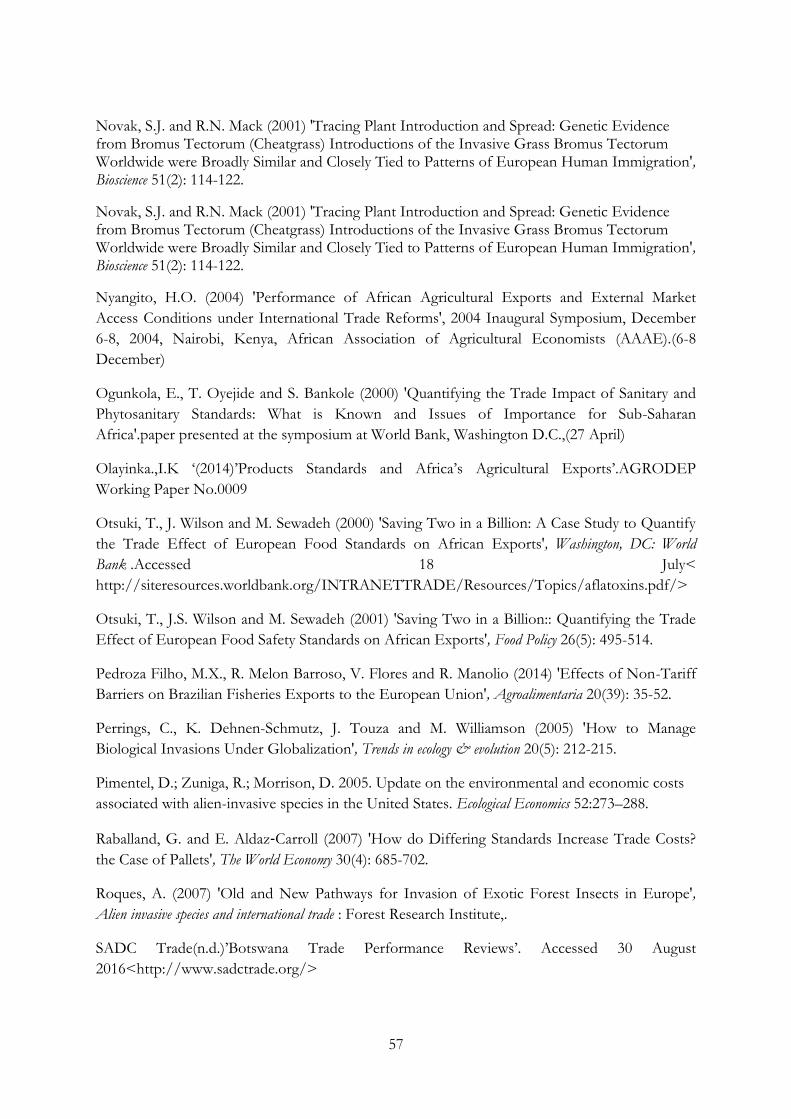
57
Novak, S.J. and R.N. Mack (2001) 'Tracing Plant Introduction and Spread: Genetic Evidence from Bromus Tectorum (Cheatgrass) Introductions of the Invasive Grass Bromus Tectorum Worldwide were Broadly Similar and Closely Tied to Patterns of European Human Immigration', Bioscience 51(2): 114-122.
Novak, S.J. and R.N. Mack (2001) 'Tracing Plant Introduction and Spread: Genetic Evidence from Bromus Tectorum (Cheatgrass) Introductions of the Invasive Grass Bromus Tectorum Worldwide were Broadly Similar and Closely Tied to Patterns of European Human Immigration', Bioscience 51(2): 114-122.
Nyangito, H.O. (2004) 'Performance of African Agricultural Exports and External Market
Access Conditions under International Trade Reforms', 2004 Inaugural Symposium, December
6-8, 2004, Nairobi, Kenya, African Association of Agricultural Economists (AAAE).(6-8
December)
Ogunkola, E., T. Oyejide and S. Bankole (2000) 'Quantifying the Trade Impact of Sanitary and
Phytosanitary Standards: What is Known and Issues of Importance for Sub-Saharan
Africa'.paper presented at the symposium at World Bank, Washington D.C.,(27 April)
Olayinka.,I.K ‘(2014)’Products Standards and Africa’s Agricultural Exports’.AGRODEP
Working Paper No.0009
Otsuki, T., J. Wilson and M. Sewadeh (2000) 'Saving Two in a Billion: A Case Study to Quantify
the Trade Effect of European Food Standards on African Exports', Washington, DC: World
Bank .Accessed 18 July<
http://siteresources.worldbank.org/INTRANETTRADE/Resources/Topics/aflatoxins.pdf/>
Otsuki, T., J.S. Wilson and M. Sewadeh (2001) 'Saving Two in a Billion:: Quantifying the Trade
Effect of European Food Safety Standards on African Exports', Food Policy 26(5): 495-514.
Pedroza Filho, M.X., R. Melon Barroso, V. Flores and R. Manolio (2014) 'Effects of Non-Tariff
Barriers on Brazilian Fisheries Exports to the European Union', Agroalimentaria 20(39): 35-52.
Perrings, C., K. Dehnen-Schmutz, J. Touza and M. Williamson (2005) 'How to Manage
Biological Invasions Under Globalization', Trends in ecology & evolution 20(5): 212-215.
Pimentel, D.; Zuniga, R.; Morrison, D. 2005. Update on the environmental and economic costs
associated with alien-invasive species in the United States. Ecological Economics 52:273–288.
Raballand, G. and E. Aldaz‐Carroll (2007) 'How do Differing Standards Increase Trade Costs?
the Case of Pallets', The World Economy 30(4): 685-702.
Roques, A. (2007) 'Old and New Pathways for Invasion of Exotic Forest Insects in Europe',
Alien invasive species and international trade : Forest Research Institute,.
SADC Trade(n.d.)’Botswana Trade Performance Reviews’. Accessed 30 August
2016<http://www.sadctrade.org/>
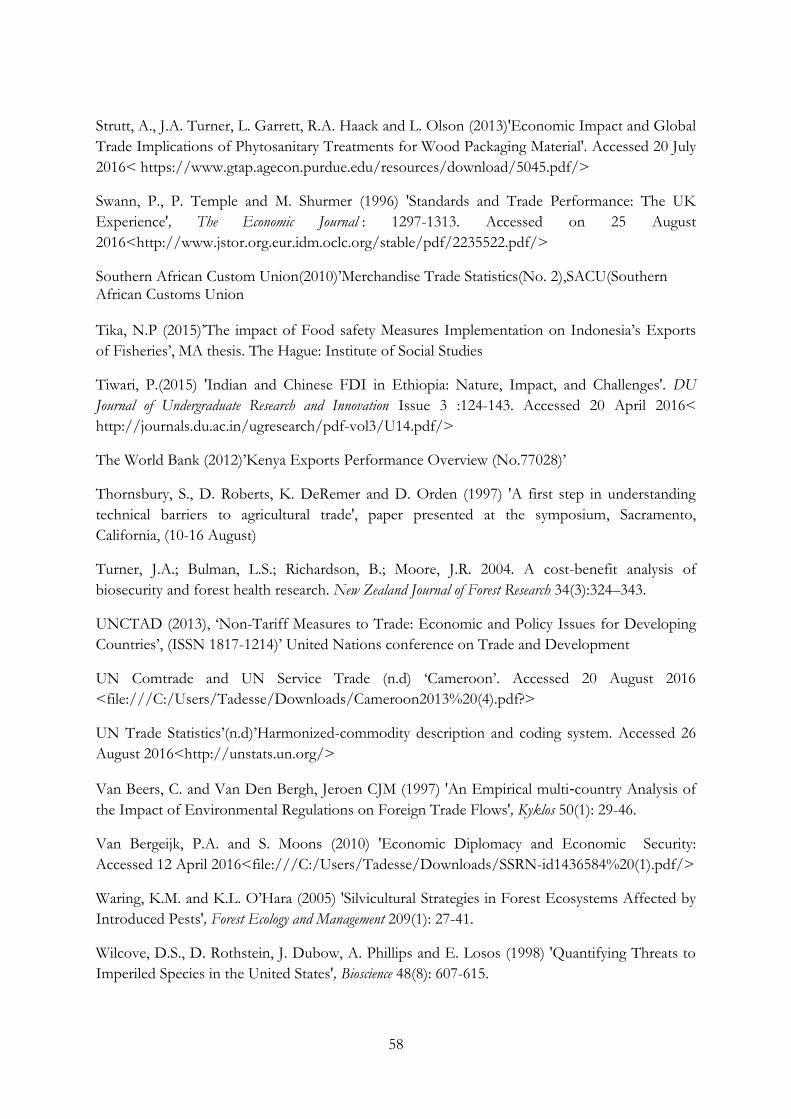
58
Strutt, A., J.A. Turner, L. Garrett, R.A. Haack and L. Olson (2013)'Economic Impact and Global
Trade Implications of Phytosanitary Treatments for Wood Packaging Material'. Accessed 20 July
2016< https://www.gtap.agecon.purdue.edu/resources/download/5045.pdf/>
Swann, P., P. Temple and M. Shurmer (1996) 'Standards and Trade Performance: The UK
Experience', The Economic Journal : 1297-1313. Accessed on 25 August
2016<http://www.jstor.org.eur.idm.oclc.org/stable/pdf/2235522.pdf/>
Southern African Custom Union(2010)’Merchandise Trade Statistics(No. 2),SACU(Southern African Customs Union Tika, N.P (2015)’The impact of Food safety Measures Implementation on Indonesia’s Exports
of Fisheries’, MA thesis. The Hague: Institute of Social Studies
Tiwari, P.(2015) 'Indian and Chinese FDI in Ethiopia: Nature, Impact, and Challenges'. DU
Journal of Undergraduate Research and Innovation Issue 3 :124-143. Accessed 20 April 2016<
http://journals.du.ac.in/ugresearch/pdf-vol3/U14.pdf/>
The World Bank (2012)’Kenya Exports Performance Overview (No.77028)’
Thornsbury, S., D. Roberts, K. DeRemer and D. Orden (1997) 'A first step in understanding
technical barriers to agricultural trade', paper presented at the symposium, Sacramento,
California, (10-16 August)
Turner, J.A.; Bulman, L.S.; Richardson, B.; Moore, J.R. 2004. A cost-benefit analysis of
biosecurity and forest health research. New Zealand Journal of Forest Research 34(3):324–343.
UNCTAD (2013), ‘Non-Tariff Measures to Trade: Economic and Policy Issues for Developing
Countries’, (ISSN 1817-1214)’ United Nations conference on Trade and Development
UN Comtrade and UN Service Trade (n.d) ‘Cameroon’. Accessed 20 August 2016
<file:///C:/Users/Tadesse/Downloads/Cameroon2013%20(4).pdf?>
UN Trade Statistics’(n.d)’Harmonized-commodity description and coding system. Accessed 26
August 2016<http://unstats.un.org/>
Van Beers, C. and Van Den Bergh, Jeroen CJM (1997) 'An Empirical multi‐country Analysis of
the Impact of Environmental Regulations on Foreign Trade Flows', Kyklos 50(1): 29-46.
Van Bergeijk, P.A. and S. Moons (2010) 'Economic Diplomacy and Economic Security:
Accessed 12 April 2016<file:///C:/Users/Tadesse/Downloads/SSRN-id1436584%20(1).pdf/>
Waring, K.M. and K.L. O’Hara (2005) 'Silvicultural Strategies in Forest Ecosystems Affected by
Introduced Pests', Forest Ecology and Management 209(1): 27-41.
Wilcove, D.S., D. Rothstein, J. Dubow, A. Phillips and E. Losos (1998) 'Quantifying Threats to
Imperiled Species in the United States', Bioscience 48(8): 607-615.
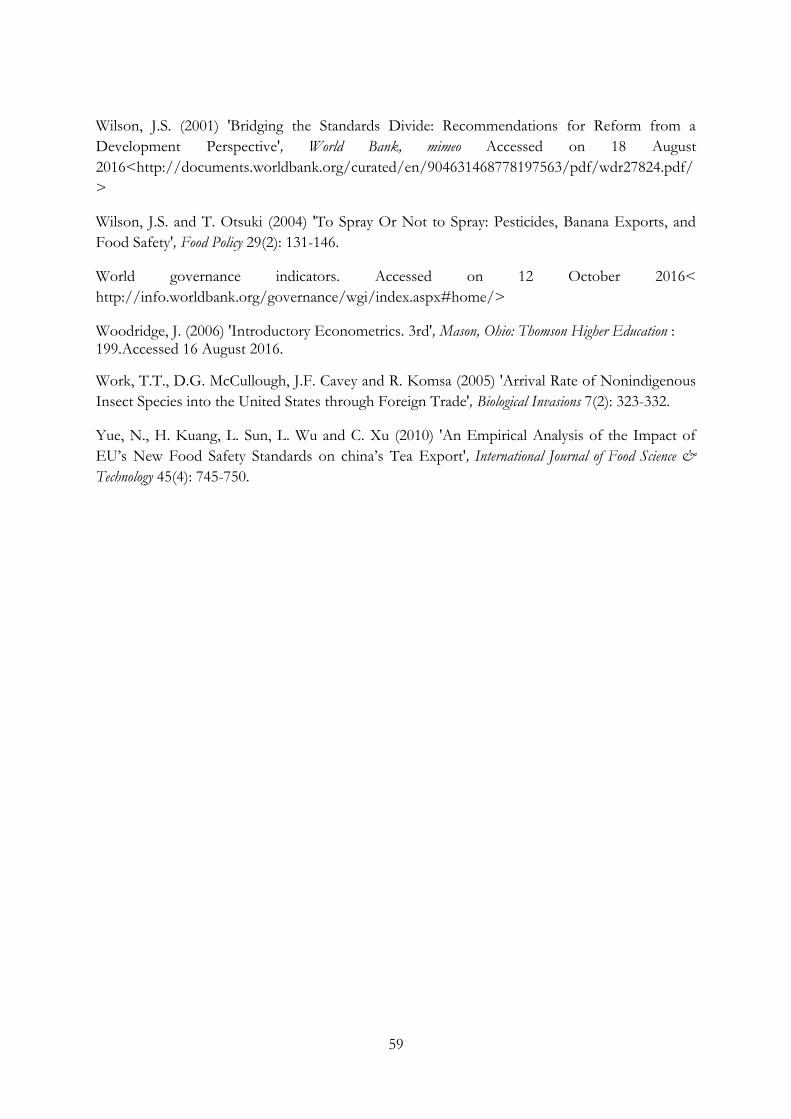
59
Wilson, J.S. (2001) 'Bridging the Standards Divide: Recommendations for Reform from a
Development Perspective', World Bank, mimeo Accessed on 18 August
2016<http://documents.worldbank.org/curated/en/904631468778197563/pdf/wdr27824.pdf/
>
Wilson, J.S. and T. Otsuki (2004) 'To Spray Or Not to Spray: Pesticides, Banana Exports, and
Food Safety', Food Policy 29(2): 131-146.
World governance indicators. Accessed on 12 October 2016<
http://info.worldbank.org/governance/wgi/index.aspx#home/>
Woodridge, J. (2006) 'Introductory Econometrics. 3rd', Mason, Ohio: Thomson Higher Education : 199.Accessed 16 August 2016.
Work, T.T., D.G. McCullough, J.F. Cavey and R. Komsa (2005) 'Arrival Rate of Nonindigenous
Insect Species into the United States through Foreign Trade', Biological Invasions 7(2): 323-332.
Yue, N., H. Kuang, L. Sun, L. Wu and C. Xu (2010) 'An Empirical Analysis of the Impact of
EU’s New Food Safety Standards on china’s Tea Export', International Journal of Food Science &
Technology 45(4): 745-750.

60
Appendices
Appendix 1: List of variables and Data sources
Type of variable Variable label Data source
Bilateral trade flow ln(Vij)tk UN Comtrade Database
Multiplied GDP of exporter and importer country
ln(GDPij) Author's calculation using data from WDI (2016)
Reporter implementation of ISPM 15 Botswana Cameroon Ethiopia Kenya Mozambique
RISPMi
IPPC (2016) Australian Government Department of Agriculture and Water Resource (2013)
Government effectiveness Govefi WGI (2016)
Political Stability and absence of Violence
Plsti WGI (2016)
Distance Distij Distance from to (2016)
Common Language Colang Atlas of colonialism (2016)
Colonial History Colhis Atlas of colonialism (2016)
Appendix 2: Descriptive statistics for Ethiopia’s export of ‘Coffee, tea, mate and spices’ product group
Trade Value N Mean SD Min Max
Export Trade Value to EU
Trade value before 2006 221 6.08* 25.5* 494 127* Trade value after 2006 256 13.1* 28.1* 5 263*
Export Trade Value to OECD
Trade value before 2006 281 7.4* 18.5* 14 127* Trade value after 2006 356 13.6* 34.6* 2 263*
*- stands for Millions of dollars
61
Appendix 3: Descriptive statistics for Kenya’s export of ‘Coffee, tea, mate and spices’ product group
Trade Value N Mean SD Min Max
Export Trade Value to EU
Trade value before 2006 262 8.6* 25.5* 14 194*
Trade value after 2006 186 9.6* 28.1* 12 197*
Export Trade Value to OECD
Trade value before 2006 351 7.4* 22.3* 14 194*
Trade value after 2006 244 9.1* 25.1* 10 197*
*- stands for Millions of dollars
Appendix 4: Descriptive statistics for Ethiopia’s export of ‘live trees, plants, bulbs, roots, cut flowers’ product group
Trade Value N Mean SD Min Max
Export Trade Value to EU
Trade value before 2006 70 0.2* 0.8* 460 5.3*
Trade value after 2006 245 8.2* 47.4* 1 508*
Export Trade Value to OECD
Trade value before 2006 83 0.2* 0.8* 460 5.3*
Trade value after 2006 327 6.4* 41.1* 1 508*
*- stands for Millions of dollars
Appendix 5: Descriptive statistics for Kenya’s export of ‘live trees, plants, bulbs, roots, cut flowers’ product group
Trade Value N Mean SD Min Max
Export Trade Value to EU
Trade value before 2006 305 4.6* 18.7* 30 172* Trade value after 2006 225 11.2* 43.8* 111 286*
Export Trade Value to OECD
Trade value before 2006 394 3.6* 16.5* 30 172* Trade value after 2006 288 9.1* 38.9* 12 286*
*- stands for Millions of dollars

62
Appendix 4: Descriptive statistics for Ethiopia’s export of ‘live trees, plants, bulbs, roots, cut flowers’ product group
Trade Value N Mean SD Min Max
Export Trade Value to EU
Trade value before 2006 70 0.2* 0.8* 460 5.3*
Trade value after 2006 245 8.2* 47.4* 1 508*
Export Trade Value to OECD
Trade value before 2006 83 0.2* 0.8* 460 5.3*
Trade value after 2006 327 6.4* 41.1* 1 508*
*- stands for Millions of dollars
Appendix 5: Descriptive statistics for Kenya’s export of ‘live trees, plants, bulbs, roots, cut flowers’ product group
Trade Value N Mean SD Min Max
Export Trade Value to EU
Trade value before 2006 305 4.6* 18.7* 30 172*
Trade value after 2006 225 11.2* 43.8* 111 286*
Export Trade Value to OECD
Trade value before 2006 394 3.6* 16.5* 30 172*
Trade value after 2006 288 9.1* 38.9* 12 286*
*- stands for Millions of dollars
Appendix 6: Descriptive statistics of Ethiopia’s trade interaction with EU and OECD countries
Trade Value N Mean SD Min Max
Export Trade Value to EU
Trade value before 2006 1416 1.5* 7.8* 1 127*
Trade value after 2006 4783 1.6* 15.1* 1 508*
Export Trade Value to OECD
Trade value before 2006 2062 1.5* 7.7* 1 127*
Trade value after 2006 7011 1.5* 13.3* 1 508*
*- stands for Millions of dollars
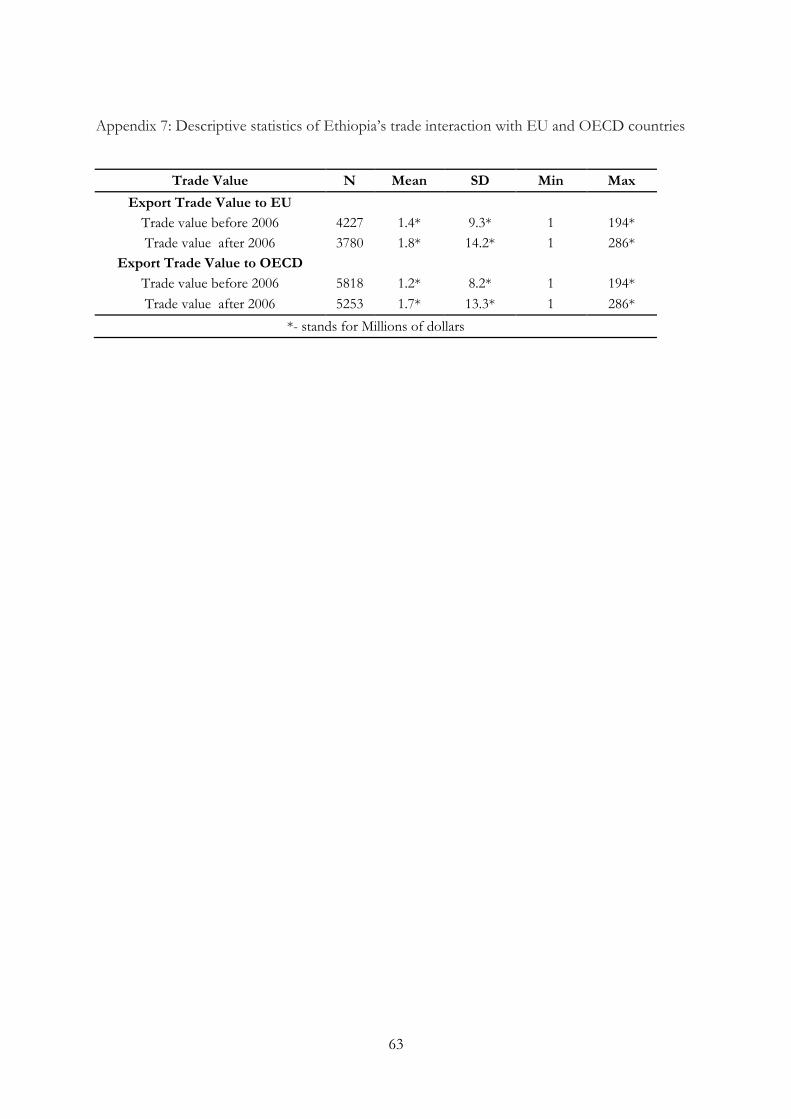
63
Appendix 7: Descriptive statistics of Ethiopia’s trade interaction with EU and OECD countries
Trade Value N Mean SD Min Max
Export Trade Value to EU
Trade value before 2006 4227 1.4* 9.3* 1 194*
Trade value after 2006 3780 1.8* 14.2* 1 286*
Export Trade Value to OECD
Trade value before 2006 5818 1.2* 8.2* 1 194*
Trade value after 2006 5253 1.7* 13.3* 1 286*
*- stands for Millions of dollars
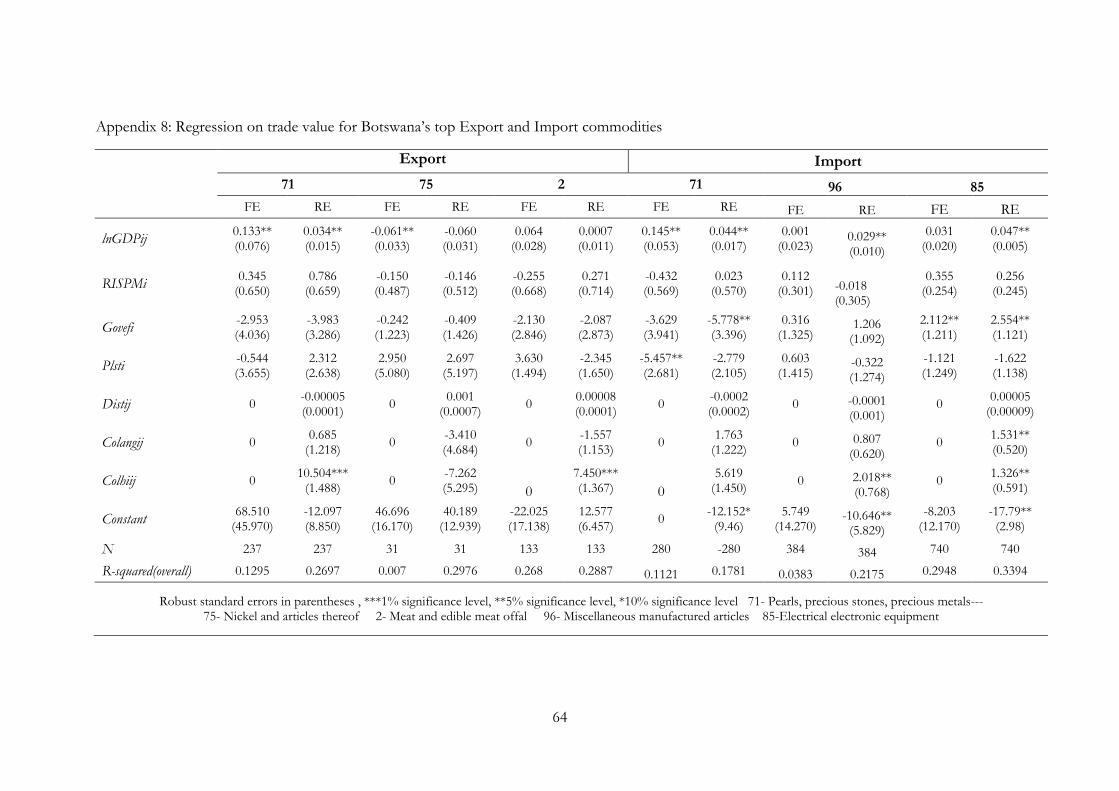
64
Appendix 8: Regression on trade value for Botswana’s top Export and Import commodities
Export Import
71 75 2 71 96 85
FE RE FE RE FE RE FE RE FE RE FE RE
lnGDPij 0.133** (0.076)
0.034** (0.015)
-0.061** (0.033)
-0.060 (0.031)
0.064 (0.028)
0.0007 (0.011)
0.145** (0.053)
0.044** (0.017)
0.001 (0.023)
0.029** (0.010)
0.031 (0.020)
0.047** (0.005)
RISPMi 0.345
(0.650) 0.786
(0.659) -0.150 (0.487)
-0.146 (0.512)
-0.255 (0.668)
0.271 (0.714)
-0.432 (0.569)
0.023 (0.570)
0.112 (0.301) -0.018
(0.305)
0.355 (0.254)
0.256 (0.245)
Govefi -2.953 (4.036)
-3.983 (3.286)
-0.242 (1.223)
-0.409 (1.426)
-2.130 (2.846)
-2.087 (2.873)
-3.629 (3.941)
-5.778** (3.396)
0.316 (1.325)
1.206 (1.092)
2.112** (1.211)
2.554** (1.121)
Plsti -0.544 (3.655)
2.312 (2.638)
2.950 (5.080)
2.697 (5.197)
3.630 (1.494)
-2.345 (1.650)
-5.457** (2.681)
-2.779 (2.105)
0.603 (1.415)
-0.322 (1.274)
-1.121 (1.249)
-1.622 (1.138)
Distij 0 -0.00005 (0.0001)
0 0.001
(0.0007) 0
0.00008 (0.0001)
0 -0.0002 (0.0002)
0 -0.0001 (0.001)
0 0.00005
(0.00009)
Colangij 0 0.685
(1.218) 0
-3.410 (4.684)
0 -1.557 (1.153)
0 1.763
(1.222) 0 0.807
(0.620) 0
1.531** (0.520)
Colhiij 0 10.504***
(1.488) 0
-7.262 (5.295) 0
7.450*** (1.367) 0
5.619 (1.450)
0 2.018** (0.768)
0 1.326** (0.591)
Constant 68.510
(45.970) -12.097 (8.850)
46.696 (16.170)
40.189 (12.939)
-22.025 (17.138)
12.577 (6.457)
0 -12.152*
(9.46) 5.749
(14.270) -10.646**
(5.829)
-8.203 (12.170)
-17.79** (2.98)
N 237 237 31 31 133 133 280 -280 384 384 740 740
R-squared(overall) 0.1295 0.2697 0.007 0.2976 0.268 0.2887 0.1121 0.1781 0.0383 0.2175 0.2948 0.3394
Robust standard errors in parentheses , ***1% significance level, **5% significance level, *10% significance level 71- Pearls, precious stones, precious metals--- 75- Nickel and articles thereof 2- Meat and edible meat offal 96- Miscellaneous manufactured articles 85-Electrical electronic equipment
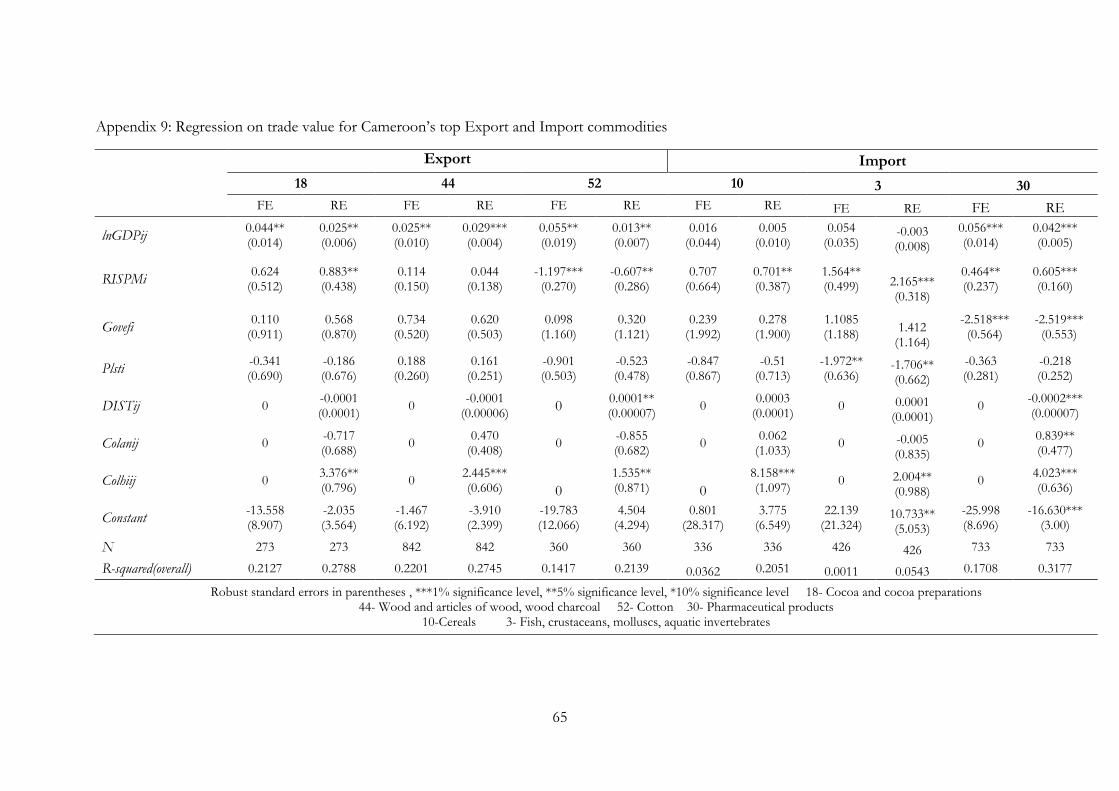
65
Appendix 9: Regression on trade value for Cameroon’s top Export and Import commodities
Export Import
18 44 52 10 3 30
FE RE FE RE FE RE FE RE FE RE FE RE
lnGDPij 0.044** (0.014)
0.025** (0.006)
0.025** (0.010)
0.029*** (0.004)
0.055** (0.019)
0.013** (0.007)
0.016 (0.044)
0.005 (0.010)
0.054 (0.035)
-0.003 (0.008)
0.056*** (0.014)
0.042*** (0.005)
RISPMi 0.624
(0.512) 0.883** (0.438)
0.114 (0.150)
0.044 (0.138)
-1.197*** (0.270)
-0.607** (0.286)
0.707 (0.664)
0.701** (0.387)
1.564** (0.499) 2.165***
(0.318)
0.464** (0.237)
0.605*** (0.160)
Govefi 0.110
(0.911) 0.568
(0.870) 0.734
(0.520) 0.620
(0.503) 0.098
(1.160) 0.320
(1.121) 0.239
(1.992) 0.278
(1.900) 1.1085 (1.188)
1.412 (1.164)
-2.518*** (0.564)
-2.519*** (0.553)
Plsti -0.341 (0.690)
-0.186 (0.676)
0.188 (0.260)
0.161 (0.251)
-0.901 (0.503)
-0.523 (0.478)
-0.847 (0.867)
-0.51 (0.713)
-1.972** (0.636)
-1.706** (0.662)
-0.363 (0.281)
-0.218 (0.252)
DISTij 0 -0.0001 (0.0001)
0 -0.0001
(0.00006) 0
0.0001** (0.00007)
0 0.0003
(0.0001) 0 0.0001
(0.0001) 0
-0.0002*** (0.00007)
Colanij 0 -0.717 (0.688)
0 0.470
(0.408) 0
-0.855 (0.682)
0 0.062
(1.033) 0 -0.005
(0.835) 0
0.839** (0.477)
Colhiij 0 3.376** (0.796)
0 2.445*** (0.606) 0
1.535** (0.871) 0
8.158*** (1.097)
0 2.004** (0.988)
0 4.023*** (0.636)
Constant -13.558 (8.907)
-2.035 (3.564)
-1.467 (6.192)
-3.910 (2.399)
-19.783 (12.066)
4.504 (4.294)
0.801 (28.317)
3.775 (6.549)
22.139 (21.324)
10.733** (5.053)
-25.998 (8.696)
-16.630*** (3.00)
N 273 273 842 842 360 360 336 336 426 426 733 733
R-squared(overall) 0.2127 0.2788 0.2201 0.2745 0.1417 0.2139 0.0362 0.2051 0.0011 0.0543 0.1708 0.3177
Robust standard errors in parentheses , ***1% significance level, **5% significance level, *10% significance level 18- Cocoa and cocoa preparations 44- Wood and articles of wood, wood charcoal 52- Cotton 30- Pharmaceutical products
10-Cereals 3- Fish, crustaceans, molluscs, aquatic invertebrates
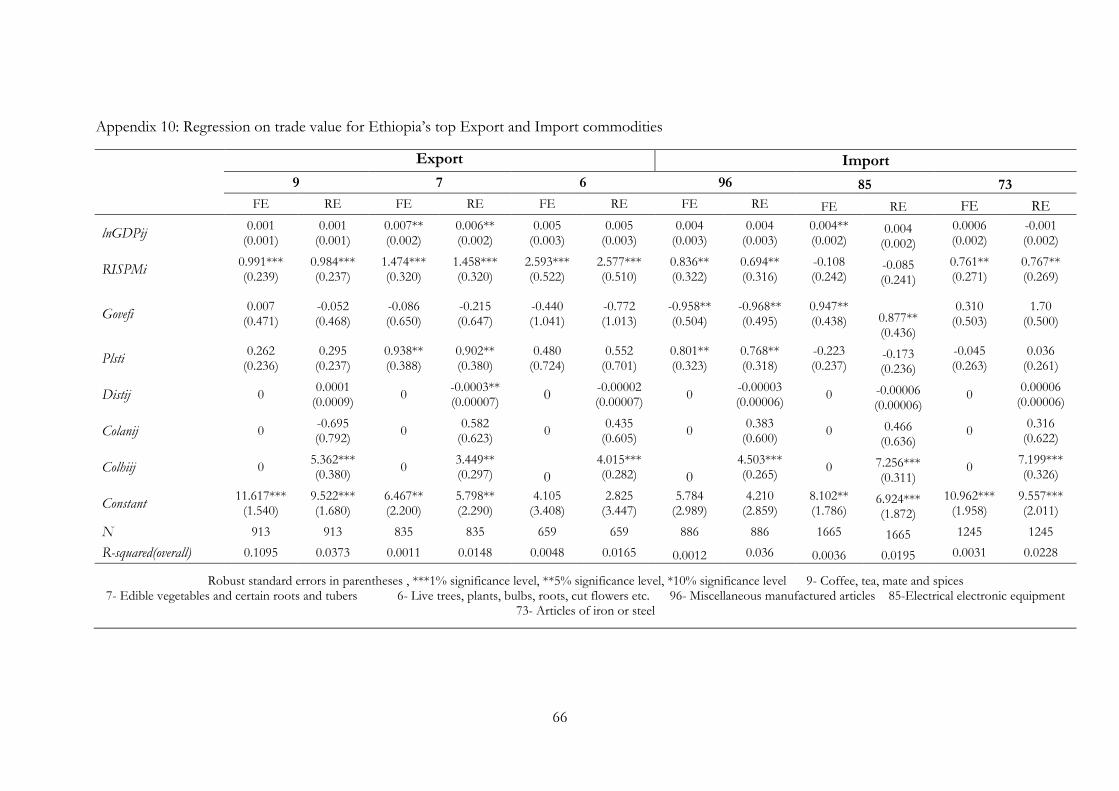
66
Appendix 10: Regression on trade value for Ethiopia’s top Export and Import commodities
Export Import
9 7 6 96 85 73
FE RE FE RE FE RE FE RE FE RE FE RE
lnGDPij 0.001
(0.001) 0.001
(0.001) 0.007** (0.002)
0.006** (0.002)
0.005 (0.003)
0.005 (0.003)
0.004 (0.003)
0.004 (0.003)
0.004** (0.002)
0.004 (0.002)
0.0006 (0.002)
-0.001 (0.002)
RISPMi 0.991*** (0.239)
0.984*** (0.237)
1.474*** (0.320)
1.458*** (0.320)
2.593*** (0.522)
2.577*** (0.510)
0.836** (0.322)
0.694** (0.316)
-0.108 (0.242)
-0.085 (0.241)
0.761** (0.271)
0.767** (0.269)
Govefi 0.007
(0.471) -0.052 (0.468)
-0.086 (0.650)
-0.215 (0.647)
-0.440 (1.041)
-0.772 (1.013)
-0.958** (0.504)
-0.968** (0.495)
0.947** (0.438) 0.877**
(0.436)
0.310 (0.503)
1.70 (0.500)
Plsti 0.262
(0.236) 0.295
(0.237) 0.938** (0.388)
0.902** (0.380)
0.480 (0.724)
0.552 (0.701)
0.801** (0.323)
0.768** (0.318)
-0.223 (0.237)
-0.173 (0.236)
-0.045 (0.263)
0.036 (0.261)
Distij 0 0.0001
(0.0009) 0
-0.0003** (0.00007)
0 -0.00002 (0.00007)
0 -0.00003 (0.00006)
0 -0.00006 (0.00006)
0 0.00006
(0.00006)
Colanij 0 -0.695 (0.792)
0 0.582
(0.623) 0
0.435 (0.605)
0 0.383
(0.600) 0 0.466
(0.636) 0
0.316 (0.622)
Colhiij 0 5.362*** (0.380)
0 3.449** (0.297) 0
4.015*** (0.282) 0
4.503*** (0.265)
0 7.256*** (0.311)
0 7.199*** (0.326)
Constant 11.617***
(1.540) 9.522*** (1.680)
6.467** (2.200)
5.798** (2.290)
4.105 (3.408)
2.825 (3.447)
5.784 (2.989)
4.210 (2.859)
8.102** (1.786)
6.924*** (1.872)
10.962*** (1.958)
9.557*** (2.011)
N 913 913 835 835 659 659 886 886 1665 1665 1245 1245
R-squared(overall) 0.1095 0.0373 0.0011 0.0148 0.0048 0.0165 0.0012 0.036 0.0036 0.0195 0.0031 0.0228
Robust standard errors in parentheses , ***1% significance level, **5% significance level, *10% significance level 9- Coffee, tea, mate and spices 7- Edible vegetables and certain roots and tubers 6- Live trees, plants, bulbs, roots, cut flowers etc. 96- Miscellaneous manufactured articles 85-Electrical electronic equipment
73- Articles of iron or steel

67
Appendix 11: Regression on trade value for Kenya’s top Export and Import commodities
Export Import
9 6 7 96 85 39
FE RE FE RE FE RE FE RE FE RE FE RE
lnGDPij 0.019**
(0.1) 0.028*** (0.004)
0.74*** (0.014)
0.035*** (0.003)
0.054** (0.017)
0.024*** (0.003)
0.034** (0.018)
0.041*** (0.006)
0.074*** (0.012)
0.055*** (0.003)
0.034** (0.015)
0.054*** (0.004)
RISPMi 0.040
(0.148) -0.069 (0.12)
0.014 (0.196)
0.461** (0.152)
-0.320 (0.228)
0.08 (0.159)
-0.431 (0.356)
-0.618** (0.266)
-0.1 (0.179)
0.1 (0.136)
0.066 (0.227)
-0.274** (0.161)
Govefi 4.987*** (0.904)
4.816*** (0.896)
1.126 (1.022)
1.319 (0.989)
1.522 (1.283)
1.995 (1.348)
2.344 (1.819)
1.935 (1.830)
1.558 (1.163)
1.643 (1.161)
2.229 (1.417)
1.939 (1.396)
Plsti -1.011** (0.437)
-0.902** (0.429)
-0.427 (0.485)
-0.63 (0.467)
-1.155** (0.608)
-1.450** (0.618)
0.069 (0.777)
0.027 (0.784)
-0.318 (0.656)
-0.366 (0.635)
-0.599 (0.669)
-0.522 (0.643)
Distij 0 -0.0001
(0.00007) 0
-0.0001*** (0.00004)
0 -0.0002*** (0.00003)
0 0.0001
(0.00009) 0 -0.0001**
(0.00005) 0
-0.0002*** (0.00006)
Colangij 0 0.543
(0.505) 0
0.721** (0.353)
0 0.813** (0.304)
0 1.081** (0.536)
0 1.996*** (0.3981)
0 0.670
(0.451)
Colhiij 0 3.517*** (0.639)
0 4.232*** (0.492) 0
5.956*** (0.451) 0
1.541** (0.661)
0 0.358 (0.465)
0 0.370
(0.558)
Constant 3.253
(6.082) -1.923 (2.423)
32.862*** (8.342)
-9.905*** (2.086)
-22.057 (10.138)
-3.899 (1.817)
-10.096 (11.354)
-14.547 (3.518)
-31.956** (7.302) 20.486***
-8.364 (8.945)
-19.482*** (2.505)
N 893 893 954 954 705 705 619 619 1050 1050 897 897
R-squared(overall) 0.2171 0.2561 0.3068 0.3856 0.2043 0.3466 0.2473 0.3141 0.4516 0.4899 0.3813 0.4761
Robust standard errors in parentheses , ***1% significance level, **5% significance level, *10% significance level 9- Coffee, tea, mate and spices 7- Edible vegetables and certain roots and tubers 6- Live trees, plants, bulbs, roots, cut flowers etc. 96- Miscellaneous manufactured articles 85-Electrical electronic equipment 39-
Plastics and articles thereof
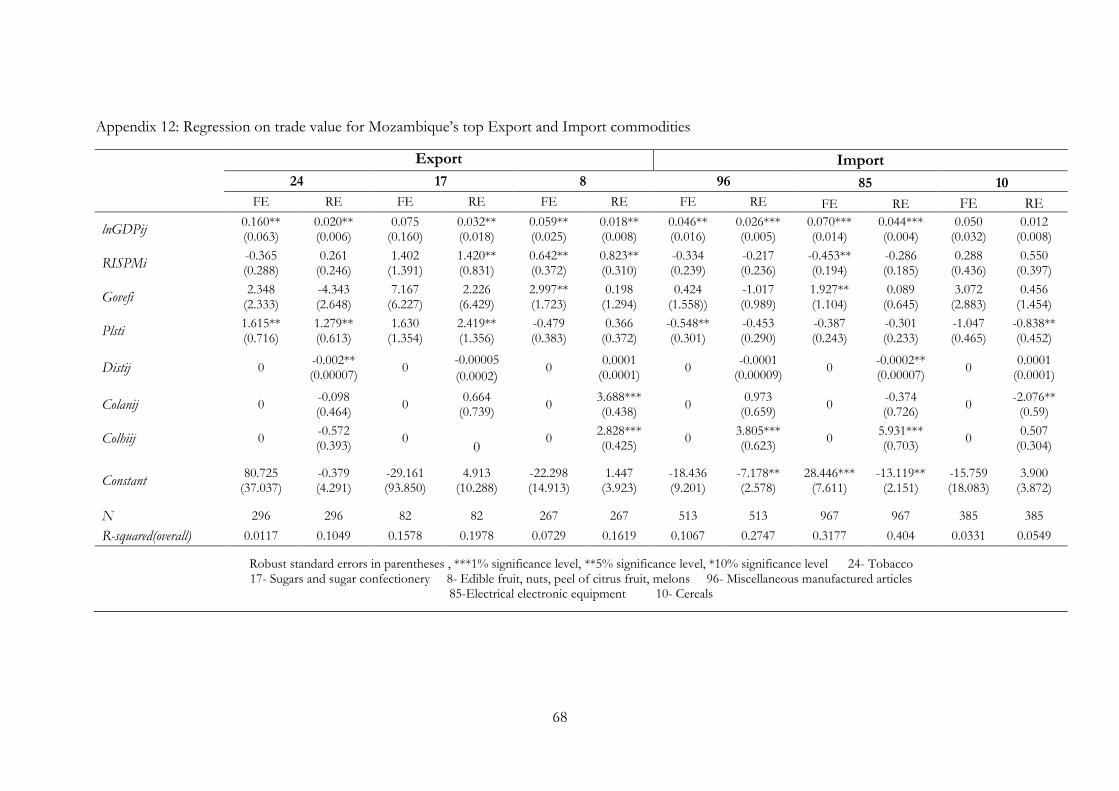
68
Appendix 12: Regression on trade value for Mozambique’s top Export and Import commodities
Export Import
24 17 8 96 85 10
FE RE FE RE FE RE FE RE FE RE FE RE
lnGDPij 0.160** (0.063)
0.020** (0.006)
0.075 (0.160)
0.032** (0.018)
0.059** (0.025)
0.018** (0.008)
0.046** (0.016)
0.026*** (0.005)
0.070*** (0.014)
0.044*** (0.004)
0.050 (0.032)
0.012 (0.008)
RISPMi -0.365 (0.288)
0.261 (0.246)
1.402 (1.391)
1.420** (0.831)
0.642** (0.372)
0.823** (0.310)
-0.334 (0.239)
-0.217 (0.236)
-0.453** (0.194)
-0.286 (0.185)
0.288 (0.436)
0.550 (0.397)
Govefi 2.348
(2.333) -4.343 (2.648)
7.167 (6.227)
2.226 (6.429)
2.997** (1.723)
0.198 (1.294)
0.424 (1.558))
-1.017 (0.989)
1.927** (1.104)
0.089 (0.645)
3.072 (2.883)
0.456 (1.454)
Plsti 1.615** (0.716)
1.279** (0.613)
1.630 (1.354)
2.419** (1.356)
-0.479 (0.383)
0.366 (0.372)
-0.548** (0.301)
-0.453 (0.290)
-0.387 (0.243)
-0.301 (0.233)
-1.047 (0.465)
-0.838** (0.452)
Distij 0 -0.002** (0.00007)
0 -0.00005
(0.0002) 0
0.0001 (0.0001)
0 -0.0001
(0.00009) 0
-0.0002** (0.00007)
0 0.0001
(0.0001)
Colanij 0 -0.098 (0.464)
0 0.664
(0.739) 0
3.688*** (0.438)
0 0.973
(0.659) 0
-0.374 (0.726)
0 -2.076**
(0.59)
Colhiij 0 -0.572 (0.393)
0 0
0 2.828*** (0.425)
0 3.805*** (0.623)
0 5.931*** (0.703)
0 0.507
(0.304)
Constant 80.725
(37.037) -0.379 (4.291)
-29.161 (93.850)
4.913 (10.288)
-22.298 (14.913)
1.447 (3.923)
-18.436 (9.201)
-7.178** (2.578)
28.446*** (7.611)
-13.119** (2.151)
-15.759 (18.083)
3.900 (3.872)
N 296 296 82 82 267 267 513 513 967 967 385 385
R-squared(overall) 0.0117 0.1049 0.1578 0.1978 0.0729 0.1619 0.1067 0.2747 0.3177 0.404 0.0331 0.0549
Robust standard errors in parentheses , ***1% significance level, **5% significance level, *10% significance level 24- Tobacco 17- Sugars and sugar confectionery 8- Edible fruit, nuts, peel of citrus fruit, melons 96- Miscellaneous manufactured articles
85-Electrical electronic equipment 10- Cereals

69
HS Code Label
02 Meat and edible meat offal
03 Fish and crustaceans, molluscs and other aquatic invertebrates
04 Dairy produce; birds' eggs; natural honey; edible products of animal origin, not elsewhere specified or included.
05 Products of animal origin, not elsewhere specified or included
06 Live trees and other plants; bulbs, roots and the like; cut flowers and ornamental foliage
07 Edible vegetables and certain roots and tubers
08 Edible fruit and nuts; peel of citrus fruit or melons.
09 Coffee, tea, mate and spices.
10 Cereals
11 Products of the milling industry; malt; starches; inulin; wheat gluten
12 Oil seeds and oleaginous fruits; miscellaneous grains, seeds and fruit; industrial or medicinal plants; straw and fodder
13 Lac; gums, resins and other vegetable saps and extracts
14 Vegetable plaiting materials; vegetable products not elsewhere specified or included
15 Animal or vegetable fats and oils and their cleavage products; prepared edible fats; animal or vegetable waxes
16 Preparations of meat, of fish or of crustaceans, molluscs or other aquatic invertebrates
17 Sugars and sugar confectionery
18 Cocoa and cocoa preparations
19 Preparations of cereals, flour, starch or milk; pastry cooks' products
20 Preparations of vegetables, fruit, nuts or other parts of plants
21 Miscellaneous edible preparations
22 Beverages, spirits and vinegar
23 Residues and waste from the food industries; prepared animal fodder
24 Tobacco and manufactured tobacco substitutes
25 Salt; sulphur; earths and stone; plastering materials, lime and cement
26 Ores, slag and ash
27 Mineral fuels, mineral oils and products of their distillation; bituminous substances; mineral waxes.
28 Inorganic chemicals; organic or inorganic compounds of precious metals, of rare-earth metals, of radioactive elements or of isotopes
29 Organic chemicals
30 Pharmaceutical products
31 Fertilisers
32 Tanning or dyeing extracts; tannins and their derivatives
33 Essential oils and resinoids; perfumery, cosmetic or toilet preparations
34
Soap, organic surface-active agents, washing preparations, lubricating preparations, artificial waxes, prepared waxes, polishing or scouring preparations, candles and similar articles, modelling pastes, "dental waxes" and dental preparations with a basis of plaster.
Appendix 13: List of selected commodity group

70
Appendix 13: (Continued)
HS Code Label
35 Albuminoidal substances; modified starches; glues; enzymes
36 Explosives; pyrotechnic products; matches; pyrophoric alloys; certain combustible preparations
37 Photographic or cinematographic goods 38 Miscellaneous chemical products 39 Plastics and articles thereof 40 Rubber and articles thereof 41 Raw hides and skins (other than furskins) and leather
42 Articles of leather; saddlery and harness; travel goods, handbags and similar containers; articles of animal gut (other than silk-worm gut).
43 Furskins and artificial fur; manufactures thereof 44 Wood and articles of wood; wood charcoal, 45 Cork and articles of cork.
46 Manufactures of straw, of esparto or of other plaiting materials; basketware and wickerwork.
47 Pulp of wood or of other fibrous cellulosic material; recovered (waste and scrap) paper or paperboard
48 Paper and paperboard; articles of paper pulp, of paper or of paperboard
49 Printed books, newspapers, pictures and other products of the printing industry; manuscripts, typescripts and plans
50 Silk 51 Wool, fine or coarse animal hair; horsehair yarn and woven fabric 52 Cotton 53 Other vegetable textile fibres; paper yarn and woven fabrics of paper yarn 54 Man-made filaments 55 Man-made staple fibres
56 Wadding, felt and nonwovens; special yarns; twine, cordage, ropes and cables and articles thereof
57 Carpets and other textile floor coverings 58 Special woven fabrics; tufted textile fabrics; lace; tapestries; trimmings; embroidery
59 Impregnated, coated, covered or laminated textile fabrics; textile articles of a kind suitable for industrial use
60 Knitted or crocheted fabrics 61 Articles of apparel and clothing accessories knitted or crocheted. 62 Articles of apparel and clothing accessories, not knitted or crocheted 63 Other made up textile articles; sets; worn clothing and worn textile articles; rags 64 Footwear, gaiters and the like; parts of such articles, 65 Headgear and parts thereof
66 Umbrellas, sun umbrellas, walking-sticks, seat-sticks, whips, riding-crops and parts thereof
67 Prepared feathers and down and articles made of feathers or of down; artificial flowers; articles of human hair
68 Articles of stone, plaster, cement, asbestos, mica or similar materials 69 Ceramic products 70 Glass and glassware

71
Appendix 13: (Continued)
HS Code Label
71 Natural or cultured pearls, precious or semi-precious stones, precious metals, metals clad with precious metal and articles thereof; imitation, jewellery; coin
72 Iron and steel
73 Articles of iron or steel
74 Copper and articles thereof
75 Nickel and articles thereof
76 Aluminium and articles thereof
78 Lead and articles thereof
79 Zinc and articles thereof
80 Tin and articles thereof
81 Other base metals; cermets; articles thereof
82 Tools, implements, cutlery, spoons and forks, of base metal; parts thereof of base metal
83 Miscellaneous articles of base metal
84 Nuclear reactors, boilers, machinery and mechanical appliances; parts thereof
85 Electrical machinery and equipment and parts thereof; sound recorders and reproducers, television image and sound recorders and reproducers, and parts and accessories of such articles
86 Railway or tramway locomotives, rolling-stock and parts thereat railway or tramway track fixtures and fittings and parts thereof; mechanical (including electro-mechanical) traffic signalling equipment of all kinds.
87 Vehicles other than railway or tramway rolling-stock, and parts and accessories thereof
88 Aircraft, spacecraft, and parts thereof
89 Ships, boats and floating structures
90 Optical, photographic, cinematographic, measuring, checking, precision, medical or surgical instruments and apparatus ; parts and accessories thereof
91 Clocks and watches and parts thereof
92 Musical instruments; parts and accessories of such articles
93 Arms and ammunition; parts and accessories thereof
94
Furniture; bedding, mattresses, mattress supports, cushions and similar stuffed furnishings; lamps and lighting fittings, not elsewhere specified or included; illuminated signs, illuminated nameplates and the like; prefabricated buildings
95 Toys, games and sports requisites; parts and accessories thereof
96 Miscellaneous manufactured articles.
97 Works of art, collectors' pieces and antiques
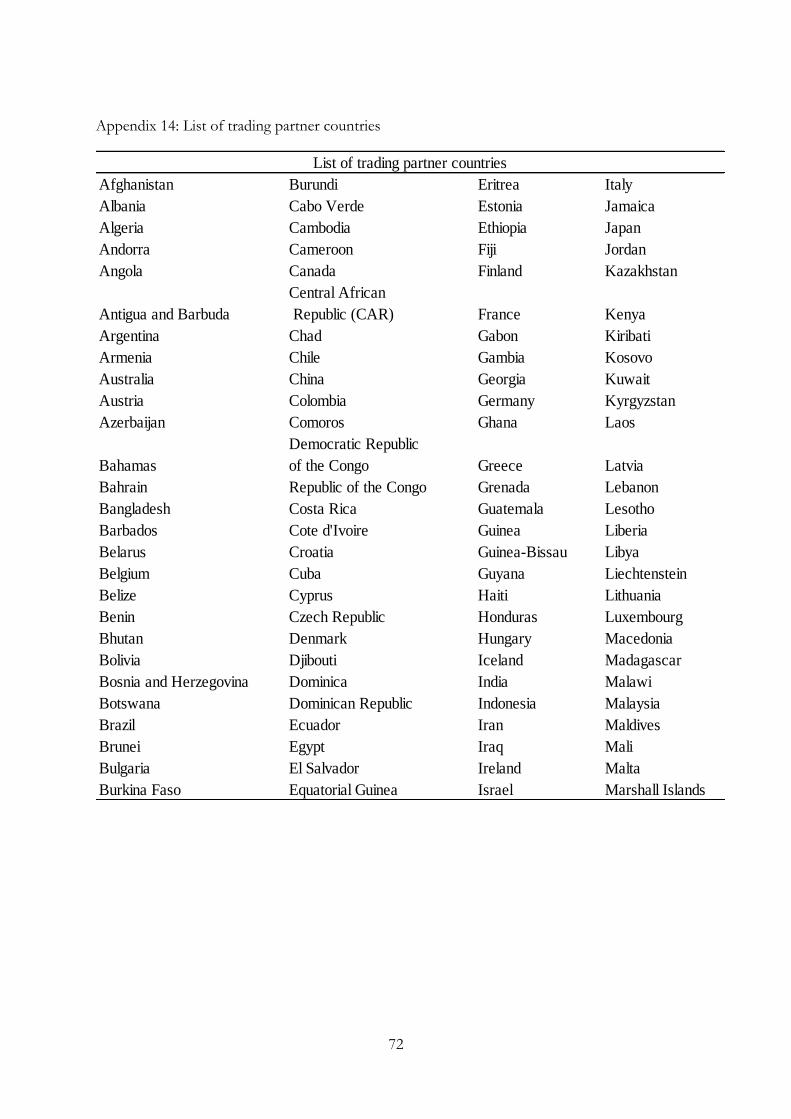
72
Appendix 14: List of trading partner countries
Afghanistan Burundi Eritrea Italy
Albania Cabo Verde Estonia Jamaica
Algeria Cambodia Ethiopia Japan
Andorra Cameroon Fiji Jordan
Angola Canada Finland Kazakhstan
Antigua and Barbuda
Central African
Republic (CAR) France Kenya
Argentina Chad Gabon Kiribati
Armenia Chile Gambia Kosovo
Australia China Georgia Kuwait
Austria Colombia Germany Kyrgyzstan
Azerbaijan Comoros Ghana Laos
Bahamas
Democratic Republic
of the Congo Greece Latvia
Bahrain Republic of the Congo Grenada Lebanon
Bangladesh Costa Rica Guatemala Lesotho
Barbados Cote d'Ivoire Guinea Liberia
Belarus Croatia Guinea-Bissau Libya
Belgium Cuba Guyana Liechtenstein
Belize Cyprus Haiti Lithuania
Benin Czech Republic Honduras Luxembourg
Bhutan Denmark Hungary Macedonia
Bolivia Djibouti Iceland Madagascar
Bosnia and Herzegovina Dominica India Malawi
Botswana Dominican Republic Indonesia Malaysia
Brazil Ecuador Iran Maldives
Brunei Egypt Iraq Mali
Bulgaria El Salvador Ireland Malta
Burkina Faso Equatorial Guinea Israel Marshall Islands
List of trading partner countries
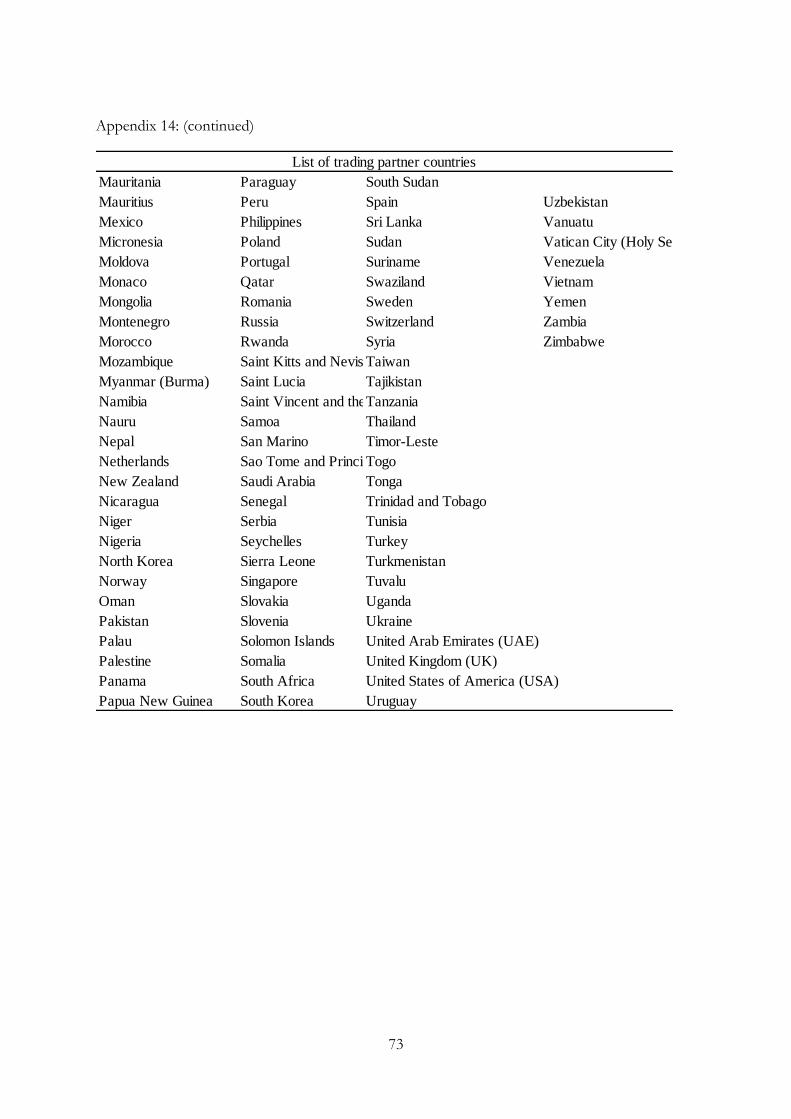
73
Appendix 14: (continued)
Mauritania Paraguay South Sudan
Mauritius Peru Spain Uzbekistan
Mexico Philippines Sri Lanka Vanuatu
Micronesia Poland Sudan Vatican City (Holy See)
Moldova Portugal Suriname Venezuela
Monaco Qatar Swaziland Vietnam
Mongolia Romania Sweden Yemen
Montenegro Russia Switzerland Zambia
Morocco Rwanda Syria Zimbabwe
Mozambique Saint Kitts and Nevis Taiwan
Myanmar (Burma) Saint Lucia Tajikistan
Namibia Saint Vincent and the GrenadinesTanzania
Nauru Samoa Thailand
Nepal San Marino Timor-Leste
Netherlands Sao Tome and PrincipeTogo
New Zealand Saudi Arabia Tonga
Nicaragua Senegal Trinidad and Tobago
Niger Serbia Tunisia
Nigeria Seychelles Turkey
North Korea Sierra Leone Turkmenistan
Norway Singapore Tuvalu
Oman Slovakia Uganda
Pakistan Slovenia Ukraine
Palau Solomon Islands United Arab Emirates (UAE)
Palestine Somalia United Kingdom (UK)
Panama South Africa United States of America (USA)
Papua New Guinea South Korea Uruguay
List of trading partner countries

74