the impact of ‘load-shedding’ within the nelson …
TRANSCRIPT

TAMSYN BOTHA
15 008 221
THE IMPACT OF ‘LOAD-SHEDDING’ WITHIN THE
NELSON MANDELA BAY RESTAURANT INDUSTRY
RESEARCH REPORT
RESM8419P
CAROLE BALDIE
HONOURS IN BUSINESS MANAGEMENT
WORD COUNT: 11 910
I hereby declare that the Research Report submitted for the IIE Honours in Business
Management degree to The Independent Institute of Education is my own work and has
not previously been submitted to another University or Higher Education Institution for
degree purposes.

ABSTRACT
Eskom’s supply of electricity serves as an imperative input for many business operations in
South Africa, presenting the problem analysed in this study. Since the implementation of
‘load-shedding’ in 2008, many small businesses have struggled to reach their maximum
productivity as research states they do not possess the resources to mitigate the effects of
‘load-shedding’, hindering their ability to survive. South Africa’s economic growth and
development is highly reliant on the productivity and survival of small enterprises. The
primary objective of this study is to evaluate the impact ‘load-shedding’ has on the
productivity of restaurants, within Nelson Mandela Bay. This study provides a quantitative
approach towards, whether there is an impact of ‘load-shedding’ amongst restaurants, how
their inputs and outputs are impacted and what mitigation techniques they have
implemented. Questionnaires were developed, administrated, collected and evaluated by
the researcher, to a sample of 20 respondents. This data produced significant findings of
73% of respondents identifying ‘load-shedding’ as a major concern and contrary to small
enterprises lacking in resources, 93% of respondents invested into a secondary energy
source to alleviate ‘load-shedding’ impacts. The study’s key contribution aimed to
understand the negative impact of ‘load-shedding and the most popular mitigation
technique.

ii
TABLE OF CONTENTS
1. INTRODUCTION ......................................................................................................... 1
1.1 CONTEXTUALISATION ......................................................................................................... 2
1.2 RATIONALE ......................................................................................................................... 4
1.3 PROBLEM STATEMENT ....................................................................................................... 5
1.4 PURPOSE STATEMENT ........................................................................................................ 5
1.5 RESEARCH QUESTIONS AND OBJECTIVES ........................................................................... 5
2. LITERATURE REVIEW ................................................................................................ 7
2.1 CONCEPTUALISATION ......................................................................................................... 7
2.2 THEORETICAL FOUNDATION ............................................................................................... 8
2.2.1 INPUT - PROCESS - OUTPUT MODEL ............................................................................... 9
2.2.2 SERVICE PRODUCTIVITY MODEL ..................................................................................... 9
2.3 THE PROBLEM BEING INVESTIGATED ............................................................................... 10
2.3.1 THE REASON FOR ‘LOAD-SHEDDING’ ............................................................................ 10
2.3.2 THE IMPORTANCE OF ELECTRICITY ............................................................................... 11
2.3.3 THE IMPACT ON RESTAURANTS INPUTS ....................................................................... 12
2.3.4 THE IMPACT ON RESTAURANTS OUTPUTS ................................................................... 13
2.3.5 THE TECHNIQUES IMPLEMENTED TO MITIGATE THE EFFECTS OF ‘LOAD-SHEDDING’ . 14
3. RESEARCH DESIGN AND METHODOLOGY ........................................................... 15
3.1 PARADIGM ........................................................................................................................ 15
3.3 RESEARCH APPROACH AND DESIGN ................................................................................. 16
3.4 POPULATION ..................................................................................................................... 17
3.5 SAMPLING METHOD ......................................................................................................... 18
3.6 DATA COLLECTION METHODS .......................................................................................... 18
3.7 DATA ANALYSIS METHODS ............................................................................................... 19
4. FINDINGS ................................................................................................................... 21

iii
4.1 PRESENTATION AND INTERPRETATION OF FINDINGS ...................................................... 21
4.1.1 SMALL, MEDIUM AND MICRO ENTERPRISES ................................................................ 21
4.1.2 AVERAGE HOURS RESTAURANTS EXPERIENCE ‘LOAD-SHEDDING’ ............................... 22
4.1.2 ‘LOAD-SHEDDING’ AS A MAJOR CONCERN ................................................................... 23
4.1.3 THE IMPACTS ON RESTAURANT INPUTS ....................................................................... 24
4.1.4 RESTAURANTS MOST CHALLENGING IMPACTS ............................................................ 25
4.1.5 CUSTOMER TRAFFIC AS AN OUTPUT ............................................................................ 26
4.1.6 SERVICE DELIVERY AS AN OUTPUT ............................................................................... 27
4.1.6 REVENUE AS AN OUTPUT ............................................................................................. 28
4.1.7 SECONDARY ENERGY SOURCE ...................................................................................... 29
4.1.8 DIFFERENT TYPES OF SECONDARY ENERGY SOURCES .................................................. 30
4.1.9 STRATEGIES TAKEN TO MITIGATE THE EFFECTS OF ‘LOAD-SHEDDING’ ........................ 31
4.1.10 POSITIVE OUTCOMES OF ‘LOAD-SHEDDING’ ................................................................ 33
4.2 RELIABILITY AND VALIDITY OF THIS STUDY ....................................................................... 34
5. CONCLUSION ............................................................................................................ 36
5.1 DISCUSSION OF RESEARCH QUESTIONS AND OBJECTIVES ............................................... 36
5.1.1 DOES ‘LOAD-SHEDDING’ HAVE AN IMPACT ON RESTAURANTS WITHIN NMB? ........... 36
5.1.2 WHAT INPUTS HAVE BEEN AFFECTED BY ‘LOAD-SHEDDING’ ...................................... 36
5.1.3 WHAT OUTPUTS HAVE BEEN AFFECTED BY ‘LOAD-SHEDDING’? ................................. 37
5.1.4 WHAT TECHNIQUES COULD RESTAURANTS IMPLEMENT TO MANAGE THE IMPACTS
OF ‘LOAD-SHEDDING’? ................................................................................................ 38
5.1.5 WHAT IS THE IMPACT OF ‘LOAD-SHEDDING’ ON PRODUCTIVITY WITHIN THE
RESTAURANT INDUSTRY, IN NMB? ............................................................................... 38
5.2 IMPLICATIONS OF FUTURE FINDINGS ............................................................................... 39
5.3 RECOMMENDATIONS FOR FUTURE FINDINGS ................................................................. 39
5.4 ETHICAL CONCIDERATIONS .............................................................................................. 40
5.5 LIMITATIONS ..................................................................................................................... 40
6. REFERENCE LIST ..................................................................................................... 41
7. ANNEXURES .............................................................................................................. 46

iv
7.1 ANNEXTURE: QUESTIONNAIRE .............................................................................. 46
7.2 ANNEXTURE: ETHICS CLEARANCE LETTER ..................................................... 51
7.3 ANNEXTURE: ORIGINALITY REPORT ..................................................................... 52
7.5: ANNEXTURE: THE FINAL RESEARCH REPORT SUMMARY DOCUMENT ........... 53
7.5 ANNEXTURE: REVISED SHEDULE 1 OF THE NATIONAL DEFINITION OF SMALL
ENTERPRISE IN SOUTH AFRICA .................................................................................... 54
FIGURES:
FIGURE 1: THE LINEAR DEPICTION OF PRODUCTIVITY AND FIRM PRODUCTION (SCERRI, 2015: 57) 9
FIGURE 2: ADOPTED BY (SAUNDERS & TOSEY, 2013: 59) ....................................................... 16
FIGURE 3: PERCENTAGE OF SMALL, MEDIUM & MICRO ENTERPRISES IN THIS STUDY. ................ 21
FIGURE 4: THE PERCENTAGE OF RESTAURANTS CONSIDERING ‘LOAD-SHEDDING’ A MAJOR CONCERN.
.................................................................................................................................... 23
FIGURE 5: THE LEVEL OF IMPACT ON RESTAURANTS INPUTS. .................................................... 24
FIGURE 6: THE EFFECT OF ‘LOAD-SHEDDING’ ON NUMBER OF CUSTOMERS. ............................... 26
FIGURE 7 :COMPARISON OF RESTAURANTS ABILITY TO OFFER A SERVICE DURING 'LOAD-SHEDDING'
AND IN THE ABSENCE OF 'LOAD-SHEDDING' ...................................................................... 27
FIGURE 8: REVENUE AS AN OUTPUT ....................................................................................... 29
FIGURE 9: PERCENTAGE OF RESTAURANTS INVESTED IN A SECONDARY ENERGY SOURCE. ......... 30
FIGURE 10: PERCENTAGE OF ALTERNATIVE ENERGY SOURCES USED BY RESTAURANTS. ............ 30
FIGURE 11: THE COST OF INVESTING IN A SECONDARY ENERGY SOURCE COMPARED TO RELIABLE AN
ENERGY SOURCE ........................................................................................................... 31
FIGURE 12: ACTIONS TAKEN BY RESTAURANTS TO COPE WITH THE EFFECTS OF 'LOAD-SHEDDING'
.................................................................................................................................... 32
FIGURE 13: ALTERNATIVE TECHNIQUES OF COPING WITH 'LOAD-SHEDDING' ............................... 33
FIGURE 14: THE PERCENTAGE OF POSITIVE OUTCOMES FROM 'LOAD-SHEDDING'. ...................... 34
TABLES:
TABLE 1: THE NEW NATIONAL SMALL ENTERPRISE ACT THRESHOLDS FOR DEFINING ENTERPRISE
SIZE CLASSES BY SECTOR ................................................................................................ 3

v
TABLE 2: RESEARCH QUESTIONS AND OBJECTIVES ................................................................... 6
TABLE 3: CONCEPTS WITHIN THIS STUDY .................................................................................. 8
TABLE 4: THE AVERAGE HOURS RESTAURANTS EXPERIENCED ‘LOAD-SHEDDING’ ........................ 22
TABLE 5: RESTAURANTS MOST CHALLENGING IMPACT OF 'LOAD-SHEDDING' ............................... 25

1. INTRODUCTION
Approximately 95% of South Africa’s (SA’s) electricity is generated by a public utility known
as, Eskom (Eskom, 2019). Eskom is the primary energy supplier for the country, by
monopolising the SA market. Eskom was originally identified as ‘The Electricity Supply
Commission’ (Escom) until its name was changed to Eskom, in 1987. Escom was
established in 1922 by the South African government, through the Electricity Act of 1922.
The Electricity Act No. 42 of 1992, reads as follows: “To efficiently, effectively and
sustainably supply electricity to the people of the country, with the main intent to ensure that
the present and future needs and interests of electricity customers and users are satisfied ”
(Steenkamp et al, 2016: 70).
In the year of 2001, Eskom was termed ‘the Financial Times Power Company of the year’
at the Global Energy Awards Ceremony in New York, illustrating their compliance to The
Electricity Act. This award was granted as a result of Eskom successfully offering the world’s
lowest-cost electricity, while creating excellent technological innovations, growing
transmission system reliability, and emerging economic, efficient and safe methods for
combustion of low-grade coal (Du Toit, 2019).
However, Eskom failed to continue to live up to the Electricity Act as they currently find
themselves in crippling debt levels of R430 billion, representing 15% of SA total debt.
According to Pravin Gordhan, the minister of public enterprises, the utilities debt is owed to
a substantial loss of critical skills, poor quality of maintenance and inadequate workmanship,
resulting in break-downs, of which 40% is owed to human errors (Du Toit, 2019). These
break-downs have given rise to a unique expression regularly used in SA, known as ‘load-
shedding’ (Steenkamp et al, 2016: 70).
‘Load-shedding’ is implemented to relieve stress on Eskom when the demand for electricity
is greater than the supply. It often occurs with or without prior warning to the consumer.
Eskom applies ‘load-shedding’ by stopping the electricity distribution throughout particular
areas for a short period of time, involving businesses and households. This is referred to as
‘rolling blackouts’ in other countries (Rouse, 2019). Energy analyst, Chris Yellend stated
that ‘load-shedding’ (unserved energy) costs the country R1 billion per stage, per day
(Business Tech, 2019).

2
After the Second (II) World War, the demand for electricity expanded faster than the Gross
Domestic Product (GDP) and during the apartheid era the supply was mainly issued to urban
areas, leaving only 40% of the population being issued with electricity. In 1994, the
beginning of a democracy brought about change considering that both urban and rural areas
had to be supplied with electricity. At this stage the national grid was distributing to an extra
2.7 million houses, while the expansion of supply remained stagnant. By 1996, the demand
for electricity rapidly increased to 28 330 MW (Mega Watts), it was evident that the capacity
would go beyond the supply capacity of 39 000MW. Eskom first announced the possibility
of ‘load-shedding’ in 1997. Yet, no new power stations were built, therefore introducing the
beginning of ‘load-shedding’ on the 10th of January 2008 as a result of an energy crisis (Prof
Assan & Masibi, 2015: 10). Although the action of ‘Load-shedding’ was to prevent the
probability of a country-wide blackout, it has had vast impacts on the productivity of
organisations in SA (Coetzee & Els, 2016: 268-269).
1.1 CONTEXTUALISATION
Economists in SA have expressed a forewarning that the impact of ‘load-shedding’ will be
the result of small enterprises being confronted with liquidation (Prof Assan & Masibi, 2015:
3). Ado & Josiah (2015: 240) and Cissokho & Seck (2013: 7), affirm that Small, Medium and
Micro Enterprises (SMME’s) may be the most vulnerable compared to large organisations.
The reason being SMME’s lack adequate human, capital resources, financial support and
the majority aren’t able to afford back-up facilities to guarantee power supply (Ado & Josiah,
2015: 240). Minister Zulu, from the department of Small Business Development, declares
an alarming statement that 70 - 80% of SMME’s will never have the opportunity to celebrate
one year of business. As a sector, SMME’s are seen as a main driver for economic growth,
job creation and poverty alleviation, thus this failure rate should not be over-looked
(Mashimbye, 2018). Emphasising the consumption of electricity being positively correlated
with productivity and economic growth (Scott et al, 2014: 9).
The important contribution of the SMME’s sector towards economic growth and
development is recognised internationally, however defining an SMME is a challenge,
seeing that every country has their own definition. Organisations differ in various areas of
capitalisation, sales and employment, resulting in no single consistently accepted definition
of small firms (Le Fleur et al, 2014: 6). For the purpose of this study, Lindiwe Zulu’s recently
amended definition of small enterprises will be utilised (Zulu, 2019: 110). It reads as follows:
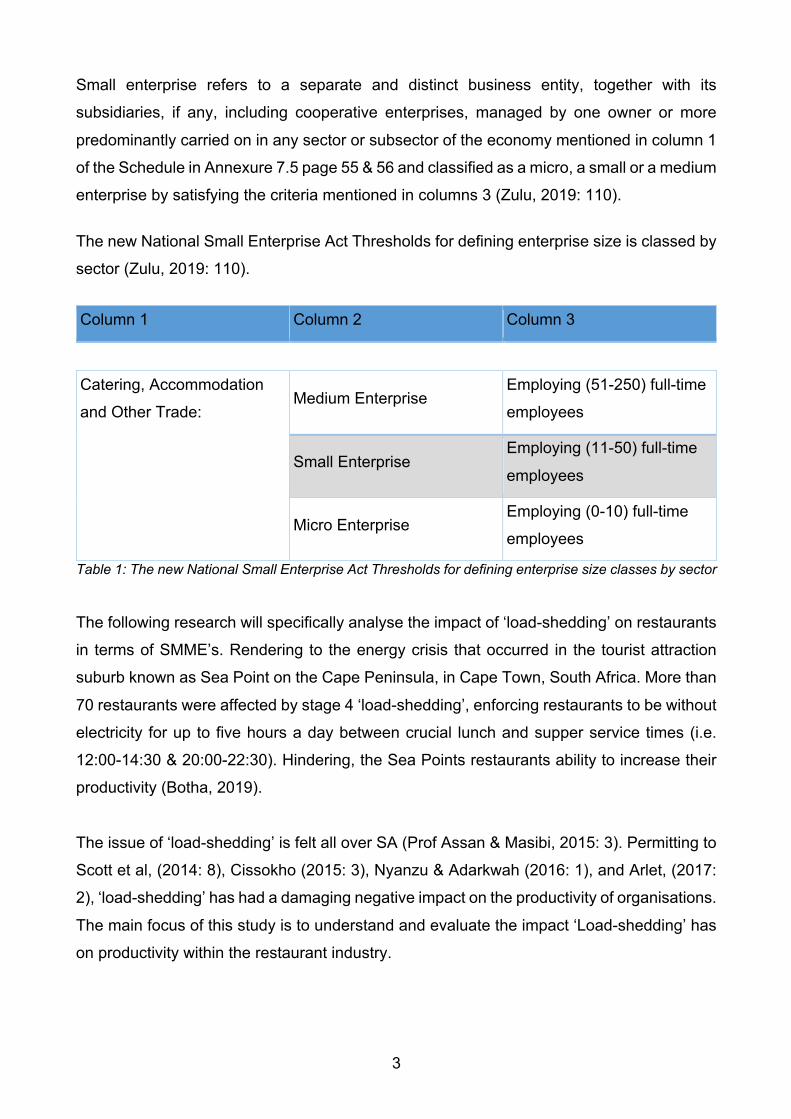
3
Small enterprise refers to a separate and distinct business entity, together with its
subsidiaries, if any, including cooperative enterprises, managed by one owner or more
predominantly carried on in any sector or subsector of the economy mentioned in column 1
of the Schedule in Annexure 7.5 page 55 & 56 and classified as a micro, a small or a medium
enterprise by satisfying the criteria mentioned in columns 3 (Zulu, 2019: 110).
The new National Small Enterprise Act Thresholds for defining enterprise size is classed by
sector (Zulu, 2019: 110).
Column 1 Column 2 Column 3
Catering, Accommodation
and Other Trade: Medium Enterprise
Employing (51-250) full-time
employees
Small Enterprise Employing (11-50) full-time
employees
Micro Enterprise Employing (0-10) full-time
employees
Table 1: The new National Small Enterprise Act Thresholds for defining enterprise size classes by sector
The following research will specifically analyse the impact of ‘load-shedding’ on restaurants
in terms of SMME’s. Rendering to the energy crisis that occurred in the tourist attraction
suburb known as Sea Point on the Cape Peninsula, in Cape Town, South Africa. More than
70 restaurants were affected by stage 4 ‘load-shedding’, enforcing restaurants to be without
electricity for up to five hours a day between crucial lunch and supper service times (i.e.
12:00-14:30 & 20:00-22:30). Hindering, the Sea Points restaurants ability to increase their
productivity (Botha, 2019).
The issue of ‘load-shedding’ is felt all over SA (Prof Assan & Masibi, 2015: 3). Permitting to
Scott et al, (2014: 8), Cissokho (2015: 3), Nyanzu & Adarkwah (2016: 1), and Arlet, (2017:
2), ‘load-shedding’ has had a damaging negative impact on the productivity of organisations.
The main focus of this study is to understand and evaluate the impact ‘Load-shedding’ has
on productivity within the restaurant industry.

4
1.2 RATIONALE
The term ‘Load-shedding’ is exclusive to SA yet, not the concept. According to Cissokho &
Seck (2013: 7), ‘rolling blackouts’ occur in both developed and developing countries (such
as Nigeria), nevertheless the frequency, extent and cause of ‘rolling blackouts’ differ
amongst countries. A study instigated by Arlet (2017: 2), found 80 economies from The
World Bank Enterprise surveys, reported a negative connection between ‘power outages’
and firm’s productivity. Stating the cause and extent may be different but, the outcomes are
still deemed negative towards firm’s productivity. Organisational productivity may simply be
described as the total output generated per input (House of Commons, 2018: 7). In other
words, it is the relationship between production and resources. The measure of productivity
is associated with the productive process. Therefore, if ‘load-shedding’ effects the
productive process of firms their financial results will be equally affected (Dresch et al, 2018).
SA was positioned 113 out of 115 countries in the Effective Energy Transitions Index of
2018, demonstrating their lack of sustainability (Oehsen, 2019). Productivity is of importance
to SA as a number of studies have shown that the uncertainty of reliable electricity supply
may cause businesses to hold back on investing in the growth of their firms as well as face
potential liquidation, which may result in a restriction of the economy’s growth (Von
Ketelhodt & Wöcke, 2008: 4; Ado & Josiah, 2015: 240; Arlet, 2017: 2-3; and Makgatho,
2019). For instance, in Sub-Saharan Africa the annual economic growth weakened as a
result of a delicate power utility, producing a 2% lag in growth (Arlet, 2017: 2-3).
According to Business Tech (2018) and Chance (2018), a study released by the Small
Business Institute (SBI) in partnership with the Small Business Project (SBP), stated that
98,5% of South Africa’s economy consists of SMMEs. Illustrating the significant impact, a
lack of production amongst SMME’s may have on the economic growth and development of
SA. However, SA’s SMME’s only employ 28% of the workforce which in comparison to other
countries, the contribution should be between 60 – 70% (Chance, 2018). This may be a
result of ‘load-shedding’ crippling SMME’s ability to survive, as smaller businesses typically
lack resources to buy generators to mitigate the repercussions of ‘Load-shedding’ (Arlet,
2017: 3).
5
1.3 PROBLEM STATEMENT
Eskom’s power supply serves as an indispensable input for many businesses in SA. Nearly
all business activities within a restaurant rely on the continuous and efficient flow of
electricity (Oseni, 2012: 1). According to Mhlanga (2018: 408), 62% of restaurants fail within
their first year of operation and 87% fail within their first five years. This failure rate is a result
of restaurants not capable of reaching their maximum productivity or effectively using their
time and resources. Electricity is a vital input for productivity, hence ‘load-shedding’ may
contribute to the failure rate of restaurants in SA. Not only is this a concern for all restaurant
owners (i.e. restauranteurs), but to the economy as poor productivity has a negative effect
on SA’s economic growth and development.
1.4 PURPOSE STATEMENT
The purpose of this study is to identify a relationship between ‘load-shedding’ and
restaurants productivity as well as to distinguish the mitigation techniques that restaurants
have implemented to alleviate these effects. Rendering to the unfavourable occurrence of
Sea Points energy crisis. The aim of this study is to gain a better understanding of how
restaurants productivity has been impacted by ‘load-shedding’, within the Nelson Mandela
Bay (NMB)?
1.5 RESEARCH QUESTIONS AND OBJECTIVES
To apprehend the main purpose of this study, the following sub-questions have been
constructed to assist in the analysation and answering of the main question. The main
question this study aims to respond to is: What is the impact of ‘load-shedding’ on
productivity within the restaurant industry, in NMB?
RESEARCH QUESTIONS: RESEARCH OBJECTIVES:
1. Is there an impact caused by ‘load-
shedding’ on restaurants in NMB?
1. To determine the impact of ‘load-
shedding’ on restaurants through
observing managers and owners view of
‘load-shedding’.

6
2. What inputs have been affected by
‘Load-shedding’?
2. To establish the impact of ‘load-shedding’
on restaurants inputs, such as: Staff;
Operations; Costs; Security; and
Equipment.
3. What outputs have been affected by
‘Load-shedding’?
3. To establish restaurants outputs affected
by ‘Load-shedding’ through service
delivery, revenue, and customer traffic.
4. What techniques could restaurants
implement to manage the impacts of
‘Load-shedding’?
4. To determine the techniques that have
been implemented by restaurants to
reduce the impact of ‘load-shedding’, by
employing secondary energy sources
and alternative coping actions.
Table 2: Research Questions and Objectives
This section paid much attention to familiarising the study to the reader. By discussing the
background of ‘load-shedding’, the rationale, the purpose of the study, the problem
statement and the relevant research questions and objectives of this study.

7
2. LITERATURE REVIEW
This section is intended to discover existing knowledge of what other researchers have
already discovered on this topic. The attained information ought to substantiate and develop
the current knowledge of the researcher. By investigating secondary data, the researcher
was able to identify existing impacts of ‘load-shedding’ (rolling blackouts) and acknowledge
the limited research commenced on the impact on NMB restaurants’ (Prof Assan & Masibi,
2015: 10).
2.1 CONCEPTUALISATION
These defined terms are distinguished as important to the study and will assist in the
contextual understanding.
‘LOAD-SHEDDING’: ‘Load-shedding’ is the action from Eskom of rolling power cuts
that intend to lessen the load on the power supply system when
Eskom is not able to supply the high demand of electricity (Prof
Assan & Masibi, 2015: 1). ‘Load-shedding’ has two types of
outages: Unplanned and planned
UNPLANNNED ‘LOAD-
SHEDDING’:
Periods of power cuts when the electricity supply to a particular
area (referred to as groups) is interrupted and is not scheduled.
This is often due to cable theft, weather conditions, old
infrastructure, excavation or building developments or even
illegal electricity connections (Schoeman & Saunders, 2018:
328).
PLANNED ‘LOAD-
SHEDDING’:
Periods of power cuts that occur when electricity is switched off
at a substation or area within the local grid at a scheduled time.
Often due to maintenance, emergency repairs taking place or to
relieve Eskom of the demand from customers (Schoeman &
Saunders, 2018: 328).
MITIGATION: The action of restaurants reducing the effect of ‘load-shedding’
through back-up systems or change in operations (Scott et al,
2014: 21).

8
SMALL, MEDIUM AND
MICRO ENTERPRISE
(SMME):
All restaurants that satisfy the employment criteria of a small,
medium or a medium enterprise as stipulated by Zulu (2019:
110).
- Micro Enterprise: Employing (0-10) full-time employees.
- Small Enterprise: Employing (11-50) full-time employees.
- Medium Enterprise: Employing (51-250) full-time
employees.
PRODUCTIVITY: An index that measures the output (e.g. goods and services)
generated per input (e.g. staff) in an organisation (House of
Commons, 2018: 7).
INPUTS: Raw materials (e.g. coal used in producing electricity) put in
operation to achieve the relative outputs (Yadav & Marwah,
2015).
OUTPUTS: The act of producing something, the amount of something that
is generated or the process in which something is delivered (e.g.
Produced electricity) (Yadav & Marwah, 2015).
RESTAURANT
INDUSTRY:
Restaurants ranging from fine dining establishments to quick
service casual outlets, predominantly serving food and
beverages (Tang, 2014: 7).
Table 3: Concepts within this study
2.2 THEORETICAL FOUNDATION
Thomas (2017: 232), describes a theory “as a group of related overviews that indicate new
observations, which can be empirically tested for the purpose of explaining”. Acknowledging
the topic of this study, the following productivity models have been identified to collectively
understand the problem of ‘load-shedding’ effecting restaurants productivity. Providing the
range of input factors and the nature of ‘load-shedding’s’ impact, the illustrated model is best
suited to determine the causal (cause and effects) relationship between ‘load-shedding’ and
restaurants productivity (Scott et al, 2014: 10). These models are recognised as the input-
process-output model and the Service Productivity Model (SPM) (Scerri, 2015: 57).

9
2.2.1 INPUT - PROCESS - OUTPUT MODEL
Figure 1: The linear depiction of productivity and firm production (Scerri, 2015: 57)
This model is applicable to this study by means of productivity and the firms’ strategies being
seen as linear and directional. In Figure 1, the input for instance, raw materials (e.g. the
ingredients for a salad) flows into the restaurant, passing through the businesses operations
whilst enduring a transformation process (e.g. the chefs washing and cutting up the
ingredients to create the salad). The output then departing as a tangible product with
inserted value (e.g. the salad as a final product, being delivered to the customer). Intangible
inputs and outputs may also be considered in this process. The intangible output (e.g.
quality) is determined through the productivity of intangible factors of production (e.g. the
quality of service). However, the measurement of intangible outputs is not easily measurable
(Nachum, 1999: 123). The significance of this model is the impact of ‘load-shedding’ on the
process. For example: the input of equipment and machinery should go through a process
which assists in the generation the output of products and services. However, the process
is interrupted by means of ‘load-shedding’ and the output is disrupted, therefore the
restaurant is negatively impacted. This is addressed through the SPM demonstrated by
Scerri (2015: 57) as the Gronroos and Ojasalo’s (2004) model.
2.2.2 SERVICE PRODUCTIVITY MODEL
According to Scerri (2015: 57-59), the SPM acknowledges the open system nature of
productivity as it is influenced by the demand of customers. The SPM states that lower levels
of demand from customers results in a negative influence on the resources of a service
provider, thus negatively effecting the service productivity. This model presents the concepts
of “internal efficiency”, “external efficiency” and “capacity efficiency”, as adopted by Scerri
(2015: 57-59).
INPUT TRANFORMATION OUTPUT

10
For this study, the internal efficiency relates to the effective implementation of resources,
such as; electricity, systems, personnel and information, etc. Followed by capacity
efficiency, which relates to the manner restaurants managers and waitrons react to the
variants of customers demand during ‘load-shedding’ hours. Recognising that the service
productivity may be affected by customer satisfaction being met. Presenting the notion of
external efficiency which is customers contribution and involvement. This would be
illustrated through customers verbal rating the level of service they received during hours of
‘load-shedding’ as well as their retention. This model illustrates the inputs in the service
delivery process is generated through a single entity (Scerri, 2015: 57). The single entity is
the ability of restaurant staff to offer internal efficiently during ‘load-shedding’ compared to
the restaurants standard level of service delivery ability. The customers contribution was
established through the customer traffic increasing, decreasing or no noticeable difference
during ‘load-shedding’ hours.
2.3 THE PROBLEM BEING INVESTIGATED
2.3.1 THE REASON FOR ‘LOAD-SHEDDING’
The action of turning off parts of the power grid to ensure stability at Eskom, was a
consequence of the government disregarding Eskom’s warning in the late 1990’s. Eskom
warned that if no new power stations were built, the country may encounter power supply
problems in 2007. The government at the time aspired to allow private electricity producers
to generate power to the national grid, nonetheless by the year 2000, nobody had invested
in private power generation. This was a result of Eskom still wanting to retain 70%
dominance of power production in SA (Prof Assan & Masibi, 2015: 13-15).
The former president, Thabo Mbeki, acknowledged that the government had slipped-up in
2007 by over-looking the pending power demand crisis. When the government decided to
address the issue of greater demand, they were faced with unskilled labour and poor
leadership inside Eskom. After subsidising the labour force by 50%, expansion began to
take shape. Yet, the cut down of staff added to badly maintained power stations, which has
been a contributing factor to ‘load-shedding’. Another influence of pro-longed ‘load-
shedding’ was labour unrest as workers on the constructions site started striking, delaying
Eskom’s expansion programme. These are only but a few reasons for the implementation

11
of ‘load-shedding’, hence the issue is still evident in 2019 (Prof Assan & Masibi, 2015: 13-
15).
2.3.2 THE IMPORTANCE OF ELECTRICITY
Reliable electricity in the 21st century serves as an indispensable input to the activities of
any business. A significant 50% of Sub-Sahara African firms recognised electricity as a
major constraint to their business operations, whereas Oseni (2012: 1), indicates that only
39.2% of the world considers ‘load-shedding’ a major constraint. Prior surveys issued by
Scott et al, (2014:10), suggest that, in developing countries such as SA, access to electricity
has been one of the leading constraints to their business operations. Furthermore Frederick
& Selase (2014: 34), propose the existence of a unique relationship between electricity and
businesses as energy supplies have a considerable impact on economic activities. This is a
result of electricity being consumed for various purposes ranging from storage, operational
processes, production and powering of equipment/machinery. The supply of power is a
substantial component of virtually any production process, making electricity an essential
commodity for industry types such as: the service industry. Without electricity, restaurants
are not able to efficiently offer their service to satisfy customers (Frederick & Selase, 2014:
34).
A Nobel prize winning economist, Paul Krugman stated; “Productivity is not everything, but
in the long run it is almost everything. A countries capability to improve its standard of living
over time depends almost exclusively on its ability to raise its output per worker” (Krugman,
1997: 11). The extensive research commenced on the negative impact power outages has
on the productivity of firms, confirms the magnitude of the on-going issue of ‘load-shedding’
rendering small enterprises unproductive and inefficient (Scott et al, 2014: 8; Cissokho,
2015: 3; Nyanzu & Adarkwah, 2016: 1; and Arlet, 2017: 2). The relationship between
electricity consumption and a business productivity is evident, yet the causality is regarded
as intricate. Owing to a range of input factors and to the various electricity impacts (Scott et
al, 2014: 10).
According to Mhlanga (2018: 13), the average restaurant in SA only operates at a 77%
efficiency level without the impact of ‘load-shedding’. This result was generated through the
analysis of inputs (i.e. labour, food and beverage and materials) and one total output as total
revenue. As mentioned by Mhlanga, (2018: 408) that the high failure rate of restaurants

12
(87%), is due to restaurants not able to reach their maximum productivity or successfully
using their time and resources. To acknowledge the impact of ‘load-shedding’ on restaurants
productivity, the possible impact on the relative inputs and outputs should be distinguished.
2.3.3 THE IMPACT ON RESTAURANTS INPUTS
According to Cissokho (2015: 2) and Nyanzu & Adarkwah (2016: 6), ‘load-shedding’
challenges a restaurants productivity through numerous channels, causing inputs to idle
which leads to a lower output level. These input channels may include staff, operations,
costs, security, and machinery and equipment.
Challenges such as: staff working in an uncomfortable environment as the aircon may not
work and adapting to a manual ordering system may cause a change in the restaurants
atmosphere and ambience (Oseni, 2012: 2). Resulting in a potential decrease in customers
during ‘load-shedding hours, effecting waitrons income (Botha, 2019). Another challenge
may be that staff arrive late for work as a result of not being able to clean their work clothes
or traffic lights not operating on their route to work (Jacobs, 2015). These negative impacts
influence the staff’s capability to offer a service effectively.
Rendering to Villiers (2019), the top worry for South Africans is the intensified risk of crime,
considering the ‘load-shedding’ schedule is made public and not always accurate. Thus,
security playing a role in the inputs effected by ‘load-shedding’. Cable theft and vandalism
during ‘load-shedding’ has also caused extended periods of power outages for businesses
(Joubert, 2019).
Abrupt and extended ‘load-shedding’ hours ultimately lead to the damage of machinery and
equipment, increasing additional costs owed to more frequent repairs and replacement
(Cissokho, 2015: 2). Additional costs are also inquired through spoilage of foods and
inventory. For example, staff at Woodstock Brewery’s in Cape Town explain that ‘load-
shedding’ has produced major issues in their brewing process, as when their production
comes to a standstill the whole batch becomes wastage (Jacobs, 2015).
Permitting to the understanding of productivity as the total output generated per input, the
following will observe the possible outputs of restaurants effected by ‘load-shedding’ (House
of Commons, 2018: 7).

13
2.3.4 THE IMPACT ON RESTAURANTS OUTPUTS
It is visible that ‘load-shedding’ has a direct impact on all business operations and their
productivity (Steenkamp et al, 2016: 74). This direct impact implies that the probability (a
tangible outcome) of firms to decrease in revenue would be higher during ‘load-shedding’
compared to when there is available power for production. The loss of revenue may be
accredited to firms who lack the financial resources to invest in alternative energy sources
and who are electricity intensive (Nyanzu & Adarkwah, 2016: 14). Arlet (2017: 3), however,
reveals that firm’s revenue suffer the most as they are unable to measure their production
and Prof Assan & Masibi (2015: 57), expresses that ‘load-shedding’ alters the manner in
which business decisions are carried out. For the reason that they have to deposit more
revenue back into the business as they have to take care of machinery and equipment,
preparing for ‘load-shedding’ occurrences and additional input costs such as: buying a
generator and diesel.
The efficiency of service delivery and customer satisfaction are two other considered
effected outputs. Service delivery is the ability of restaurants to effectively meet the dynamic
needs and expectations of customers (Durdyev et al, 2014: 496). Considering the INPUT-
PROCESS-OUTPUT and SPM found in Figure 1 and 2 (Page 9 and 10), The impact of ‘load-
shedding’ on the firms process may result in impacting the efficiency of delivering a service,
therefore, potentially effecting customer retention (Scerri, 2015: 57). According to Al-Tit
(2015: 130), the dimensions of service efficiency involves: food quality, employee service
and the physical environment of the restaurant. The result of ‘load-shedding’ may affect the
restaurants ability to meet the needs and expectations of customers. For example, food
takes longer, not all items on the menu can be made and the unpleasant sound of a
generator effecting the ambiance of the restaurant, as a result of ‘load-shedding’.
Contributing to a possible decrease in customers traffic, as a result in not meeting customer
expectations.
Schoeman & Saunders (2018: 328), discovered that 16.7% of businesses experienced an
increase in customers during ‘load-shedding’ hours were restaurants and three of the
restaurants identified a considerable 30% increase in customer traffic. Demonstrating the
possibility of restaurant’s actually benefiting from the implementation of ‘load-shedding’.

14
2.3.5 THE TECHNIQUES IMPLEMENTED TO MITIGATE THE EFFECTS OF ‘LOAD-
SHEDDING’
According to Nurudeen et al, (2018: 3), self-generation has been deemed the most widely
implemented strategy to mitigate the impact of ‘load-shedding’. The leading mitigation
method for restaurants is the use of a standby generator, followed by modifications in
operations and reduced hours. The execution of generators amongst developing countries
is around 33% and in countries such as: Nigeria, the issue of ‘load-shedding’ is higher
therefore, generators make up 86% of the energy supply (Scott et al, 2014: 27). In 2007, the
World Bank Group (2019), indicated 44.9% of firms were affected by ‘load-shedding’ with a
4.5-hour average outage and only 18.4% made use of generators. Closely related to SA is
Sub-Saharan Africa, were 53.2% of businesses own generators (Blimpo & Cosgrove-Davie,
2019: 19). Showing a significant increase in the use of generators to mitigate ‘load-shedding’
outcomes.
Firms investment into self-generation greatly influences their ability of investing into other
productive activities that may have resulted in higher returns (Nurudeen et al, 2018: 3). Self-
generation additionally adds to operating costs and capital, as it is much more expensive
than electricity supplied from Eskom (Scott et al, 2014: 19). According to Thelwell (2014),
businesses potential loss incurred due to not employing a generator during ‘load-shedding’
hours is +/-R13 000 an hour, where as those who do employ a generator only lose +/-R 919
and hour.
Considering businesses who cannot afford the high cost of generators resorted to changes
in operations to alleviate the impact of ‘load-shedding’ (Nurudeen et al, 2018: 3). These
operations may include reducing the hours and amount of staff per shift and even working
extra hours to prepare for ‘load-shedding’. Several firms have been forced to close their
doors as it is not viable to render a service (Makgatho, 2019). Shortening of the menu has
also been exercised as without power, certain items cannot be made. A Manager of an
Italian restaurant in Sea Point, Cape Town, Ritesh Sewsunker says, “The guests aren’t
allowed to order everything on the menu, and there’s crucial items that can’t be served. You
can’t even serve coffee and cocktails as they use the blenders. This has a major impact on
guest that frequently visit the restaurant” (Botha, 2019). The last technique of mitigation is
restaurants keeping up with the ‘load-shedding’ schedule to best arrange for ‘load-shedding,
even though it is regarded as unreliable at times (Kohler, 2019).
15
3. RESEARCH DESIGN AND METHODOLOGY
This section will give a description of how the study was performed and procedures
implemented to answer the research question by satisfying the research objectives. This
section will also examine the appropriate paradigm and why it is was best suited for this
research problem. The research design will be discussed by means of the systems, methods
and techniques utilised to gather the required data. Followed by the collection and
analysation of data (Prof Assan & Masibi, 2015: 33).
3.1 PARADIGM
The research design of this study has been influenced by the researcher’s paradigm.
According to Prof Assan & Masibi (2015: 5), It is customary for researchers to abide by
particular standards that direct their behaviour during a study, otherwise known as a
paradigm. A positivistic paradigm was conducted according to this study’s empirical-
analytical nature. In terms of a causal (cause and effect) relationships between variables
concerning ‘load-shedding’ and the productivity of restaurants through structured
observations (Du Plooy-Cilliers et al, 2014: 24-25). The aim of positivism is to enlighten
restaurateurs on the impact ‘load-shedding’ has on their inputs and outputs of their
restaurant and ways o mitigate ‘load-shedding’ (Du Plooy-Cilliers et al, 2016: 21,24,76). To
compare the relationship between particular variables or how one variable (e.g. revenue) is
affected by another variable (e.g. additional costs), is achieved through implementing
‘descriptive research’ through a quantitative approach.
The quantitative approach assisted in the collection, analysation and interpretation of this
study as well as the motivation behind selecting the relevant data collection and analysis
methods. Rendering to the purpose, objective and aim of this study explaining the significant
quantities in the causal relationship, the quantitative approach contributes to the validity of
this study’s findings (Du Plooy-Cilliers et al, 2016: 14-15). The paradigm and research
design of this study is guided by the below figure adopted from Saunders & Tosey (2013:
59), known as the Research Onion.

16
Figure 2: Adopted by (Saunders & Tosey, 2013: 59)
The above figure gives a visual illustration of the researcher’s interpretation and decisions
in reference to the outer layers that offer context and boundaries within the data collection
and analysation. The methodology applied and the research design that is to follow, has
abided by the research philosophy of Positivism, a mono method of quantitative, followed
by a survey strategy (i.e. Questionnaires) leading into a cross-sectional time horizon to reach
the relative data collection, analysis techniques and procedures that have been
implemented (Saunders & Tosey, 2013: 58).
3.3 RESEARCH APPROACH AND DESIGN
Rendering to Prof Assan & Masibi (2015: 33) and Du Plooy-Cilliers et al, (2014: 93), the
research design entails the plan to be carried out by the researcher. To stipulate an outline
of how the researcher has performed the process of formulating questions, to collecting data
and evaluating the final results. The research design implemented in this study assists in

17
answering questions authentically, accurately and economically with regards to ‘load-
shedding’ and restaurants productivity.
The positivism tradition assisted in developing quantitative and objective reasonings, that
was supported by direct observation. Resulting in the use of Positivist theorising to guide
the observation of the phenomena and allow for theory building. Meaning that this study’s
made use of a circular dependency on each other as the INPUT-PROCESS-OUTPUT model
guided the observation of impacts from ‘load-shedding’ and vice versa. The aim of this
approach was to quantify the significance causal relationship of ‘load-shedding’ on
restaurants’ productivity and formulating questions to measure the main objective of this
study (Du Plooy-Cilliers et al, 2014: 51).
The relevant data was gathered through surveys administrated through a cross-sectional
survey design. This design created an overall picture of the impact ‘load-shedding’ had on
restaurants productivity in NMB at single point in time. Illustrating a unique focus on the
restaurants in NMB as the data collection is not necessary to repeat to compare outcomes.
The employing of a structured questionnaire granted the researcher the opportunity to ask
a set of questions related to the attitude, trends, and opinions of restaurateurs on ‘load-
shedding’. Producing quantitative descriptive research to provide insight into restaurants’
experience with ‘load-shedding’ (Du Plooy-Cilliers et al, 2014: 14).
To quantify the impact of ‘load-shedding’ on the restaurant industry, a quantitative research
method was exploited to substantiate the statistical analysis of the study. Another reasoning
was to allow the researcher to make objective interpretations of the data through detecting
hidden patterns. The following provides the methodological outline of the study (Du Plooy-
Cilliers et al, 2014: 14).
3.4 POPULATION
The target population of this study is comprehended as all the restaurants impacted by ‘load-
shedding’. Whereas, the accessible population was restaurants situated in Marine drive,
Summerstrand and Humewood area, in NMB, that were impacted by ‘load-shedding’.
Recognising the entire group of restaurateurs from whom data was required from. Once the
population for this research was taken into consideration a sample was drawn (Du Plooy-
Cilliers et al, 2014: 132).

18
3.5 SAMPLING METHOD
The unit of analysis is understood to be all restaurants affected by ‘load-shedding’ within
NMB. The sample drawn abided by to the requirements of the Independent Institute of
Education (IIE) as a minimum of 20 respondents. The administrated questionnaire was
delivered to 20 respondents (i.e. Owners or managers) and 20 questionnaires were
retrieved, generating a 100% response rate. However, during the data cleaning process
25% of responses were deemed incomplete, leaving 75% of responses eligible to contribute
to the findings of this study.
There are many different ways of sampling which are categorised into two groups namely;
probability and non-probability sampling methods. A non-probability method of convenience
sampling was utilised as it allowed for quick and easy access to sample and the researchers’
residence was situated close to the sample. Selection was based on the researchers’
judgement and not randomly from a set list. The sampling commenced in this study differs
from the most common description of convenience sampling, as the researcher did not know
the owner or managers on a personal level. Rendering to the character of non-probability
sampling, this study has not intended to generalise findings to the larger population but was
implemented as it was the most convenient sampling method (Du Plooy-Cilliers et al, 2016:
142-145).
The inclusivity of the sample entailed all those respondents in which the researcher was
able to make contact with and was not based on a systematic selection. The convenience
sampling method of collecting primary data played a vital role as it established the base for
final conclusions at the end of this study (Du Plooy-Cilliers et al, 2016: 134-138).
3.6 DATA COLLECTION METHODS
Primary data took place through a questionnaire being administrated to respondents by
means of a cross-sectional survey design. The aim of gathering this information was to reach
the relevant findings (Prof Assan & Masibi, 2015: 36). A ‘survey’ research tool was
consumed to provide a quantitative description of restaurant managers and owners
opinions, trends and attitudes towards the problem of ‘load-shedding’ (Du Plooy-Cilliers et
al, 2016: 149).

19
The administrating of surveys in the form of questionnaires allowed for an inexpensive, less
time consuming and anonymous factor which led to a response rate of 100%. However,
surveys are known to be prone to errors during the collection and interpreting phases.
Therefore, the researcher eliminated those incomplete questionnaires during the data
cleaning process to ensure the probability of producing errors within the interpreted data did
not occur (Du Plooy-Cilliers et al, 2016: 160).
The questionnaire (Annexure 7.1, Page 46 - 50) started with an introduction to inform
respondents on the purpose of the study and their role within the data collection process.
Respondents were assured their participation was voluntary and they had to the option to
withdraw at any time. This opening paragraph stated the duration of the questionnaire (10
minutes) and respondents were assured the questionnaire would remain confidential and
anonymous.
The questionnaire started with two pre-requisite questions to ensure only restaurants who
form part of the SMME criteria and were affected by ‘load-shedding’ filled out the
questionnaire. If restaurants failed to meet the mentioned criteria, they were instructed to
not continue with the rest of the questionnaire. The rest of the questionnaire included close-
ended, open-ended, multiple choice, matrix and linear numeric scale questions. The aim of
these questions was to gain a better understanding on what and how restaurants
productivity has been impacted as well as the techniques restaurants have implemented to
mitigate these impacts. Two open-ended (qualitative) questions were included to provide
insight into additional impacts or techniques that the researcher did not include or was
unable to foresee (Du Plooy-Cilliers et al, 2016: 152-160).
The procedure employed during data collection involved the researcher driving to each
conveniently selected restaurant in Marine drive, Summerstrand and Humewood, NMB.
Where owners or managers were requested to complete the structured questionnaire
anonymously. This questionnaire was constructed through the use of Google Forms.
3.7 DATA ANALYSIS METHODS
The analysation of data method exercised is identified as descriptive statistics. This method
was used to ensure a truthful and objective explanation on how the productivity of
20
restaurants, in NMB, were affected by ‘load-shedding’ and the techniques implemented for
mitigation (Du Plooy-Cilliers et al, 2016: 152).
The first step taken to analyse the data was to acquire all the completed questionnaires to
form a data set. The data set was then inspected for any incomplete or un-useable
questionnaires, once identified they were disregarded from the study. Each questionnaire
was labelled 1-15 and the relevant respondents answers were recorded onto an excel
spreadsheet. Once the data had been captured, tables were formed to calculate the
frequency and percentages of each question. In some cases, the central point of the data
was determined through the mean, median and mode. Graphical representation was then
designed accordingly to present findings in the forms of pie graphs, bar graphs and tables.
The data attained was then interpreted to formulate patterns, relationships and comparisons
against previous studies (Du Plooy-Cilliers et al, 2016: 160).
The two-open ended questions from the questionnaires were captured in Microsoft word
and analysed for common patterns and outliers. Reason being to analyse the most frequent
answer and uncover possible missed additional impacts and techniques of mitigation (Du
Plooy-Cilliers et al, 2016: 153).
The following section embraces the findings associated with the main objective of the study.

21
4. FINDINGS
The findings of this empirical research have been presented in the form of bar graphs, pie
charts and tables combined with the interpretation, discussion and insight of the relevant
findings and prior literature/theory as well as the reliability and validity of this study.
4.1 PRESENTATION AND INTERPRETATION OF FINDINGS
The presentation and interpretation of findings has evaluated the findings in the broader
context of the research problem.
4.1.1 SMALL, MEDIUM AND MICRO ENTERPRISES
As larger enterprises downsize and subcontract ever increasing functions, the pressure of
SMME’s in the economy is increasing. According to Nyanzu & Adarkwah (2016: 2), SMME’s
operations have been overwhelmed by ‘load-shedding’, leading many SMME’s to become
unproductive and inefficient. The National Development Plan forecasts that 90% of all new
jobs in SA will be from SMME’s, by the year 2030. For SMME’s like restaurants to augment
their contribution to the economy and produce more jobs, a supporting environment is
required. However, ‘load-shedding’ is threating the productivity of SMME’s as a sector,
resulting in harmful implications on SA’s economic growth and development (Schoeman &
Saunders, 2018: 333).
Figure 3: Percentage of Small, Medium & Micro Enterprises in this study.
40%
20%
40%
SMALL, MEDIUM & MICRO ENTERPRISES
SMALL
MICRO
MEDIUM

22
Emphasising the vital role restaurants productivity plays in the growth and development of
SA, the demonstrated figure acknowledges the percentage of sampled restaurants that
formed part of the SMME’s criteria. 40% of restaurants were small enterprises, 40% were
medium enterprises and 20% were micro enterprises.
4.1.2 AVERAGE HOURS RESTAURANTS EXPERIENCE ‘LOAD-SHEDDING’
On the 18th of March 2019, Eskom announced the implementation of stage 4, meaning
restaurants would experience ‘load-shedding’ 12 times over a four-day period for two hours
at a time, or 12 times over an eight-day period for four hours at a time (Eyewitness News,
2019). Restaurants are equally financially impacted as abrupt and extended ‘load-shedding’
hours increase additional costs due to more frequent repairs and replacement (Cissokho,
2015: 2). Table 4 illustrates the average hours restaurants in NMB experienced power cuts
during a time of frequent ‘load-shedding’.
AVERAGE HOURS OF EXPERIENCING ‘LOAD-
SHEDDING’:
AVEARGE RESPONSE OF
RESTAURANTS:
BELOW 2 HOURS 7%
2-4 HOURS 60%
5-8 HOURS 26%
ABOVE 8 HOURS 7%
Table 4: The average hours restaurants experienced ‘load-shedding’
As demonstrated, 60% of restaurants affirmed they experienced an average of 2-4 hours of
‘load-shedding’ and 26% stated 5-8 hours of ‘load-shedding was experienced. Only 7%
experienced below 2 hours and above 8 hours of ‘load-shedding’. Considering, the highest
averages of 2-4 hours and 5-8 hours falls within stages 3 and 4, the costs incurred by the
economy may be of a substantial amount (Du Toit, 2019). Not only is ‘load-shedding’ a major
concern for the economy (Cissokho, 2015: 2), but also to restaurants. Thus, the next figure
looks at ‘load-shedding’ as a major concern.

23
4.1.2 ‘LOAD-SHEDDING’ AS A MAJOR CONCERN
According to Oseni’s (2012: 21), over and above 50% of African firms recognized reliable
electricity as a major concern. Another study commenced in Senegal analysed the electricity
concern amongst growth supporting sectors such as, services delivery and 57% reported
electricity as a major concern (Cissokho, 2015: 2). Figure 4 illustrates restaurants response
to whether ‘load-shedding’ is a major concern within their business operations.
Figure 4: The percentage of restaurants considering ‘load-shedding’ a major concern.
The demonstrated figure corresponds higher than the level of concern found in Oseni’s
(2012: 21), study by means of 73% of respondents agreeing that ‘load-shedding’ is a major
concern within their business operations and only 7% responding no. Another option was
offered to respondents to allow for restaurants to partially consider ‘load-shedding’ as a
major concern. Thus, 20% of respondents were partially concerned with the impact of ‘load-
shedding’. To analyse the depth of this concern, respondents were asked to declare the
level at which they were impacted. Resulting in 37% feeling ‘load-shedding’ had a high
negative impact and 42% felt a moderate negative impact. Representing a 79% of
restaurants being negatively affected, hence the reasoning why 73% of restaurants
expressed ‘load-shedding’ as a concern.
73%
7%20%
'LOAD-SHEDDING' AS A MAJOR CONCERN

24
It is prevalent that ‘load-shedding’ hinders the activities of restaurants within the NMB area.
To address the impact on the productivity of restaurants, the impacts on inputs such as:
staff; operations; costs; security; and equipment were identified to recognise the impact they
had on the outputs namely: revenue; customer traffic and service delivery.
4.1.3 THE IMPACTS ON RESTAURANT INPUTS
Figure 5 represents the level at which each input factor was impacted by ‘load-shedding’.
Figure 5: The level of impact on restaurants inputs.
33% of respondents illustrated ‘load-shedding’ had affected their human capital, in terms of
staff (e.g. waitrons). These effects included waitrons working harder during ‘load-shedding’
yet earning less and staff being sent home during ‘load-shedding’ hours as they were unable
to accomplish their duties (Botha, 2019 and Steenkamp et al, 2016: 74).
Figure 5 states 80% of restaurants felt the ultimate impact was on their firms’ operations. It
was pointed out that this may be a result of generators not being able to power the whole
restaurant, leading to many procedures being changed (NMPP Energy, 2017). These
procedures often slowing down or hampering staffs (waitron’s, kitchen, barmaids) ability to
effectively carry out their operations (Steenkamp et al, 2016: 74).
0%
10%
20%
30%
40%
50%
60%
70%
80%
STAFF OPERATIONS COSTS SECURITY EQUIPMENT
33%
80%
53%47%
60%
RESTAURANT INPUTS

25
53% of restaurants identified additional costs as an impact. Rendering to Cissokho (2015:
2), stating frequent repairs and replacement of machinery and equipment as well as Jacobs
(2015), identifying the acuried costs through spoilt food and inventory.
47% of restaurants described security as an impact, substantiating Villiers (2019) on the
intensified risk of crime.
Lastly, the impact of ‘load-shedding’ on machines and equipment was felt by 60% of
restaurants as agreeing with Cissokho (2015: 2), the fluctuations in voltage cause severe
damage to machinery and equipment, creating additional costs.
4.1.4 RESTAURANTS MOST CHALLENGING IMPACTS
The following table assisted the researcher in discovering impacts that may have been
unforeseen.
GREATEST IMPACT OF ‘LOAD-SHEDDING’
Unable to make items on the menu
Food Takes longer
Generator capacity
Loss of customers
Security Increase in fuel costs
Send staff home
Turnover and sales decreased
Added stress
Closing doors
Table 5: Restaurants most challenging impact of 'load-shedding'
However, the displayed table correlates with previous literature and results on the impacts
of ‘load-shedding’ on restaurants inputs (Steenkamp et al, 2016: 74).

26
4.1.5 CUSTOMER TRAFFIC AS AN OUTPUT
In relation to a study commenced by Schoeman & Saunders (2018: 328), on the impact of
power outages on small businesses in the city of Johannesburg. It was discovered that
16.7% of businesses that experienced an increase in customers during ‘load-shedding’
hours were restaurants and three of the restaurants identified a considerable 30% increase
in customer traffic.
Figure 6: The effect of ‘load-shedding’ on number of customers.
With regards to Schoeman & Saunders (2018: 328), study compared to NMB restaurants,
there was a 20% increase in customer traffic and 20% that felt no noticeable difference,
which may be deemed as a positive effect. Thus, indicating a positive effect of ‘load-
shedding’. This result may be owned to customers being aware of restaurants ability to still
operate through the use of a generator, effective ‘load-shedding’ procedures implemented
and customers in the same ‘load-shedding’ area not able to cook at home. Therefore, a 20%
increase in customer traffic may increase the output of revenue, resulting in a favourable
productivity outcome.
However, a substantial 60% of restaurants experienced a decrease in customers during
‘load-shedding’, contradicting Schoeman & Saunders, (2018: 328) findings. This may be
due to the high impact of restaurants operations; longer waiting periods and customers not
aware of restaurants being open for business. The decrease in customers contributes to a
decrease in the sales, production and revenue of the restaurant. The negative impact on
0%
10%
20%
30%
40%
50%
60%
INCREASED DECREASED NO NOTICEABLE DIFFERENCE
20%
60%
20%
CUSTOMER TRAFFIC

27
customer traffic may also be a result of the restaurants ability to offer effective service
delivery as an output.
4.1.6 SERVICE DELIVERY AS AN OUTPUT
A study conducted in 2016, on the current factors effecting consumer selection in NMB,
stated variables that have an impact on customers satisfaction when choosing a restaurant.
The most influential variable towards customers patronisation to a restaurant was, good
service. Consequently, if other dining attributes (e.g. food quality) do not meet the
expectations of the customer, good service delivery may compensate for the lack thereof
(Mhlanga & Tichaawa, 2016: 2). Figure 7 demonstrates the comparison between the
restaurants ability to offer a high or low level of service during ‘load-shedding’ and without
‘load-shedding’.
Figure 7 :Comparison of restaurants ability to offer a service during 'load-shedding' and in the absence
of 'load-shedding'
This graph assists in determining the relationship between ‘load-shedding’ and the
productivity of restaurants. Respondents were asked to answer two linear-numeric scale
type questions consisting of a multi-point rating option, on were their service delivery stands.
Ten being high service delivery and one being low service delivery. The numerical average
(i.e. Mean) of respondents concluded that majority rated their service delivery at 9 in the
1 2 3 4 5 6 7 8 9 10 11 12 13 14 15
SERVICE DELIVERY
SERVICE DELIVERY DURING 'LOAD-SHEDDING'" STANDARD SERVICE DELIVERY

28
absence of ‘load-shedding and rated their service delivery at a level of 5.73 when affected
by ‘load-shedding. Thus, identifying a definite decrease in restaurants ability to efficiently
offering their service during ‘load-shedding’. When analysing the most frequently selected
answer, known as the Mode, the standard service delivery goes from a level 10 to a 6 when
‘load-shedding’ occurs. Thus, demonstrating a negative impact of ‘load-shedding’ on
restaurants service delivery (Du Plooy-Cilliers et al, 2014: 210-211).
The distinguished impacts on inputs in this study may be the result of restaurants
experiencing a 32.7% decline when offering a service during ‘load-shedding’ compared to
their standard service delivery. A decrease in restaurants service delivery reiterates
Mhlanga & Tichaawas (2016: 2), study that the most influence variable is delivering a quality
service. Thus, restaurants hinderance to offer a high level of customer service is closely
related to ‘load-shedding’.
Figure 7 displays three of the respondents stating their service delivery was at the same
level during ‘load-shedding’ and in the absence of ‘load-shedding’. This may be a result of
restaurants using a generator and two of the three using gas as well. Another depiction in
Figure 7, is the considerable difference in respondent 8’s comparison of service delivery
during ‘load-shedding’. This is response is appropriate as respondent 8 has not invested in
an alternative power energy source. Resulting in a greater negative impact of ‘load-
shedding’ (Thelwell, 2014).
4.1.6 REVENUE AS AN OUTPUT
Arlet (2017: 3), reveals the revenue of small enterprises suffer the most as they are unable
to measure their production. Prof Assan & Masibi (2015: 57), expresses that ‘load-shedding’
alters the manner in which business decisions are carried out. For the reason that they have
to deposit more revenue back into the business as they have to take care of machinery and
equipment, preparing for ‘load-shedding’ occurrences and additional input costs such as:
buying a generator and diesel. The loss of revenue may be endorsed by firms who lack the
financial resources to invest in alternative energy sources and who are electricity intensive
(Nyanzu & Adarkwah, 2016: 14). Figure 8 demonstrates the percentage of restaurants
whose revenue was subjected by ‘load-shedding’.

29
Figure 8: Revenue as an output
73% of restaurants felt that their revenue was negatively impacted by ‘load-shedding’. This
may be a result of an increase in additional costs of damaged machines and equipment; an
increase in wastage; theft; decrease in customers; decreasing customer spending through
a shortened menu and closing during ‘load-shedding’ due to not having an alternative power
source. Only 7% were subjected to a decrease in energy consumption costs. Nyanzu &
Adarkwah (2016: 14), findings agree with Cissokho & Secks (2013), research that most firms
who rely on electricity for production and do not have the capital to spend on alternative
power source, will be subjected to their revenue being negatively impacted.
4.1.7 SECONDARY ENERGY SOURCE
According to Scott et al, (2014: 18), 40% of electricity generated in Nigeria is produced by
means of own-generation. Furthermore, 20-30% of firm’s initial investment is to enhance the
reliability of the electricity supply. Consequently, resulting in higher capital and operating
costs and affecting a range of investment opportunities. Figure 9 below illustrates the
percentage of restaurants who have invested in a secondary energy source.
0%
10%
20%
30%
40%
50%
60%
70%
80%
REVENUE
73%
THE IMPACT ON REVENUE

30
Figure 9: Percentage of restaurants invested in a secondary energy source.
The figure above, points out that a considerable 93% of restaurants in NMB have invested
in secondary sources of energy in attempt to mitigate the effects of ‘load-shedding’ and only
7% have not. Illustrating, NMB restaurants investing into a secondary source to create
reliable income, even if it affects their investment opportunities (Scott et al, 2014: 18).
4.1.8 DIFFERENT TYPES OF SECONDARY ENERGY SOURCES
Figure 10: Percentage of alternative energy sources used by restaurants.
93%
7%
INVESTMENT INTO A SECONDARY SOURCE OF ENERGY
0%
10%
20%
30%
40%
50%
60%
70%
80%
90%
100%
GENERATOR SOLAR ENERGY GAS BATTERY POWER NONE
93%
0%
47%
7% 7%
SECONDARY ENERGY SOURCES

31
The illustrated figure indicates 93% of restaurants own generators as a secondary energy
source. This result supports Schoeman & Saunders (2018: 332), study that the
implementation of generators was owed to the evident history of ‘load-shedding’ between
2008 - 2015. Second to generators is the use of gas at 47% and thirdly battery power at 5%.
Even though generators are restaurants first choice of alternative energy source, the most
environmentally friendly and sustainable option of solar energy have not been implemented
or considered. Lastly, 5% of the restaurant industry has implemented no means of energy
generation when ‘load-shedding’ occurs (NERSA, 2018). This reinforces Schoeman &
Saunders (2018: 332), study that unconverted 87% of business made use of back-up power
owing to the domination of ‘load-shedding’ between the years of 2008 - 2015. The left over
13% felt that they were too small in size to justify the cost of back-up power.
THE COST OF INVESTING COMPARED
TO A RELIABLE ENERGY SOURCE
YES 80%
NO 20%
Figure 11: The cost of investing in a secondary energy source compared to reliable an energy source
Agreeing with Nurudeen et al, (2018: 4) as 80% of restaurants describing their secondary
energy source investment being more costly compared to having reliable power supply,
resulting in less capital to invest in other projects for a higher return. With only 20% stating
no.
4.1.9 STRATEGIES TAKEN TO MITIGATE THE EFFECTS OF ‘LOAD-SHEDDING’
Although 93% of restaurants in NMB own a generator, many generators do not operate at
their full capacity all the time. The output of a generator fluctuates depending on
maintenance issues, weather conditions and the capacity of the generator to meet the
demand of the restaurant’s capacity (NMPP Energy, 2017). If a restaurants generator can
only power the lights and the fridges, other actions have to take place to cope with the effects
of ‘load-shedding’.

32
Figure 12: Actions taken by restaurants to cope with the effects of 'load-shedding'
The above figure reflects that the main action taken to minimise the impact of ‘load-shedding
is restaurant managers/owners keeping up with the ‘load-shedding’ schedule as 93%
express the same technique. In spite of this, the schedule is not always accurate and
unplanned ‘load-shedding’ occur regularly (Schoeman & Saunders, 2018: 328). This result
may also be owed to 93% of restaurants owning a generator. Followed by 67% stating they
had to shorten their menu during ‘load-shedding’ as not all machines are powered by the
generator (NMPP Energy, 2017). 33% of restaurants have been forced to reduce staff and
work extra hours to prepare before the power cuts out during vital procedures. Lastly, 7%
admitted to closing their doors to cope with ‘load-shedding.
33%
7%
67%
33%
93%
0% 10% 20% 30% 40% 50% 60% 70% 80% 90% 100%
REDUCING STAFF
CLOSING DOORS
SHORTENED MENU
EXTRA HOURS
LOAD-SHEDDING' SCHEDULE
COPING WITH 'LOAD-SHEDDING'

33
Figure 13: Alternative techniques of coping with 'load-shedding'
The primary data gathered required respondents to offer other forms of coping with ‘load-
shedding. Figure 13 identifies other solutions restaurants implemented such as: limiting the
load on the generator, creating ‘load-shedding’ procedures, increasing the size of the
generator, investing in more gas friendly appliances, the implementation of a simple ordering
system making use of a UPS (Uninterruptable Power Supply) system to power the point of
sale stations.
4.1.10 POSITIVE OUTCOMES OF ‘LOAD-SHEDDING’
Nyanzu & Adarkwah (2016: 15), found results that coincided with Cissokho & Seck (2013),
when firms are faced with additional power cuts, they are able to increase revenue by 3.19%.
This is obtained through developing coping techniques and strategies to mitigate the
negative effects into revenue. The study asserted that power cuts turned into more of a
motivation than an interference. As a result, the respondents were asked if they were
subjected to any of the given positive outcomes of ‘load-shedding’.
Limiting the load on the generator
Creating ‘load-shedding’ procedures
Increasing the size of the generator
Investing in more gas friendly appliances
Simple ordering system
The use of a UPS systems to power the point of sale
stations.
ALTERNATIVE TECHNIQUES OF COPING WITH 'LOAD-SHEDDING'

34
Figure 14: The percentage of positive outcomes from 'load-shedding'.
Taking the lead on positive outcomes at 73% is the awareness of sustainability. Indicating
restaurants have become more aware of the sustainability of their restaurant, in terms of
implementing more power saving equipment (Scott et al, 2014: 52). 60% of restaurants felt
that they have a competitive advantage over restaurants who do not have a backup energy
source as a positive outcome. On the contrary, as this study found 95% of restaurants make
use of a secondary energy source. The positive outcome of a competitive advantage may
be argued (Scott et al, 2014: 14). A low 20% of restaurants stated they had not experienced
any positive outcomes and only 7% affirmed to having a decrease in energy consumption
costs.
4.2 RELIABILITY AND VALIDITY OF THIS STUDY
An inter-rater or inter-coder type of reliability was implemented in this study as a
measurement of agreement. This was established through the same questionnaire being
administrated to different respondents. Two pre-requisite questions at the beginning of the
questionnaire also ensured reliability, considering respondents would not have been able to
continue with the rest of the questionnaire if they did not form part of the target population.
Lastly, the execution of a Pilot study was commenced to secure the reliability of this study.
The pilot study was administrated through four restaurants prior to the data collection phase,
to confirm the essential components of the main study will be feasible through the
administrated questionnaire as well as to identify any possible errors that may have
46%
37%
4%
13%
POSITIVE OUTCOMES

35
potentially emerged. The commenced pilot study highlighted that some questions were
unclear and confusing. These changes were made before the data collection was initiated.
This measurement of pre-testing assisted in enhancing the validity and reliability of the study
(Du Plooy-Cilliers et al, 2016: 255-257).
Face validity, a type of validity determined whether the research measured what it was
supposed to measure, meaning the magnitude in which the questionnaire reflected the main
question being investigated. The validity was secured through a cross-sectional survey
design by means of a questionnaire that satisfied the research objectives, which were
answered by the study’s sub-questions and main question. This was confirmed through
previous secondary research and literature consisting of: academic journals and reports,
electronic databases, and news articles (Du Plooy-Cilliers et al, 2016: 256).

36
5. CONCLUSION
In conclusion, the following will discuss how the research questions and objectives of this
study were met, followed by the implications of findings for future practices and the heuristic
value of the study. Lastly, the ethical considerations taken into account and the limitations
that this study presented.
5.1 DISCUSSION OF RESEARCH QUESTIONS AND OBJECTIVES
5.1.1 DOES ‘LOAD-SHEDDING’ HAVE AN IMPACT ON RESTAURANTS WITHIN
NMB?
The main objective of this research sub-question was acquired through the observation of
how owners and managers view the impact of ‘load-shedding’ within their restaurants. This
was acquired through questioning respondents on whether ‘load-shedding’ was a major
concern amongst their operations, whether they were positively or negatively impacted, and
the relative impact on the restaurant’s inputs and outputs (Oseni, 2012: 2). 73% of
respondents agreed to ‘load-shedding’ being a major concern, with only 7% stating ‘load-
shedding’ as no concern to their operations, and 20% illustrating ‘load-shedding’ as a partial
concern. A total 79% respondents affirmed that this major concern was owed to their
restaurant being highly or moderately negatively impacted. With only 7% of respondents
stating they were not impacted negatively or positively; in terms of this study it is clear that
‘load-shedding’ has had a negative impact on the restaurants in NMB (Scott et al, 2014: 8;
Cissokho, 2015: 3; Nyanzu & Adarkwah, 2016: 1; and Arlet, 2017: 2).
5.1.2 WHAT INPUTS HAVE BEEN AFFECTED BY ‘LOAD-SHEDDING’
To determine the impact of productivity as a whole, the total outputs needed to be analysed
against the individual inputs (House of Commons, 2018: 7). Respondents were therefore
required to choose all inputs that affected their restaurant by means of ‘load-shedding’. As
a result, operations were identified as the most negatively impacted input as 80%
respondents indicated this as the most popular choice (Ado & Josiah, 2015: 244). Followed
by 60% of respondent’s alluding to damaged machines and equipment as the second most
impacted, 53% stating additional costs were impacted, 47% affirmed security as an effected
area and lastly, 33% confirmed an impact on staff occurred. Consequently, corresponding

37
with Cissokho (2015: 2) and Nyanzu & Adarkwah (2016: 6), in terms of ‘load-shedding’
effecting restaurants productivities through numerous networks, causing inputs to idle which
leads to a lower output level. Hence, the next research question addresses the outputs that
were affected as a result of the impact of ‘load-shedding’ had on the relevant inputs.
5.1.3 WHAT OUTPUTS HAVE BEEN AFFECTED BY ‘LOAD-SHEDDING’?
The objective of this sub-question was to establish restaurants outputs that have been
affected by ‘Load-shedding’ in terms of customer traffic, service delivery, and revenue.
Contradictory to Schoeman & Saunders (2018: 328), study stating restaurants who
experienced ‘load-shedding’ in Johannesburg, increased their customer traffic by 30%. This
study illustrated 60% of respondents experienced a decrease in customer traffic, 20% stated
there was no noticeable difference and 20% identified an increase in customer traffic. While
a 20% increase in customer and 20% no noticeable difference is a positive outcome for
restaurants, the large amount of 60% showing a decrease may be owed to the negative
impact on the restaurant’s inputs (Arlet, 2017: 17).
To determine the output of restaurants ability to offer an efficient service, during ‘load-
shedding’ compared to their standard service without the effects of ‘load-shedding’.
Respondents were asked to rate their service delivery level with and without the impact of
‘load-shedding’ on a linear-numeric scale. It was found that the ability of restaurants in NMB
service delivery level decreased by 32.7%, as the average respondent rated their service at
a 9/10 compared to a 5.73/10 during ‘load-shedding’ (Du Plooy-Cilliers et al, 2014: 160 and
Durdyev et al, 2014: 496).
Lastly, 73% of respondents confirmed their revenue was negatively impacted by ‘load-
shedding (Nyanzu & Adarkwah, 2016: 14). Owing to the impacts incurred through inputs,
such as: additional costs of damaged machines and equipment; an increase in wastage,
theft and a paying staff for unproductive hours. The negative outputs of customer traffic and
service delivery are also identified as impacts on the restaurant’s revenue. As a decrease
in customers, means a decrease in customer spending and service delivery may be the
impact of a decrease in customer traffic (Johnston & Jones, 2003: 207).

38
5.1.4 WHAT TECHNIQUES COULD RESTAURANTS IMPLEMENT TO MANAGE
THE IMPACTS OF ‘LOAD-SHEDDING’?
Research confirms that those firms that relay on electricity for production and do not possess
the capital to invest in an alternative power source, are in danger of suffering from a negative
impact on revenue (Nyanzu & Adarkwah, 2016:14). Therefore, respondents stated whether
they had invested in a secondary energy source, whether it was more costly to do so, what
secondary energy source was chosen as well as alternative techniques implemented to
mitigate ‘load-shedding’. 93% of respondents indicated to have invested in a secondary
energy source, while 7% did not. It was also found that 80% of restaurants established it to
be more costly to invest, compared to having a reliable power supplier (Scott et al, 2014:
18). The most suitable mitigation technique used by respondents was a generator as 93%
revealed their use, followed by 47% using gas and 5% implementing battery power.
Interestingly the most environmentally friendly option of solar energy has not been
considered by respondents. Leaving 5% signifying that they have not invested in any
alternative energy source (NERSA, 2018).
As mentioned in Figure 11 page 31, many generators do not operate at their full capacity all
the time. The output of a generator fluctuates depending on maintenance issues, weather
conditions and the capacity of the generator to meet the demand of the restaurant’s capacity
(NMPP Energy, 2017). Thus, respondents were asked to state other techniques of mitigation
that were implemented. 93% identified the action of keeping up with the ‘load-shedding’
schedule was the main choice, 67% expressed the technique of shortening the menu, 33%
of respondents had to reduce staff as an action and 7% had to involuntary close their doors
as a mitigation technique (Jacobs, 2015 and Makgatho, 2019). Therefore, the above
responded to the sub-question through determining the techniques utilised by respondents
to mitigate the impact of ‘load-shedding’, by means of secondary energy sources and other
course of actions.
5.1.5 WHAT IS THE IMPACT OF ‘LOAD-SHEDDING’ ON PRODUCTIVITY WITHIN
THE RESTAURANT INDUSTRY, IN NMB?
Rendering to Mhlanga (2018: 408), determining that 62% of restaurants fail within their first
year of operation and 87% within their first five years, as a result of restaurants not able to
reach their maximum productivity or effectively use their time and resources. Therefore, the

39
main objective of this study was to determine the impact ‘load-shedding’ had on the
productivity of restaurants, in NMB.
It has been established that 73% of the restaurant industry affirmed ‘load-shedding’ a major
concern within their business. Considering the vital input of electricity in the productivity of
restaurants, the major concern of respondents is justified through the negative ‘load-
shedding’ effects on restaurants inputs and outputs. As productivity is an index that
measures the output relative to the input, this study’s results are in agreement with Scott, et
al., (2014: 8), Cissokho, (2015: 3), Nyanzu & Adarkwah, (2016: 1), and Arlet, (2017: 2), as
the productivity within the restaurant industry is believed to be negatively impacted by ‘load-
shedding’, regardless of the techniques implemented to mitigate the impacts. The
consequence of a negative impact on productivity within the restaurant may poorly effect
SA’s economic growth and development (Mhlanga, 2018: 408). However, a positive
outcome of this study was that 73% of respondents identified that ‘load-shedding’ had
increased their awareness towards becoming more sustainable, in terms of power saving
(Scott et al, 2014: 24).
5.2 IMPLICATIONS OF FUTURE FINDINGS
Depicting to the reviewed study, it is evident that ‘load-shedding’ has a negative impact on
SMME’s productivity, similarly correlating to the findings of Cissokho (2015:18), Nyanzu &
Adarkwah (2016: 17), and Steenkamp et al, (2016: 75). These studies dealt with the
qualitative approach towards ‘load-shedding’s’ impacts amongst industries such as: The
Information and Communications Technology industry and the hospitality industry (Prof
Assan & Masibi, 2015 and Steenkamp et al, 2016). However, this study has offered a better
understanding into the impacts of ‘load-shedding’ on the productivity of the restaurant
industry, in NMB and the techniques restaurants have utilised for mitigation of ‘load-
shedding, through a quantitative approach.
5.3 RECOMMENDATIONS FOR FUTURE FINDINGS
Representing Du Plooy-Cilliers et al, (2014: 46), the understanding of the heuristic value,
the findings of the study aids other new ideas to be further researched. This study briefly
acknowledged the cost of ‘load-shedding’ and the effect it had on the revenue of restaurants.
Limited research has been commenced on the in-depth cost and mitigation of ‘load-
40
shedding’ has on the revenue of restaurants. Another area that may be of interest to
research would be a qualitative study on the implementation of sustainability within the
restaurant industry (Scott et al, 2014). To improve the future findings of this study, a larger
sample size is recommended in order to generalise the findings to a larger population.
5.4 ETHICAL CONCIDERATIONS
Depicting to Prof Assan & Masibi (2015: 41) and Du Plooy-Cilliers et al, (2016: 291), the
following ethical principles were implemented to ensure anonymity and confidentiality.
Respondents participation was voluntary as no owner or manager was forced to participate.
Consent was given upon respondents answering the questionnaire as they understood the
purpose of the study and the role they would play. Respondents were informed that they
could have withdrawn at any time. Respondents anonymity was ensured as they were not
asked details pertaining to the name of the restaurant. Respondents were not subjected to
any physiological or physical pain or discomfort as no deeply personal questions were
required. The researcher did not intervene with restaurants business operations as
questionnaires were only distributed at off-peak hours.
5.5 LIMITATIONS
Limitations have an impact on the researcher but are out of the researcher’s control. In terms
of this study limitations of time and a small sample size were evident (Du Plooy-Cilliers et
al, 2014:275). A time constraint of six-month was encountered as the completion period
given for this research was six months. Considering the constraint of a small sample size
hinders the results of this study to be generalised to the larger population, as required from
quantitative studies.

41
6. REFERENCE LIST
Ado, A. & Josiah, M. M., 2015. Impact of deficient electricity supply on the operations of
small scale businesses in North East Nigeria. The Business & Management Review, March,
6(2), pp. 240-250.
Al-Tit, A., 2015. The Effect of Service and Food Quality on Customer Satisfaction and Hence
Customer Retention, Kingdom of Saudi Arabia : Canadian Center of Science and Education.
Arlet, J., 2017. Electricity Tariffs, Power Outages and Firm Performance: A Comparative
Analysis. March.pp. 1-41.
Blimpo, M. & Cosgrove-Davie, M., 2019. Electricity Access in Sub-Saharan Africa. Africa
Development Forum, pp. 1-167.
Botha, M., 2019. Loadshedding hits Sea Point restaurant business hard. [Online]
Available at: http://www.sabcnews.com/sabcnews/loadshedding-hits-sea-point-restaurant-
business-hard/[Accessed April 2019].
Business Tech, 2019. What stage 4 load shedding means for you. [Online]
Available at: https://businesstech.co.za/news/energy/298672/what-stage-4-load-shedding-
means-for-you/[Accessed June 2019].
Chance, T., 2018. OPINION: SMEs' contribution to economy should improve. [Online]
Available at: https://www.iol.co.za/business-report/entrepreneurs/opinion-smes-
contribution-to-economy-should-improve-16419052[Accessed June 2019].
Cissokho, L. & Seck, A., 2013. Electric Power Outages and the Productivity of Small and
Medium Enterprises in Senegal. Investment Climate and Business Environment Research
Fund, Novemeber.pp. 1-28.
Cissokho, L., 2015. Productivity of Small and Medium Enterprises in Senegal: the Effects of
Power Outages. April.pp. 1-30.

42
Coetzee, D. & Els, M.-M., 2016. The impact of load shedding on the construction industry in
South Africa. Emerging trends in construction organisational practices and project
management knowledge area, 2-4 Febuary, Volume 9, pp. 268-276.
Dresch, A., C. Collatto, D. & P. L, D., 2018. Theoretical understanding between
competitiveness and productivity: firm level. Industrial Engineering, 20(2), pp. 69-86.
Du Plooy-Ciliers, F., Davis, C. & Bezuidenhout, R.-M., 2014. Research Matters.
Claremont(Cape Town): Juta & Company Ltd.
Du Toit, P., 2019. 1922 - 2019: The rise and fall of Eskom. [Online]
Available at: https://www.fin24.com/Economy/1922-2019-the-rise-and-fall-of-eskom-
20190213[Accessed June 2019].
Durdyev, S. et al., 2014. Productivity and Service Quality: Factors Affecting in Service
Industry. Social and Behavioral Sciences, January.pp. 487-491.
Eskom, 2019. Company Information Overview. [Online]Available at:
http://www.eskom.co.za/OurCompany/CompanyInformation/Pages/Company_Information.
aspx[Accessed June 2019].
Eyewitness News, 2019. Brace yourself for stage 4 load-shedding on Tuesday. [Online]
Available at: https://ewn.co.za/2019/03/18/brace-yourself-for-stage-4-load-shedding-on-
tuesday-eskom[Accessed July 2019].
House of Commons , 2018. Small businesses and productivity, s.l.: s.n.
Jacobs, K., 2015. Industry Insider: How loadshedding is affecting restaurants – and how
some are surviving against the odds. Eat Out, 7th May.
Johnston, R. & Jones, P., 2003. Service productivity Towards understanding the relationship
between operational and customer productivity. International Journal of Productivity and
Performance Management, December, 53(3), pp. 201-213.

43
Joubert, R., 2019. Cable theft during loadshedding prolongs power outages in Ermelo.
[Online] Available at: https://highvelder.co.za/77152/cable-theft-loadshedding-prolongs-
power-outages-ermelo/[Accessed May 2019].
Kohler, C., 2019. How South African Businesses Can Take Advantage of Load Shedding.
[Online]Available at: https://www.nichemarket.co.za/blog/nichemarket-advice/south-african-
business-loadshedding[Accessed 8 May 2019].
Krugman, P., 1997. The age of diminished expectations. s.l.:Cambridge.
Kumar, D. S., 2018. Understanding Different Issues of Unit of Analysis in a Business
Research. Journal of General Management Research, July, 5(2), pp. 70-82.
Le Fleur, H. et al., 2014. Informal Smal, Medium and Micro Enterprises (SMME) Retailers
in South Africa, s.l.: s.n.
Makgatho, L., 2019. Businesses hit by load shedding say it's 'not viable to render services’.
[Online]Available at: https://www.iol.co.za/news/south-africa/businesses-hit-by-load-
shedding-say-its-not-viable-to-render-services-19348044[Accessed June 2019].
Mashimbye, E., 2018. Business Report. [Online]
Available at: https://www.iol.co.za/business-report/economy/opinion-why-is-there-such-a-
spectacular-failure-rate-in-the-smme-sector-14348870[Accessed June 2019].
Mhlanga, O. & Tichaawa, T., 2016. What are the current factors affecting consumer
selection criteria in formal full service restaurants in Port Elizabeth, South Africa ?. African
Journal of Hospitality, Tourism and Leisure, 5(2), pp. 1-11.
Mhlanga, O., 2018. Drivers of restaurant efficiency in South Africa: a stochastic frontier
approach. International Journal of Culture, Tourism and Hospitality Research, 25 June,
12(4), pp. 407-419.
Nachum, L., 1999. The Productivity of Intangible Factors of Production: Some Measurement
Issues Applied to Swedish Management Consulting Firms. Journal of Service Research,
November.pp. 124-137.
44
NERSA, 2018. Annual Report 2017/2018, Pretoria: s.n.
NMPP Energy, 2017. Understanding Energy Capacity Factor. [Online]
Available at: http://www.nmppenergy.org/feature/capacity_factor [Accessed 5 June 2019].
Nurudeen, Y., Nafiu , A. & Jibo, A., 2018. An Investigation of Electricity Power Fluctuations
and Performance of Small and Medium Enterprises in Dekina, Kogi State. Journal of Energy
Research and Reviews, 17 August.pp. 1-11.
Nyanzu, F. & Adarkwah, J., 2016. Effect of Power Supply on the performance of Small and
Medium Size Enterprises: A comparative analysis between SMEs in Tema and the Northern
part of Ghana. Munich Personal RePEc Archive, 1 October.pp. 1-17.
Oehsen, S. V., 2019. 'It's a crisis,' says Helen Zille about SA’s electricity situation. [Online]
Available at: https://www.timeslive.co.za/news/south-africa/2019-04-15-its-a-crisis-says-
helen-zille-about-sas-electricity-situation/[Accessed June 2019].
Oseni, M. O., 2012. Power Outages and the Costs of Unsupplied Electricity: Evidence from
Backup Generation among Firms in Africa, s.l.: s.n.
Prof Assan, T. & Masibi, K., 2015. The impact of load shedding on ICT enterprises in
Matlosana. Dissertation submitted in fulfilment for Master’s in Business Administration at the
Mafikeng Campus of the North West University, Novemeber .pp. 1-94.
Rouse, M., 2019. Tech Target. [Online] Available at:
https://searchdatacenter.techtarget.com/definition/load-shedding[Accessed 10 June 2019].
Saunders, M. & Tosey, P., 2013. The Layers of Research Design. Research, pp. 58-59.
Scerri, M., 2015. Defining New Productivity Measures for Service and Network- Based
Firms, Sydney, Australia: s.n.
Schoeman, T. & Saunders, M., 2018. The impact of power outages on small businesses in
the City of Johannesburg. Conference on Education, Business, Humanities and Social
Sciences Studies, 18 November, Volume 10, pp. 328-333.

45
Scott, A., Darko, E., Lemma, A. & Rud, J.-P., 2014. How does electricity insecurity affect
businesses in low and middle income countries?, London: Creative Commons Attribution.
Steenkamp, H. et al., 2016. The Influence of Load Shedding on the Productivity of Hotel
Staff in Cape Town, South Africa. Expert Journal of Business and Management, 6 July.pp.
69-77.
Tang, Y., 2014. The Analysis of Restaurant Industry in Kuopio Region, s.l.: s.n.
Thelwell, E., 2014. SA electricity compared to other countries. [Online]
Available at: https://www.fin24.com/Economy/SA-electricity-compared-to-other-countries-
20141212[Accessed May 2019].
Thomas, J. E., 2017. Scholarly Views on Theory: Its Nature, Practical Application, and
Relation to World View in Business Research. International Journal of Business and
Management, 20 August, 12(9), pp. 231-240.
Villiers, J. D., 2019. 11 ways to stay safe in your home during load shedding – including
having frozen water and avoiding carbon monoxide. [Online]
Available at: https://www.businessinsider.co.za/ways-to-stay-safe-during-eskom-
loadshedding-2019-2[Accessed 6 May 2019].
Von Ketelhodt, A. & Wöcke, A., 2008. The impact of electricity crises on the consumption
behaviour of small and medium enterprises. Journal of Energy in Southern Africa, Febuary
,19(1), pp. 4-12.
Yadav, P. & Marwah, S., 2015. The Concept of Productivity. International Journal of
Engineering and Technical Research, May, 3(5), pp. 192-196.
Zulu, L. D., 2019. Revised Shedule 1 of the National Definition of Small Enterprise in South
Africa. Government Gazette, 15 March, Issue 42304, p. 110.

46
7. ANNEXURES
7.1 ANNEXTURE: QUESTIONNAIRE
THE IMPACTS OF ‘LOAD-SHEDDING’ ON NELSON MANDELA BAYS RESTURANT INDUSTRY.
My name is Tamsyn Botha and the current research forms part of my Honours thesis and will
contribute to the body of knowledge.
This survey shouldn't take longer than 10 minutes to complete as well as it is confidential and
anonymous. Your participation is voluntary, and you may withdraw at any time.
The following survey is aimed at identifying and collecting data with regards to the impacts 'load-shedding' has on the restaurant industry, within Nelson Mandela Bay.
Thank you in advance for your participation. Required*
1. Please choose the enterprise category applicable to the restaurant. * If none of the following are applicable, please do not continue with the rest of the questionnaire.
Mark only one oval.
Micro Enterprise: Employing (0-10) full-time employees Small Enterprise: Employing (11-50) full-time employees
Medium Enterprise: Employing (51-250) full-time employees
2. Is the restaurant affected by 'load-shedding'? * If your answer is no, please do not continue with the rest of the questionnaire.
Mark only one oval.
Yes
No
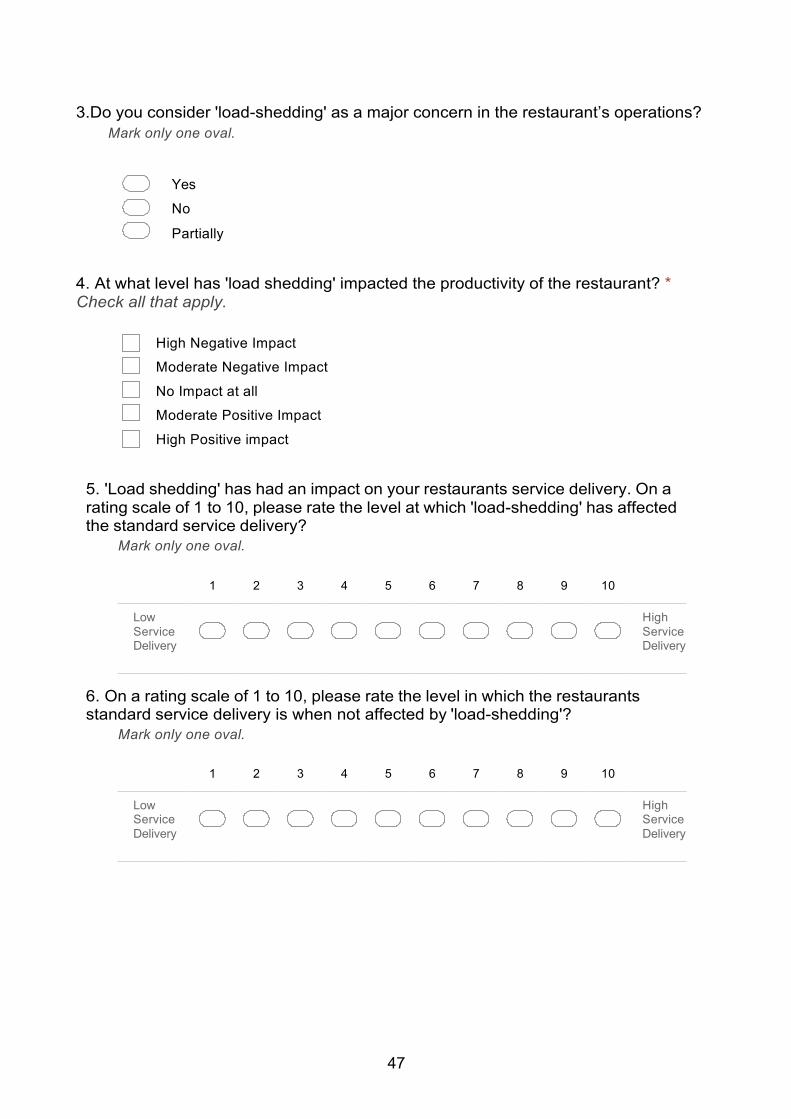
47
3.Do you consider 'load-shedding' as a major concern in the restaurant’s operations? Mark only one oval.
Yes
No
Partially
4. At what level has 'load shedding' impacted the productivity of the restaurant? * Check all that apply.
High Negative Impact Moderate Negative Impact
No Impact at all Moderate Positive Impact
High Positive impact
5. 'Load shedding' has had an impact on your restaurants service delivery. On a rating scale of 1 to 10, please rate the level at which 'load-shedding' has affected the standard service delivery?
Mark only one oval.
1 2 3 4 5 6 7 8 9 10
Low Service Delivery
High Service Delivery
6. On a rating scale of 1 to 10, please rate the level in which the restaurants standard service delivery is when not affected by 'load-shedding'?
Mark only one oval.
1 2 3 4 5 6 7 8 9 10
Low Service Delivery
High Service Delivery

48
7. Please select the options that have been affected by 'load-shedding'? * Check all that apply.
1: Staff (e.g. minimizing the number of employees due to unproductive hours) 2: Operations (e.g. the challenge to place orders to the kitchen)
3. Additional Costs (e.g. Increase in wastage) 4. Security (e.g. alarm system not activated during 'load-shedding' hours)
5. Damaged machinery and equipment (e.g. problems occurring with the Point-Of-Sale terminals)
6. Revenue (e.g. decrease in income)
8. Please tick the applicable boxes of actions taken as a result of 'load-shedding'?*
Check all that apply.
1: Reducing the amount of staff 2: Closing doors for the duration of 'load-shedding'
3: Shortened menu during 'load-shedding' hours 4: Working extra hours to prepare for load-shedding
5. Keeping up with the 'load-shedding' schedule
9. Does the restaurant make use of a secondary energy source?
Mark only one oval.
Yes No
10. What secondary energy sources have been implemented? Mark only one oval.
A generator
Solar energy
Gas
Battery power
None

49
11. Is it more costly to invest in a secondary energy source compared to having reliable power supply from Eskom?
Mark only one oval.
Yes No
12. Thinking about the months were 'load shedding' was most frequent within the
restaurant, how long did the average load shedding period last?
Mark only one oval.
Below 2 hours
2-4 hours
5-8 hours
Above 8 hours
13. Has the traffic of customers increased or decreased in the restaurant during
'load-shedding' hours?
Mark only one oval.
Increased
Decreased No Noticeable difference
14. What has been the biggest impact/s of 'load-shedding' on the restaurant? 15. What has the restaurant implemented to manage the impact/s of 'load-shedding'?

50
16. Have there been any positive outcomes of 'load-shedding'?Check all that apply.
1. Awareness to become more sustainable (e.g. replacing equipment with power saving
equipment)2. Having a competitive advantage over restaurants who do not have a backup planduring 'load- shedding
3. Decrease in energy consumption costs4. None
Powered by

51
7.2 ANNEXTURE: ETHICS CLEARANCE LETTER

52
7.3 ANNEXTURE: ORIGINALITY REPORT

53
7.5: ANNEXTURE: THE FINAL RESEARCH REPORT SUMMARY DOCUMENT
THE IMPACT OF ‘LOAD-SHEDDING’ WITHIN THE NELSON MANDELA BAY RESTAURANT INDUSTRYResearch Purpose/ Objective
Primary Research Question Research Rationale Seminal Authors/
Sources Literature Review/
Conceptual Framework Paradigm Approach Data Collection Method(s)
Ethical considerations Anticipated Findings References
To identify a relationship
between ‘load-shedding’ and
restaurants productivity as
well as to distinguish the
mitigation techniques that
restaurants have implemented to alleviate these
effects.
What is the impact of ‘load-shedding’ on productivity within
the restaurant industry, in NMB?
This study is important as a
number of studies have shown that the
uncertainty of reliable electricity supply may cause businesses to
hold back on investing in the
growth of their firms and face potential liquidation. Which
may result in a restriction of the
economy’s growth and development.
Kumar, D. S., 2018.
Understanding Different Issues of Unit of Analysis in
a Business Research. Journal
of General Management
Research, July 5(2).
Du Plooy-Cilliers, F., Davis, C. &
Bezuidenhout, R.-M., 2014.
Research Matters. Claremont (Cape
Town): Juta & Company Ltd.
Input-Process-Output Model
Service Productivity
The reason for ‘Load-shedding’
The importance of electricity
The impact on restaurants inputs
The impact on restaurants outputs
The techniques implemented to mitigate
the effects of ‘load-shedding’
Positivism:
A positivistic paradigm was
conducted according to the
study’s empirical-analytical nature.
In terms of a causal (cause and
effect) relationships
between variables concerning ‘load-shedding’ and the
productivity of restaurants’
through structured observation.
.
Quantitative Analysis
Questionnaires were developed, administrated, collected and
evaluated by the researcher, through
a cross-sectional survey design. The
survey included close-ended,
multiple choice, matrix and linear
numeric scale questions sign.
Participation was voluntary.
Consent through survey
Could have withdrawn at any
time.
Anonymity was ensured.
Not subjected to any physiological or physical pain or
discomfort.
The anticipated findings of this study were to discover a negative impact on
restaurants productivity from the
impact of ‘load-shedding’ and the
popular use of generators to mitigate
the impact.
Ado, A. & Josiah, M. M.,2017
Arlet, J., .2015
Cissokho, L., 2015
Coetzee, D. & Els, M.-M., 2016
Eskom, 2019.
Mhlanga, O., 2018.
Nyanzu, F. & Adarkwah, J., 2016.
Oseni, M. O., 2012.
Prof Assan, T. & Masibi, K., 201.
Schoeman, T. & Saunders, M., 2018.
Scott, A., Darko, E., Lemma, A. & Rudi,
J.-P., 2014
Steenkamp, H. et al., 2016.
Population
All restaurants impacted by ‘load-shedding’ that are situated in Marine
drive, Summerstrand and Humewood area, in
NMB, SA.
Research Problem Secondary
Questions Secondary Objectives Key Theories Key Concepts Sampling
Data Analysis Method(s) Limitations Anticipated
Contribution
‘Load-shedding’ contributes to the high failure rate
of restaurants as they are not capable of
reaching their maximum
productivity as businesses
activities rely on the continuous
and efficient flow of electricity.
1. Is there an impactof ‘load-shedding’
restaurants in NMB?
2. What inputs havebeen affected by‘Load-shedding’?
3. What outputs have been affected by‘Load-shedding’?
4. What techniquescould restaurants
implement to manage the impacts of ‘Load-shedding’?
1. To determine theimpact of through
observing managers/ owners’ views.
2. To establish heimpact on restaurants
inputs.
3.To establishrestaurants outputs
affected.
4.To determine theimplementedtechniques of
mitigation.
Input-Process-Output Model
Service Productivity
‘Load-shedding’
Unplanned/Planned ‘Load-shedding’
Mitigation
Productivity
Restaurant Industry
Inputs
Outputs
Convenience sampling
Sampling Size:
20 respondents
Descriptive statistics were
utilised to analyse the data.
The data set was inspected for any
incomplete questionnaires.
Graphical representation of
findings was presented in pie
graphs, bar graphs and tables.
Time frame (six months)
Small Sample of 20 hindered the
results to be generalised to
the larger population
An understanding of the negative impact ‘load-shedding’ has
on the productivity of restaurants in NMB.
Discovering techniques of
mitigation that may have been
unforeseen and uncovering the most
popular mitigation method.

54
7.5 ANNEXTURE: REVISED SHEDULE 1 OF THE NATIONAL DEFINITION OF
SMALL ENTERPRISE IN SOUTH AFRICA

55