the impact of marketing mix elements on brand …...brand loyalty is one of the authentic and famous...
TRANSCRIPT

Marketing and Branding Research 2(2015) 44-63
MARKETING AND BRANDING
RESEARCH
WWW.AIMIJOURNAL.COM
INDUSTRIAL
MANAGEMENT
INSTITUTE
The impact of marketing mix elements on brand loyalty: A case study of mobile phone
industry
Adel Pourdehghan
Master of Science in Business Administration, Persian Gulf University, Bushehr, Iran
ABSTRACT
Keywords: Brand Loyalty, Marketing Mix, Satisfaction, Trust, Mobile Phone Industry
In today's highly competitive markets, keeping customers and retaining their loyalty is considered crucial in maintaining business. Companies and retailers also need to look for various marketing strategies in order to improve their customers’ loyalty. Having knowledge and skills about marketing is one of the capabilities which is required for success in the competition. In consumable markets, brands are the main points of differentiation between the competitive presentations, thus, they are crucial for the success of the companies. The purpose of this study was to analyze the impact of marketing mix elements on brand loyalty. The present study is applicable in terms of objective and descriptive survey in terms of data collection. To evaluate the model and hypotheses, data collection was carried out through surveying 384 mobile phone users. For data analysis and verification of the model, structural equation modeling approach (SEM) and confirmatory factor analysis (CFA) were used and based on the results of the path analysis, the relationship between the variables in the model is investigated. Results indicated the positive impact of products elements, distribution channels, and promotional activities on brand loyalty. Also, the findings showed that indexes of satisfaction and trust which are considered as mediating variables between marketing mix and brand loyalty had positive and significant impact on brand loyalty in the mobile phone industry.
Correspondence: [email protected]
©AIMI Journals
According to the challenges of business, organizations attempt to attract new customers and
have adopted the strategy of keeping the current customers and inspiring their loyalty.
Therefore, the customer satisfaction is not sufficient and marketer must attempt to improve
and promote their loyalty more and more. In such a paradigm, the objective is to establish
45 Marketing and Branding Research 2(2015)
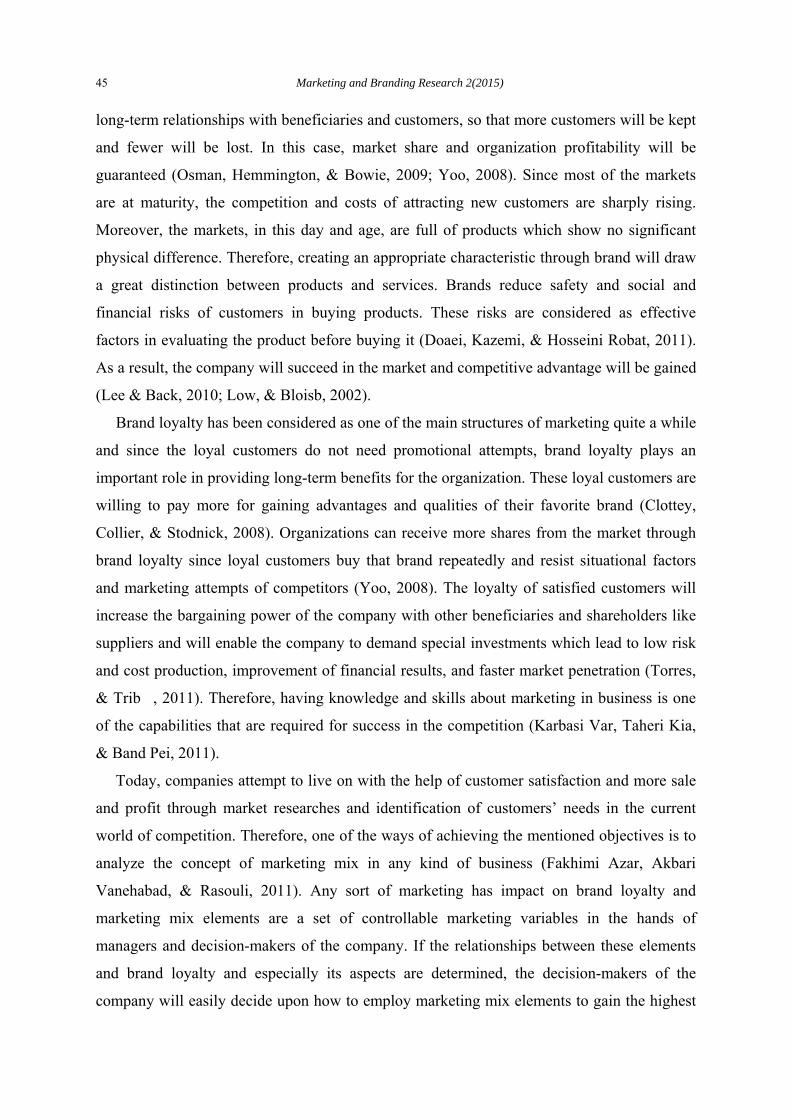
long-term relationships with beneficiaries and customers, so that more customers will be kept
and fewer will be lost. In this case, market share and organization profitability will be
guaranteed (Osman, Hemmington, & Bowie, 2009; Yoo, 2008). Since most of the markets
are at maturity, the competition and costs of attracting new customers are sharply rising.
Moreover, the markets, in this day and age, are full of products which show no significant
physical difference. Therefore, creating an appropriate characteristic through brand will draw
a great distinction between products and services. Brands reduce safety and social and
financial risks of customers in buying products. These risks are considered as effective
factors in evaluating the product before buying it (Doaei, Kazemi, & Hosseini Robat, 2011).
As a result, the company will succeed in the market and competitive advantage will be gained
(Lee & Back, 2010; Low, & Bloisb, 2002).
Brand loyalty has been considered as one of the main structures of marketing quite a while
and since the loyal customers do not need promotional attempts, brand loyalty plays an
important role in providing long-term benefits for the organization. These loyal customers are
willing to pay more for gaining advantages and qualities of their favorite brand (Clottey,
Collier, & Stodnick, 2008). Organizations can receive more shares from the market through
brand loyalty since loyal customers buy that brand repeatedly and resist situational factors
and marketing attempts of competitors (Yoo, 2008). The loyalty of satisfied customers will
increase the bargaining power of the company with other beneficiaries and shareholders like
suppliers and will enable the company to demand special investments which lead to low risk
and cost production, improvement of financial results, and faster market penetration (Torres,
& Trib�, 2011). Therefore, having knowledge and skills about marketing in business is one
of the capabilities that are required for success in the competition (Karbasi Var, Taheri Kia,
& Band Pei, 2011).
Today, companies attempt to live on with the help of customer satisfaction and more sale
and profit through market researches and identification of customers’ needs in the current
world of competition. Therefore, one of the ways of achieving the mentioned objectives is to
analyze the concept of marketing mix in any kind of business (Fakhimi Azar, Akbari
Vanehabad, & Rasouli, 2011). Any sort of marketing has impact on brand loyalty and
marketing mix elements are a set of controllable marketing variables in the hands of
managers and decision-makers of the company. If the relationships between these elements
and brand loyalty and especially its aspects are determined, the decision-makers of the
company will easily decide upon how to employ marketing mix elements to gain the highest

Adel Pourdehgan 46
brand value and stable profit. In order to accomplish these purposes, appropriate marketing
mix plays a leading role in implementing the strategies of business marketing (Khodadad
Hosseini & Rezvani, 2009).
Due to the features of products in the mobile phone industry, the importance of brand
loyalty in these products is extremely high and the product or service choice of this industry
is made through its brand. Thus, owing to the starring role of branding in the country’s
industry and the importance of brand loyalty in the mobile phone industry, the necessity for
studying the effective factors in brand loyalty in markets especially the mobile phone
industry which its products involve more complexity and require special support services is
quite obvious. In such industry, due to the high risk of purchase, the buyers prefer famous
and strong brands to other brands in the market. However, more attentions must be paid to
develop a systematic view on products and brands and it is determined that how pricing
decisions, promotion, services, and distribution are combined with the product with the help
of brand manager, so that brand loyalty is developed and affects the buyer’s decision-making
(Karbasi Var et al., 2011). Therefore, in this study, the relationships between marketing mix
elements and brand loyalty are investigated and it is tried to realize that how these marketing
practices increase or reduce brand loyalty. This study also helps the related companies to
strengthen their brands and financial performance through planning appropriate strategies
concerning the major effective factors in brand loyalty and devoting more financial resources
to these factors.
Brand Loyalty
Nowadays, brand is considered as a strategic requirement of organizations which stabilizes
them in placing more value on customers and developing competitive advantages (Gilani Nia
& Mousavian, 2010). The concept of brand is defined as a name, term, sign, symbol, or
design or a combination of them which is intended to identify the goods and services of one
seller or a group of sellers and to differentiate them from those of competitors (Eckert,
Louviere, & Islam, 2012, 2012). For consumers, brands are used to determine producers,
products, product value, and the image of the company and are converted into a device for
purchasing decisions (Sheng, & Teo, 2012; Wang, & Tzeng, 2012).
Brand loyalty is one of the authentic and famous concepts in marketing and it refers to
maintaining customer’s deep commitment to re-buy and select a product or service from a
particular brand and repeats it continually in the future (Chandon, Leo, & Philippe, 1997).

47 Marketing and Branding Research 2(2015)
The main objective of brand management is to develop loyalty in the customer (Boo, Busser,
& Baloglu, 2009). A loyal customer refers not only to its favorite organization frequently to
buy products or use services, but also plays an important role in increasing profit and
improving the organization image in the minds of potential customers through advertising
products and services of the organization for kinsfolk, friends, and other people (Gharecheh
& Dabooeian, 2011). In general, researchers have defined brand loyalty as a deep
commitment to re-buy a preferred service or product consistently in the future, despite
situational influences and marketing efforts to change behavior (Baldauf, Cravens,
Diamantopoulos, & Zeugner-Roth, 2009; Camarero, Garrido, & Vicente, 2010;
Chattopadhyay, Dutta, & Sivani, 2010). In fact, brand loyalty refers to the priority and first
choice of customers for choosing the company which provides products and services, thus, it
makes the customers reuse those products and services and be committed to recommend them
to others (Biedenbach, Bengtsson, & Wincent, 2011). Brand loyalty leads to some marketing
benefits like reducing cost, profitability, and positive word-of-mouth advertising (Chen, Su,
& Lin, 2011), building barriers to competitors, strengthening the company in case of
competitive threats, increasing sale and outcome, and reducing customers’ sensitivity towards
the competitors’ marketing attempts (Sahin, Zehir, & Kitapç, 2011). Loyal customers show
more desirable reaction to a particular brand than disloyal customers (Chattopadhyay et al.,
2010). Loyalty is described through attitudinal indexes of trust, enthusiasm and tendency to
re-buy a brand as the first choice (Tasci & Guillet, 2011).
Customer Satisfaction
Customer satisfaction is necessary for long-term success in business and is one of the most
important research issues in marketing (Nam, Ekinci, & Whayatt, 2011). The main
motivation for increasing emphasis on customer satisfaction is that higher customer
satisfaction may lead to stronger competitive position, higher market share and profitability,
reduction in price elasticity, lower cost of business, prevention of cost breakdown, increase in
customer lifetime value, and reduction in cost of new customer attraction (Bayraktar,
Tatoglu, Turkyilmaz, Delen, & Zaim, 2012; Torres & Tribó, 2011). Generally, satisfaction is
defined as the general evaluation based on shopping experience and using a particular
product or service during the time (Lee, & Back, 2010). Customer satisfaction is the
customer’s attitude towards products or services which infulence their behavior. If customers
are satisfied with a particular product or service, they will probably re-buy them (Ryu, Han,

Adel Pourdehgan 48
& Kim, 2008). The main focus of marketing is on identifying and meeting the needs of
consumers. After discovering the target market, the companies must engage in some activities
to meet the needs of their consumers. In this regard, they use 4P’s or marketing mix which
was first proposed by professor Mccarthy (Vazir Zanjani, Motameni, & Mousavi, 2010).
Since in many researches it was concluded that customer satisfaction does not have direct
impact on customer loyalty to brand, trust is considered as a moderator variable in the
relationship between these two facotrs. Results indicate that customer satisfaction indirectly
builds brand loyalty through affecting brand trust (Gilani Nia & Mousavian, 2010).
Brand Trust
Amine (as cited in Sahin et al., 2011) stated that the trust in the purchased brand may be
viewed as leverage of its credibility, which in return may reinforce the consumers’ repeat
buying behavior (p. 1291). Brand trust is determined as the desire and eagerness of the
average consumer to count on the capability of the brand to implement its stated function
(Sahin, et al., 2011). Brand trust in costumers’ view is a psychological variable which is
established through a set of hypotheses or assumptions regarding reliability, trust, safety,
honesty, and generosity to brand by costumers (Gurviez & Korchia, 2002; Zehir et al., 2011).
Brand trust is derived from the experience of using previous products of the brand and is
established through various variables such as company advertisement, word-to-mouth
advertising, using the products of the brand, and satisfaction (Ashley & Leonard, 2009). Trust
has a close relationship with loyalty; the more customers put their trust in a particular brand
and its products, due to the risk-aversion nature of people and reducing the risk of shopping,
the more they try to buy products of the same brand and the less they show tendency towards
other brands (Agustin & Singh, 2005). Brand trust is developed and improved through
customers’ positive views on their expectations of organization behavior and the efficiency of
the product (Ashley & Leonard, 2009). The importance of trust structure depends on
maintaining the relationship between seller and buyer, thus, trust has an increasing impact on
customers’ loyalty during the time (Chiou & Shen, 2006).
Marketing Mix
Marketing refers to searching for the most appropriate market and the sections that the
organization can be more effective and useful and fulfill the needs of people. In other words,

49 Marketing and Branding Research 2(2015)
marketing is the conscious attempt to allocate resources and establish allocation in the market
(Rousta et al., 2004). The concept of marketing mix was first proposed by Neil Borden in
1949. However, the most common variables in marketing mix (product, price, distribution
and promotion) were introduced by Mccarthy and were known as 4Ps. Until now, there has
been no considerable change in the concept of marketing mix and in many researches, 4P is
still the coordination concept that other aspects of marketing are organized around it. The
most common definition of marketing mix in target market is to offer the proper product at a
reasonable price in the proper place and time. To put it another way, marketing decision
variables in different models of marketing mix provide a framework through which the
business develop plans for its marketing activities (Khodadad Hosseini & Rezvani, 2009).
Marketing mix indicates the fundamental activities of marketing managers. After selecting a
target market, the marketing managers must develop a systematic plan for selling to
customers and establishing long-term and loyal relationships. Marketing plan includes
decisions on product, price, promotion and distribution. These are the most important parts
that marketing managers must allocate company resources to them to achieve the objectives
of sale and profitability (Garavand, Nourayi, & Saee Arasi, 2010).
Product
Product refers to what a production or service unit or even an individual offers. In marketing
mix, product is defined as what is offered to market for noticing, buying, or using which may
meet a need. Product may include a physical object, service, place, organization, or even an
idea (Fakhimi Azar et al., 2011). In the current study, the quality of product has been
considered as the most important factor in the mobile phone industry. The quality of product
plays an important role in brand preferences of shops. The consumers often judge the product
or brand by the perceived quality (Sheau-Fen, Sun-May, & Yu-Ghee, 2012). Perceived brand
quality can be identified as the consumer’s general subjective judgment on the advantage or
superiority of a product which is derived from the evaluation process of its different features
(Beristain & Zorrilla, 2011). The chance of success for brands of higher perceived quality is
more than brands of lower perceived quality (Sheena et al., 2012).
Price
There is a major difference between price and other marketing mix factors; price is an
income-making factor while other marketing mix factors are costly. Price as a marketing tool

Adel Pourdehgan 50
is a key factor in selling product to customers. Following this, pricing can be effectively used
to indicate the position of a product in proportion to other competitors and this can provide
reliable information regarding the different sections of the market. Moreover, price is a
quality index and products must be analyzed in terms of the advantages they offer (Khazaei
Pool & Baloee Jam Khaneh, 2011). In consumable markets, price is an external indication of
product quality and high-price brands are considered as high-quality brands (Kim & Hyun,
2011). On the other hand, since the quality of a product is a norm and can be easily proved,
higher price may have negative effect on brand loyalty; because it may lack the indication of
higher quality and it just highlights the more money that must be paid (Cretu & Brodie,
2007).
Promotion
Advertisement or promotion in marketing mix refers to establishing relationships with
customers to inform them or affect their attitude or behavior. Promotion is used to inform
people of products and encourage the buyers in target market to buy particular brands.
Promotion stimulates attention and sometimes arouses interest. Promotion techniques such as
prize draw, price stimuli, free samples, etc. have great impact on promoting the customers to
shopping through encouraging the customer to test a brand. Promotion is based on
communication and includes all the communicative tools that pass on a particular message
(Khazaei Pool & Baloee Jam Khaneh, 2011). Promoting design tools to buy faster is confined
to a period of time (Valette-Florence, Guizani, & Merunka, 2011). Promotions lead to
developing knowledge of brand for all the promoted products and brands (Huang &
Sarigöllü, 2012; Buil et al., 2013). However, promotions of repeated sales like reduction in
price in a short time, discount, repay, and coupon may thwart the attempts of brand because it
may be a low-quality signal or an outdated kind. Repeated price promotions may confuse the
costumers since they may not understand that why high-quality products are promoted and
offered at special price. According to self-perception theory, those customers who choose a
product based on price promotions (an external reason) rather than positive attitude towards
the product (an internal reason) will change their choice and choose other products whenever
the external reason is eliminated (Baldauf et al., 2009; Buil, Chernatony, & Martínez, 2013).
Distribution

51 Marketing and Branding Research 2(2015)
Distribution refers to activities that are done to deliver a product or service to customers.
Distribution and place are the simplest terms in 4P; however, they play a very important role
in it. In this study, distribution refers to all the shops and authorized resellers of the studied
brand. In consumer marketing, research shows that channel performance contributes to
building brand loyalty. Good store-image not only attracts more attention, interests, and
contacts from potential consumers, but also it increases consumer satisfaction and positive
word-to-mouth. Moreover, distributing through good-image stores signals that a brand has
good quality. Moreover, distribution intensity has a positive effect on aspects of brand loyalty
as high distribution intensity expands the probability of buying a brand wherever and
whenever consumers want. Specifically, since the increase in distribution intensity reduces
consumer efforts for finding and acquiring a brand, consumers are likely to perceive it more
valuable which in turn increases consumer satisfaction and brand loyalty (Kim & Hyun,
2011). The store-image is reflected in quality and diversity of products, convenience, price,
physical environment of shops, and the quality of services. These signals influence the
costumers’ attitude towards the shop as a whole and its brand as a general assessment (Huang
& Sarigöllü, 2012; Kim & Hyun, 2011). The store image can be defiend as a particular type
of feedback from those in a given market regarding the credibility of the identity claims that
the organization makes (Kim & Hyun, 2011).
Background of the Study
The importance of marketing mix and brand loyalty has led to various researches on these
facts. Heidarzadeh and Zarbi (2008) in their paper have investigated the effect of marketing
mix elements on brand equity. The results indicated that the mental image of store,
advertising price, and the amount of distribution have positive and direct impact on brand
equity. In other words, providing products in a good-image store with extensive advertising
and distribution of products will raise brand equity (Heidarzadeh & Zarbi, 2008). Doaei et al.
(2011) in their research concluded that costumers’ perception of marketing mix had positive
and significant impact on brand equity. Put differently, products at reasonable price, good
store image, extensive advertising, and prompt distribution in stores will lead to clear
costumer’s perception of brand and consequently increase the amount of purchasing and
promote the brand (Doaei et al., 2011). In another study, conducted by Allameh and
Noktedan (2010), they concluded that there was a positive and significant relationship
between service quality and customer’s loyalty. Variables, namely trust and satisfaction

Adel Pourdehgan 52
mediated between service quality and loyalty and had positive and significant impact on
building customers’ loyalty. Nam et al. (2011) in their study concluded that consumer
satisfaction had positive impact on brand loyalty. Beristain and Zorrilla (2011) in their
research found that price and store-image are the most improtant factors in brand loyalty. In
another research conducted by Kim and Hyun (2011), they concluded that distribution
channel performance, promotion activities and imrpoving after sales service, brand
awareness, perceived quality, and store image are the most important factors in brand loyalty.
The results of other studies regarding brand loyalty are summarized in Table 1.
Table 1 The Results of Other Related Researches
Author and Year Title of the Paper Effective Factors in Brand Loyalty
Hosseini and Rezaie (2011) An investigation on effective factors in brand loyalty of dairy products market
Price, taste, advertisement, packing, availability and recommendation advertisements
Atafar and Mansouri (2011) Model of improving customer loyalty in electronic stores
Services, trust
Hamidizadeh, Haj Karimi, Babaie Zakliki, and abatabai Nasab (2009)
Designing and explaining the process model of customer loyalty: a case study of private banks
Satisfaction, commitment and trust
He, Li, and Harris (2012) Social identity perspective on brand loyalty Trust and customer satisfaction
Buil et al. (2013) Examining the role of advertising and sales promotions in brand equity creation
Perceived quality, brand associations, brand awareness and promotion
Sahin et al. (2011)
The effects of brand experiences, trust and satisfaction on building brand loyalty; An empirical research on global brands
Satisfaction, trust and experience
Shi, Chen, and Ma (2011) A study of customer loyalty based on switching cost and brand attachment Satisfaction
Hung and Fu (2010) Brand management model of vocational high schools in Taiwan
Promotion (external and internal), services, place (distribution) and brand positioning
Lee and Back (2010) Reexamination of attendee-based brand equity Trust and satisfaction
Casaló, Flavián, and Guinalíu (2010)
Relationship quality, community promotion and brand loyalty in virtual communities: Evidence from free software communities
Promotion, participation and satisfaction
The Study
In this part, the conceptual model is presented to investigate the impact of marketing mix
elements on brand loyalty, considering the impacts of satisfaction and trust variables on brand
through studying the relationships of mentioned structures, background of the study, and the
literature. The conceptual framework is provided in Figure 1. This framework includes seven

53 Marketing and Branding Research 2(2015)
variables of price, product quality, promotion, distribution, customer satisfaction, brand trust,
and customer loyalty.
Figure 1. The conceptual model of the research
Research Hypotheses
According to the model of the research, the following hypotheses guided the study:
H1a: Distribution channel performance has positive and significant impact on brand loyalty.
H1b: Distribution channel performance has positive and significant impact on customer
satisfaction.
H1c: Distribution channel performance has positive and significant impact on brand trust.
H2a: Price has positive and significant impact on brand loyalty.
H2b: Price has positive and significant impact on customer satisfaction.
H2c: Price has positive and significant impact on brand trust.
H3a: Promotion activities of company and store have positive and significant impact on brand
loyalty.
H3b: Promotion activities of company and store have positive and significant impact on
customer satisfaction.
H3c: Promotion activities of company and store have positive and significant impact on brand
trust.

Adel Pourdehgan 54
H4a: Customer’s perception of product quality has positive and significant impact on brand
loyalty.
H4b: Customer’s perception of product quality has positive and significant impact on
customer satisfaction.
H4c: Customer’s perception of product quality has positive and significant impact on brand
trust.
H5: Customer satisfaction has positive and significant impact on brand loyalty.
H6: Customer satisfaction has positive and significant impact on brand trust.
H7: Brand trust has positive and significant impact on brand loyalty.
Method
The statistical population of this research includes all the customers and users of mobile
phone in Bushehr. Since the statistical population was homogeneous and there was no
significant difference in it, simple random sampling was conducted. Moreover, as the
statistical population was unlimited, the statistical sample size at the 95% level of assurance
was equal to 384 through Cochran sampling formula. In the present study, to collect the data,
450 questionnaires were distributed among customers and users. Afterwards, 384 completed
questionnaires were selected for data analysis. The questionnaire which was a mixture of
questionnaires from other researches in this field has been designed through 7-point Likert
scales. However, some modifications and adjustments were made according to our country
circumstances. To measure the validity of the questionnaire, logical validity and construct
validity were considered and in this regard, content validity, face validity, and factor validity
(factor analysis) were analyzed. The factor validity of the questionnaire was tested through
confirmatory fact analysis and AMOS software and factor loadings less than 0.5 were
deleted. In addition, the content validity of the questionnaire was confirmed and modified by
the experts and professors. To calculate the reliability of the questionnaire and assure the
internal consistency of research measuring tools, Cronbach’s alpha test was conducted. In this
regard, all indexes were more than 0.6 and Cronbach’s alpha was equal to 0.924 which
indicated that the reliability of the research questionnaire. Table 2 shows the amounts of
standard factor loadings and Cronbach’s alpha.

55 Marketing and Branding Research 2(2015)
Table 2 Amounts of Standard Factor Loadings and Cronbach’s Alpha
Variables Items Standard
Factor Loadings
Cronbach’s Alpha Variables Items
Standard Factor
Loadings
Cronbach’s Alpha
Price
Pri1 Pri2 Pri3
0.65 0.69 0.50
0.719
promotion
Pi1 (deleted) Pi2 (deleted)
Pi3 Pi4 Pi5
0.13 0.21 0.79 0.81 0.64
0.670
Trust Tr1 Tr2 Tr3
0.76 0.61 0.76
0.762
Product Quality
Pro1 Pro2 Pro3
Pro4 (deleted) Pro5 (deleted)
Pro6 Pro7
0.62 0.56 0.62 0.34 0.49 0.55 0.73
0.761 Distribution channel
Cha1 Cha2 Cha3 Cha4 Cha5
(deleted) Cha6
(deleted) Cha
0.61 0.75 0.67 0.71 0.49 0.42 0.62
0.751
Satisfaction Sat1 Sat2 Sat3
0.77 0.65 0.74
0.741 Brand loyalty
Loy1 Loy2 Loy3 Loy4 Loy5
0.56 0.73 0.80 0.78 0.80
0.845
In the current study, to analyze the data, the two-phase method has been conducted. In the
first phase, confirmatory factor analysis is performed and in the second phase, path analysis is
used to analyze the relationships between the structures. Therefore, for data analysis and
model confirmation, structural equation model (SEM) and confirmatory factor analysis
(CFA) are performed and according to the results of path analysis, the relationships between
model variables are investigated. AMOS software has been used to test the hypothesis and
fitness of the model. Table 3 presents the researchers’ criteria in measuring variables of
research.
Table 3 Researchers’ Criteria in Measuring Variables of Research Variables Researchers
Price Beristain and Zorrilla, (2011); Kim and Hyun, (2011)
Product Quality Biedenbach et al., (2011); Buil et al., (2013); Kim & Hyun, (2011)
Distribution Channel Baldauf et al., (2009); Kim & Hyun, (2011)
Promotion Baldauf et al., (2009); Buil et al., (2013)
Trust Lee & Back, (2010)
Satisfaction Lee & Back, (2010)
Brand Loyalty Biedenbach et al., (2011); Buil et al., (2013)

Adel Pourdehgan 56
Results
Demographic Findings
Demographic characteristics of the studied sample are summarized in Table 4.
Table 4 Demographic Characteristics of Respondents
Descriptive Characteristics Frequency Percentage of Distribution
Gender
Male 278 72.4%
Female 106 27.6%
Educational Degree
Undergraduate Diploma 54 14.06%
Diploma 70 18.22&
Associate Degree 40 10.41%
Bachelor’s Degree 171 44.53%
Master’s Degree and Higher 49 12.76%
Age
Under 20 Years Old 141 36.71%
20 to 25 Years Old 227 59.11%
Over 25 Years Old 16 4.16%
Marital Status
Single 302 78.64%
Married 82 21.36%
The Model and its Analysis
In this paper, the model of measuring the impact of marketing mix elements on customers’
loyalty to mobile phone brand is a structural equation model and includes the whole
relationships between its variables. In fact, a structural equation model is a combination of
path diagram and confirmatory factor analysis and to investigate them, the method of
structural equation model is conducted. The final model derived from data collection is
illustrated in Figure 2.

57 Marketing and Branding Research 2(2015)
Figure 2. Operating model of the research
In confirmatory factor analysis, there are many criteria for evaluating fitness of the model.
In Table 5, accepted fitness and earned values are presented for the research model through
AMOS software.
Table 5 Fitness of Final Model Indexes Fit Index Symbol Earned Values Fit Index Goodness of Fit Index GFI 0.907 Higher than 0.9
Adjusted Goodness of Fit Index AGFI 0.88 Higher than 0.85 Tucker-Lewis Index TLI 0.925 Higher than 0.9
Comparative Fit Index CFI 0.937 Higher than 0.9
Incremental Fit Index IFI 0.938 Higher than 0.9 Parsimonious Normed Fit Index PNFI 0.729 Higher than 0.5
Root-Mean-Square Error of Approximation RMSEA 0.046 Lower than 0.1 Chi-Square Minimum Discrepancy Function CMIN/df 1.828 1 to 3
These indexes indicated the fitness of designed model. In fact, the theoretical model of the
research is confirmed. Since this model was confirmed by fit indexes, we can use it to test the
hypotheses. If the model which is drawn as a diagram is confirmed by fitness of model
indexes, this path diagram can be used to test hypotheses to know whether there are
relationships between variables of path diagram or not. Path diagram includes relationships
between the variables of the research which indicates the general model of the study and its
hypotheses. In addition to the general fit indexes of the model, the partial fit indexes are
investigated in the structural equation model as well. In partial fit indexes, the significance of
Adel Pourdehgan 58
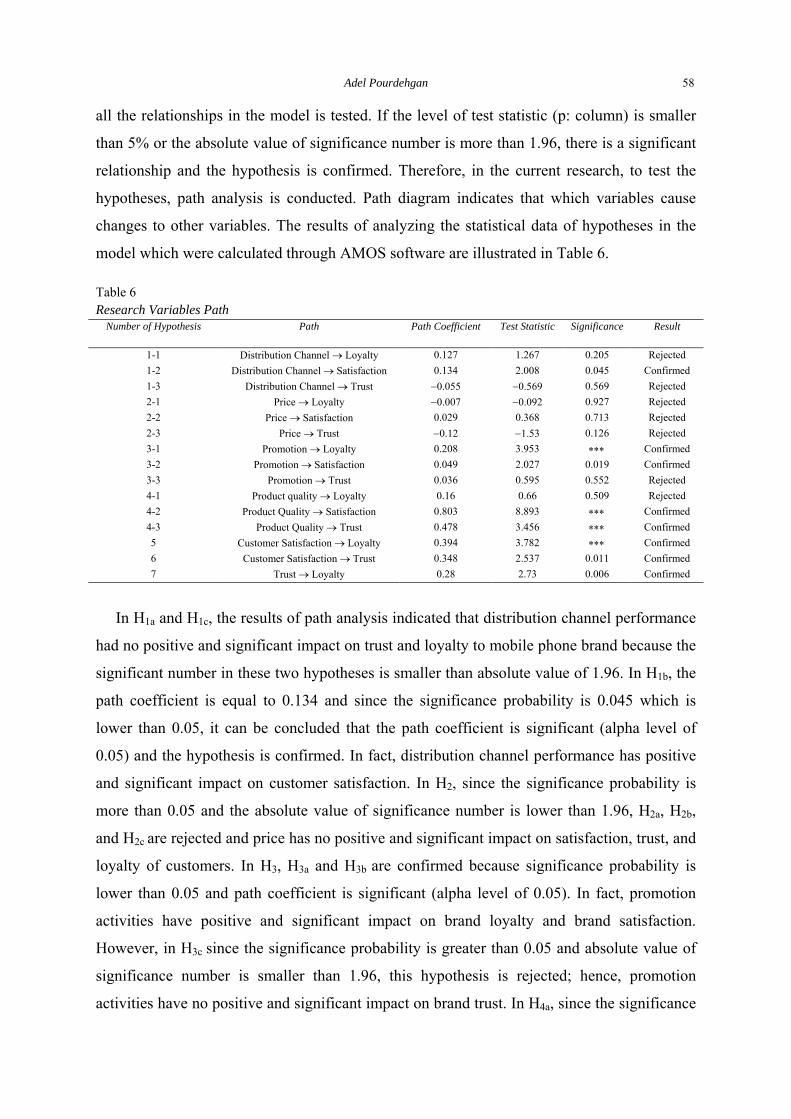
all the relationships in the model is tested. If the level of test statistic (p: column) is smaller
than 5% or the absolute value of significance number is more than 1.96, there is a significant
relationship and the hypothesis is confirmed. Therefore, in the current research, to test the
hypotheses, path analysis is conducted. Path diagram indicates that which variables cause
changes to other variables. The results of analyzing the statistical data of hypotheses in the
model which were calculated through AMOS software are illustrated in Table 6.
Table 6 Research Variables Path
Number of Hypothesis Path Path Coefficient Test Statistic Significance Result
1-1 Distribution Channel Loyalty 0.127 1.267 0.205 Rejected
1-2 Distribution Channel Satisfaction 0.134 2.008 0.045 Confirmed
1-3 Distribution Channel Trust 0.055 0.569 0.569 Rejected
2-1 Price Loyalty 0.007 0.092 0.927 Rejected
2-2 Price Satisfaction 0.029 0.368 0.713 Rejected
2-3 Price Trust 0.12 1.53 0.126 Rejected
3-1 Promotion Loyalty 0.208 3.953 Confirmed
3-2 Promotion Satisfaction 0.049 2.027 0.019 Confirmed
3-3 Promotion Trust 0.036 0.595 0.552 Rejected
4-1 Product quality Loyalty 0.16 0.66 0.509 Rejected
4-2 Product Quality Satisfaction 0.803 8.893 Confirmed
4-3 Product Quality Trust 0.478 3.456 Confirmed
5 Customer Satisfaction Loyalty 0.394 3.782 Confirmed
6 Customer Satisfaction Trust 0.348 2.537 0.011 Confirmed
7 Trust Loyalty 0.28 2.73 0.006 Confirmed
In H1a and H1c, the results of path analysis indicated that distribution channel performance
had no positive and significant impact on trust and loyalty to mobile phone brand because the
significant number in these two hypotheses is smaller than absolute value of 1.96. In H1b, the
path coefficient is equal to 0.134 and since the significance probability is 0.045 which is
lower than 0.05, it can be concluded that the path coefficient is significant (alpha level of
0.05) and the hypothesis is confirmed. In fact, distribution channel performance has positive
and significant impact on customer satisfaction. In H2, since the significance probability is
more than 0.05 and the absolute value of significance number is lower than 1.96, H2a, H2b,
and H2c are rejected and price has no positive and significant impact on satisfaction, trust, and
loyalty of customers. In H3, H3a and H3b are confirmed because significance probability is
lower than 0.05 and path coefficient is significant (alpha level of 0.05). In fact, promotion
activities have positive and significant impact on brand loyalty and brand satisfaction.
However, in H3c since the significance probability is greater than 0.05 and absolute value of
significance number is smaller than 1.96, this hypothesis is rejected; hence, promotion
activities have no positive and significant impact on brand trust. In H4a, since the significance

59 Marketing and Branding Research 2(2015)
probability is greater than 0.05 and absolute value of significance number is smaller than
1.96, this hypothesis is rejected as well. Therefore, product quality has no positive and
significant impact on brand loyalty. However, in H4b and H4c, since the significance
probability is equal to 0.000, it can be concluded that the path coefficient is significant (alpha
level of 0.05) and product quality has positive and significant impact on brand trust and brand
satisfaction. In hypothesis 5, since the significance probability is smaller than 0.05, the path
coefficient is significant (alpha level of 0.05) and the hypothesis is confirmed; hence,
customer satisfaction has positive and significant impact on brand loyalty in mobile phone
industry. In H6, since the significance probability is smaller than 0.05, the path coefficient is
significant (alpha level of 0.05) and the hypothesis is confirmed. Therefore, customer
satisfaction has positive and significant impact on brand trust. Finally, in H7, path coefficient
is equal to 0.280 and significance probability is smaller than 0.05. It can be concluded that
the path coefficient is significant (alpha level of 0.05) and customer’s brand trust has positive
and significant impact on brand loyalty. Therefore, the last hypothesis is confirmed as well.
Conclusion
In today’s competitive world, organizations need to use marketing techniques and marketing
expert researches to continue their existence. According to investigations, organizations’
failure is derived from their inability to use marketing techniques. However, the top-
performing companies in different industries attempt to keep their customers and build
customer loyalty; hence, companies and sellers must follow various management strategies to
improve customer loyalty. One of the important and leading factors in keeping customer and
increasing sale is marketing mix. Therefore, in this study, by considering the variables of
customer satisfaction and brand trust as mediating variables in mobile phone industry, the
impact of marketing mix elements on brand loyalty has been investigated. The model of the
research includes fifteen hypotheses. All the hypotheses were analyzed through structural
equation model and AMOS software, which eight of them were confirmed and the rest were
rejected.
According to the results of data analysis, price element (one of the marketing mix
elements) does not have significant impact on customer’s satisfaction, trust, and loyalty to a
particular brand in mobile phone industry. The results of path analysis indicated that
distribution channels do not have direct and significant impact on customer trust and loyalty
to brand in mobile phone industry but they indirectly impact on these variables through
Adel Pourdehgan 60
having impact on satisfaction variable. Therefore, more attention must be paid to this element
of marketing mix in mobile phone industry to attract customers. The results of studying the
third element of marketing mix indicated that promotion activities increase customer
satisfaction and loyalty but there is no significant relationship between promotion activities
and customer trust. In fact, promotion activities like extensive advertising and holding
competitions and draws may bring customer satisfaction, increase brand loyalty in mobile
phone industry, and achieve desirable results. Moreover, the results of studying the fourth
element of marketing mix indicated that product quality does not have direct impact on brand
loyalty but through impacting on customer satisfaction and brand trust, it increases brand
loyalty. In this research, the relationship between customer satisfaction and trust and brand
loyalty was investigated and the results of path analysis indicated the significance of
relationship between these variables, i.e. brand trust and customer’s satisfaction from the
brand of mobile phone have positive and significant impact on brand loyalty. Another result
of this study showed that there is a positive and significant relationship between the variables
of customer satisfaction and trust. The satisfaction variable have direct and indirect (through
trust variable) impact on brand loyalty in mobile phone industry.
According to the results, among the marketing mix elements, product and promotion
activities have the most positive and significant impact on brand loyalty. Promotion activities
have both direct and indirect impact while product quality has merely indirect impact through
satisfaction and trust variables which satisfaction plays the greater role. Findings of the
current study in mobile phone industry are consistent with those of some previous studies
including Allameh and Noktedan (2010), He et al. (2012), Lee and Back (2010), Buil et al.
(2013), Hung and Fu (2010), Kim and Hyun (2011), and Casaló et al. (2010).
In general, the reasons of choosing a brand repeatedly and the customers’ loyalty to a
brand of mobile phone are the customers’ satisfaction and trust in a brand and promotion
activities and product quality has a great impact on satisfaction and trust. Since promotion
activities are of great importance in brand loyalty, adopting strategies to implement
promotion activities that will improve the customers’ loyalty to a particular brand with the
aim of creating a mental image of potential and actual customers of the organization seems
essential. As a result, active companies in the market can focus on these factors and improve
them in the process of relationship between customers; so that these companies increase
customers’ loyalty to the organization and guarantee their life. Moreover, it is worth
mentioning that sellers and mobile phone manufacturer companies must pay special attention

61 Marketing and Branding Research 2(2015)
to promotion activities because this factor stimulates faster and more purchase in short-term
period and increases the customers and users’ awareness of enhanced products and brands.
Stores and managers of companies must pay special attention to brand trust and consider its
important role in the management of relationship between customers and design more
appropriate strategies and plans to inspire customer loyalty.
In general, it can be concluded that marketing mix is of great importance in determining
the position of company in target market and attracting customers. Therefore, every element
of marketing mix must be compatible with one another and with the various needs of target
markets of business. Managers must directly plan and do marketing activities like
distribution, promotion, and personal selling to stimulate purchase behavior. In the first stage,
managers must use the entire potential of distribution to inform customers and improve their
awareness of brand and market performance especially those brands which are unknown;
therefore, increasing distribution is essential. In the second stage, managers must use price
promotion to raise awareness of brand and stimulate customers. Particularly, price promotion
encourages brand switching and provides customers incentives to test those expensive brands.
It is recommended that active companies in this field must apply advertisements to inform
people of products because advertisements encourage buyers in target market to buy
particular brands. Moreover, the most important factor in selecting a product is the
customer’s recognition of that product. Distributors must learn about the product they
distribute; so that when necessary they can sell their product or defend it against similar
products relying on their knowledge. It is worth mentioning that the present study is not free
from limitations. Since this research has been merely conducted towards the mobile phone
industry in Bushehr, to generalize the model and research, it must be tested in other industries
like service industry; because customer loyalty varies according to the industry and culture of
the market.
References
Agustin, C., & Singh, J. (2005). Curvilinear effects of consumer loyalty determinants in relational exchanges. Journal of Marketing Research, 42(1), 96–108.
Allameh, S. M., & Noktedan, I. (2010). Analyzing the influence of service quality on customer loyalty: A case study in four and five star hotels. Business Management, 2(5), 109–124.
Ashley, C., & Leonard, H. A. (2009). Betrayed by the buzz? Covert content and consumer-brand relationships. Journal of Public Policy & Marketing, 28(2), 212–220.
Atafar, A., & Mansouri, H. (2011). Model of improving customer loyalty in electronic stores. New Marketing Research, 1(3), 145–164.

Adel Pourdehgan 62 Baldauf, A., Cravens, K. S., Diamantopoulos, A., & Zeugner-Roth, K. P. (2009). The impact of product-country image and
marketing efforts on retailer-perceived brand equity: An empirical analysis. Journal of Retailing, 85(4), 437–452.
Bayraktar, E., Tatoglu, E., Turkyilmaz, A., Delen, D., & Zaim, S. (2012). Measuring the efficiency of customer satisfaction and loyalty for mobile phone brands with DEA. Expert Systems with Applications, 39(1), 99–106.
Beristain, J. J., & Zorrilla, P. (2011). The relationship between store image and store brand equity: A conceptual framework and evidence from hypermarkets. Journal of Retailing and Consumer Services, 18(6), 562–574.
Biedenbach, G., Bengtsson, M., & Wincent, J. (2011). Brand equity in the professional service context: Analyzing the impact of employee role behavior and customer–employee rapport. Industrial Marketing Management, 40(7), 1093–1102.
Boo, S., Busser, J., & Baloglu, S. (2009). A model of customer-based brand equity and its application to multiple destinations. Tourism Management, 30(2) , 219–231.
Buil, I., Chernatony, L. D., & Martínez, E. (2013). Examining the role of advertising and sales promotions in brand equity creation. Journal of Business Research, 66(1), 115–122.
Camarero, C., Garrido, M. J., & Vicente, E. (2010). Components of art exhibition brand equity for internal and external visitors. Tourism Management, 31(4), 495–504.
Casaló, L. V., Flavián, C., & Guinalíu, M. (2010). Relationship quality, community promotion and brand loyalty in virtual communities: Evidence from free software communities. International Journal of Information Management, 30(4), 357–367.
Chandon, J. L., Leo, P. Y., & Philippe, J. (1997). Service encounter dimension- a dyadic perspective: Measuring the dimensions of service encounters as perceived by customers and personnel. International Journal of Service Industry Management, 8(1), 65–86.
Chattopadhyay, T., Dutta, R. N., & Sivani, S. (2010). Media mix elements affecting brand equity: A study of the Indian passenger car market. IIMB Management Review, 22(4), 173–185.
Chen, Y. M., Su, Y. F., & Lin, F. J. (2011). Country-of-origin effects and antecedents of industrial brand equity. Journal of Business Research, 64(11), 1234–1238.
Chiou, J. S., & Shen, C. C. (2006). The Effects of satisfaction, opportunism, and asset specificity on consumers' loyalty intention toward internet portal sites. International Journal of Service Industry Management, 17(1), 7–22.
Clottey, T. A., Collier, D. A., & Stodnick, M. (2008). Drivers of customer loyalty in a retail store environment. Journal of Service Science,1(1), 35–48.
Cretu, A. E., & Brodie, R. J. (2007). The influence of brand image and company reputation where manufacturers market to small firms: A customer value perspective. Industrial Marketing Management, 36(2), 230–240.
Doaei, H., Kazemi, M., & Hosseini Robat, S. M. (2011). Analyzing the influence of customers’ perception of marketing mix on brand equity: The case of Razavi nutritive products. New Marketing Research Journal, 1(2), 93–104.
Eckert, C., Louviere, J., & Islam, T. (2012). Seeing the forest despite the trees: Brand effects on choice uncertainty. International Journal of Research in Marketing, 29(3), 256–264.
Fakhimi Azar, S., Akbari Vanehabad, M., & Rasouli, R. (2011). Investigating the impact of marketing mix (4P) on increasing the sale of water heaters of Ghaynarkhazar Company. Journal of Beyond Management, 4(16), 79–106.
Gharecheh, M., & Dabooeian, M. (2011). Interaction of employee loyalty and customer loyalty in the service industry. New Marketing Research Journal, 1(3), 27–46.
Gilani Nia, S., & Mousavian, J. (2010). The effects of brand loyalty on bank’s brand equity from the perspective of electronic card holders. Journal of Industrial Management Faculty of Humanities, 5(14), 103–119.
Garavand, A., Nourayi, M., & Saee Arasi, I. (2010). The effect of marketing mix on purchasing decision and customer satisfaction from producing cooperative companies of Kuhdasht country. Science and Research Quarterly Journal of Cooperation and Agriculture, 21(3), 69–87.
Gurviez, P., & Korchia, M. (2002). Proposition d’une e´chelle de mesure multidimensionnelle de la confiance dans la marque. Recherche et Applications en Marketing, 17(3), 41–62.
Hamidizadeh, M., Haj Karimi, A., Babaie Zakliki, M., & Tabatabai Nasab, S. M. (2009). Designing and explaining the process model of customer loyalty: A case study of private banks. Journal of Business Administration Researches, 1(2), 133–170.
He, H., Li, Y., & Harris, L. (2012). Social identity perspective on brand loyalty. Journal of Business Research, 65(5), 648–657.
Heidarzadeh, K., & Zarbi, S. (2008). The effect of selected marketing mix elements on brand equity. Marketing Management, 3(5), 21–58.
63 Marketing and Branding Research 2(2015)
Hosseini, M. H., & Rezaie, M. (2011). An investigation on effective factors in brand loyalty of dairy products market.
Journal of Business Management Perspective, 5(38), 57–79.
Huang, R., & Sarigöllü, E. (2012). How brand awareness relates to market outcome, brand equity, and the marketing mix. Journal of Business Research, 65(1), 92–99.
Hung, Y. L., & Fu, C. S, (2010). Brand management model of vocational high schools in Taiwan. Procedia Social & Behavioral Sciences, 2(2), 4229–4233.
Karbasi Var, A., Taheri Kia, F., & Band Pei, A. (2011). Investigating the relationship between selected marketing mix and brand equity factors through Acker method in order to increase market share in appliances industry: The case of Snowa Cmpany. Quarterly Journal of Management, 8(24), 29–43.
Khazaei Pool, J., & Baloee Jamkhaneh, H. (2011). Study dimensions of marketing mix 4Ps and 5S management techniques in textile industry. Paper presented at the Third National Conference on Textile and Clothing Engineering, Yazd, Iran.
Khodadad Hosseini, S., & Rezvani, M. (2009). Fuzzy marketing mix modeling: A case study of automobile battery industry. Quarterly Iranian Journal of Trade Studies, 13(51), 241–277.
Kim, J. H., & Hyun, Y. J. (2011). A model to investigate the influence of marketing-mix efforts and corporate image on brand equity in the IT software sector. Industrial Marketing Management, 40(3), 424–438.
Lee, J. S., & Back, K. J. (2010). Reexamination of attendee-based brand equity. Tourism Management, 31(3), 395–401.
Low, J., & Bloisb, K. (2002). The evolution of generic brands in industrial markets: The challenges to owners of brand equity. Industrial Marketing Management, 31(5), 385–392.
Nam, J., Ekinci, Y., & Whyatt, G. (2011). Brand equity, brand loyalty and consumer satisfaction. Annals of Tourism Research, 38(3), 1009–1030.
Osman, H., Hemmington, N., & Bowie, D. (2009). A transactional approach to customer loyalty in the hotel industry. International Journal of Contemporary Hospitality Management, 21(3), 239–250.
Rousta, A., Davar, V., & Ebrahimi, A. (2004). Marketing management. Tehran, Iran: SAMT Publications.
Ryu, K., Han, H., & Kim. T. H. (2008). The relationships among overall quick-casual restaurant image, perceived value, customer satisfaction, and behavioral intentions. International Journal of Hospitality Management, 27(3), 459–469.
Sahin, A., Zehir, C., & Kitapç, H. (2011). The Effects of brand experiences, trust and satisfaction on building brand loyalty: An empirical research on global brands. Procedia Social & Behavioral Sciences, 24, 1288–1301.
Sheau-Fen, Y., Sun-May, L., & Yu-Ghee, W. (2012). Store brand proneness: Effects of perceived risks, quality and familiarity. Australasian Marketing Journal, 20(1), 48–58.
Suresh, Sh., Mohanan, P., & Naresh, G. (2012). Brand success redefined: An analysis of the interrelationships among various brand dimensions. Psychology Research, 2(1), 32–39.
Sheng , M. L., & Teo, T. S. H. (2012). Product attributes and brand equity in the mobile domain: The mediating role of customer experience. International Journal of Information Management, 32(2), 139–146.
Shi , W., Chen , J., & Ma , J. (2011). A study of customer loyalty based on switching cost and brand attachment. The Journal of China Universities of Posts & Telecommunications, 18, 136–141.
Tasci, A. D. A., & Guillet, B. D. (2011). It affects, it affects not: A quasi-experiment on the transfer effect of co-branding on consumer-based brand equity of hospitality products. International Journal of Hospitality Management, 30(4), 774–782.
Torres, A., & Tribó, J. A. (2011). Customer satisfaction and brand equity. Journal of Business Research, 64(10), 1089–1096.
Valette-Florence, P., Guizani, H., & Merunka, D. (2011). The impact of brand personality and sales promotions on brand equity. Journal of Business Research, 64(1), 24–28.
Vazir Zanjani, H., Motameni, A., & Mousavi Delaziani, H. (2010). Measuring customer satisfaction from marketing mix elements of after sales services in heavy vehicles industry (road-transport). Commercial Surveys, 40, 70–85.
Wang, Y. L., & Tzeng, G. H. (2012). Brand marketing for creating brand value based on a MCDM model combining DEMATEL with ANP and VIKOR methods. Expert Systems with Applications, 39(5), 5600–5615.
Yoo, B. (2008). Cross-national invariance of the effect of personal collectivistic orientation on brand loyalty and equity: The United States versus South Korean consumers. Asia Pacific Journal of Marketing & Logistics, 21(1), 41–57.
Zehir, C., Sahin, A., Kitapç, H., & Özsahin, M. (2011). The Effects of brand communication and service quality in building brand loyalty through brand trust; The empirical research on global brands. Procedia Social & Behavioral Sciences, 24, 1218–1231.