the impact of no child left behind on students, … impact of no child left behind on students,...
TRANSCRIPT

149
THOMAS S. DEEUniversity of Virginia
BRIAN A. JACOBUniversity of Michigan
The Impact of No Child Left Behind on Students, Teachers, and Schools
ABSTRACT The controversial No Child Left Behind Act (NCLB) broughttest-based school accountability to scale across the United States. This studydraws together results from multiple data sources to identify how the newaccountability systems developed in response to NCLB have influenced stu-dent achievement, school-district finances, and measures of school and teacherpractices. Our results indicate that NCLB brought about targeted gains in themathematics achievement of younger students, particularly those from dis-advantaged backgrounds. However, we find no evidence that NCLB improvedstudent achievement in reading. School-district expenditure increased signifi-cantly in response to NCLB, and these increases were not matched by federalrevenue. Our results suggest that NCLB led to increases in teacher compensa-tion and the share of teachers with graduate degrees. We find evidence thatNCLB shifted the allocation of instructional time toward math and reading, thesubjects targeted by the new accountability systems.
The No Child Left Behind (NCLB) Act of 2001 is arguably the most far-reaching education policy initiative in the United States over the last
four decades. The hallmark features of this legislation compelled states toconduct annual student assessments linked to state standards, to identifyschools that are failing to make “adequate yearly progress” (AYP), and toinstitute sanctions and rewards based on each school’s AYP status. A fun-damental motivation for this reform is the notion that publicizing detailedinformation on school-specific test performance and linking that perfor-mance to the possibility of meaningful sanctions can improve the focusand productivity of public schools.
12367-03a_Dee_rev.qxd 2/17/11 10:06 AM Page 149
NCLB has been extremely controversial from its inception. Criticscharge that NCLB has led educators to shift resources away from impor-tant but nontested subjects, such as social studies, art, and music, and tofocus instruction within mathematics and reading on the relatively narrowset of topics that are most heavily represented on the high-stakes tests(Rothstein, Jacobsen, and Wilder 2008, Koretz 2008). In the extreme,some suggest that high-stakes testing may lead school personnel to inten-tionally manipulate student test scores (Jacob and Levitt 2003). Althoughthere have been hundreds of studies of test-based accountability policiesin the United States over the past two decades, the evidence on NCLB ismore limited, both because it is a newer policy and because the nationalscope of the policy makes it extremely difficult to find an adequate controlgroup by which to assess the national policy.
This paper examines the impact NCLB has had on students, teachers,and schools across the country. We investigate not only how NCLB hasinfluenced student achievement, but also how it has affected educationspending, instructional practice, and school organization. Given the com-plexity of the policy and the nature of its implementation, we are skepticalthat any single analysis can be definitive. For this reason we present abroad collage of evidence and look for consistent patterns.
Several findings emerge. First, the weight of the evidence suggests thatNCLB has had a positive effect on elementary student performance inmathematics, particularly at the lower grades. The benefits appear to beconcentrated among traditionally disadvantaged populations, with particu-larly large effects among Hispanic students. We do not find evidence thatthe policy has adversely affected achievement at either the top or the bot-tom end of the test-score distribution. Instead, the policy-induced gains inmath performance appear similar across the test-score distribution. How-ever, the available evidence suggests that NCLB did not have a compara-ble effect on reading performance.
A closer look at the potential mechanisms behind the observed improve-ment provides some additional insight. For example, we find evidence thatNCLB increased average school district expenditure by nearly $600 perpupil. This increased expenditure was allocated both to direct studentinstruction and to educational support services. We also find that thisincreased expenditure was not matched by corresponding increases infederal support. The test-score gains associated with these expenditureincreases fall short of the ambitious goals enshrined in NCLB. However,we present some qualified evidence suggesting that the size of the gainsreflects a reasonable return on investment.
150 Brookings Papers on Economic Activity, Fall 2010
12367-03a_Dee_rev.qxd 2/17/11 10:06 AM Page 150

We also discuss evidence on how NCLB may have influenced alterna-tive measures of educational practice and student outcomes. This evi-dence suggests that NCLB led to an increase in the share of teachers withmaster’s degrees. We also find evidence that teachers responded to NCLBby reallocating instructional time from social studies and science towardkey tested subjects, particularly reading. We also present evidence thatNCLB led to distinct improvements in a teacher-reported index of studentbehaviors (which covers, among other things, attendance, timeliness, andintellectual interest) commonly understood as measuring “behavioralengagement” with school.
The paper proceeds as follows. Section I outlines the theoretical under-pinnings of school accountability and provides background on the NCLBlegislation. Section II examines the impact of NCLB on student achieve-ment, marshaling evidence from a variety of different sources. Section IIIinvestigates potential mediating mechanisms, discussing how the policyaffected educational expenditure, classroom instruction, and school orga-nization, among other things. Section IV concludes with recommendationsfor future policy and research.
I. Background on School Accountability and NCLB
NCLB represented a bold new foray into education policy on the part ofthe federal government. However, the provisions it embodied built on along history of reforms in standards and accountability at the state andlocal levels over several decades.
I.A. Theoretical Underpinnings of School Accountability
A basic perception that has motivated the widespread adoption ofschool accountability policies like NCLB is that the system of public ele-mentary and secondary schooling in the United States is “fragmented andincoherent” (Ladd 2007, p. 2). In particular, proponents of school account-ability reforms argue that too many schools, particularly those serving themost at-risk students, have been insufficiently focused on their core perfor-mance objectives, and that this organizational slack reflected weak incen-tives and a lack of accountability among teachers and school administrators.For example, Eric Hanushek and Margaret Raymond (2001, pp. 368–69)write that accountability policies are “premised on an assumption that afocus on student outcomes will lead to behavioral changes by students,teachers, and schools to align with the performance goals of the system”
THOMAS S. DEE and BRIAN A. JACOB 151
12367-03a_Dee_rev.qxd 2/17/11 10:06 AM Page 151

and that “explicit incentives . . . will lead to innovation, efficiency, andfixes to any observed performance problems.”
The theoretical framework implicitly suggested by this characteriza-tion of public schools is a principal-agent model: the interests of teachersand school administrators, the agents in this framework, are viewed asimperfectly aligned with those of parents and voters. Furthermore, parentsand voters cannot easily monitor or evaluate the input decisions made bythese agents. The performance-based sanctions and rewards that charac-terize accountability policies are effectively output-based incentives thatcan be understood as a potential policy response to this agency problem.Similarly, some of the provisions in NCLB with regard to teacher qualifi-cations can be construed as an agent selection approach to a principal-agent problem.
The principal-agent lens is also useful for understanding criticisms ofaccountability-based reforms. The assumption that the self-interest ofteachers and administrators is misaligned implies that they may respond toaccountability policies in unintentionally narrow or even counterproduc-tive ways. For example, in the presence of a high-stakes performancethreshold, schools may reallocate instructional effort away from high- andlow-performing students and toward the “bubble kids”—those most likely,with additional attention, to meet the proficiency standard (see, for exam-ple, Neal and Schanzenbach 2010). Similarly, concerns about “teaching tothe test” reflect the view that schools will refocus their instructional efforton the potentially narrow cognitive skills targeted by their high-stakesstate assessment, at the expense of broader and more genuine improve-ments in cognitive achievement. Schools may also reallocate instructionaleffort away from academic subjects that are not tested, or even attempt toshape the test-taking population in advantageous ways.
I.B. Research on Accountability Reforms Adopted by States before NCLB
School accountability reforms similar to those brought about by NCLBwere adopted in a number of states during the 1990s. Several studies haveevaluated the achievement consequences of these reforms. Because of thesimilarities between NCLB and aspects of these pre-NCLB accountabilitysystems, this body of research provides a useful backdrop against which toconsider the potential achievement impacts of NCLB. In a recent review ofthis diverse evaluation literature, David Figlio and Helen Ladd (2007) suggestthat three studies (Carnoy and Loeb 2002, Jacob 2005, and Hanushek andRaymond 2005) are the “most methodologically sound” (Ladd 2007, p. 9).
152 Brookings Papers on Economic Activity, Fall 2010
12367-03a_Dee_rev.qxd 2/17/11 10:06 AM Page 152

A study by Martin Carnoy and Susanna Loeb (2002), based on state-level achievement data from the National Assessment of EducationalProgress (NAEP), found that the within-state improvement in math perfor-mance between 1996 and 2000 was larger in states with higher values onan accountability index, particularly for black and Hispanic students ineighth grade.1 Similarly, Jacob (2005) found that, following the introduc-tion of an accountability policy, math and reading achievement increasedin the Chicago public schools, relative both to prior trends and to con-temporaneous changes in other large urban districts in the region. How-ever, Jacob (2005) also found that younger students did not experiencesimilar gains on a state-administered, low-stakes exam and that teachersresponded strategically to accountability pressures (for example, increas-ing special education placements).
Hanushek and Raymond (2005) evaluated the impact of school account-ability policies on state-level NAEP math and reading achievement, asmeasured by the difference between the performance of a state’s eighth-graders and that of fourth-graders in the same state 4 years earlier. Thisgain-score approach applied to the NAEP data implied that there were twocohorts of state-level observations in both math (1992–96 and 1996–2000)and reading (1994–98 and 1998–2002). Hanushek and Raymond (2005)classified state accountability policies as implementing either “report-cardaccountability” or “consequential accountability.” States with report-cardaccountability provided a public report of school-level test performance,whereas states with consequential accountability both publicized school-level performance and could attach consequences to that performance.The types of potential consequences were diverse. However, virtually allof the systems in consequential accountability states included key ele-ments of the school accountability provisions later enacted in NCLB (forexample, identifying failing schools, replacing principals, allowing stu-dents to enroll elsewhere, and taking over, closing, or reconstitutingschools). Hanushek and Raymond (2005, p. 307) note that “all states arenow effectively consequential accountability states (at least as soon as theyphase in NCLB).”
Hanushek and Raymond (2005) find that the introduction of consequen-tial accountability within a state was associated with statistically significant
THOMAS S. DEE and BRIAN A. JACOB 153
1. The accountability index constructed by Carnoy and Loeb (2002) ranged from 0 to 5and combined information on whether a state required student testing and performancereporting to the state, whether the state imposed sanctions or rewards, and whether the staterequired students to pass an exit exam to graduate from high school.
12367-03a_Dee_rev.qxd 2/17/11 10:06 AM Page 153

increases in the gain-score measures. The achievement gains implied byconsequential accountability were particularly large for Hispanic stu-dents and, to a lesser extent, white students. However, the estimatedeffects for the gain scores of black students were statistically insignificant,as were the estimated effects of report-card accountability. The authorsargue that these achievement results provide support for the controversialschool accountability provisions in NCLB, because those provisions are sosimilar to the consequential accountability policies that had been adoptedin some states.
I.C. Key Features of the NCLB Legislation
The NCLB legislation was actually a reauthorization of the historic Ele-mentary and Secondary Education Act (ESEA), the central federal legisla-tion relevant to K-12 schooling. The ESEA, first enacted in 1965 alongwith other Great Society initiatives and previously reauthorized in 1994,introduced Title I, the federal government’s signature program for target-ing financial assistance to schools and school districts serving high con-centrations of economically disadvantaged students. NCLB dramaticallyexpanded the scope and scale of this federal legislation by requiring thatstates introduce school accountability systems that applied to all publicschools and their students in the state. In particular, NCLB requires annualtesting of public-school students in reading and mathematics in grades 3through 8 (and at least once in grades 10 through 12), and that states rateeach school, both as a whole and for key subgroups of students, withregard to whether they are making “adequate yearly progress” toward theirstate’s proficiency goals.
NCLB also requires that states introduce “sanctions and rewards” rel-evant to every school and based on their AYP status. It mandates explicitand increasingly severe sanctions (from implementing public-schoolchoice to staff replacement to school restructuring) for persistently low-performing schools that receive Title I aid. According to data from theSchools and Staffing Survey of the National Center for Education Statis-tics, 54.4 percent of public schools participated in Title I services duringthe 2003–04 school year. Some states applied these explicit sanctions toschools not receiving Title I assistance as well. For example, 24 statesintroduced accountability systems that threatened all low-performingschools with reconstitution, regardless of whether they received Title Iassistance.2
154 Brookings Papers on Economic Activity, Fall 2010
2. Lynn Olson, “Taking Root,” Education Week, December 8, 2004.
12367-03a_Dee_rev.qxd 2/17/11 10:06 AM Page 154

II. The Impact of NCLB on Student Achievement
The overarching goal of NCLB has been to drive broad and substantiveimprovements in student achievement. This section discusses the availableempirical evidence on the achievement effects of NCLB, drawing on avariety of research designs and data sources including national time trends,comparisons between private and public schools, and comparisons acrossschools and states.
II.A. National Time Trends in Student Achievement
Because NCLB was introduced simultaneously throughout the UnitedStates, many observers have turned to state and national time-series trendsin student achievement to assess its impact. For example, several studieshave noted that student achievement, particularly as measured by stateassessment systems, appears to have improved both overall and for keysubgroups since the implementation of NCLB (Center on Education Policy2008b). Others, however, argue that changes in student performance onhigh-stakes state tests can be highly misleading when states strategicallyadjust their assessment systems and teachers narrow their instructionalfocus to state-tested content (Fuller and others 2007).
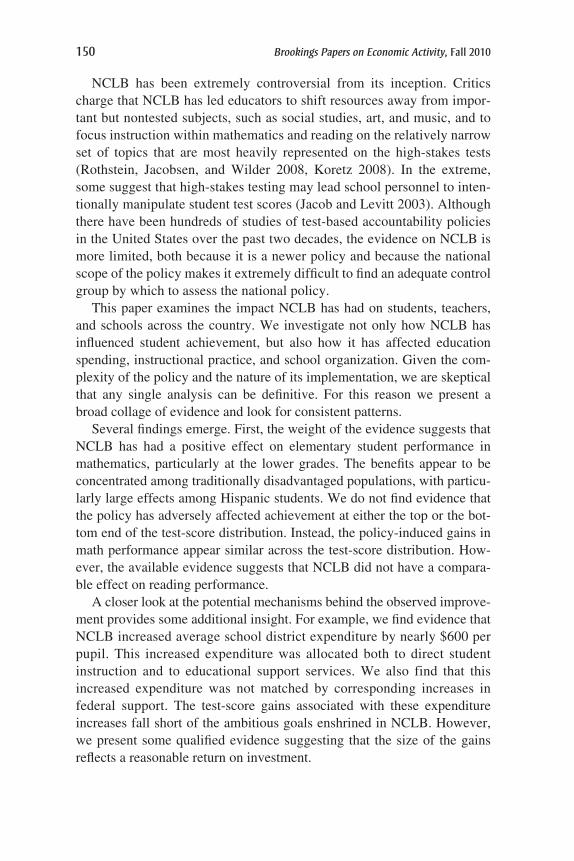
Figure 1 presents data on national trends in student achievement from1992 to 2007. These data are from the main NAEP and provide separatetrends by grade (fourth and eighth), by subject (math and reading), and byrace and ethnicity (white, black, and Hispanic).3 These trends suggest thatNCLB may have increased the math performance of fourth-graders. Thatis, these NAEP data suggest that fourth-grade math achievement hasshifted noticeably higher during the NCLB era and may have also beguntrending upward more aggressively. The trend data suggest similar gains inthe math performance of black eighth-graders. However, the trends pro-vide no clear suggestion that the onset of NCLB improved performance in
THOMAS S. DEE and BRIAN A. JACOB 155
3. There are several different versions of the NAEP. The original NAEP, first admin-istered in the early 1970s, is now called the Long-Term Trend (LTT) NAEP, because theDepartment of Education has made an effort to keep the content of this examination as con-sistent as possible over time in order to accurately gauge national trends. The LTT NAEP isadministered to a small random sample of 9-, 13-, and 17-year-olds across the country andgenerally focuses on what many educators now think of as “basic” skills. What is nowcalled the main NAEP was initiated in the early 1990s in an effort both to update the con-tent and format of the national assessment so as test a broader domain of knowledge andskills, and to allow individual states to obtain their own, state-representative estimates.This exam is administered to fourth and eighth graders (and more recently to twelfth-graders).
12367-03a_Dee_rev.qxd 2/17/11 10:06 AM Page 155
156 Brookings Papers on Economic Activity, Fall 2010
the other three grade-subject combinations. Figure 2 shows achievementgrowth for 9- and 13-year-olds in math and reading, using data from the Long-Term Trend (LTT) NAEP, which has tracked student perfor-mance from the early 1970s. These data similarly suggest that the effectsof NCLB on student achievement have been at best limited to certaingroups.
II.B. Evidence from International Comparisons
Although these national achievement trends are suggestive, they do notnecessarily provide the basis for reliable inferences about the impact ofNCLB. Simple time-series comparisons may be biased by the achievementconsequences of other time-varying determinants, such as the recession
Source: National Center for Education Statistics. a. Data are for all public schools.
Scaled score Scaled scoreMathematics
Fourth-graders
Eighth-graders
Reading
Scaled score Scaled scoreMathematics Reading
200190
220
240
210
230
250
1994 1998 2002 2006
Black
Hispanic
White
NCLB enacted
240
270
260
250
290
280
1994 1998 2002 2006
190
200
210
220
1994 1998 2002 2006
240
250
260
270
1994 1998 2002 2006
Figure 1. Mean Scaled Scores on the Main NAEP, by Ethnicity, 1992–2007a
12367-03a_Dee_rev.qxd 2/17/11 10:06 AM Page 156

that just preceded the introduction of NCLB. One straightforward way tobenchmark the achievement trends observed in the United States is tocompare them with the contemporaneous trends in other countries.
Because the time-series evidence in figure 1 suggests that any posi-tive achievement effects from NCLB were likely to have been concen-trated in fourth-grade math achievement, the comparative internationalachievement data from the Trends in International Mathematics and Sci-ence Study (TIMSS) are particularly relevant. The TIMSS collectedtrend data on fourth-grade math achievement for participating countriesin 1995, 2003, and 2007. The top panel in figure 3 presents the fourth-grade scale scores in math from the TIMSS for the United States, for the12 other countries that collected these performance data in each of these
THOMAS S. DEE and BRIAN A. JACOB 157
Source: National Center for Education Statistics. a. Data are for all public schools.
Scaled score Scaled scoreMathematics
9-year-olds
13-year-olds
Reading
Scaled score Scaled scoreMathematics Reading
200
220
240
200
190
220
210
1982 1986 1990 1994 1998 2002 1982 1986 1990 1994 1998 2002
1982 1986 1990 1994 1998 2002 1982 1986 1990 1994 1998 2002
Black
Hispanic
White
NCLB enacted
240230
270260250
280290
240
250
260
270
Figure 2. Mean Scaled Scores on the Long-Term Trend NAEP, by Ethnicity, 1978–2004a
12367-03a_Dee_rev.qxd 2/17/11 10:06 AM Page 157

three study years, and for the subset of these comparison countries thatare members of the Organization for Economic Cooperation and Devel-opment (OECD).
These trend data indicate that average math achievement on the TIMSSfell for all sets of countries by roughly equal amounts between the onlyavailable pre-NCLB year (1995) and the first academic year in which
158 Brookings Papers on Economic Activity, Fall 2010
Source: National Center for Education Statistics. a. The TIMSS (Trends in International Mathematics and Science Study) is an international assessment
of the mathematics and science knowledge of fourth- and eighth-grade students, administered every 4 years since 1995. The PIRLS (Progress in International Reading Literacy Study) is an international assessment of the literacy achievement of fourth-grade students, administered every 5 years since 2001. Both studies are conducted by the International Association for the Evaluation of Educational Achieve-ment.
b. Australia, England, Hungary, Japan, Netherlands, New Zealand, Norway, and Scotland.c. Countries in note b plus Iran, Latvia, Singapore, and Slovenia.d. England, France, Germany, Hungary, Italy, Kuwait, Netherlands, New Zealand, Norway, Scotland,
Slovak Republic, and Sweden. e. Countries in note d plus Bulgaria, Hong Kong, Iran, Israel, Latvia, Lithuania, Macedonia, Moldova,
Morocco, Romania, Russia, Singapore, and Slovenia.
Scaled scoreReading (PIRLS)
510
520
540
530
2002 2003 2004 2005
All non-U.S.c
Other OECDb
United States
NCLB enacted
Mathematics (TIMSS)Scaled score
1994 1996 1998 2000 2002 2004 2006 2008
All non-U.S.e
Other OECDd
United States
NCLB enacted
510
530
520
540
Figure 3. Mean Scaled Scores of Fourth-Graders on the TIMSS and the PIRLS in theUnited States and Other Countriesa
12367-03a_Dee_rev.qxd 2/17/11 10:06 AM Page 158

NCLB was implemented (2002–03). Without additional years of data, wecannot assess the extent to which these comparative changes deviate frompre-NCLB trends. However, the available TIMSS data indicate that, by2007, math achievement had comparatively improved in the United States,particularly with respect to the other OECD countries (an improvement of11 scale points versus 4). These cross-country trends provide suggestiveevidence consistent with the hypothesis that NCLB led to improvements inthe math performance of younger students in the United States. However,the comparative test-score gain for the United States is relatively modest,amounting to only a 1.35 percent increase in average performance overpre-NCLB scores, and an 8 percent increase relative to the standard devia-tion in test scores.
Moreover, like the national time-series evidence, international com-parisons provide no indication that NCLB improved the reading achieve-ment of young students. The Progress in International Reading LiteracyStudy (PIRLS) reports data on the reading achievement of fourth-gradersacross a number of countries both in 2001 and in 2006. The bottompanel of figure 3 presents overall reading scores from the PIRLS by yearfor the United States, the group of 26 other countries that participated inboth surveys, and the OECD members of this comparison group. Onaverage, the United States outperformed these comparison countries.However, over the period that NCLB was implemented, all three sets ofcountries experienced quite similar and modest changes in PIRLS read-ing achievement.
Overall, then, the international evidence is at best suggestive. Contem-poraneous changes within other countries may make them a poor compar-ison group for evaluating NCLB. The lack of multiple years of data alsomakes it difficult to distinguish possible policy effects from other trendsor to identify any comparative differences with statistical precision. Asubtler shortcoming of national and international time-series comparisonsis that the presumption of a common, national effect ignores the possibil-ity of heterogeneous effects of NCLB across particular types of states andschools.
II.C. Evidence from Accountability Risk Studies
However, several recent econometric studies have creatively leveragedthis heterogeneity to identify the effects of NCLB. In particular, a widelyused approach involves structuring comparisons across schools or studentsthat face different risks of sanctions under NCLB. Derek Neal and DianeSchanzenbach (2010) present evidence that following the introduction of
THOMAS S. DEE and BRIAN A. JACOB 159
12367-03a_Dee_rev.qxd 2/17/11 10:06 AM Page 159

NCLB in Illinois, the performance of Chicago public-school students nearthe proficiency threshold (that is, those in the middle of the distribution)improved while the performance of those at the bottom of the distribu-tion remained the same or fell. Using data from the state of Washington,John Krieg (2008) finds that the performance of students in both tails ofthe distribution is lower when their school faces the possibility of NCLBsanctions.
Dale Ballou and Matthew Springer (2008), using data from a low-stakes exam fielded in seven states over a 4-year period, identify theachievement consequences of NCLB by constructing comparisons acrossgrade-year cells that were included in AYP calculations and those thatwere not. Their approach takes advantage of the fact that between 2002–03and 2005–06, states differed with respect to whether particular gradesmattered for a school’s accountability rating. Hence, their identificationstrategy leverages the fact that if the math scores of fourth-graderscounted toward a school’s accountability rating in one year but the mathscores of fifth-graders in the same school did not count until the followingyear, one would expect student achievement to rise more quickly amongfourth-graders relative to fifth-graders in the current year. Ballou andSpringer find that the presence of AYP accountability modestly increasedthe math achievement of elementary-school students, particularly lower-performing students.
A recent study by Randall Reback, Jonah Rockoff, and HeatherSchwartz (2010) adopts a similar approach, comparing student performanceacross elementary schools on the margin of making AYP. Using nationallyrepresentative data from the Early Childhood Longitudinal Study (ECLS),they find that reading and science scores on low-stakes tests improve by asmuch as 0.07 standard deviation when a school is on the margin for mak-ing AYP, but that the effects on math scores are smaller and statisticallyinsignificant.
These accountability risk studies provide credible evidence on howNCLB-induced pressure influences the level and the distribution of studentachievement. However, they have at least three potential limitations withrespect to understanding the broad achievement consequences of NCLB.First, most of these studies have limited external validity because they donot rely on national data. Second, some rely on high-stakes assessments,which may not accurately reflect true student ability in the presence ofstrategic responses to NCLB (such as teaching to the test). Third, andperhaps most important, the treatment contrast in these studies may notapproximate the full impact of NCLB because they rely on comparisons
160 Brookings Papers on Economic Activity, Fall 2010
12367-03a_Dee_rev.qxd 2/17/11 10:06 AM Page 160

across schools or students, all of whom were observed in the post-NCLBpolicy regime. To the extent that NCLB had broad effects on publicschools (that is, even on students and schools not under the direct threat ofsanctions), these comparisons could understate the effects of interest.
II.D. Evidence from a Comparison of States over Time
To address some of the limitations described above and estimate whatone might consider the “full” impact of NCLB, we utilize a strategy thatcompares changes in student performance within states over time (see Deeand Jacob forthcoming). We take advantage of the fact that NCLB wasexplicitly modeled on an earlier generation of state-level school account-ability systems. In the decade before NCLB, about 30 states implementedconsequential school accountability policies that were fundamentally sim-ilar to NCLB in that they mandated systematic testing of students in read-ing and math, public reporting of school performance on these exams,and the possibility of meaningful sanctions (including school takeover,closure, or reconstitution, replacing the principal, and allowing students tochange schools) based on test-based school performance. In fact, somestate officials argued that NCLB needlessly duplicates preexisting stateaccountability systems.4
The existence of these earlier NCLB-like accountability systems estab-lishes natural treatment and control state groups. In our framework, statesthat adopted NCLB-like accountability before NCLB form our controlgroup. Other states, for which NCLB catalyzed an entirely new experi-ence with consequential school accountability, form our treatment group.5
Of course, states that adopted accountability programs before NCLB werenot randomly distributed. For this reason our “comparative interruptedtime series” (CITS) strategy, described in more detail below, relies onwithin-state variation over time, allowing not only for different levels of
THOMAS S. DEE and BRIAN A. JACOB 161
4. Michael Dobbs, “Conn. Stands in Defiance of Enforcing ‘No Child.’ ” WashingtonPost, May 8, 2005.
5. We relied on a number of different sources to categorize pre-NCLB accountabilitypolicies across states, including prior studies of such policies (for example, Carnoy andLoeb 2002, Lee and Wong 2004, and Hanushek and Raymond 2005) as well as primarysources such as the Quality Counts series put out by Education Week (“Quality Counts ’99,”January 11, 1999, www.edcounts.org/archive/sreports/qc99/), the state-specific “Account-ability and Assessment Profiles” assembled by the Consortium for Policy Research in Edu-cation (Goertz, Duffy, and Le Floch 2001), annual surveys on state student assessmentprograms fielded by the Council of Chief State School Officers, information from state edu-cation department websites, Lexis-Nexis searches of state and local newspapers, and con-versations with academics and state officials in several states.
12367-03a_Dee_rev.qxd 2/17/11 10:06 AM Page 161

achievement across states before NCLB but also for different trends inachievement across states before NCLB.
GRAPHICAL EVIDENCE. We illustrate the logic of our identification strat-egy through a series of figures. This graphical evidence has the advantagesof transparency and simplicity. We then present regression estimates thatmore clearly show the magnitude and statistical precision of our findingsand allow us to demonstrate that the results are robust to a variety of alter-native specifications and several falsification exercises.
Figure 4 shows the trends in NAEP scores for two groups: states thathad adopted school accountability by 1998 (control states), and states that
162 Brookings Papers on Economic Activity, Fall 2010
Source: National Center for Education Statistics and authors’ calculations.a. Data are for public schools only. Treatment states are those that did not adopt consequential school
accountability policies before NCLB, and control states those that had adopted such policies before1998. A small number of states that adopted accountability programs between 1999 and 2001 areexcluded.
Scaled score Scaled scoreMathematics
Fourth-graders
Eighth-graders
Reading
Scaled score Scaled scoreMathematics Reading
220
230
225
235
1994 1998 2002 2006
Control states
Treatment states
NCLBenacted
265
270
280
275
1994 1998 2002 2006
214
216
218
1994 1998 2002 2006
259
260
261
262
1994 1998 2002 2006
Figure 4. Mean Scaled Scores on the Main NAEP, by Timing of Increased SchoolAccountability, 1992–2007a
12367-03a_Dee_rev.qxd 2/17/11 10:27 AM Page 162

had not adopted school accountability before NCLB (treatment states).6
The NAEP data are particularly well suited to this evaluation for severalreasons. First, the NAEP is a technically well-developed assessment thatcovers a broad domain of knowledge and schools. Second, it providesconsistent, state-representative measures of student performance for moststates over the last two decades. Finally, the exam is a low-stakes exam forstudents, teachers, and schools.7 Because teachers have no incentive to“teach to” the NAEP, it is likely to provide the most accurate measure ofstudent achievement (Fuller and others 2007).
The figure plots the simple (unweighted) average scale score of eachgroup of states in all years in which the exam was administered. Years areidentified by the spring of the relevant academic year (for example, “1992”refers to the 1991–92 school year). The sample of states is consistentacross years (that is, it is a balanced panel), and the state classification is atime-invariant characteristic. Data points to the left of the vertical line thatindicates the enactment of NCLB are considered “pre-policy,” and those tothe right “post-policy.”8 To illustrate the pre- and post-NCLB achievementtrends within each group, we also plot the fitted regression line from a sim-ple linear regression conducted separately for each group × period (pre- orpost-NCLB).
THOMAS S. DEE and BRIAN A. JACOB 163
6. These figures exclude a small number of states that adopted state accountability pro-grams between 1999 and 2001, in order to make a clear distinction between our treatmentand comparison groups. However, the regression analysis described in the following sec-tion includes these “late adopter” states. Dee and Jacob (forthcoming) show that the inclu-sion of these late adopters does not change the findings in any substantive way.
7. That is, the NAEP is not used as the basis for student promotion or retention, teacherevaluation, or school accountability. Indeed, the NAEP is administered only to a small, ran-dom sample of fourth-, eighth-, and twelfth-grade students in each state.
8. When one dates the start of NCLB is a potentially important issue. NCLB securedfinal congressional approval on December 18, 2001, and was signed by President GeorgeW. Bush on January 8, 2002, both events thus occurring in the middle of the 2001–02 aca-demic year. NCLB is often characterized as having been implemented during 2002–03because states were required to use testing outcomes from the previous academic year asthe starting point for determining whether a school was making adequate yearly progress(Palmer and Coleman 2003; Lynn Olson, “States Strive toward ESEA Compliance,” Edu-cation Week, December 1, 2002). However, one could reasonably conjecture that the dis-cussion and anticipation surrounding the adoption of NCLB would have influenced schoolperformance during the 2001–02 school year. Alternatively, it could also be argued thatNCLB should not be viewed as in effect until the 2003–04 academic year, when new stateaccountability systems were more fully implemented as well as more informed by guid-ance from and negotiations with the U.S. Department of Education (Lynn Olson, “StatesStrive toward ESEA Compliance,” Education Week, December 1, 2002; Olson, “TakingRoot,” Education Week, December 8, 2004). For a more detailed discussion, see Dee andJacob (forthcoming).
12367-03a_Dee_rev.qxd 2/17/11 10:06 AM Page 163

The top left panel of figure 4, which plots trends in fourth-grade mathachievement, shows that in 1992, states that did not adopt accountabilityuntil NCLB scored roughly 5 scale points (0.18 standard deviation) higheron average than states that adopted school accountability policies by 1998.Although both groups of states made modest gains between 1992 and2000, the group that adopted accountability policies before 1998 experi-enced more rapid improvement during this period.9
If the NCLB accountability provisions had an impact on student perfor-mance, one would expect achievement to increase more after 2002 instates with no prior accountability than in states with prior accountability.It is possible that NCLB led to a level shift in student achievement, whichwould be manifest as a shift in the intercept after NCLB. It is also possiblethat NCLB changed the rate of achievement growth, which would bemanifest as a change in the slope of the achievement trend after NCLB.10
Whether one considers a shift in the intercept or a change in the slope,our identification strategy relies on a comparison of treatment versuscontrol states that accounts not only for the pre-NCLB levels of achieve-ment in each group but also for the pre-NCLB achievement trends ineach group.
The top left panel of figure 4 shows that the mean level of mathachievement jumped noticeably in 2003 for both groups of states. How-ever, relative to prior trends, this shift was larger among the “no prioraccountability” group (the treatment states). Interestingly, there was littlenoticeable change in the growth rate across periods for the states with prioraccountability (the control states): the slope of the achievement trend forthis group is roughly the same before and after 2002. In contrast, achieve-ment rose more rapidly in states with no prior accountability from 2003 to2007 than from 1992 through 2000, such that the growth rates after 2002were roughly equivalent across both groups of states. These trends suggestthat NCLB had a positive impact on fourth-grade math achievement.
164 Brookings Papers on Economic Activity, Fall 2010
9. This visual evidence is consistent with the earlier evaluation literature that studiedpre-NCLB state accountability reforms (for example, Carnoy and Loeb 2002, Jacob 2005,and Hanushek and Raymond 2005).
10. The rate of achievement growth might have increased after NCLB for several rea-sons. First, it may take states time to implement new curricula, instructional strategies, orother support services for students. Second, later cohorts of students will have been“exposed” to NCLB for a larger fraction of their school careers than earlier cohorts. With-out imposing additional assumptions, we cannot cleanly distinguish between these effects.For this reason we focus on the “net” impact of NCLB in different years after the legisla-tion was passed.
12367-03a_Dee_rev.qxd 2/17/11 10:06 AM Page 164

The trends for eighth-grade math (bottom left panel of figure 4) are sim-ilar to those for fourth-grade math, although less pronounced. The patternfor fourth-grade reading (top right panel of figure 4) is much less clear.The pre-NCLB reading trends for both groups are much noisier than themath trends. In particular, the two groups both experienced a decline inachievement in 1994 and then diverged in 1998, but both had made verylarge gains by 2002.11 The states with prior accountability experienced adrop in achievement from 2002 to 2003, both in absolute terms and rela-tive to trend. The other group experienced very little increase from 2002 to2005. Perhaps most important, however, visual inspection of the data inthese plots indicates that the earlier achievement trend was not linear,which is a central assumption of the linear CITS model. Similarly, thebottom right panel of the figure provides no evidence of an NCLB effecton eighth-grade reading achievement.
ESTIMATION STRATEGY. Perhaps the most straightforward approach toestimating the impact of NCLB in the framework described above is asimple difference-in-differences framework in which one compares theachievement levels of treatment and control states before and after theintroduction of NCLB. However, a fundamental assumption of this modelis that any preexisting trends in the outcome variables are equivalentacross treatment and control groups. Figure 4 clearly showed that the con-trol states (those that implemented consequential accountability beforeNCLB) realized more rapid improvements during the pre-NCLB period.For this reason we estimate a more flexible specification that allows forpreexisting trends to differ across groups. Our model is the following:
where Yst is a measure of student achievement for state s in year t, YEARt isa trend variable (defined as the year of the test minus 1989 so that it startswith a value of 1 in 1990), and NCLBt is a dummy variable equal to 1 forobservations starting in the academic year 2002–03. YR_SINCE_NCLBt isdefined as the year of the test minus 2002, so that this variable takes ona value of 1 for the 2002–03 year, which corresponds to the 2003 NAEPtesting. Xst represents a vector of state × year covariates. In the main
( ) _ _1 0 1 2 3Y YEAR NCLB YR SINCE NCLBst t t t= + + + (β β β β ))+ ×( ) + ×( )
+ ×β β
β4 5
6
T YEAR T NCLBT YR SINCE
s t s t
s _ _ NNCLBt st s st( ) + + +β ε7X � ,
THOMAS S. DEE and BRIAN A. JACOB 165
11. The graph is scaled to accentuate what are really quite small absolute changes fromyear to year.
12367-03a_Dee_rev.qxd 2/17/11 10:06 AM Page 165

specification the only state-year covariates included are the fraction and itssquare of students who were tested but excluded from official reportingbecause of limited English proficiency or some type of learning disability.The variables µs and �st represent state fixed effects and a mean-zero ran-dom error, respectively.
Ts is a time-invariant variable that measures the treatment imposed byNCLB. In the most basic setup, Ts could be specified as a dummy variable,with a value of 1 indicating that a given state did not institute consequen-tial accountability before NCLB. This is the approach implicitly taken infigure 4. However, it is more accurate to view the “treatment” provided bythe introduction of NCLB in the framework of a dosage model. Slightlymore than half of the states that introduced consequential school account-ability before NCLB did so within the 4 years before NCLB’s implemen-tation. The simple binary definition of Ts above could lead to attenuatedestimates of the NCLB effect, because the control group would includesome states for which the effects of prior state policies and NCLB areclosely intertwined.
For this reason we instead define Ts as the number of years during ourpanel period that a state did not have school accountability. Specifically,we define the treatment as the number of years without prior schoolaccountability between the 1991–92 academic year and the onset ofNCLB. Hence, states with no prior accountability have a value of 11. Illi-nois, which implemented its policy during the 1992–93 school year, has avalue of 1; Texas has a value of 3, since its policy started in 1994–95; andVermont has a value of 8, since its program started in 1999–2000. Ouridentification strategy implies that the larger the value of this treatmentvariable, the greater the potential impact of NCLB.
This regression specification allows for an NCLB effect that can bereflected in both a level shift in the coefficient on the outcome variable (β5)and a shift in the coefficient on the achievement trend variable (β6), each ofwhich varies with treatment status, Ts. Specifications based on alternativefunctional forms generate results similar to those based on this canonicalCITS design.12 For the sake of parsimony, the impact estimate we report isthe effect of NCLB by 2007 for states with no prior accountability relativeto states that adopted school accountability in 1997 (the mean adoption
166 Brookings Papers on Economic Activity, Fall 2010
12. For example, we get similar results when we allow for a separate NCLB “effect”unique to each post-NCLB year. We also find similar results when we measure treatmentstatus with multiple dummy variables, allowing the trend and shift variables to differ acrossgroups of states that were early, middle, or late adopters of pre-NCLB accountability.
12367-03a_Dee_rev.qxd 2/17/11 10:06 AM Page 166

year among states that adopted accountability before NCLB).13 For allmodels we present standard errors clustered by state to account for serialcorrelation and other forms of heteroskedasticity.
The primary threat to causal inference in our CITS design is the existenceof time-varying unobservable factors that are coincident with the introduc-tion of NCLB, affect treatment and control states differently, and inde-pendently affect student performance. One example is endogenous studentmobility, such as might occur if NCLB caused families to leave or return tothe public schools. Another problematic scenario would be one where eitherthe treatment or the control states recovered from the 2001 recession morequickly. As discussed below, we examine the empirical relevance of theseconcerns in several ways and find no evidence that our findings are biased.
Other threats to the causal validity of this state-based research design areclosely linked to exactly how the NCLB impact estimates from equation 1should be interpreted. For example, our estimates will capture the impact ofthe accountability provisions of NCLB but not the effects of other NCLB pro-visions such as Reading First or the “highly qualified teacher” provision,which were unique nationwide. Second, under the maintained assumptionthat NCLB was effectively irrelevant in states with prior consequentialaccountability systems, our estimates will identify the effects of NCLB-induced school accountability provisions for a particular subgroup ofstates (those without prior accountability policies). To the extent that onebelieves that those states expecting to gain the most from accountability poli-cies adopted them before NCLB, the results we report would understate theaverage treatment effects of school accountability. Similarly, our estimateswill also understate the general effects of school accountability if NCLBamplified the effects of school accountability within the states that alreadyhad it. An alternative concern is that the accountability systems within controlstates may have been weakened as they were adjusted in response to NCLB.To the extent this occurred, our CITS approach would instead overstate theeffects of NCLB. We suspect this concern is not empirically relevant becausethe school reporting and performance sanctions occasioned by NCLB (suchas the possibility of school reconstitution or closure) were strong relative toprior state accountability policies. There is also direct empirical evidence
THOMAS S. DEE and BRIAN A. JACOB 167
13. Specifically, the effect as of 2007 would be calculated as β5 + β6(5) in the simplecase where Ts is binary, but as β5(6) + β6(6 × 5) in our preferred specification where Ts isallowed to vary across states and the NCLB effect is identified relative to a state that imple-mented school accountability in 1997. As a practical matter, both approaches generate sim-ilar results (Dee and Jacob forthcoming, table 3).
12367-03a_Dee_rev.qxd 2/17/11 10:06 AM Page 167

consistent with this assumption: Dee and Jacob (forthcoming) find thatstates with preexisting school accountability systems did not change theirproficiency thresholds after the onset of NCLB.
RESULTS. Table 1 presents estimates of regressions, based on equation 1,of the impact of NCLB on student performance in mathematics and read-ing. Overall, the results suggest that NCLB had uniformly positive effectson math performance among elementary students, particularly fourth-graders. The mean impact of 7.2 score points for fourth-grade math trans-lates to an effect size of 0.23 standard deviation. The effects are evenlarger toward the left of the ability distribution. These estimates suggest thatNCLB increased the proportion of fourth-graders reaching the basic levelon NAEP by 10 percentage points, or a 16 percent increase relative to thecontrol mean of 64 percent. Although the mean effects for eighth-graders arenot statistically significant at conventional levels (a 0.10-standard-deviationeffect, with a p-value of 0.12), the effects at the bottom tail are stronger.NCLB increased the fraction of eighth-graders reaching the basic level inmath by 5.9 percentage points (9 percent).
Although we find that NCLB had larger impacts on the mathematics per-formance of lower-achieving students, we do not find any evidence that theintroduction of NCLB harmed students at higher points on the achievementdistribution. In contrast to some prior work within individual districts andstates, we find that NCLB seems to have increased achievement at higherpoints on the achievement distribution more than one might have expected.For example, in fourth-grade math the impacts at the 75th percentile wereonly 3 scale points lower than those at the 10th percentile.
In contrast to the mathematics results, we do not find consistent evidencethat NCLB influenced student achievement in reading. The NCLB impactestimates for the reading measures are smaller and, in most cases, statisticallyindistinguishable from zero. The one notable exception is the finding thatNCLB improved the reading performance of higher-achieving fourth-graders(those at the 75th and the 90th percentiles) modestly but significantly. How-ever, as noted earlier, a caveat to the reading results is the suggestive evi-dence that the pre-NCLB trends in reading achievement, which are noisyand nonlinear, poorly match the assumptions of the CITS design. Further-more, the capacity of this research design to detect effects on the readingachievement of eighth-graders is attenuated by the fact that only 2 years ofpre-NCLB NAEP data are available for this grade-subject combination.
To test the sensitivity of our results to some of the potentially time-varying unobservable factors described above, we conducted a series offalsification exercises in which we reestimated equation 1 with a variety of
168 Brookings Papers on Economic Activity, Fall 2010
12367-03a_Dee_rev.qxd 2/17/11 10:06 AM Page 168

Tabl
e 1.
Reg
ress
ions
Est
imat
ing
the
Effe
ct o
f NCL
B o
n Fo
urth
- and
Eig
hth-
Gra
de N
AEP
Mat
hem
atic
s an
d R
eadi
ng S
core
sa
Mat
hem
atic
sR
eadi
ng
Fou
rth
grad
e E
ight
h gr
ade
Fou
rth
grad
e E
ight
h gr
ade
(39
stat
es, N
=22
7)(3
8 st
ates
, N =
220)
(37
stat
es, N
=24
9)(3
4 st
ates
, N =
170)
Mea
n pr
e-N
CL
B
Mea
n pr
e-N
CL
B
Mea
n pr
e-N
CL
B
Mea
n pr
e-N
CL
B
outc
ome
in s
tate
sou
tcom
e in
sta
tes
outc
ome
in s
tate
sou
tcom
e in
sta
tes
Est
imat
edw
itho
ut p
rior
E
stim
ated
wit
hout
pri
or
Est
imat
edw
itho
ut p
rior
E
stim
ated
wit
hout
pri
or
Dep
ende
nt v
aria
ble
effe
ctac
coun
tabi
lity
effe
ctac
coun
tabi
lity
effe
ctac
coun
tabi
lity
effe
ctac
coun
tabi
lity
Mea
n N
AE
P s
core
7.24
4**
224
3.70
427
22.
297
216
−2.1
0126
1(2
.240
)(2
.464
)(1
.441
)(2
.070
)P
erce
nt o
f pu
pils
10
.090
**64
5.88
8**
642.
359
61−3
.763
73ac
hiev
ing
at o
r ab
ove
(3.1
45)
(2.6
80)
(1.5
92)
(2.5
61)
basi
c le
vel
75th
-per
cent
ile
6.63
4**
244
4.34
0**
296
2.25
8**
240
1.28
928
2N
AE
P s
core
(1.9
02)
(2.1
89)
(0.9
38)
(2.2
49)
90th
-per
cent
ile
5.20
5**
259
2.53
731
42.
097*
*25
81.
172
299
NA
EP
sco
re(1
.916
)(2
.404
)(0
.805
)(2
.897
)
Sour
ce: A
utho
rs’
regr
essi
ons.
a. E
ach
repo
rted
coe
ffici
ent
is f
rom
a s
epar
ate
regr
essi
on s
peci
fied
as i
n eq
uatio
n 1
in t
he t
ext
and
is t
he s
um o
f co
effic
ient
s β 5
and
β 6. E
ffec
ts a
re a
s of
200
7 fo
r st
ates
with
no
prio
rac
coun
tabi
lity
rela
tive
to s
tate
s th
at a
dopt
ed s
choo
l acc
ount
abili
ty in
199
7. S
ee th
e te
xt f
or d
etai
ls. S
tand
ard
erro
rs c
lust
ered
by
stat
e ar
e in
par
enth
eses
. Ast
eris
ks in
dica
te s
tatis
tical
sig
-ni
fican
ce a
t the
***
1 pe
rcen
t, **
5 pe
rcen
t, or
*10
per
cent
leve
l.
12367-03a_Dee_rev.qxd 2/17/11 10:06 AM Page 169

alternative outcome measures, including state-year poverty rates, medianhousehold income, employment-population ratios, and the fraction of stu-dents in the public schools. Across 40 regressions (10 models for each ofthe four grade × subject combinations), we find only one estimate signifi-cant at the 5 percent level and three estimates significant at the 10 percentlevel. These largely null findings suggest that the assumptions required foridentification are indeed met. In Dee and Jacob (forthcoming), we alsoshow that the results presented in table 1 are robust to a host of alternativespecifications, including the inclusion of a variety of state-year covariates,
170 Brookings Papers on Economic Activity, Fall 2010
Table 2. Regressions Estimating the Effect of NCLB on Fourth- and Eighth-Grade NAEP Mathematics Scores, by Ethnicity and Eligibility for Free School Lunch Programa
Whites Blacks
Mean pre-NCLB Mean pre-NCLB outcome in states outcome in states
Estimated without prior Estimated without prior Dependent variable effect accountability effect accountability
Fourth-gradersMean NAEP score
OLS 5.953** 232 4.582 203(1.990) (5.436)
WLS 5.074** 233 15.378** 202(2.159) (3.710)
Percent of pupils achieving at or above basic levelOLS 7.278** 76 8.431 35
(3.016) (6.693)WLS 7.597** 77 22.690** 33
(3.531) (6.199)Eighth-gradersMean NAEP score
OLS 2.863 281 9.261 241(2.561) (6.774)
WLS 1.828 282 8.826 242(3.680) (8.999)
Percent of pupils achieving at or above basic levelOLS 4.740* 74 9.977 28
(2.639) (7.886)WLS 4.253 76 10.004 28
(3.134) (11.955)
Source: Authors’ regressions.a. Each reported coefficient is from a separate regression and estimates the effect of NCLB as of 2007.
See table 1 and the text for details. OLS = ordinary least squares; WLS = weighted least squares (weighting by student enrollment). Standard errors clustered by state are in parentheses. Asterisks indicate statistical significance at the ***1 percent, **5 percent, or *10 percent level.
12367-03a_Dee_rev.qxd 2/17/11 10:06 AM Page 170

the inclusion of state-specific time trends, the inclusion of a full set of yearfixed effects, and weighting the data by the number of students enrolled inthat state and year.14 Moreover, the inclusion of 2009 NAEP data doesnot change the basic pattern of results presented here.
Table 2 reports regression estimates separately by subgroup, bothunweighted and weighted by student enrollment. Interestingly, the positive
THOMAS S. DEE and BRIAN A. JACOB 171
Hispanics Eligible for free school lunch Not eligible for free school lunch
Mean pre-NCLB Mean pre-NCLB Mean pre-NCLB outcome in states outcome in states outcome in states
Estimated without prior Estimated without prior Estimated without prior effect accountability effect accountability effect accountability
12.409** 204 6.934* 212 3.916 232(4.540) (3.604) (3.102)11.625** 204 9.734** 212 2.603 234(1.572) (2.836) (2.907)
12.499* 40 11.186* 49 5.388 76(6.334) (5.769) (4.435)25.883** 36 17.256** 49 6.832** 78(2.779) (4.986) (3.118)
20.031** 246 10.702* 257 2.199 279(5.766) (6.155) (3.924)8.219** 247 15.761** 256 0.992 281
(4.135) (5.631) (4.171)
22.006** 36 12.773* 47 3.152 72(4.618) (7.328) (4.045)18.692** 36 23.432** 46 2.392 74(4.666) (6.398) (3.478)
14. Dee and Jacob (forthcoming) show that these results are also robust to measuringthe intensity of the treatment imposed by NCLB in terms of the stringency of the profi-ciency standards imposed by the state. Wong, Cook, and Steiner (2009) find this as well.
12367-03a_Dee_rev.qxd 2/17/11 10:06 AM Page 171
effects are particularly large among lower-income and minority stu-dents. For example, among fourth-graders, NCLB increased the mathachievement of black and Hispanic students. Interestingly, the enrollment-weighted estimates are systematically larger than the unweighted esti-mates for low-income and black students. For example, the weightedestimate for African-American students is 15.4 points (roughly 0.5 stan-dard deviation) compared with the unweighted estimate of 4.6 points.Taken at face value, this suggests an important source of treatment-effectheterogeneity, namely, that NCLB had a more positive effect on disadvan-taged students in states with a greater number of such children (for exam-ple, NCLB was more effective for black students in Alabama than forblack students in South Dakota). However, given the relatively smallnumber of treatment states with large populations of black students, thepossibility that this heterogeneity reflects other state-specific traits can-not be discounted. The effect of NCLB on Hispanic students was also quitelarge (roughly 12 points) and did not vary with weighting. The weightedimpact on students eligible for subsidized lunches was 9.7 points (roughly0.3 standard deviation).
II.E. Evidence from Public- and Private-School Comparisons
The above comparison of trends in student performance within statesover time suggests that NCLB had a substantial impact on math achieve-ment, particularly among disadvantaged students in fourth grade. As withany nonexperimental design, however, the findings rest on assumptionsthat cannot be fully tested. For this reason we present results from a com-plementary analysis that makes use of an alternative control group.
In this approach we assess the impact of NCLB by comparing trendsover time in student performance in public versus Catholic schools.15 Stu-dents in private schools are eligible to participate in a number of majorprograms under the ESEA, and NCLB’s reauthorization of ESEA left theseprior provisions largely intact (U.S. Department of Education 2007),implying that the NCLB reforms were comparatively irrelevant for privateschools. The use of Catholic schools in this analysis improves upon interna-tional comparisons by providing a within-nation control group. However,as with the national and international time-series evidence, this approach
172 Brookings Papers on Economic Activity, Fall 2010
15. In earlier work (Dee and Jacob forthcoming) we identify several potential concernswith using Catholic schools to identify the impact of NCLB.
12367-03a_Dee_rev.qxd 2/17/11 10:06 AM Page 172

also conflates the effects of NCLB across states and schools where itsimpact was heterogeneous.
Figure 5, which follows the same structure as figure 4 in comparingtreatment and control states, shows pre- and post-NCLB achievementtrends across public and Catholic schools. Although the performance ofboth public and Catholic students trended upward during the sample period,the latter consistently outperformed their public-school counterparts. How-ever, following the implementation of NCLB, the math performance ofpublic-school students converged somewhat toward that in the Catholicschools and entered a period of somewhat stronger trend growth. Thiscomparative convergence is particularly pronounced for fourth-graders andis consistent with the other time-series evidence suggesting that NCLB
THOMAS S. DEE and BRIAN A. JACOB 173
Source: National Center for Education Statistics.
Scaled score Scaled scoreMathematics
Fourth-graders
Eighth-graders
Reading
Scaled score Scaled scoreMathematics Reading
220215
230225
235
245240
1992 1996 2000 2004
Public
Catholic
NCLBenacted
265270
280
290
275
285
295
1992 1996 2000 2004
215
220
225
230
235
1992 1996 2000 2004
260
265
270
275
280
1992 1996 2000 2004
Figure 5. Mean Scaled Scores on the Main NAEP in Public and Catholic Schools,1990–2007
12367-03a_Dee_rev.qxd 2/17/11 10:06 AM Page 173

improved math achievement, particularly among younger students. Thereading achievement trends of eighth-graders are quite similar acrosspublic and Catholic schools, suggesting the absence of a meaningful NCLBimpact. However, the reading achievement of public-school fourth-graderstrended upward during the NCLB era, particularly relative to that ofCatholic-school fourth-graders, which began a distinctive downward trendduring the NCLB era.
These public-Catholic comparisons are broadly consistent with thestate-based comparisons, suggesting that NCLB led to substantial gains inthe mathematics achievement of fourth-graders and possibly of eighth-graders as well. These particular cross-sector comparisons also suggestthat NCLB increased the reading achievement of fourth-graders. A recentstudy by Manyee Wong, Thomas Cook, and Peter Steiner (2009) includesregression estimates based on public-Catholic comparisons of this sort anddraws similar conclusions. They also find similar, although less preciselyestimated, results in comparisons of public schools and non-Catholic pri-vate schools.
II.F. Summary of Achievement Effects
Given the national scope of the policy, assessing the causal impact ofNCLB on student performance is not straightforward. However, the bodyof evidence presented above seems to suggest that the federal schoolaccountability policy did improve the math achievement of elementarystudents, particularly among socioeconomically disadvantaged groups.Comparable evidence that NCLB generated meaningful improvementsin reading achievement is lacking, however. Moreover, the analysis pre-sented above focuses exclusively on elementary schools. NCLB alsorequires AYP determinations for high schools, but here relatively little isknown about NCLB’s effects, in part because of data limitations: for exam-ple, no state-level data for secondary-school math achievement on themain NAEP are available after 2000.
What is the relevance for policy of the overall gains in math achieve-ment that NCLB appears to have brought about? One way to benchmark a7.2-point (0.23-standard-deviation) gain in fourth-grade math achievementis to compare this effect with achievement gaps that are of interest. Forexample, a test-score gain of this size is equivalent to approximately 24 per-cent of the black-white test-score gap observed in the 2000 NAEP data.Furthermore, because NCLB appears to have been more effective amongdisadvantaged subgroups, it may have contributed to closing some achieve-ment gaps. For example, the effect of NCLB on the math achievement of
174 Brookings Papers on Economic Activity, Fall 2010
12367-03a_Dee_rev.qxd 2/17/11 10:06 AM Page 174

Hispanic fourth-graders was roughly 6 points larger than the correspondingeffects on white students, implying that NCLB closed the white-Hispanicachievement gap by 19 percent.
III. Impact of NCLB on the Organization and Practice of Education
Given the encouraging effects on math achievement and the somewhatpuzzling lack of effects for reading, it is natural to ask how NCLB affectedthe organization and practice of elementary education across the coun-try. Such evidence on potential mediating mechanisms could not onlyguide revisions to the NCLB legislation, but also shed light on the edu-cation production function in ways that would inform other schoolreforms. To provide some coherence to the discussion that follows, wegroup nonachievement outcomes from a variety of sources into severalbroad categories: changes in educational resources, changes in instruc-tional focus or methods or both, and changes in school organization, cli-mate, or culture.
III.A. Impact on Education Expenditure
The direct costs of managing an accountability system are quite smallon a per-pupil basis (Hoxby 2002). However, standards-based reformshave often been presented to the public as a trade: greater resources andflexibility for educators in exchange for greater accountability. One of themost strident criticisms of NCLB is that it failed to deliver on this bargain.However, there is surprisingly little research on the relationship betweenschool accountability and spending, despite an extensive literature on edu-cation finance more generally.
One notable exception is an analysis of district-level expenditure datafrom 1991–92 to 1996–97 by Jane Hannaway, Shannon McKay, andYasser Nakib (2002). Examining four states that implemented compre-hensive accountability programs in the 1990s—Kentucky, Maryland,North Carolina, and Texas—they find that only two (Texas and Kentucky)increased educational expenditure more than the national average (butthose two did so substantially). Hannaway and Maggie Stanislawski (2005)present evidence that the major pre-NCLB accountability reforms in Floridawere associated with increased expenditure for instructional staff supportand professional development, particularly in low-performing schools. Ofcourse, it is difficult to determine whether the accountability policy causedthe increased expenditure or whether both were merely parts of a broader
THOMAS S. DEE and BRIAN A. JACOB 175
12367-03a_Dee_rev.qxd 2/17/11 10:06 AM Page 175

16. Also as before, the figures omit states that adopted school accountability programsbetween 1999 and 2001, because the impacts of these state programs might be confoundedwith the introduction of NCLB in 2002. In the regression estimates discussed below, how-ever, we include all states.
reform agenda. Overall, the extant literature offers at best suggestive evi-dence on how accountability reforms may have influenced school spending.
To provide new evidence on how NCLB influenced local schoolfinances, we pooled annual, district-level data on revenue and expenditurefrom U.S. Census surveys of school district finances (the F-33 Annual Sur-vey of Local Government Finances) over the period from 1994 to 2008(Dee, Jacob, and Schwartz 2010). Our analytical sample consists of alloperational, unified school districts nationwide (roughly 10,000) for eachsurvey year. To identify the effects of NCLB accountability on districtfinances, we utilize the same cross-state trend analysis described above,comparing within-state changes in school finance measures across stateswith and without pre-NCLB accountability programs.
Figure 6 shows trends in district expenditure over time separately forstates that adopted consequential accountability before NCLB and thosethat did not. All results are reported in 2009 dollars and are weighted bydistrict enrollment. As in the earlier figures, the trend lines are fitted linearregression lines.16 The top left panel of figure 6 shows that total per-pupilexpenditure rose more quickly from 1994 to 2002 in states that adoptedpre-NCLB accountability policies. But following the introduction ofNCLB, spending grew more slowly in these early-adopting states, suggest-ing that NCLB increased expenditure. The top right and bottom left panelsof the figure show comparable results for the two largest categories of totalexpenditure, instructional and support service spending.
Table 3 presents regression estimates based on the model in equation 1,with the inclusion of the following district-year controls: enrollment,enrollment squared, the fraction of the student population that is black orHispanic, the poverty rate (based on 2000 census data), the poverty ratesquared, and the interaction between the poverty rate and the fraction blackor Hispanic. As in earlier models, we present standard errors clustered bystate. We report estimates of the impact of NCLB as of 2008 for states thatdid not have consequential accountability before NCLB relative to statesthat adopted consequential accountability in 1997.
The results indicate that NCLB increased total current expenditure by$570 per pupil, or by 6.8 percent from the 1999–2000 mean of $8,360. Theincreased expenditure was allocated to direct instruction and support ser-
176 Brookings Papers on Economic Activity, Fall 2010
12367-03a_Dee_rev.qxd 2/17/11 10:06 AM Page 176

THOMAS S. DEE and BRIAN A. JACOB 177
Source: Authors’ calculations using data from the Common Core of Data’s Local Education Agency (School District) Finance Survey.
a. All data are for elementary and secondary school expenditure. Sample is composed of all noncharter, unifed local education agency school districts, excluding Hawaii, the District of Columbia, and zero-enrollment districts. Estimates are weighted by district enrollment. Treatment and control states are defined as in figure 4.
Thousands of 2009 dollars per pupil Thousands of 2009 dollars per pupilTotal Instructional
Thousands of 2009 dollars per pupil Thousands of 2009 dollars per pupilSupport services Other
7.5
9.5
9.0
8.5
8.0
10.0
1996 2000 2004 2008
1996 2000 2004 2008
Control states
Treatment statesNCLB enacted
2.62.72.82.93.03.13.23.33.4
5.0
5.5
6.0
1996 2000 2004 2008
1996 2000 2004 2008
0.34
0.36
0.38
0.40
Figure 6. Expenditure per Pupil by Timing of Increased School Accountability,1995–2008a
vices in proportions roughly equivalent to average spending patterns, witheffects of $430 (8.3 percent) and $155 (5.6 percent), respectively. Resultspresented in the bottom two rows of the table reveal that the increasedexpenditure was not matched by corresponding increases in federal sup-port, consistent with allegations that NCLB constitutes an unfundedmandate. (However, the increase in spending on student support is notstatistically significant at conventional levels.) In results not shown here,we find that the effects were fairly similar across districts with differentbaseline levels of student poverty, suggesting that NCLB did not meaning-fully influence distributional equity. Moreover, in results reported else-where, we demonstrate that these findings are robust to the same falsification
12367-03a_Dee_rev.qxd 2/17/11 10:06 AM Page 177

exercises and alternative specifications described earlier for the achieve-ment analysis (Dee, Jacob, and Schwartz 2010).17
In light of the achievement effects discussed in the previous section, anatural and policy-relevant question is to ask how the monetized bene-fits of those test-score gains compare with the corresponding expenditureincreases presented here. On the basis of prior estimates that a 1-standard-deviation increase in elementary math scores is associated with an 8 percentincrease in adult earnings (Krueger 2003), the 0.23-standard-deviationimpact of NCLB would translate into a lifetime earnings boost of 1.8 per-cent. Assuming a 3 percent discount rate, the present discounted value asof age 9 of such an increase beginning at age 18 is at least $13,300.18
Hence, even if we assume that the increased expenditure due to NCLB is
178 Brookings Papers on Economic Activity, Fall 2010
17. As discussed in related work, we do not find substantial impacts on class size, sug-gesting that the increase in instructional expenditure due to NCLB may have been allocatedto other functions (Dee, Jacob, and Schwartz 2010).
18. This calculation uses an age-earnings profile of 18- to 65-year-olds taken from theMarch 2007 Current Population Survey. Allowing for reasonable productivity-relatedgrowth in earnings of 2 percent a year increases the monetized benefit of the test-scoregains due to NCLB to roughly $25,500.
Table 3. Regressions Estimating Effects of NCLB on Education Expenditure byFunction and Revenue by SourceConstant (2009) dollars per pupil
Mean for 1999–2000 Estimated impact Dependent variable school year of NCLBa
ExpenditureTotal current expenditure, K-12 8,360 570**
Instructional (2,061) (237)5,209 430***
Support services (1,428) (137)2,786 155
Other (772) (112)365 −0.015
(111) (25)RevenueFederal 660 42
(473) (31)State and local 9,155 448
(2,250) (288)
Source: Authors’ regressions.a. Each reported coefficient is from a separate regression, based on roughly 140,000 district-year
observations, that identifies the effect of NCLB as of 2008. See table 1 and the text for details. Standarddeviations or standard errors clustered by state are in parentheses. Asterisks indicate statistical signifi-cance at the ***1 percent, **5 percent, or *10 percent level.
12367-03a_Dee_rev.qxd 2/17/11 10:06 AM Page 178

sustained for all eight elementary-school years, the economic benefits ofthe corresponding test-score gains are at least twice as large. It should bestressed, however, that this exercise turns on multiple unstated assump-tions. In particular, this back-of-the-envelope calculation ignores cer-tain socially relevant benefits (such as the externalities of human capitalimprovements) and costs (such as the deadweight losses associated withraising government revenue to pay for the added spending). More generally,it is not clear that these expenditure increases were even a relevant mediatingmechanism behind NCLB’s achievement effects. Nonetheless, this calcula-tion provides suggestive evidence that the achievement gains attributable toNCLB may compare favorably with the corresponding spending increases.
III.B. Impact on Teachers and Classrooms
One of the most prominent issues raised by NCLB concerns the intendedand unintended ways in which it may have influenced classroom practice.In particular, test-based accountability policy creates a strong incentive foreducators to focus on tested content and skills. Indeed, according to many,this is precisely the point of the reform. But at the same time, critics haveworried that such incentives may cause schools to neglect important butnontested subjects, or to change instructional practice in a way that pri-oritizes narrow test preparation over broader learning. In this section wediscuss the available evidence on how school accountability programs,including NCLB, influence classroom instruction.
The most consistent and compelling finding with regard to schoolaccountability and classroom instruction involves the allocation of instruc-tional time. A number of studies have documented that test-based account-ability programs cause educators to reallocate instructional time towardtested subjects, to reallocate time within tested subjects toward specificcontent and skills covered on the exam, and to increase time devoted to nar-row test preparation activities that may have little broader value (Hannawayand Hamilton 2008).
In 2001, for example, researchers at the National Board on EducationalTesting and Public Policy surveyed a nationally representative sample ofteachers, asking them a series of questions about how state-mandated test-ing programs influenced their practice (Pedulla and others 2003). Teachersin states where the exam results were used to hold teachers or schoolsaccountable reported shifting instruction toward tested subjects more thandid teachers in states where the exam results were used primarily for infor-mational purposes. For example, 34 percent of teachers working in high-stakes testing regimes, but only 17 percent of teachers in moderate-stakes
THOMAS S. DEE and BRIAN A. JACOB 179
12367-03a_Dee_rev.qxd 2/17/11 10:06 AM Page 179

regimes, reported that the testing program had led them to increase thetime spent in tested areas “a great deal.” In addition, teachers in states withschool accountability programs reported spending more time on a varietyof activities designed to improve student test-taking skills, such as takingpractice tests (Pedulla and others 2003). In states where the tests hadimportant consequences for the schools, roughly 36 percent of elementaryteachers reported spending more than 30 hours per year on test preparationactivities, compared with only 12 percent of teachers in states where testshad few consequences for schools.19
Recent studies that focus on NCLB itself find similar results. In 2005, forexample, researchers at the RAND Corporation collected data from teach-ers, principals, and superintendents in three states (California, Georgia, andPennsylvania) to examine how they were responding to the introductionof NCLB (Hamilton and others 2007). Educators reported a narrowing ofthe curriculum and an emphasis on test preparation, particularly for “bub-ble kids” near the proficiency cut score for their state assessment system.In addition, educators responded to NCLB by increasing the alignmentbetween the curriculum and state standards.
Studies of earlier school accountability programs found a similarincrease in alignment. The programs led teachers to shift the content of theirinstruction within subjects (Stecher and others 1998, Koretz and others1996, Jacob 2005, Koretz and Hamilton 2006). This literature emphasizesthat the format and structure of the test itself can influence instruction. Forexample, Grace Taylor and others (2003) find that testing programs withshort, open-ended items lead teachers to focus greater attention on problem-solving skills.
The Center on Education Policy (CEP) has studied the implementationand impact of NCLB since its inception (CEP 2006, 2007, 2008a, 2008b).As part of its work, CEP not only surveyed a nationally representativesample of school districts in 2005–06 and again in 2006–07, but also con-ducted more intensive case studies of selected school districts. Districtofficials report that NCLB led them to increase the instructional time theirschools devote to math or English language arts (ELA) or both. About62 percent of districts reported that between 2001–02 and 2006–07 theyincreased instruction in these subjects in elementary schools, with the
180 Brookings Papers on Economic Activity, Fall 2010
19. Ladd and Zelli (2002) found similar results in a survey study of school principals inNorth Carolina during the period when the state was introducing its school accountabilityprogram. Principals reported devoting more resources to the high-stakes subjects of math,reading, and writing.
12367-03a_Dee_rev.qxd 2/17/11 10:06 AM Page 180

largest increases in districts with more schools in need of improvement(CEP 2007) and in urban and high-poverty districts (CEP 2006). More-over, the reallocation reported by officials appears substantial. For exam-ple, 80 percent of districts that reported increasing ELA time did so by atleast 75 minutes per week, and 54 percent reported doing so by at least150 minutes per week (CEP 2008). Most districts that reported increasedtime for ELA or math reported cuts in time for other subjects or periods(such as social studies, art, music, gym, recess, or lunch) rather thanincreases in total time in school (CEP 2008).20
The CEP studies also suggest that NCLB influenced classroom practicein ways that may have attenuated teacher autonomy. For example, CEP(2006, 2007) reports that schools made a concentrated effort to align theircurriculum with state standards in the wake of NCLB, thus changing thefocus of their curriculum to put greater emphasis on tested content andskills. Many districts also became more prescriptive during this periodabout what and how teachers were supposed to teach (CEP 2006).
It is worth noting that the costs and benefits of these instructionalchanges depend on one’s objectives and are not always clear even for agiven objective. For example, many observers applaud the increasingemphasis on math and reading instruction, while others lament the decreas-ing attention on subjects such as art and music (Rothstein and others 2008).
Although these studies paint a consistent picture, they need to beinterpreted with some caution. All of the research described thus farrelies on self-reports from teachers or administrators. Moreover, theinformation is based on questions that ask respondents to retrospectivelyassess whether certain practices have changed over time. For this reason,one might be worried about the reliability and validity of the data (Bradburnand Sudman 1988).
Few studies have implemented regression-based research designs thatattempt to isolate the effects of school accountability policies on district,school, and classroom practices from the potentially confounding effects ofother determinants. One prominent exception is a recent study by CeciliaElena Rouse and others (2007), which used a regression-discontinuity
THOMAS S. DEE and BRIAN A. JACOB 181
20. A 2009 Government Accountability Office study based on teacher survey data (andsupplemental interviews with state officials) finds that 90 percent of elementary teachersreported no change in instructional time for arts education between 2004–05 and 2006–07.At the same time, a larger fraction of teachers in schools identified as needing improvementunder NCLB reported a decline in art instruction, relative to teachers in other schools. Thisstudy used data from the Department of Education’s National Longitudinal Study of NoChild Left Behind (NLS-NCLB).
12367-03a_Dee_rev.qxd 2/17/11 10:06 AM Page 181

design and data from surveys of principals in Florida to examine howschools responded to pressure from the state’s accountability system. Theyfind that accountability pressure leads to an increased emphasis on low-performing students (through grade retention, summer school, and tutoring,for example), increased overall instructional time, and reorganized schooldays. They also find suggestive evidence that accountability reduced prin-cipal control and increased the resources available to teachers. Further-more, the school policies influenced by school accountability explain ameaningful fraction of student test-score gains, suggesting that schoolsresponded to accountability pressure in specific ways that improved stu-dent achievement.
Although the work just summarized addresses some of the concernsraised in previous work, it has its own set of limitations. It does not addressNCLB per se, and it estimates what one might describe as the partialimpact of the Florida accountability system, comparing schools more orless affected by accountability pressure. However, it is possible that theaccountability system in Florida, or NCLB more generally, led to changesacross all schools.
In recent work we present new evidence on these issues using data fromthe nationally representative Schools and Staffing Survey (SASS) and thestate-based CITS research design (Dee, Jacob, and Schwartz 2010). TheSASS is a nationally representative survey of teachers and school adminis-trators that has been conducted periodically since the early 1990s (in 1994,2000, 2004, and 2008).21 We use teacher responses from the survey to con-struct a variety of measures of classroom instruction and school organiza-tion. These data allow us to compare changes in teacher responses overtime rather than rely on the teachers’ retrospective judgments. They alsoprovide more objective measures of some of the constructs: for example,the time-use questions ask about the actual number of hours per week ateacher devotes to math, rather than asking teachers to characterize theiremphasis on math as “big” or “small” or whether it is greater or less than itwas a certain number of years ago.
182 Brookings Papers on Economic Activity, Fall 2010
21. Because the pooled SASS data contain data from only two pre-NCLB periods, Dee,Jacob, and Schwartz (2010) also examined the robustness of the SASS-based models to theuse of conventional difference-in-differences specifications. The results were quite similarto the CITS results, with the modest exception of one result discussed below. That paperalso presents falsification exercises similar to those presented for the NAEP and F-33 mod-els, the results of which generally suggest that the CITS specification based on the SASSdata generates internally valid estimates.
12367-03a_Dee_rev.qxd 2/17/11 10:06 AM Page 182

The top left panel of figure 7 shows the comparative trends in realteacher compensation by year across treatment and control states. As inthe previous figures, we show the trends separately for states that didand did not adopt school accountability programs before NCLB. Thesedistrict-level data indicate that, after the introduction of NCLB, averageannual teacher compensation increased distinctly, from roughly $75,000to over $80,000, in states that did not have prior school accountability.However, this graph also suggests an NCLB effect: this compensationgrowth was particularly large relative to the corresponding changes in
THOMAS S. DEE and BRIAN A. JACOB 183
Source: Authors’ calculations using data from the Common Core of Data (top panels) and the Schoolsand Staffing Survey (bottom panels).
a. Sample is composed of all noncharter, unifed local education agency school districts, excludingHawaii, the District of Columbia, and zero-enrollment districts. Estimates are weighted by districtenrollment. Teacher compensation includes the value of noncash employee benefits.
b. Treatment and control states are defined as in figure 4.c. Sample consists of full-time elementary- and middle-school teachers with a main assignment in
mathematics, English language arts, or general elementary instruction.
Thousands of 2009 dollars Pupils per teacherTeacher compensationa Pupil-teacher ratioa
No. of pupils PercentClass sizec
Share of teacherswith a master’s degreec
90
80
85
1996 2000 2004 2008
1996 2000 2004 2008
Control states
Treatment statesb
NCLB enacted
22.0
21.5
23.0
23.5
22.5
16.0
16.5
15.5
17.0
17.5
18.0
1996 2000 2004 2008
1996 2000 2004 2008
4042
3638
444648
75
Figure 7. School Resources by Timing of Increased School Accountability, 1994–2008
12367-03a_Dee_rev.qxd 2/17/11 12:58 PM Page 183

states that had school accountability regimes before NCLB. The bottomright panel of figure 7 shows changes over time in the fraction of ele-mentary- and middle-school teachers with a master’s degree (based onthe pooled SASS data) and similarly suggests an NCLB effect. In stateswith prior accountability programs, roughly 47 percent of teachers had a master’s degree in 1994, compared with 37 percent of teachers in otherstates. Following the introduction of NCLB, the fraction of teachers witha master’s degree jumped notably in states without prior accountability, sothat in 2004 the rates were approximately equal across both groups ofstates. By 2008, teachers in states without prior accountability wereslightly more likely to have a master’s degree than their counterparts inother states. In contrast, the top right and bottom left panels of figure 7provide no clear indication that NCLB influenced class sizes or pupil-teacher ratios, respectively (see also Dee, Jacob, and Schwartz 2010).
Table 4 presents regression estimates of these effects based on the CITSmodel in equation 1, adding a variety of controls for teacher, school, anddistrict observed traits (Dee, Jacob, and Schwartz 2010). As above, stan-dard errors are clustered by state. The results indicate that NCLB increasedaverage teacher compensation by over $5,000, or by roughly 8 percent rel-ative to the pre-NCLB mean of $79,577. The table also indicates that by2008, NCLB had increased the fraction of teachers with a master’s degreeby roughly 0.056, from a baseline of 0.41, an increase of roughly 14 per-cent. Given that many districts require teachers to have a master’s degreefor permanent certification, it is possible that this effect reflects theresponse of states to the NCLB provision requiring schools to have“highly qualified” teachers in every classroom. The fact that states withprior accountability policies also had a substantially larger fraction ofteachers with a master’s degree suggests that programs adopted by statesbefore NCLB may have contained some provisions regarding teacherqualifications.
The top right and bottom left panels of figure 8 show trends in timeuse for our sample of elementary-school teachers and principals for statesthat did and those that did not adopt school accountability programsbefore NCLB. The top right panel shows the amount of instructionaltime (in hours per week) that teachers report for core academic subjects.The bottom left panel shows the fraction of time during the week thatself-contained teachers (those who provide instruction in multiple sub-jects to a single group of students) teach math and ELA, where thedenominator is total time spent on the four core subjects (math, ELA,
184 Brookings Papers on Economic Activity, Fall 2010
12367-03a_Dee_rev.qxd 2/17/11 10:06 AM Page 184

THOMAS S. DEE and BRIAN A. JACOB 185
social studies, and science). The bottom right panel of the figure showsthis ratio for ELA alone.
These figures suggest that NCLB did not lead to meaningful increasesin the total amount of instructional time devoted to core subjects, butthat instructional time allocated to math and ELA increased following theintroduction of NCLB. Moreover, the effects seem to be larger in statesthat had not previously instituted school accountability, consistent withNCLB leading to this change.
Table 4. Estimated Effects of NCLB on School Resources, Allocation of InstructionalTime, and Educational Climate
Mean for Estimated 1999–2000 impact of
Dependent variable school year NCLBa
School resourcesTeacher compensation (dollars)b 79,577 5,067*
(20,338) (2,888)Pupil-teacher ratiob 16.986 −0.151
(2.692) (0.491)Class size 22.120 −0.328
(4.990) (0.500)Fraction of teachers with master’s degree 0.412 0.056**
(0.492) (0.028)Instructional timeHours per week spent on core academic subjectsc 21.758 −0.307
(6.445) (0.684)Fraction of total hours spent on math and English 0.737 0.036***
(0.130) (0.012)Fraction of total hours spent on English 0.476 0.023*
(0.156) (0.013)Educational climateFraction of schools where principal places highest priority 0.875 −0.003
on academic excellence or basic skill acquisition (0.331) (0.037)Teachers’ perceptions of school discipline −0.003 0.074
(0.989) (0.115)Teachers’ perceptions of student engagement 0.059 0.220***
(0.990) (0.056)
Source: Authors’ regressions.a. Each reported coefficient is from a separate regression and identifies the effect of NCLB as of 2008.
See table 1 and the text for details. Except where noted otherwise, estimates use pooled data from theSchools and Staffing Survey. Standard deviations or standard errors clustered by state are in parentheses.Asterisks indicate statistical significance at the ***1 percent, **5 percent, or *10 percent level.
b. Estimates use data from the Common Core of Data’s Local Education Agency (School District)Finance Survey from the National Center for Education Statistics. Teacher compensation includes thevalue of noncash employee benefits.
c. Mathematics, English language arts, social studies, and science.
12367-03a_Dee_rev.qxd 2/17/11 10:06 AM Page 185

186 Brookings Papers on Economic Activity, Fall 2010
Source: Authors’ calculations using data from the Schools and Staffing Survey.a. Departmentalized teachers (those who instruct several classes of different students, usually in the
same subject) as a share of all (departmentalized, self-contained, and team) teachers.b. Time devoted to mathematics, English language arts, social studies, and science.c. Sample consists of classes taught by self-contained and team teachers only. d. Treatment and control states are defined as in figure 4.
Percent Hours per weekShare of departmentalized teachersa Total core academic timeb,c
Percent Percent
Share of time devoted to math andEnglish language artsc
Share of time devoted toEnglish language artsc
30
24
26
28
2022
1996 2000 2004 2008
1996 2000 2004 2008
Control statesTreatmentstatesd
NCLB enacted
7473
76
78
75
21.5
22.0
21.0
1996 2000 2004 2008
1996 2000 2004 2008
4950
4748
51525379
77
18
Figure 8. School Allocation of Time, by Timing of Increased School Accountability,1994–2008
Estimates reported in the middle panel of table 4 indicate that NCLBincreased the fraction of time that teachers spend on math and ELA by3.6 percentage points, relative to a baseline of 74 percent. This implies anadditional 45 minutes per week of math and ELA instruction by teacherswho spend 20 instructional hours on these two subjects. It appears thatthis increase was driven primarily by an increase in time devoted toELA: table 4 indicates that NCLB increased the share of instructionaltime devoted to ELA by a weakly significant 2.3 percentage points. Incontrast, we do not find that NCLB had statistically significant effects
12367-03a_Dee_rev.qxd 2/17/11 10:06 AM Page 186

on the fraction of time devoted to math. This is particularly interestinggiven that we find substantial achievement effects in math but not inreading.
III.C. Impacts on School Organization, Climate, and Culture
The literature provides some evidence that test-based accountabilitypolicies, including NCLB, have spurred other useful changes in school-wide instructional practice. In the RAND study cited above (Hamilton andothers 2007), for example, school and district administrators reported thatNCLB increased the use of diagnostic assessment (exams used by teachersto determine a student’s areas of strength and weakness) as an instructionaltool and increased the technical assistance and professional developmentopportunities offered to schools. In earlier survey work, researchers foundthat teachers in high-stakes environments found test results more useful,and were more likely to use test information to inform their practice, thancolleagues in low-stakes environments (Pedulla and others 2003). Simi-larly, teachers in the RAND study reported that their state’s accountabilitysystem under NCLB led them to search for more effective teaching prac-tices and, in nearly all cases, had led to positive changes in their schools(Hamilton and others 2007). Interestingly, for example, teachers reportedthat teaching practices and the general focus on student learning “changedfor the better” under accountability. District officials in the CEP studyreported an increase in the use of data to guide instruction (CEP 2006).
Unfortunately, the SASS has not routinely collected data on many ofthe school and teacher practices that are of interest, and this limits ourcapacity to isolate the effects of NCLB on some of these outcomes. How-ever, the SASS has collected consistent data on several relevant school-level traits. For example, the principals who responded to the SASS wereasked to choose their top three priorities from a list of nine educationalgoals. The top panel of figure 9 shows the comparative trend data for the share of principals who indicated that either academic excellence oracquisition of basic skills was their top goal. States with and without prioraccountability did not converge on this measure of instructional focusafter NCLB. This pattern suggests that NCLB did not generate a detectableincrease in instructional focus, a result confirmed by the regression resultsin table 4.
Teachers surveyed in the SASS provided scaled responses to questionsabout whether principals and fellow teachers enforced rules for studentconduct. The middle panel of the figure shows the comparative trends forthe standardized responses to this question and suggests the lack of an
THOMAS S. DEE and BRIAN A. JACOB 187
12367-03a_Dee_rev.qxd 2/17/11 10:06 AM Page 187

188 Brookings Papers on Economic Activity, Fall 2010
Source: Authors’ calculations using data from the Schools and Staffing Survey.a. Sample is limited to full-time elementary- and middle-school principals.b. Treatment and control states are defined as in figure 4.c. Sample is defined as in figure 7.d. Higher scores indicate greater enforcement of rules or greater engagement.
Percent of schoolsPrincipals place highest priority on academic excellence or basic skill acquisitiona
Standardized composite scoredTeachers’ perception of school disciplinec
88
84
86
80
82
1996 1998 2000 2002 2004 2006
1998 2002 2006
1998 2002 2006
2008
1996 2000 2004 2008
Control statesTreatmentstatesb
NCLB enacted
0.1
0
0.3
0.2
0.1
0
0.3
0.2
78
Standardized composite scoreTeachers’ perception of student engagementc
1996 2000 2004 2008
Figure 9. School Culture Outcomes by Timing of Increased School Accountability,1994–2008
12367-03a_Dee_rev.qxd 2/17/11 10:06 AM Page 188

NCLB effect (again confirmed by the results in table 4). The bottom panelshows the trend data for a standardized measure of how teachers viewedtheir students’ school-relevant behavior and attitudes. This measure, anindex of “behavioral engagement” with school, standardized to have amean of zero and a standard deviation of 1, reflects the extent to whichteachers feel that traits such as tardiness, absenteeism, and apathy are not aproblem within their school. Here there seems to have been comparativeimprovement in this measure of student engagement for states that intro-duced school accountability because of NCLB. The regression results intable 4 indicate that the size of this increase is 0.22 base-year (1994) stan-dard deviation.
This estimated effect on student engagement is over twice as large inhigh-poverty schools. However, Dee, Jacob, and Schwartz (2010) findthat NCLB’s estimated effects on this engagement measure are noticeablysmaller (an effect size of 0.094) in a difference-in-differences specifica-tion, which does not condition on pretreatment trends unique to treat-ment status. We cannot definitively establish whether the CITS or thedifference-in-differences specifications generate more accurate pointestimates in this context. However, the differences in pre-NCLB studentengagement trends across treatment and control states depicted in figure 9are consistent with the motivation for the CITS specification. A verydifferent caveat to this result is that NCLB’s apparent effect on teacher-reported student engagement could simply be due to policy-inducedchanges in teacher expectations. For example, to the extent that NCLBincreased the expectations for academic achievement in states withoutprior school accountability policies, it is possible that teachers simulta-neously chose to benchmark the behavioral engagement of their studentswith school against a more lax standard. If this is true, our estimate of theimpact on behavioral engagement is biased upward.
III.D. Summary
The evidence presented above suggests that NCLB has had both desir-able and undesirable effects on school district spending, teachers, class-room practice, and school culture. Unfortunately, the lack of objectivemeasures for several important instructional practices limits our ability toexamine many of the most plausible mechanisms through which account-ability may have operated to improve student achievement. Moreover, theanalysis here does not allow us to identify which, if any, of the factors weidentify as improving (for example, per-pupil spending, student engage-ment, teacher qualifications, or instruction time devoted to English) might
THOMAS S. DEE and BRIAN A. JACOB 189
12367-03a_Dee_rev.qxd 2/17/11 10:06 AM Page 189
explain the achievement effects we document. Nonetheless, this analysisprovides important evidence on the policy-relevant, nonachievement con-sequences of NCLB (for example, its fiscal effects) as well as guidepoststo the intended and unintended ways in which NCLB has shaped the avail-able measures of educational practice.
IV. Conclusions
Eight years have passed since No Child Left Behind dramatically expandedthe federal role in public schooling. Given the national scope of the policy,it is difficult to reach definitive conclusions about its impact. Nonetheless,evidence from a variety of data sources utilizing several plausible compar-ison groups suggests that NCLB has had a positive effect on elementarystudent performance in mathematics, particularly at the lower grades. Thebenefits appear to be concentrated among traditionally disadvantaged pop-ulations, with particularly large effects among Hispanic students. On theother hand, the existing evidence suggests that NCLB has not had a com-parable effect on reading performance.
We find compelling evidence that NCLB increased per-pupil schooldistrict expenditure, particularly on direct instruction, a mediating mecha-nism that may explain the corresponding achievement gains. By 2008, forexample, the policy appears to have increased annual spending per pupil bynearly $600 in states that did not have any school accountability programbefore NCLB; these increased outlays were not supported by correspond-ing increases in federal revenue. We also presented evidence that theseexpenditure increases may be modest relative to the present discountedvalue of the corresponding test-score gains. We also discussed evidencesuggesting that NCLB influenced teachers and schools in several poten-tially important ways. It appears that NCLB has led elementary schools toincrease instructional time devoted to math and reading, although themajority of evidence on this point comes from teacher and administratorsurvey data that are subject to potential bias. Similarly, teachers report thatNCLB has encouraged schools to spend time on narrow test preparationactivities. However, we also found evidence that NCLB led to increases inteacher-reported measures of students’ behavioral engagement with school.Unfortunately, a lack of a richly detailed dataset that lends itself to credibleidentification strategies makes it difficult to assess whether NCLB influ-enced curriculum and instructional practices in more fundamental ways.
Nonetheless, the extant body of evidence can provide some guidance tothe ongoing debate over the proposed reauthorization of NCLB. In March
190 Brookings Papers on Economic Activity, Fall 2010
12367-03a_Dee_rev.qxd 2/17/11 10:06 AM Page 190

2010 the Obama administration released an NCLB “blueprint” that out-lined proposed features of a reauthorization (Klein and McNeil 2010). Thisproposal calls for continued annual reporting of school-level, test-basedstudent assessments but allows for flexibility in how states calculate schooleffectiveness. The blueprint also calls for the use of nontest accountabil-ity indicators, especially measures of college and career readiness (such asattendance, course completion, and school climate). Another potentiallycritical feature of this proposal involves changing how measures ofschool performance are linked to consequences.
The blueprint also proposes to give states increased flexibility in howthey might intervene in low-performing schools, mandating specific con-sequences only for the very lowest-performing schools and those with per-sistently large achievement gaps. It is not clear how states would respondto this added flexibility. However, the literature on pre-NCLB account-ability policies suggests that simply reporting accountability measuresthat were unconnected to explicit consequences did not drive improve-ments in student achievement (Hanushek and Raymond 2005). Thissuggests that the targeted achievement gains attributable to NCLB couldbe at risk under state reforms that decouple performance measures frommeaningful consequences.
ACKNOWLEDGMENTS We would like to thank Rob Garlick, EliasWalsh, Nathaniel Schwartz, and Erica Johnson for their research assistance. Wewould also like to thank Kerwin Charles, Robert Kaestner, Ioana Marinescu,and seminar participants at the Brookings Panel conference, a conference at theHarris School of Public Policy Studies at the University of Chicago, and at theNCLB: Emerging Findings Research Conference at the CALDER Center ofthe Urban Institute for helpful comments. An earlier version of this work waspresented by Brian Jacob as the David N. Kershaw Lecture at the annual meet-ing of the Association of Public Policy Analysis and Management, November2008. All errors are our own.
The authors report no relevant conflicts of interest.
THOMAS S. DEE and BRIAN A. JACOB 191
12367-03a_Dee_rev.qxd 2/17/11 10:06 AM Page 191
References
Ballou, Dale, and Matthew Springer. 2009. “Achievement Trade-offs and NoChild Left Behind.” Washington: Urban Institute.
Bradburn, Norman M., and Seymour Sudman. 1988. Polls and Surveys: Under-standing What They Tell Us. San Francisco: Jossey-Bass.
Carnoy, Martin, and Susanna Loeb. 2002. “Does External Accountability AffectStudent Outcomes? A Cross-State Analysis.” Educational Evaluation andPolicy Analysis 24, no. 4 (Winter): 305–31.
Center on Education Policy. 2006. From the Capital to the Classroom: Year 4 ofthe No Child Left Behind Act. Washington.
———. 2007. “Choices, Changes, and Challenges: Curriculum and Instruction inthe NCLB Era.” A report in the series From the Capital to the Classroom: Year5 of the No Child Left Behind Act. Washington.
———. 2008a. “Instructional Time in Elementary Schools: A Closer Look atChanges for Specific Subjects.” A report in the series From the Capital to theClassroom: Year 5 of the No Child Left Behind Act. Washington.
———. 2008b. “Has Student Achievement Increased since 2002? State Test ScoreTrends through 2006–07.” Washington.
Dee, Thomas, and Brian Jacob. Forthcoming. “The Impact of No Child LeftBehind on Student Achievement.” Journal of Policy Analysis and Management.
Dee, Thomas S., Brian A. Jacob, and Nathaniel L. Schwartz. 2010. “The Effect ofNo Child Left Behind on School Finance, Organization and Practice.” Workingpaper. University of Virginia and University of Michigan.
Figlio, David N., and Helen F. Ladd. 2007. “School Accountability and StudentAchievement.” In Handbook of Research in Education Finance and Policy,edited by Helen F. Ladd and Edward B. Fiske. New York and London: Routledge.
Fuller, Bruce, Joseph Wright, Kathryn Gesicki, and Erin Kang. 2007. “GaugingGrowth: How to Judge No Child Left Behind?” Educational Researcher 36,no. 5: 268–78.
Goertz, Margaret E., Mark C. Duffy, and Kerstin Carlson Le Floch. 2001.“Assessment and Accountability Systems in the 50 States: 1999–2000.” CPREResearch Report no. RR-046. Philadelphia: Consortium for Policy Research inEducation.
Hamilton, Laura S., Brian M. Stecher, Julie A. Marsh, Jennifer Sloan McCombs,Abby Robyn, Jennifer Lin Russell, Scott Naftel, and Heather Barney. 2007.Standards-Based Accountability under No Child Left Behind: Experiences ofTeachers and Administrators in Three States. Santa Monica, Calif.: RANDCorporation.
Hannaway, Jane, and Laura Hamilton. 2008. “Performance-Based AccountabilityPolicies: Implications for School and Classroom Practices.” Washington:Urban Institute and RAND Corporation.
Hannaway, Jane, and Maggie Stanislawski. 2005. “Responding to Reform: FloridaSchool Expenditures in the 1990s.” Urban Institute and Colorado State University.
192 Brookings Papers on Economic Activity, Fall 2010
12367-03a_Dee_rev.qxd 2/17/11 10:06 AM Page 192

Hannaway, Jane, Shannon McKay, and Yasser Nakib. 2002. “Reform andResource Allocation: National Trends and State Policies.” In Developments inSchool Finance, 1999–2000, edited by William J. Fowler Jr. Washington: U.S.Department of Education, National Center for Education Statistics.
Hanushek, Eric A., and Margaret E. Raymond. 2001. “The Confusing World ofEducational Accountability.” National Tax Journal 54, no. 2: 365–84.
———. 2005. “Does School Accountability Lead to Improved Student Perfor-mance?” Journal of Policy Analysis and Management 24, no. 2: 297–327.
Hoxby, Caroline M. 2002. “The Cost of Accountability.” In School Accountabil-ity, edited by Williamson M. Evers and Herbert J. Walberg. Stanford, Calif.:Hoover Institution Press.
Jacob, Brian A. 2005. “Accountability, Incentives and Behavior: The Impact ofHigh-Stakes Testing in the Chicago Public Schools.” Journal of Public Econom-ics 89, no. 5–6: 761–96.
Jacob, Brian A., and Steven D. Levitt. 2003. “Rotten Apples: An Investigation ofthe Prevalence and Predictors of Teacher Cheating.” Quarterly Journal of Eco-nomics 118, no. 3: 843–77.
Klein, Alyson, and Michele McNeil. 2010. “Administration Unveils ESEA Reau-thorization Blueprint.” Education Week (March 17).
Koretz, Daniel. 2008. Measuring Up: What Educational Testing Really Tells Us.Harvard University Press.
Koretz, Daniel M., and Laura S. Hamilton. 2006. “Testing for Accountability inK-12.” In Educational Measurement, 4th ed., edited by Robert L. Brennan.Westport, Conn.: American Council on Education/Praeger.
Koretz, Daniel M., Sheila Barron, Karen J. Mitchell, and Brian M. Stecher. 1996.The Perceived Effects of the Kentucky Instructional Results Information System(KIRIS). MR-792-PCT/FF. Santa Monica, Calif.: RAND Corporation.
Krieg, John M. 2008. “Are Students Left Behind? The Distributional Effects of theNo Child Left Behind Act.” Education Finance and Policy 3, no. 2: 250–81.
Krueger, Alan B. 2003. “Economic Considerations and Class Size.” EconomicJournal 113: F34–F63.
Ladd, Helen F. 2007. “Holding Schools Accountable Revisited.” 2007 SpencerFoundation Lecture in Education Policy and Management. Washington: Asso-ciation for Public Policy Analysis and Management. www.appam.org/awards/pdf/2007Spencer-Ladd.pdf (accessed November 8, 2009).
Ladd, Helen F., and Arnaldo Zelli. 2002. “School Based Accountability in NorthCarolina: The Responses of School Principals.” Education AdministrationQuarterly 38, no. 4: 494–529.
Lee, Jaekyung, and Kenneth K. Wong. 2004. “The Impact of Accountability onRacial and Socioeconomic Equity: Considering Both School Resources andAchievement Outcomes.” American Educational Research Journal 41, no. 4:797–832.
Neal, Derek, and Diane Whitmore Schanzenbach. 2010. “Left Behind by Design:Proficiency Counts and Test-Based Accountability.” Review of Economics andStatistics 92, no. 2: 263–83.
THOMAS S. DEE and BRIAN A. JACOB 193
12367-03a_Dee_rev.qxd 2/17/11 10:06 AM Page 193

Palmer, Scott R., and Arthur L. Coleman. 2003. “The No Child Left Behind Actof 2001: Summary of NCLB Requirements and Deadlines for State Action.”Washington: Council of Chief State School Officers (November). events.ccsso.org/content/pdfs/Deadlines.pdf (accessed November 13, 2009).
Pedulla, Joseph J., Lisa M. Abrams, George F. Madaus, Michael K. Russell,Miguel A. Ramos, and Jing Miao. 2003. Perceived Effects of State-MandatedTesting Programs on Teaching and Learning: Findings from a National Surveyof Teachers. Chestnut Hill, Mass.: National Board on Educational Testing andPublic Policy.
Reback, Randall, Jonah E. Rockoff, and Heather L. Schwartz. 2010. “The Effectsof No Child Left Behind on School Services and Student Outcomes.” Workingpaper. Barnard College and Columbia University.
Rothstein, Richard, Rebecca Jacobsen, and Tamara Wilder. 2008. “Grading Edu-cation: Getting Accountability Right.” New York: Teachers College Press.
Rouse, Cecilia Elena, Jane Hannaway, Dan Goldhaber, and David Figlio. 2007.“Feeling the Florida Heat? How Low-Performing Schools Respond to Voucherand Accountability Pressure.” Cambridge, Mass.: National Bureau of Eco-nomic Research.
Stecher, Brian M., Sheila Barron, Tessa Kaganoff, and Joy Goodwin. 1998. “TheEffects of Standards-Based Assessment on Classroom Practices: Results of the1996–97 RAND Survey of Kentucky Teachers of Mathematics and Writing.”CSE Technical Report 482. National Center for Research on Evaluation, Stan-dards, and Student Testing, University of California, Los Angeles.
Stullich, Stephanie, Elizabeth Eisner, Joseph McCrary, and Collette Roney. 2006.National Assessment of Title I Interim Report to Congress, Vol. I: Implementa-tion of Title I. Washington: U.S. Department of Education, Institute of EducationSciences.
Taylor, Grace, Lorrie Shepard, Freya Kinner, and Justin Rosenthal. 2003. “A Sur-vey of Teachers’ Perspectives on High-Stakes Testing in Colorado: What GetsTaught, What Gets Lost.” CSE Technical Report 588. National Center forResearch on Evaluation, Standards, and Student Testing, University of Califor-nia, Los Angeles.
U.S. Department of Education, Office of Planning, Evaluation and Policy Devel-opment, Policy and Program Studies Service. 2007. “Private School Partici-pants in Federal Programs under the No Child Left Behind Act and theIndividuals with Disabilities Education Act: Private School and Public SchoolDistrict Perspectives.” Washington.
U.S. Government Accountability Office. 2009. “Access to Arts Education.”Report to Congressional Requesters. GAO-09-286. Washington (February).
Wong, Manyee, Thomas D. Cook, and Peter M. Steiner. 2009. “No Child LeftBehind: An Interim Evaluation of Its Effects on Learning Using Two Inter-rupted Time Series Each with Its Own Non-Equivalent Comparison Series.”Working Paper no. WP-09-11. Institute for Policy Research, NorthwesternUniversity.
194 Brookings Papers on Economic Activity, Fall 2010
12367-03a_Dee_rev.qxd 2/17/11 10:06 AM Page 194

195
Comments and Discussion
COMMENT BYCAROLINE M. HOXBY Thomas Dee and Brian Jacob provide a reviewof existing empirical studies on how No Child Left Behind (NCLB) hasaffected student achievement. They also present original findings basedon a difference-in-differences comparison of states that implementedschool accountability only with NCLB and those that had implemented it previously. The difference-in-differences work relies on test scoresfrom the National Assessment of Educational Progress (NAEP), the onlyexamination regularly administered to samples of students representa-tive of each state.
In their review of existing studies, Dee and Jacob concisely, yet accu-rately, summarize the most credible research on NCLB and the stateaccountability laws that preceded it. Much of the existing evidence islacking in rigor or partial in nature, and the authors do an excellent jobof differentiating between stronger and weaker results. However, Dee andJacob’s difference-in-differences work is the meat of their paper, and thusthese comments focus on it.
Of all the areas within education in which the federal government playsa role, that in primary and secondary education is by far the most minor.Whereas each of the states has a responsibility for education written intoits constitution and has a long history of financing and overseeing educa-tion, the federal government has traditionally confined itself to funding asmall percentage of the education of poor and disabled students and thosewith limited knowledge of English. At no time before the Obama adminis-tration did the federal government account for more than 10 percent ofpublic spending on primary and secondary education, and it has no formalrole in the governance of any regular public school. Simply put, the federal
12367-03b_Dee comments-rev.qxd 2/17/11 10:16 AM Page 195

government is a very junior partner in education policy; states and localschool districts occupy the driver’s seat.
This structure of financing and control has two important implicationsfor all federal education policy. First, it is state governments and largeschool districts that set the pace and frontier in education policy. Second,the federal government has little ability to enforce its policy will: evenwhen federal law mandates some education policy, it is states and dis-tricts that must implement it. And they are quite capable of implementingonly the letter of the law, and none of its intent. These two implicationsare glaringly obvious in the history of NCLB.
Starting in the late 1980s, a number of states began to enact laws designedto hold their schools accountable for overall student outcomes. They insti-tuted mandatory statewide exams and published the results prominentlyin the media and in “school report cards” sent to parents. They devisedgrading systems for their schools, which gave better grades to schools withhigher test scores and graduation rates. The more sophisticated state grad-ing systems incorporated value-added calculations for schools based ontest scores, regression adjustments for sociodemographics, and weightson a variety of complex outcomes beyond scores. Schools that earned poorgrades experienced interventions, sometimes welcome and sometimesnot, from state departments of education. Chronically failing schools werereconstituted by some states. The states that led the accountability move-ment created powerful databases that allowed them to track students andteachers longitudinally, certified teachers through nontraditional routes(such as proficiency testing), rewarded teachers and schools they deemedsuccessful, and established very modest forms of school choice.
The accountability movement was led by an informal but like-mindedgroup of governors and chief state school officers, prominent amongwhom were Governor George W. Bush of Texas and Governor Jeb Bushof Florida. Both Bushes would later point to education accountability as theirmain legacy to the states they governed. Thus, it should come as no surprisethat when NCLB was drafted as one of the first major policies of the GeorgeW. Bush presidency, the first draft looked a lot like Texas’ and Florida’saccountability policies. The final version, however, was a very dilute law,reflecting numerous political compromises and the federal government’snegligible powers of enforcement.
NCLB was written in such a way that states antagonistic to schoolaccountability could easily evade every aspect of the law. For instance, bychoosing a test on which nearly all students did well from the start, a statecould ensure that all its schools met the proficiency standard and thereby
196 Brookings Papers on Economic Activity, Fall 2010
12367-03b_Dee comments-rev.qxd 2/17/11 10:16 AM Page 196

escaped all consequences of failure. (One state, Nebraska, got away withchoosing no statewide test at all.) A state could comply with NCLB’sreporting provisions by putting its school report cards on an obscurewebsite with little or no functionality. Some websites deliberately pre-vented parents and journalists from comparing schools’ reports. Statescould ensure that all their teachers met the “highly qualified” mandatesof NCLB, which were meant to ensure subject area knowledge, simply bysetting standards that automatically made all their existing teachers “highlyqualified.” For instance, some states declared all teachers who were experi-enced or certified to be highly qualified regardless of their proficiency orarea of teaching. Districts that wished to evade the (very modest) schoolchoice provisions of NCLB could refrain from notifying parents that theirchildren were eligible to transfer to another public school and from tellingparents that they could use their federal dollars for private tutoring services.
In short, NCLB was a peculiar law. It could have little effect on statesantagonistic to school accountability. Rather, it was a nudge to states thatsupported accountability enough to welcome a nudge but not enough to haveenacted accountability before NCLB. States that had already adoptedpro-accountability measures viewed NCLB as a drag on their more ambi-tious, more sophisticated policies. For instance, Jeb Bush’s Florida wrestledwith the U.S. Department of Education, trying to get waivers from thefederal school grading system, which was manifestly inferior to its own.Several states, especially Massachusetts, argued that NCLB gave themstrong incentives to reduce the quality of their tests.
This is the backdrop to Dee and Jacob’s analysis, and it is one thatcauses their difference-in-differences estimates to be quite unreliable.Their estimates almost certainly understate the effects in which policy-makers are interested. My logic on this has three different components.First, Dee and Jacob’s “control” states did not hold their policies con-stant, and so do not amount to true counterfactuals. Second, NCLB couldbe expected to have heterogeneous treatment effects depending on a state’swillingness to implement it, and the difference-in-differences analysis doesnot account for this. Third, policymakers are interested in population-average effects, which the difference-in-differences analysis substantiallyunderstates. Let me take each of these in turn.
Dee and Jacob describe as “treated by NCLB” those states that had noschool accountability program before the 2001 law. Their “control” statesare those that had implemented their own accountability programs before2001. Their difference-in-differences method identifies the effects ofNCLB by comparing the pre-versus-post-NCLB achievement change in
COMMENTS and DISCUSSION 197
12367-03b_Dee comments-rev.qxd 2/17/11 10:16 AM Page 197
treated states with the pre-versus-post achievement change in controlstates. There are a few more details to the equation they estimate, but thiscomparison is the key to their identification strategy.
In a credible difference-in-differences exercise, the control states mustreveal what would have occurred in the treated states had NCLB not beenenacted. This they do not do in the Dee and Jacob exercise. The controlstates are the pro-accountability states that had already enacted more ambi-tious programs than NCLB and that continued to extend and improve theirprograms in the wake of its enactment. These states rolled out improvedschool grading systems, estimated the value added of individual teachers,and instituted rewards for individual students to excel (such as scholar-ships) and remedies for students who did not (such as summer school andgrade retention). Many of the control states actually increased accountabil-ity more in the immediate aftermath of NCLB than did the treated states.Thus, the control states’ achievement reflects not only the lagged effects oftheir pre-NCLB policies (since student achievement reacts gradually topolicy) but also the effects of their post-NCLB increases in accountability.This makes the control states a very poor counterfactual for the treatedstates, most of which would have enacted no or only weak accountabilityprograms had NCLB not existed. There is no guarantee that removing thepre-NCLB trend in the achievement of control states, as Dee and Jacob do,fixes the difference-in-differences strategy: such a fix would work onlyif the control states’ pre- and post-NCLB policy changes just happenedto produce a constant rate of change in achievement. This is possible butseems unlikely. Since the dynamics of how achievement reacts to account-ability are unknown, one cannot even say whether removing a linear timetrend over- or understates the true counterfactual.
Difference-in-differences strategies estimate a treatment effect that islocal to the sort of states being “treated.” If the effect of the NCLB washeterogeneous, which it surely was given states’ variation in enthusiasmfor implementing the law, the analysis requires treatment and controlgroups that are balanced in terms of their susceptibility to the treatment.Otherwise, the estimated effect does not reveal the population-averageeffect, which is largely what interests policymakers. That is, policy-makers wish to know what the effect of NCLB would be in a state of aver-age enthusiasm. Few if any policymakers have voiced a wish to know theeffect of NCLB on just those states that balked at implementing account-ability. Although a local effect of this kind might be interesting to a fewpeople, it is not what policymakers think they are getting when they askwhat the effect of school accountability is. In practice, estimation of a
198 Brookings Papers on Economic Activity, Fall 2010
12367-03b_Dee comments-rev.qxd 2/17/11 10:16 AM Page 198

treatment effect that is local to the balky states almost certainly substan-tially understates the population-average effect. It is the econometrician’sresponsibility to insist that readers not interpret a local treatment effect asa population-average one when it is clear that the control and treatmentgroups were poorly balanced in terms of susceptibility to treatment.
In my experience, what interests voters is not even the population-average treatment effect that NCLB would have had. What interests themis the effect of a school accountability policy when implemented fairlyfaithfully by leaders who believe in it. The voters’ choice is between, on the one hand, candidates who run on a platform of accountability andwho would therefore attempt to implement it as intended, and on the other,candidates who run against accountability and would not implement it.So far, we have seen no candidates declare that they will implement anaccountability program in a way that deliberately evades its intention.
Before summing up, I must say something about the mismatch betweenthe empirical strategy the authors describe and the equation they use toimplement it, which is
The authors describe their empirics in terms of dosage: essentially, theywant to allow states that had no accountability program before NCLB toget the “full dose” of the 2001 law. They want to allow states that hadalready taken a full dose of accountability before 2001 to get little ornothing out of the law. This is reasonable as an explanation, but it suggeststhat they will measure dosage by indicators of the degree to which the statehad already, by 2001, implemented the key features of NCLB (statewidetesting, publication of school grades in report cards, highly qualified teach-ers, modest forms of school choice). One might also include enthusiasmfor implementation as part of a state’s dosage calculation.
Unfortunately, the estimating equation proxies dosage with Ts, the num-ber of years a state was without school accountability between the 1991–92academic year and the onset of NCLB. That is, the authors posit that dosagewas linear in year of implementation, so that if a state’s accountability pro-gram was implemented one year earlier, its NCLB dosage decreases byone unit. This specification does not match up with reality. First, states thatimplemented accountability earlier did not consistently have more ambi-tious accountability laws. For instance, most commentators would rate
Y YEAR NCLB YR SINCE NCLBst t t t= + + + ( )+
β β β ββ
0 1 2 3 _ _
44 5
6
T YEAR T NCLBT YR SINCE NCL
s t s t
s
×( ) + ×( )+ ×
ββ _ _ BBt st s st( ) + + +β ε7X � .
COMMENTS and DISCUSSION 199
12367-03b_Dee comments-rev.qxd 2/17/11 10:16 AM Page 199

Florida’s program as easily the most ambitious, but it was not implementeduntil 1999–2000, making it a later-than-average implementer among thecontrol states. Second, making the dose linear in year of implementation isvery restrictive—so restrictive that the estimating equation is not plausiblyeliminating differences in preexisting trends for control states based ontheir true dosage, which we have seen is crucial for avoiding bias in thedifference-in-differences estimates. It would be preferable to have a proxyfor dosage that is actually based on measures of the variety and stringencyof the policies implemented.
NCLB, like most laws implemented nationwide, is very difficult toevaluate because no natural control group exists. What one would needto evaluate it perfectly is a “twin” United States without the law. Nothaving such a twin at their disposal, Dee and Jacob make a valiant effortto assess the effect of NCLB on student achievement. However, what theyend up estimating is, even under the very optimistic assumption that theircontrols for preexisting trends and dosage work perfectly, an unusualparameter: the effect of school accountability on states that balk atimplementing such laws and can evade them fairly easily. This effectmay interest some, but it understates the effect that school accountabil-ity has with an average degree of rigor in implementation and probablygreatly understates the effect with faithful implementation.
COMMENT BYHELEN F. LADD Determining how the 2002 reauthorization of thefederal Elementary and Secondary Education Act, commonly called NoChild Left Behind (NCLB), has affected students, teachers, and schoolsposes a significant challenge because the program was implemented in allstates at the same time. The most straightforward approaches, such ascomparing trends in test scores before and after the introduction of NCLB,or comparing trends in the United States with those in other countries,generate conclusions that are at best suggestive because of the potential forconfounding changes.
This paper by Thomas Dee and Brian Jacob makes an important con-tribution to the literature on NCLB. The authors have made a creative andvaliant, if not completely successful, effort to use an innovative strategy toinvestigate the effects of NCLB not only on test scores but also on a num-ber of mediating mechanisms such as spending and instructional practices.The authors’ main conclusions are that NCLB generated some positivegains in mathematics, especially among disadvantaged fourth-graders, but
200 Brookings Papers on Economic Activity, Fall 2010
12367-03b_Dee comments-rev.qxd 2/17/11 10:16 AM Page 200

no gains in reading, and that it induced higher state and local spending anda shift of attention toward math and reading within schools. These con-clusions are generally plausible. At the same time, however, some per-plexing timing patterns emerge that deserve further attention. In general,a stronger framing and a richer discussion of the policy implications wouldhave made an excellent paper even more useful to the current policydebate.
THE STUDY DESIGN—AND A PERPLEXING FINDING FOR FOURTH-GRADE MATH.
Central to the paper is the authors’ interpretation of which states receivedthe NCLB “treatment.” Their innovation is to include in the treatmentgroup only those states that did not have a prior, state-level accountabilitysystem at the time NCLB was introduced. The control group is thencomposed of the states that were early adopters of accountability systems,and the authors pay appropriate attention to when precisely these systemswere adopted. The underlying logic is clear: only in states without existingaccountability systems similar to that of NCLB would the introductionof NCLB represent a new treatment. Although this strategy is creative, it isnot immune from criticism. Among my concerns are that the authors mayhave overstated the similarity of NCLB and the pre-NCLB accountabilitysystems in many of the control states, and that in the post-NCLB period,such states may have responded to NCLB in ways that would render theiroutcome trends less than ideal measures of what the trends would havelooked like in the treatment states in the absence of NCLB. (As an aside,I also wonder why the authors did not apply their treatment logic to theircomparison of test scores between public schools and Catholic schoolsover time.) In any case, the authors’ main analytical strategy is plausible—and better than most alternative approaches—but not perfect.
Using this strategy, the authors find the strongest test score gains forfourth-graders in math. The authors’ analysis of test results is based onscores on the National Assessment of Educational Progress (NAEP),which is appropriate because the low stakes on this test make the scores farless subject to manipulation through teaching to the test than would be thecase with the states’ own high-stakes tests. The reliance on NAEP scores,however, means the authors are working with a small dataset: it includesonly 39 states that had NAEP scores both before and after NCLB, and onlya few years of data because the tests are not given every year. Their fig-ure 4 shows a very big jump in fourth-grade NAEP scores from 2000 to2003 in the treatment group relative to the control group, as well as somedifferential increase in the growth rates over time, and these patterns areconfirmed by the authors’ regression analysis. Such a large jump over
COMMENTS and DISCUSSION 201
12367-03b_Dee comments-rev.qxd 2/17/11 10:16 AM Page 201
that period seems highly implausible to me, however, given that 2003,which represents the 2002–03 school year, is the first year after the intro-duction of NCLB.
More framing is needed to help the reader evaluate the plausibility of thisbig jump and to provide more of a foundation for the rest of the paper.One perspective is that the accountability mechanism of NCLB was simplyintended to reduce teacher shirking. Such a view is consistent with the briefprincipal-agent framing that the authors provide early in the paper. Withinthe context of such a perspective, teachers could conceivably raise studentachievement quite quickly. Once teachers are put on notice that they areaccountable for student test scores, for example, they might immediately stopshirking, and test scores might quickly rise. An alternative view is that NCLBis best interpreted as a catalyst for a variety of changes that may ultimatelyraise test scores but not immediately. Such changes might include, for exam-ple, increased state and local spending, more professional development forteachers, changes in instructional processes, or shifts in school schedulesso that teachers can devote more effort to the tested subjects. All of thesechanges are likely to take some time to play out. This catalytic view is consis-tent with other findings in the paper, including, for example, the finding thatstates raised spending, but it is inconsistent with the empirical finding of a biggain in fourth-grade math scores in the first year of the program.
Two other considerations are also relevant to the expected timing of anyeffects. To the extent that education is a cumulative process, learning infourth grade, for example, depends in part on how much children learnedin earlier grades. For that reason, even if the teachers in the early gradesunderstand the importance of their teaching for student test scores insubsequent grades and respond to NCLB by changing their practices in positive ways, it would take some time for those changes to show up inthe achievement levels of fourth-graders. Moreover, the complexity ofthe implementation process should also have led to delayed effects on testscores. In response to NCLB, many states phased in the required testingand set up requirements in a way that backloaded the gains necessary tomeet the 2013–14 proficiency goal, and sanctions were designed to be min-imal at first and to increase over time. Such timing considerations make mesuspicious of the estimated early gains in fourth-grade math test scores thatemerge from Dee and Jacob’s estimation strategy. Instead I would haveexpected at most very small effects in the initial year, with the effectsincreasing over time.
INTERPRETING THE MAGNITUDES. Even if we accept Dee and Jacob’s esti-mates of the NCLB effects on test scores, it is reasonable to ask how one
202 Brookings Papers on Economic Activity, Fall 2010
12367-03b_Dee comments-rev.qxd 2/17/11 10:16 AM Page 202

should interpret the magnitudes. The answer the authors themselves give isthat the fourth-grade math effects are large enough to be policy relevant.They note, for example, that the estimated average gain of 7.2 scale pointsis about 24 percent of the black-white gap (but why that is a relevant com-parison is not clear in this context), and that the gains for Hispanics relativeto those for whites imply a 19 percent reduction in the Hispanic-white gap.An alternative, policy-motivated answer is that the gains are tiny relative tothe gains needed to get all fourth-graders to 100 percent proficiency.
A third possible answer is that the effects are small relative to whatmight have been possible with an alternative, more comprehensive policy.This answer is given support by my table 1, which compares gains in NAEPscores in Massachusetts between 2000 and 2007 with the average NCLB“effect” estimated by Dee and Jacob on fourth- and eighth-grade math andreading scores. I have selected Massachusetts for the comparison becauseof the ambitiousness of its 1993 reform package and its highly toutedsuccess in raising test scores. The table shows that Dee and Jacob’s esti-mated NCLB effects are far smaller than the actual gains achieved in Mass-achusetts. The estimated 7-point NCLB effect in fourth-grade math fallsfar short of the 19-point gain in Massachusetts, and the statistically insignif-icant 3.3-point effect in eighth-grade math is even further below the corre-sponding (also 19-point) gain in Massachusetts. In reading, Massachusettsexperienced gains at both grade levels, whereas the NCLB effects arestatistically indistinguishable from zero.
COMMENTS and DISCUSSION 203
Table 1. Gains in NAEP Test Scores in Massachusetts and Dee and Jacob’s EstimatedEffects of NCLBScore points
Fourth grade Eighth grade
MathematicsMassachusetts
Average score, 2000 233 279Average score, 2007 252 298Change +19 +19
National NCLB effect (Dee and Jacob) +7.2 +3.7 (NS)a
ReadingMassachusetts
Average score, 1998 223 269Average score, 2007 236 273Change +13 +4
National NCLB effect (Dee and Jacob) +2.3 (NS) −2.1 (NS)
Sources: National Center for Education Statistics; Dee and Jacob, this volume, table 1.a. NS = not statistically significant.
12367-03b_Dee comments-rev.qxd 2/17/11 10:16 AM Page 203

The nature of the Massachusetts reform package provides a possibleexplanation for the different patterns. In contrast to the NCLB reform,which was narrowly focused on test-based accountability, accountabilitywas only one small part of a far more comprehensive reform effort inMassachusetts. This state’s reform package included a substantial increasein funding (more than doubling in 10 years), new learning standards,revised student assessments based on clear curriculum frameworks,revised teacher licensing and professional development programs, andearly childhood programs, as well as parental choice and the creation ofnew charter schools. Such a package is far closer to what in the educationliterature has been called standards-based reform than what was imple-mented under NCLB. Although NCLB is an outgrowth of the standardsmovement at the national level, it in fact incorporates only one part—the accountability part—of what was intended to be a far more positive,constructive, and comprehensive approach to raising the achievement ofall students.
CONCLUSION AND IMPLICATIONS FOR POLICY. I draw several conclusionsfrom Dee and Jacob’s paper. First, any effects of NCLB on test scores aresmall at best. The positive effect of NCLB on average math scores thatemerges from this study occurs too soon relative to what might have beenreasonably predicted, and for that reason may be overstated. Moreover,even the reported effects are small relative to what Massachusetts hasshown to be feasible. Further, whether there are positive effects on eighth-grade math is not clear, and no effects on reading emerge at either gradelevel. This latter fact is reported in the paper, but its implications are notdiscussed. On a brighter note, there may be some positive effects for blackstudents in fourth-grade (although not in eighth-grade) math and forHispanic students in math at both grade levels.
Among the authors’ other findings is that NCLB appears to have inducedadditional state and local spending on education. My interpretation of thisfinding is that there is no free lunch. Stated differently, it is a mistake tobelieve that accountability systems can, by themselves and without associ-ated funding, generate gains in student achievement. In addition, as mostpolicy analysts would have predicted, NCLB appears to have shifted atten-tion and resources away from other subjects toward math and reading. Thethorny question, but one that an empirical study of this type cannot answer,is whether that shift is desirable or undesirable.
So what do such findings imply for policy? The answer is not fullyclear, but my take differs quite sharply from the thoughts the authorspresent in the final section of the paper. First, the null findings for reading
204 Brookings Papers on Economic Activity, Fall 2010
12367-03b_Dee comments-rev.qxd 2/17/11 10:16 AM Page 204

indicate to me that to the extent that higher reading scores are an importantgoal for the country, NCLB is clearly not the right approach. That raisesthe obvious follow-up question: what is? One possible answer, but one thatgoes far beyond the subject of this paper, is that policymakers need to payattention to what goes on outside of schools as well as within schools. Asecond policy conclusion arises from the suggestive evidence that Ihave included here on Massachusetts, namely, that states may be in a bet-ter position to promote student achievement than the federal government.That raises the question of how the federal government can best encouragethe states to engage in significant comprehensive reform efforts. My read-ing of Dee and Jacob’s paper is that NCLB is far from the best approachfor the federal government to pursue.
GENERAL DISCUSSION Brian Knight observed that although limitedinformation is available on the paper’s control group, the analysis wouldbe improved by making the control and treatment groups as comparable asthe data allow. He wondered whether there was any additional variationthat could be exploited in choosing these groups. Knight was also struckby the reported increase in spending per pupil after NCLB and was curi-ous whether there were heterogeneous effects, particularly at the state andlocal levels. He was interested in knowing more about the incidence of thespending increase, and in particular whether it fell mostly on state taxpay-ers or was paid for by cutting back other state spending.
Christopher Jencks found one of the paper’s results, the effect of NCLBon fourth-grade mathematics scores in the first year of the policy change,to be implausibly large. Although math scores should have increased dur-ing this period, for the result to be convincing it was necessary to rule outother causes, such as differences in the content of the test over time. JamesHines, however, found the results on fourth-grade math scores plausible andargued that it was not necessary to impose a linear trend.
Kristin Forbes found the different observed impacts of NCLB on mathand reading scores interesting and wondered whether there was any theorythat would have predicted this difference. Have any other countries under-taken similar reforms and observed this type of differential effect? Ananalysis of why NCLB has had a stronger impact on math than on readingcould be important in understanding how NCLB has worked and whatother types of educational reforms are likely to be the most effective.
Erik Hurst wondered what the proper way to specify the productionfunction for human capital would be in this context. He was also interested
COMMENTS and DISCUSSION 205
12367-03b_Dee comments-rev.qxd 2/17/11 10:16 AM Page 205

in the effects of NCLB on other outcomes besides test scores, such asgraduation rates and the incomes of graduates.
Caroline Hoxby spoke in defense of NCLB, noting that the law wasintended to be similar to those previously implemented in reformist states.She thought most people would like to know what would have been theeffect of NCLB on the average state—that is, on a state that had a typicalamount of enthusiasm for implementing school accountability. This effectcould be approximated by averaging two estimates: first, the estimatedeffect of school accountability laws in states that implemented them beforeNCLB (the enthusiastic implementer effect), and second, the estimatedeffect of NCLB in states that had no accountability law before NCLB (theunenthusiastic implementer effect). She observed further that math andreading are very different subjects, and that math is almost entirely taught atschool whereas parents have a much bigger impact on reading, so that thedisparate effects of NCLB on the two subjects were plausible.
Annette Vissing-Jorgensen noted that migration rates have differedacross booms and recessions. These could affect the results for the impactof NCLB among Hispanic students. She also wondered about possiblecohort effects, noting that such an effect could be occurring in the mathresults presented in the paper’s figure 4. Students included at any year inthe top panel would enter the bottom panel 4 years later.
Christopher Jencks agreed with the authors that NCLB is difficult toevaluate statistically since it was implemented all at once. However, somestates set the standard for student proficiency quite high, so many studentswould have to learn more for a school’s performance to be judged accept-able, while other states set low standards so that relatively few studentswould have to learn more for a school’s performance to be judged accept-able. One would expect NCLB to have less of an impact in states whereschools did not have to improve most students’ performance. On the differ-ence in results between math and reading, given that kids do not learn mathon their own before going to school, as Hoxby had noted, one might haveexpected that family background would have more of an effect on readingthan on math, but that prediction does not hold up in the authors’ results.
Helen Ladd wondered whether the different results for reading thanfor math might have less to do with the differences between the subjectsthemselves than with the tests used to measure proficiency. State-levelresults using state tests have shown gains in reading that do not show upin the NAEP. If math curriculums are closer to what is tested on the NAEPthan reading curriculums, the results might not come through as well forreading. Ladd also thought it worth noting that test scores are only part of
206 Brookings Papers on Economic Activity, Fall 2010
12367-03b_Dee comments-rev.qxd 2/17/11 10:16 AM Page 206

the picture in evaluating NCLB. Costs are also a consideration, as are othermeasures of success besides achievement, such as graduation rates andcollege attendance, as Hurst had noted.
Adele Morris remarked that although the paper found no evidence thatNCLB harmed students at the high end of the achievement scale, it mightbe worth taking a second look, particularly at the very highest level. Onecurrent debate about NCLB is the degree to which it could reduce theresources that schools devote to the education of gifted learners. Toexplore this, the authors could examine the dependent variable at the 95thpercentile or higher for the NAEP score, as well as explore the effect ofNCLB on expenditure on programs for the gifted.
Melissa Kearney commented that many observers have questionedwhether the magnitude of the effect found for NCLB on fourth-grade mathtest scores is credible. Presumably there is a sizable empirical literatureestimating the effects of earlier experimentation with accountability at thestate level. Were the effects the authors found in line with those estimates?Or are previous estimates so small that there would have to be large generalequilibrium effects in order for the paper’s estimates to be right?
COMMENTS and DISCUSSION 207
12367-03b_Dee comments-rev.qxd 2/17/11 10:16 AM Page 207