the impact of product line extensions and consumer goals
TRANSCRIPT
Marketing Science Institute Special Report 09-201
The Impact of Product Line Extensions and Consumer Goals on the Formation of Price Image
Ryan Hamilton and Alexander Chernev
Copyright 2009 Ryan Hamilton and Alexander Chernev
MSI special reports are in draft form and are distributed online only for the benefit of MSI corporate and academic members. Reports are not to be reproduced or published, in any form or by any means, electronic or mechanical, without written permission.

1
The Impact of Product Line Extensions and Consumer Goals on the Formation of Price Image
RYAN HAMILTON
ALEXANDER CHERNEV*
* Ryan Hamilton ([email protected]) is an Assistant Professor of Marketing, phone: 404-
727-9892, fax: 404-727-6313, Goizueta Business School, Emory University, 1300 Clifton Road, Atlanta, GA
30322, and Alexander Chernev ([email protected]) is an Associate Professor of Marketing, phone: 847-
491-3352, fax: 847-491-2498, Kellogg School of Management, Northwestern University, 2001 Sheridan
Road, Evanston, IL 60208. The authors wish to thank the editor, associate editor, two anonymous reviewers,
Bob Blattberg, Aparna Labroo, Kelly Goldsmith, Jiewen Hong and Oleg Urminsky for their helpful comments
and suggestions. This research was generiously supported by a research grant from the Marketing Science
Institute.
2
How do vertical product line extensions influence a retailer’s price image? Conventional wisdom
suggests that adding an upscale or downscale item to a product line has a directionally consistent impact on
price image, such that upscale extensions increase price image and downscale extensions decrease price image.
In contrast, this research argues that vertical extensions can have the opposite effect, such that upscale
extensions can decrease rather than increase price image, and vice versa for downscale extensions. The authors
further propose that the impact of vertical extensions on price image is a function of consumer goals and, in
particular, whether consumers have the intent of browsing or buying. These predictions are tested in a series of
five empirical studies that offer converging evidence in support of the proposed theory.

3
Product line extensions, both upscale and downscale, are common occurrences in retail settings. For
example, Best Buy recently added the upscale Magnolia home theater line to complement its lower priced
electronics offerings. Similarly, JC Penny has added the high-end Sephora brand, priced much higher than the
rest of its cosmetics line. Even Wal-Mart has experimented with adding a few upscale items to its assortments.
Downscale extensions are even more common, with many retailers augmenting their product lines with low-
priced offerings, often in the form of private labels, to increase the overall sales volume.
Previous research on vertical extensions has investigated how extending a retailer’s product line impacts a
firm’s profitability (Draganska and Jain 2005), competitive entry (Schmalensee 1978) and brand positioning
(Horsky and Nelson 1992). Another body of research has investigated how vertical extensions can influence
which option consumers choose (Simonson and Tversky 1992) and the likelihood that they will defer choice
(Boatwright and Nunes 2001). Although prior research has examined the influence of vertical product line
extensions on both company performance and on consumer decision making, there has been very little
research investigating how vertical extensions influence the impressions consumers form of a retailer and, in
particular, of a retailer’s price image.
Conventional wisdom suggests that vertical extensions have a directionally consistent impact on price
image, such that upscale extensions increase price image and downscale extensions decrease price image. This
assumption is consistent with psychological theories of impression formation (e.g., Anderson 1965; Troutman
and Shanteau 1976), which assert that the overall impression of a set of items is sensitive to changes in the
mean of the set (Levin 1974). Because adding higher or lower priced extensions leads to a directionally
consistent change in the mean price, one can argue that vertical extensions should also lead to a directionally
consistent shift the price image.
The assumption that vertical extensions have a directionally consistent impact on price image is
consistent with the price image management strategies used by many marketers. Thus, it has been proposed
that to lower its price image a retailer would be well advised to include low-priced options in its product
portfolio (A. T. Kearney 2005). In line with this strategy, Whole Foods has begun promoting low-priced

4
vertical extensions as a part of a plan to lower its price image (Barbaro 2006). Similarly, in the United
Kingdom, Burger King recently introduced a ₤85 ($170) Kobe beef and foie gras hamburger in an effort to
create a more upscale image (Sun 2008). The assumption that vertical extensions are likely to have a
directionally consistent impact on a retailer’s price image was further confirmed by a survey conducted among
the participants in an advanced MBA marketing seminar. In evaluating the intuitive impact of vertical
extensions on price image, we found that 98% (N = 60) of the participants believed that a store that carried
downscale extensions would have a lower price image than a similar store that carried upscale extensions.
In this research we question the wisdom of the popular belief that product line extensions will have a
directionally consistent impact on price image. In particular, we show that vertical extensions can have the
opposite effect on price image, such that upscale extensions can decrease rather than increase price image, and
vice versa for downscale extensions. We propose that the impact of vertical extensions on price image is a
function of consumer goals and, in particular, whether consumers have the intent of browsing or buying. We
test these predictions in a series of five empirical studies that offer converging evidence in support of the
proposed theory and identify its boundary conditions.
THEORETICAL BACKGROUND
Consumers form complex networks of associations with the stores at which they shop (Martineau 1958;
Myers 1960) and the brands that they buy (Gardner and Levy 1955; Keller 1998). Although these amorphous
bundles of associations can include almost any kind of information—from quality perceptions (Berry 1969) to
assessments of corporate social responsibility (Brown and Dacin 1997)—the price dimension, or price image,
has previously been singled out by marketing researchers for special consideration (e.g., Alba et al. 1994;
Buyukkurt 1986; Simester 1995; van Heerde, Gijsbrechts, and Pauwels 2008).
Price image is important to retailers because it can influence so many of the perceptions consumers form
and the decisions they make. For example, it has been shown that price image has a direct impact on the prices
consumers expect to pay at a particular store, such that consumers expect prices to be higher at a store with a
high-price image than at a store with a low-price image (cf., Thaler 1985). Price image also has been shown to
5
influence consumer decision making, including purchase-deferral decisions, such that stores with a high-price
image are associated with a higher likelihood of finding a better price elsewhere, leading to higher rates of
purchase deferral than at stores with a lower price image (Srivastava and Lurie 2001). In addition, price image
has been found to influence consumers’ choice among retailers, such that consumers typically opt for stores
with a lower price image when they are keen to save money (Bell and Lattin 1998; Singh, Hansen, and
Blattberg 2006; Urbany, Dickson, and Sawyer 2000; van Heerde, Gijsbrechts, and Pauwels 2008).
Previous research has primarily focused on how consumers evaluate the prices of individual items (e.g.,
Monroe 1973), rather than on how they evaluate the overall price level of a retailer. Although we now know a
great deal about how consumers perceive individual prices (e.g., Adaval and Monroe 2002; Janiszewski and
Lichtenstein 1999; Mazumdar and Monroe 1990), how they integrate these price perceptions into an overall
price image has received much less attention. The relatively small body of work on price image formation has
focused primarily on the role of non-price factors, such as price-match guarantee policies (Srivastava and Lurie
2001, 2004) and store ambiance (Brown 1969; Buyukkurt and Buyukkurt 1986). Previous research into the
impact of prices on price image has focused on the influence of individual prices within a category (Alba et al.
1994; Alba et al. 1999; Buyukkurt 1986), without explicitly examining the impact of the retailer’s assortment
on price image.
When acquiring price information, consumers tend to be motivated by one of two goals: browsing or
buying. Consumers with a browsing goal are interested in gathering information for possible future use, but not
for the immediate purpose of picking one option to put into their shopping basket (Claxton, Fry, and Portis
1974; Putsis and Srinivasan 1994; Urbany, Dickson, and Wilkie 1989). Browsing often involves making a
judgment, in which the objective is to construct an overall assessment of an alternative or set of alternatives
(Johnson and Russo 1984). In contrast, consumers with a buying goal seek information for use in an immediate
purchase decision. A buying goal typically culminates in a choice: selecting one alternative from a
consideration set (Bettman, Luce, and Payne 1998; Johnson and Russo 1984).
6
Browsing and buying goals are likely to lead to differences in consumers’ breadth of focus when
evaluating price information. Browsing often entails allocating attention across many options, rather than
focusing on any one option in particular (Moe 2003; Putsis and Srinivasan 1994; Urbany, Dickson, and Wilkie
1989). In contrast, a buying goal tends to lead to a narrow allocation of attention, ultimately focusing
consumers on the to-be-purchased alternative (Moe 2003; Putsis and Srinivasan 1994).
Prior research suggests that differences in the breadth of focus are likely to lead to different patterns of
information processing when forming impressions. Thus, it has been shown that when individuals have a
relatively broad focus they form impressions that are often best described by a simple averaging model, in
which each piece of information is given equal weight (e.g., Anderson 1965; Levin 1974). In contrast to a
broad focus, a focus on a single option has been shown to increase the likelihood that this option will be
evaluated by comparing it to the other options in the set (Dhar and Simonson 1992; Carmon, Wertenbroch, and
Zeelenberg 2003; Fiske 1980; Mackenzie 1986; Wyer and Watson 1969). Research on context effects has
demonstrated that when people focus on one option, other options under consideration serve as reference
points that influence the evaluation of the focal option (Martin, Seta, and Crelia 1990; Janiszewski and
Lichtenstein 1999). A narrow focus also has been found to increase the weight or importance of the focal
option in an overall impression (Fiske 1980; Mackenzie 1986; Wyer and Watson 1969).
Building on previous research, we argue that the activation of a browsing or buying goal will lead to
differences in how consumers form price images. In particular, we propose that a browsing goal is likely to
lead to the integration of price information, since the broader focus associated with a browsing goal has been
shown to lead to a more equal weighting of information in impression formation (Anderson 1965; Levin
1974). As such, a browsing goal will lead to price images that are more sensitive to the average price of a
consideration set. In this context, adding an extension is likely to shift the overall price image in a direction
consistent with the shift in the average price of the set. Thus, an upscale extension will tend to increase the
overall price image, whereas a downscale extension will likely decrease it.
7
On the other hand, because buying goals are associated with a narrower focus, consumers with a buying
goal are more likely to center their attention a single alternative. The evaluation of this focal option will be
sensitive to comparisons made to other options in the set. Thus, a buying goal is likely to both focus a
consumer on one option and increase the likelihood that the focal option will be contrasted with other
options—including vertical extensions. When a choice is made in the context of an upscale extension, the
result will be a contrast effect: a lower perceived price of the focal option caused by the addition of the high-
priced extension. Following the same logic, a downscale extension is likely to serve as a low-end reference
point, thereby increasing the perceived price of the focal option. The intuition for these predictions is consistent
with prior research showing that an option is perceived to be less expensive in the context of higher prices and
more expensive in the context of lower prices (Adaval and Monroe 2002; Janiszewski and Lichtenstein 1999;
Krishna et al. 2006). Because focal options tend to be over-weighted in an overall impression (Fiske 1980;
Mackenzie 1986; Wyer and Watson 1969), the result is a contrast effect: a lower price image when there is an
upscale extension and a higher price image when there is a downscale extension.
To summarize, we propose that the impact of product line extensions on price image is a function of
consumers’ goals. In particular, we propose that consumers with a browsing goal are more likely to integrate
the price of the extension with the prices of the other available options—a scenario in which the change in the
price image will be directionally consistent with the extension type, such that upscale extensions lead to a
higher price image and downscale extensions lead to a lower price image. Alternatively, consumers with a
buying goal are more likely to contrast the price of their focal option with the price of the extension—a
scenario in which the shift in price image can be directionally opposite to the extension type, such that upscale
extensions can lower the overall price image and downscale extensions can increase it. We test these
predictions in a series of five experiments described in more detail in the following sections.
EXPERIMENT 1
The goal of Experiment 1 was to test the impact of product line extensions on price image as a function of
consumer goals. In particular, we examined the validity of the proposition that a browsing goal leads to a
8
directionally consistent shift in price image, such that upscale extensions increase price image and downscale
extensions decrease it. We further tested the proposition that a buying goal leads to a directionally opposite
shift in price image, such that upscale extensions decrease rather than increase price image and downscale
extensions increase it.
Method
Seventy-three students from a large Midwestern university were recruited to participate in a computer-
based study on consumer preferences. Participants were given a scenario representing a fairly typical shopping
experience—namely, one in which they enter a store to buy a particular item (a DVD movie) but are first
exposed to items in a different category (DVD players) as they traverse the store. Thus, participants were first
shown a set of four DVD players before being shown a DVD movie from the same store.
Participants were randomly assigned to the conditions of a 2 (product line extension: upscale vs.
downscale) x 2 (goal: browse vs. buy) factorial design. Product line extensions were manipulated by including
one DVD player in each set that was either high-priced or low-priced. In both extension conditions, three of
the four DVD players remained the same: Sony ($98.99), Samsung ($96.99), and Sylvania ($99.99). In the
upscale extension condition the fourth option was a Panasonic ($279.99) and in the downscale extension
condition the fourth option was a Coby ($34.99). In addition to a brand name and a price, all options included a
picture and a rating on a five-star scale. The three moderately priced brands were all rated 3.5 stars. The
upscale extension was rated 5 stars, and the downscale extension was rated 2 stars. The rating information was
included to discourage participants in the downscale extension condition from choosing the downscale
extension but instead to choose one of the moderately priced options. (In fact, no participants chose the
extensions—neither the high-priced Panasonic in the upscale condition, nor the low-priced Coby in the
downscale condition).
Consumer goals were manipulated by the nature of the task participants completed regarding the DVD
players. Participants in the buying goal condition were asked to select one of the four available options. In
contrast, respondents in the browsing goal condition did not make a choice but were instead asked “to take a

9
moment to consider these DVD players.” After viewing the prices of the DVD players, participants were
shown a recently released DVD priced at $16.99 and were asked to choose whether to buy the movie now or
go to nearby stores looking for a better price. The decision to defer purchase was expected to reflect the
participants’ price image of the store. If, based on the DVD player price information, they formed a high-price
image of the store, they would be more likely to defer purchase, reasoning that they would be more likely to
find a better price elsewhere (Srivastava and Lurie 2001). Participants were also asked to rate the likelihood
that they would be able to find the movie elsewhere for a lower price. A nine-point rating scale was used,
ranging from 1 = “I could definitely not find a better price” to 9 = “I could definitely find a better price.”
Results
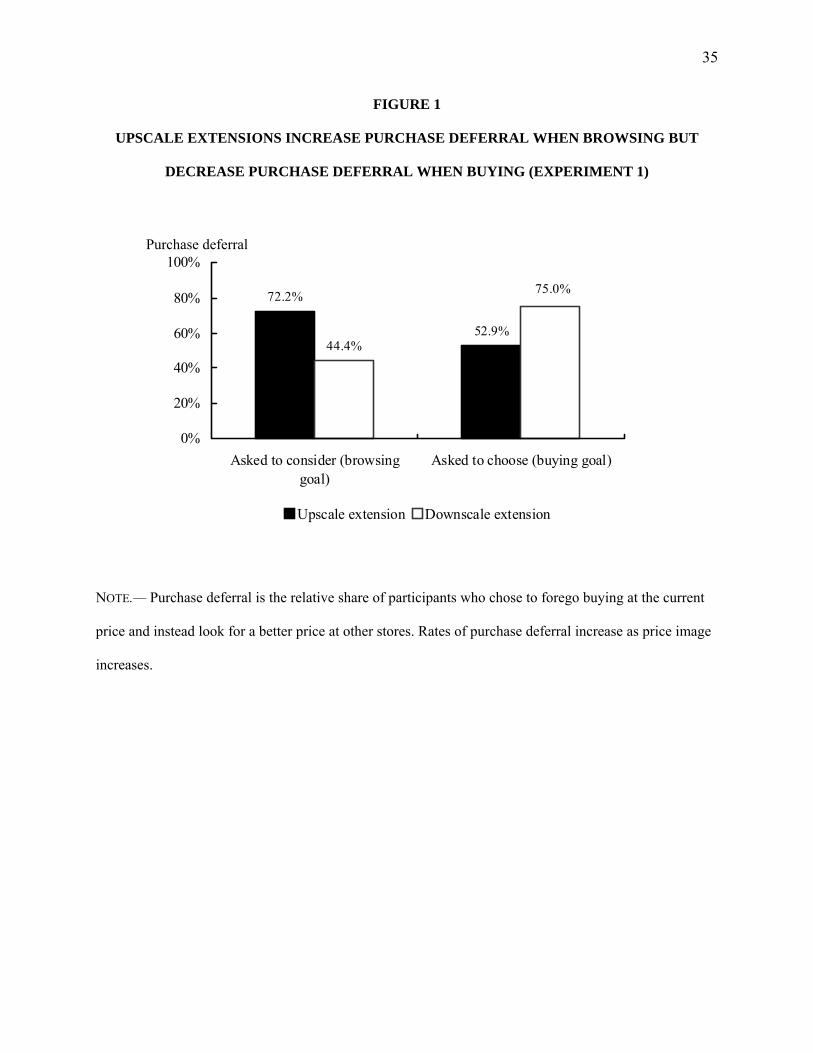
We predicted that the impact of vertical extensions on price image is moderated by consumer goals, such
that for browsing goals upscale [downscale] extensions will lead to higher [lower] price images, and for
buying goals upscale [downscale] extensions will lead to lower [higher] price images. The purchase deferral
data summarized in Figure 1 are consistent with these predictions. In particular, when the set included an
upscale extension, 72.2% (N = 18) subsequently chose to defer purchase of the movie at the given price. When
the set of DVD players included a downscale extension, only 44.4% (N = 18) of participants deferred
purchase. This pattern of purchase deferral was reversed when participants had a buying goal. Specifically,
when the set included an upscale extension, 52.9% (N = 17) deferred purchase, compared to 75.0% (N = 20)
who chose to defer when the set included a downscale option.
--------------------------------------------- Insert Figure 1 about here.
---------------------------------------------
The significance of these results was tested using a logistic regression model that predicted likelihood of
purchase deferral (i.e., buy now vs. look for a better price elsewhere) as a function of product line extensions
(upscale vs. downscale) and consumer goals (browsing vs. buying). Consistent with our predictions, the
analysis revealed a significant interaction between extension type and consumer goal (χ2(1) = 4.64, p < .05).

10
Participants’ perceptions of the likelihood of finding a better price elsewhere indicated that those with a
browsing goal expected that they would be more likely to find a better price elsewhere when the store carried
an upscale extension (M = 7.1) than when there was a downscale extension (M = 6.3). In contrast, participants
with a buying goal indicated that they would be less likely to find a better price elsewhere when the set
included an upscale extension (M = 6.4) than when it included a downscale extension (M = 7.5). This
difference in the impact of the type of vertical extension and consumer goals on the likelihood of finding
higher prices elsewhere was significant (F(1,72) = 4.35, p < .05)—a finding consistent with our predictions.
Discussion
The data furnished by Experiment 1 lend support for the hypothesis that the impact of product line
extensions on price image is moderated by consumer goals. Participants with a browsing goal who saw a set
containing an upscale extension formed a higher price image than did those who saw a set containing a
downscale extension. In contrast, for participants with a buying goal, this pattern was reversed: Those who saw
a set with an upscale extension actually formed a lower price image than those who saw a set with a downscale
extension.
Overall, Experiment 1 tested the proposed theory by examining the outcome of a purchase decision based
on price image. An alternative method of measuring price image involves asking consumers to rate the overall
price level of a store as well as their store-specific price expectations. This approach is consistent with the
notion that consumers expect prices to be higher at a store with a high-price image than at a store with a low-
price image (Thaler 1985). The following experiment employs these more direct measures of price image to
provide a convergent test of the proposed theory.
EXPERIMENT 2
The goal of Experiment 2 was to use alternative measure of price image to provide further evidence for
the proposition that the impact of product line extensions on price image is moderated by consumer goals. In
addition, this experiment examined the impact of adding product line extensions on price image rather than
just comparing scenarios in which upscale and downscale extensions were already present.
11
Method
Eighty students from a large Midwestern university were recruited to complete a web-based study on
consumer preferences. Participants were randomly assigned to the conditions of a 3 (product line extension:
upscale vs. downscale vs. no extension) x 2 (goal: browsing vs. buying) factorial design. Participants were
asked to imagine that they were shopping at a nearby store for several different types of tea. Each participant
saw either three or four brands (labeled Brand A, Brand B, etc.) in three different categories of teas: green tea,
black tea, and herbal tea. Participants in the no extension condition saw a set of three prices in each category.
For example, the three brands in the green tea category were $3.55, $3.65 and $3.75 per package. In the
vertical extension conditions, either a high-priced or a low-priced fourth brand was added to the set. Thus, for
green teas, the upscale condition consisted of four teas priced at $3.55, $3.65, $3.75, and $7.39; the downscale
condition consisted of teas priced at $3.55, $3.65, $3.75, and $1.81.
Consumer goals were manipulated by whether or not a particular option was identified as considered for
purchase. As in Experiment 1, participants in the browsing condition were simply asked to take a moment to
consider the prices of the options they were shown. Participants in the buying goal condition, on the other
hand, were told that they were strongly considering buying a particular moderately priced option in each set
(e.g., Brand B) and were asked to take a moment to consider the price of that option. For example, when
participants saw the green teas, they were told they were considering purchasing the $3.65 box of tea. This
manipulation was conceptually similar to the choice manipulation used in the first experiment but had the
advantage of allowing us to dictate which option in the set participants would buy.
After viewing the three types of teas (either 9 or 12 prices in total), participants were asked to provide a
single evaluation of the overall price level of the store. Using a slider anchored at “very low” and “very high,”
participants rated the prices at this store relative to other stores selling similar items. Based on the position of
the slider, participants’ responses were converted to a 100-point scale, ranging from 1 for “very low” to 100 for
“very high.” As a second measure of price image, participants were also asked about their price expectations at
this store. A high-price image would lead consumers to expect the price of an unobserved item to be high and
12
vice versa for a low-price image. To measure price expectations, participants were told that an 8-pack of paper
towels sells for around $10 at other nearby stores and were asked how much they thought a similar pack of
paper towels would cost at this store.
Results
We predicted that a browsing goal would lead to a higher price image of a store with upscale extensions
than that of a store with downscale extensions. In contrast, a buying goal would lead to a lower price image of
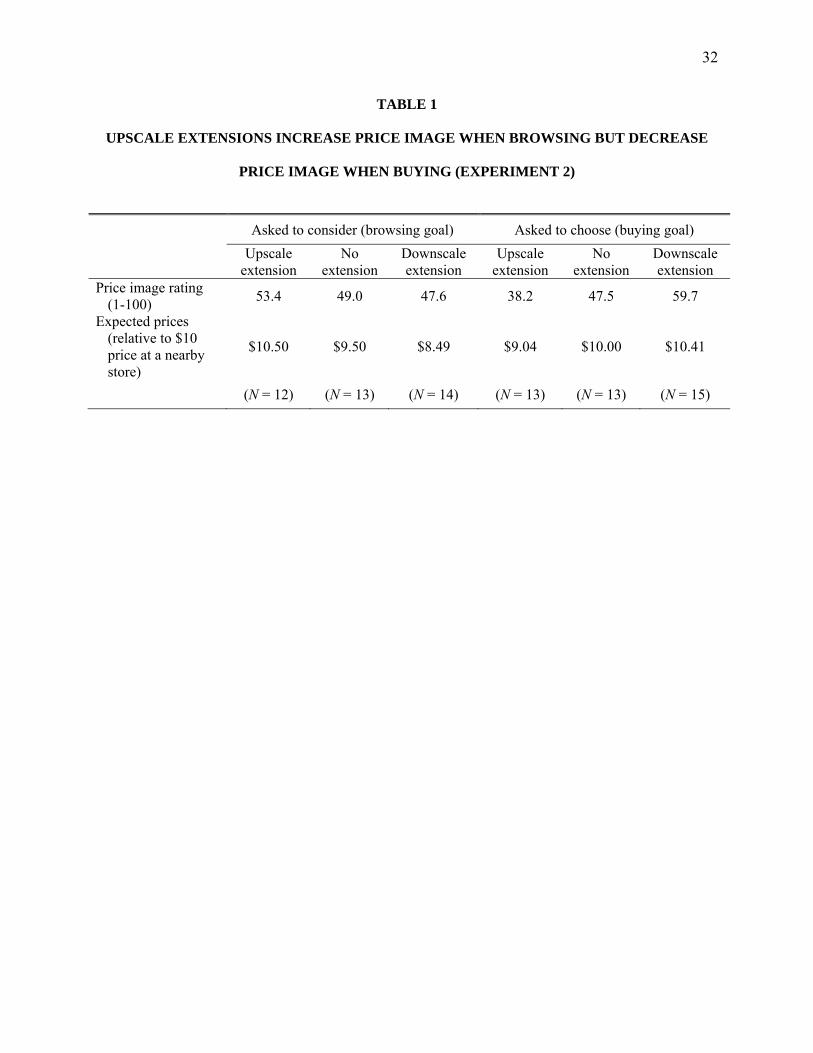
a store with upscale extensions than that of a store with downscale extensions. The results reported in Table 1
are consistent with these predictions.
--------------------------------------------- Insert Table 1 about here.
---------------------------------------------
The data show that the impact of product line extensions on price image was indeed a function of
consumer goals, as indicated by the significance of the corresponding interaction (F(2,74) = 7.31, p < .005).
Planned contrasts revealed that in the buying goal condition, an upscale product line extension was associated
with lower price image ratings than a downscale extension (38.2 vs. 59.7; F(1,74) = 18.86; p < .001). In
contrast, in the browsing goal condition, an upscale extension was associated with higher price image ratings
than a downscale extension (53.4 vs. 47.6), though the difference was not statistically significant (F(1,74) =
1.26). In both the buying and browsing conditions, the price image ratings in the no extension condition fell
between those of the upscale and downscale conditions.
The price-estimation data revealed a similar pattern. As predicted, the moderating impact of consumer
goals on how product line extension influenced price image was significant (F(2,74) = 5.20, p < .01) Planned
contrasts revealed that in the browsing goal condition, an upscale extension resulted in an increase in the
expected prices, whereas a downscale extension resulted in a decrease in the expected prices ($10.50 vs. $8.49;
F(1,74) = 7.09, p < .01). In contrast, in the buying goal condition the presence of a product line extension had
the opposite effect, leading to a marginally significant decrease in the price image in the presence of an upscale
extension and an increase in the price image in the presence of a downscale extension ($9.04 vs. $10.41;

13
F(1,74) = 3.52, p < .10). In the buying and browsing conditions, the price estimations in the no-extension
condition fell between those of the upscale and downscale conditions. These price-estimation data lend further
support to our predictions.
Discussion
The results of Experiment 2 provide further support for the proposed moderating influence of consumer
goals by examining participants’ ratings of price image, as well as their price expectations. Both of these more
proximal measures of price image were consistent in supporting the proposed theoretical account. This
experiment also compared the impact of consumer goals and vertical extensions on price image relative to a
scenario with no extensions. We found that in both the browsing and buying goal conditions, participants’
evaluations of the store with no extensions fell somewhere between their evaluations of the stores with the
upscale or downscale extensions.
Taken together, the results of the first two experiments show that, contrary to conventional wisdom,
upscale extensions can lead to lower price images and downscale extensions can lead to higher price images.
The next experiment examines the process by which a consumer converts a set of prices into a price image.
We have proposed that consumers with a browsing goal have a broad focus, integrating all the available price
information and evaluating a set with an upscale extension as more expensive than a set with a downscale
extension. In contrast, when consumers have a buying goal, they focus on one option and compare its price to
the prices of the other options in the set. This comparison process leads to a contrast effect, such that the
presence of an upscale extension makes a focal option seem less expensive than the presence of a downscale
extension. Experiment 3 provides a more direct test of this theory by examining participants’ evaluations of
prices of individual options as a function of vertical extensions and consumer goals.
EXPERIMENT 3
The goal of Experiment 3 was to examine the process by which a price image is formed based on a set of
prices. In particular, this experiment tests the proposition that consumers with a browsing goal form a price
14
image by integrating all of the available price information, whereas consumers with a buying goal form a price
image by contrasting a focal option with a vertical extension.
Method
One-hundred and twenty eight students from a large Midwestern university were recruited to participate
in an online study on consumer decision making. Participants were randomly assigned to the conditions of a 2
(product line extension: upscale vs. downscale) x 2 (goal: browsing vs. buying) mixed design, where consumer
goal was manipulated between subjects and product line extension was manipulated within subjects.
Participants visited three pairs of stores, each in a different retail category. One store in each pair carried an
upscale extension (referred to here as the upscale store) and one a downscale extension (the downscale store).
The first pair of stores sold tote bags: The upscale store sold backpacks priced at $53.60, $59.90, $65.40
and $121.80, and the downscale store sold side-bags priced at $53.60, $58.70, $66.30 and $28.30. The second
pair of stores sold office supplies: The upscale store sold fax machines priced at $91, $95 and $182, and the
downscale store sold scanners priced at $90, $95 and $37. The third pair of stores sold small appliances: The
upscale store sold blenders priced at $32.95, $35.65, $38.45, and $79.15, and the downscale store sold toasters
priced at $32.40, $36.75, $37.90 and $14.85. All participants saw the same prices across each pair of stores.
The order of the upscale and downscale stores was counterbalanced across store pairs, such that for the tote
bag stores and the office supply stores participants saw the upscale stores first, and for the small appliances
stores participants saw the downscale store first.
The consumer goal manipulation was similar to that used in Experiment 2. In the buying goal condition,
one of the moderately priced options was singled out as being strongly considered for purchase, whereas in the
browsing goal condition, participants were simply asked to consider the prices of the options. Participants were
asked to rate either the set of prices as a whole (browsing goal) or the price of the particular option selected for
purchase (buying goal). Thus, in the backpack store, participants in the browsing goal condition were asked to
rate the prices of backpacks at this store and participants in the buying goal condition were asked to rate the

15
price of Brand B, the brand they were considering buying. All ratings were made on the same nine-point scale,
anchored at 1 = “very low” and 9 = “very high.”
After participants evaluated the prices in the two stores, they were asked to choose between them for a
return purchase. When using store choice to infer price image, it is important to note that although it is
generally assumed that consumers prefer stores with a lower price image (Bell and Lattin 1998; Urbany,
Dickson, and Sawyer 2000), this will not always be the case. Sometimes, consumers are less interested in
saving money than they are in meeting some other need, such as getting the best service or the highest quality
products (Chernev 2006; Dhar and Simonson 1999). When consumers are in such a “spending mode,” they
may actually prefer a store with a high-price image to a store with a low-price image. In order to fully map the
connection between price image and store choice, in this experiment we manipulate consumers’ spending
mode (saving vs. spending).
In the saving mode condition, participants were simply asked to choose one of the stores—a manipulation
based on the notion that saving money is the likely default state for the research participants. In contrast,
participants in the spending mode condition were told that they were not buying for themselves but for their
boss, who had specifically told them that price is no object. In this context, we expected that participants in a
saving mode would choose the store with the lower price image, whereas participants in a spending mode
would choose the store with the higher price image.
Results
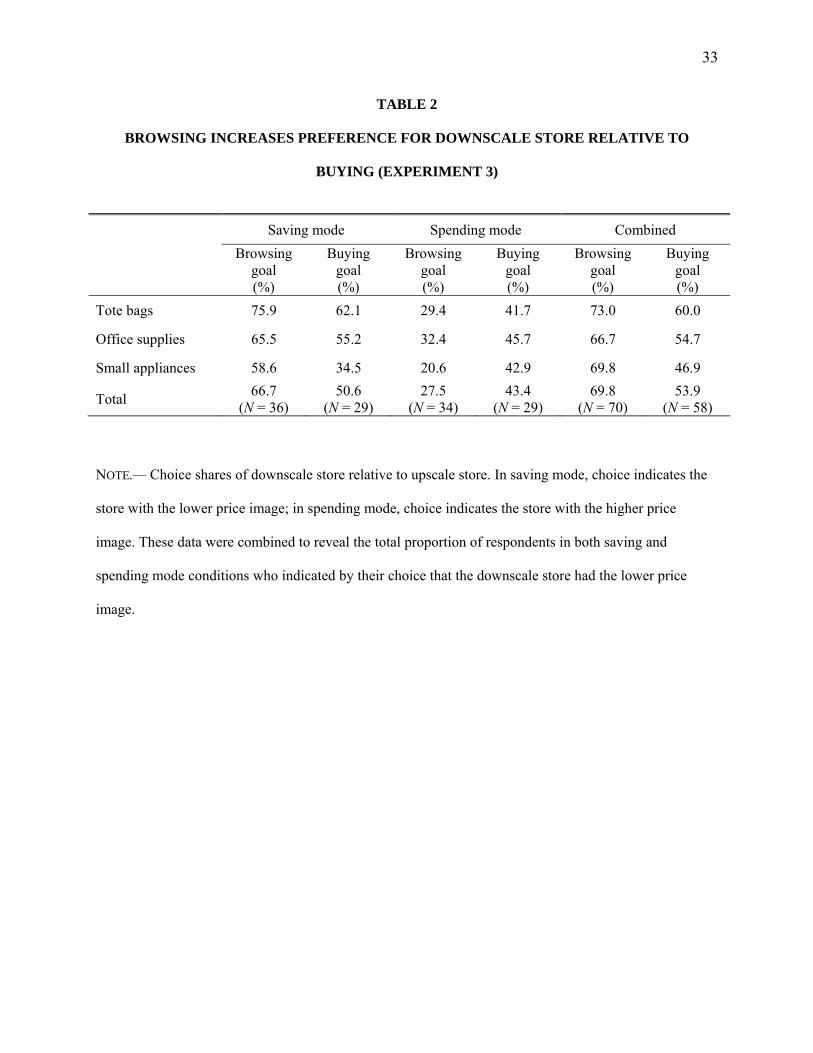
We predicted that participants with a browsing goal would be more likely to form a lower price image of
the downscale store than would participants with a buying goal. The choice data summarized in Table 2 are
consistent with these predictions. For participants in a saving mode, who chose the store they thought had a
lower price image, the preference for returning to the downscale store for additional purchases was stronger
among those with a browsing goal (66.7%) than among those with a buying goal (50.6%). As predicted, this
pattern of preferences was reversed among participants in a spending mode, who chose the store they thought

16
had a higher price image. In this condition, 43.4% of participants with a buying goal preferred the downscale
store, compared with only 27.5% of participants with a browsing goal.
--------------------------------------------- Insert Table 2 about here.
---------------------------------------------
The significance of these results was tested using a logistic regression, predicting choice of store (i.e.,
upscale store vs. downscale store) as a function of consumer goal (browsing vs. buying), spending mode (save
vs. spend), and retailer category (tote bags, office supplies, and small appliances). Consistent with our
experimental predictions, the analysis revealed a significant interaction between goal and spending mode (χ2(1)
= 10.45, p < .005): In a saving mode, participants with a browsing goal were more likely to choose the
downscale store than participants with a buying goal (χ2(1) = 4.68, p < .05). In contrast, in a spending mode,
participants with a browsing goal were less likely to choose the downscale store than participants with a
buying goal (χ2(1) = 5.85, p < .05). The analysis revealed no significant interactions between retailer category
and the other experimental factors (all p’s > .35), suggesting that the reported effects were consistent across the
different types of stores.
This experiment also examined how participants evaluated the price information, providing insight into
the process by which participants formed a price image. In particular, we expected that participants in the
browsing goal condition, who were asked to rate the set of prices as a whole, would evaluate the set as having
higher prices when there was an upscale extension than when there was a downscale extension. Participants in
the buying goal condition, on the other hand, who were asked to evaluate the price of a focal option, were
expected to evaluate the focal option as having a higher price in the presence of a downscale option than in the
presence of an upscale option.
The price ratings data are consistent with these predictions. Ratings data were analyzed using separate 2
vertical extension (upscale store vs. downscale store) x 2 spending mode (save vs. spend) x 3 retailer category
(tote bags, office supplies, and small appliances) ANOVAs in each goal condition, with spending mode as a
between-subjects factor and vertical extension and retailer category as within-subjects factors. In the browsing
17
goal condition, participants exhibited integration when evaluating the set of available prices, such that when
the set included an upscale extension the rating was higher (M = 6.0) than when the set included a downscale
extension (M = 4.6; F(1,316) = 105.9, p < .001). Participants in the buying goal condition, on the other hand,
revealed a contrast effect when evaluating the single option considered for purchase: When the set included an
upscale extension the item was rated as less expensive (M = 4.5) than when the set included a downscale
extension (M = 6.5; F(1,327) = 204.8, p < .001).
Discussion
The results of this experiment offer insight into the process by which consumers convert price
information into price images. Specifically, these findings lend support to the proposed account by
demonstrating that price images formed were consistent with the integration of price evaluations when
participants had a browsing goal. When participants had a buying goal, on the other hand, the price images
were consistent with a contrast effect driven by comparing the focal option with the rest of the set.
In the experiments reported so far, the focal option has always been one of the moderately priced options
in the set, instead of the vertical extension. The theoretical account we proposed implies that if an extension is
focal (instead of a moderately priced option), the previously observed contrast effect should be reversed. In
other words, if a consumer focuses on a vertical extension, the evaluation of the extension relative to the
moderately priced options will drive the price image. Since the evaluation of an upscale extension is likely to
be high and the evaluation of a downscale extension is likely to be low, the result will be a directionally
consistent shift in price image, rather than the contrast effect found in the previous studies. Thus, focusing on
an upscale option will lead to a higher price image, whereas focusing on a downscale option will lead to a
lower price image.
In the following experiment, we test this boundary condition on the previously observed contrast effect by
directly manipulating which option or options are focal. When consumers have a broad focus, they tend to
incorporate more of the available price information into their impressions, resulting in a directionally
consistent impact of vertical extensions on price image (i.e., upscale extension leads to a higher price image).
18
With a narrow focus, the price image they form will depend on which option is focal. When consumers focus
on one of the moderately priced options, the result is a contrast effect (i.e., upscale extension leads to a lower
price image). When consumers focus on a vertical extension, on the other hand, the price image is consistent
with the direction of the extension (i.e., an upscale extension leads to a higher price image).
EXPERIMENT 4
The goal of Experiment 4 was to test attentional focus as a driver of the impact of vertical extensions on
price image. In particular, this experiment manipulated participants’ focus directly instead of indirectly through
consumer browsing and buying goals. This experiment also examined a boundary condition of the proposed
effect, by testing whether the observed contrast effect is reversed when consumers focus on the vertical
extension rather than on a moderately priced item.
Method
One-hundred and eight students from a large Midwestern university were recruited to participate in an
online study on consumer decision making. Participants were randomly assigned to the conditions of a 2
(product line extension: upscale vs. downscale) x 3 (focus: broad focus vs. narrow focus on a moderate option
vs. narrow focus on the extension) mixed design, where focus was manipulated between subjects and product
line extension was manipulated within subjects. Participants visited two hardware stores, where they saw the
prices of three or four items in each of four product categories: bolt cutters, hand saws, faucets, and staple guns
(14 prices in total). One store was an upscale store (i.e., it included upscale extensions), while the other was a
downscale store (i.e., it included downscale extensions). The order was counterbalanced such that some
participants visited the upscale store first and some participants visited the downscale store first.
The option(s) on which participants focused was manipulated by changing the visual arrangement of the
price information. In the broad focus condition, participants saw displays in which all options were the same
size and no option was especially prominent. In the two narrow focus conditions, participants saw displays in
which one of the options was much larger than the others and was marked as a “featured item.” Across
conditions, the featured item was either one of the moderately priced options or the vertical extension. This
19
manipulation is based on previous research suggesting that making one option perceptually salient could
activate a narrow focus by drawing attention to a particular item (Hamilton, Hong, and Chernev 2007; see also
Pieters and Wedel 2004; Rosbergen, Pieters, and Wedel 1997). After participants saw all four product
categories, first at one store then at the other, they were asked to select the store they expected to have the
lower prices on other, unobserved items.
Results
We predicted that a broad focus would lead to a larger choice share for the downscale store than would a
narrow focus on moderately priced items. We also predicted that a narrow focus on moderately priced items
would lead to a smaller choice share of the downscale store than a narrow focus on vertical extensions. The
store choice data are consistent with these predictions. In the broad focus condition, in which none of the
options was perceptually focal, 87.2% of participants chose the downscale store. In the two narrow-focus
conditions, price image depended on which option was perceptually focal. When one of the moderately priced
options in each set was focal, only 73.3% of participants chose the downscale store. When the vertical
extension was perceptually focal, 88.2% of participants chose the downscale store.
A one-tailed logistic regression analysis revealed that choice of store is indeed a function of the focus
condition (χ2(2) = 5.1, p < .05). In particular, participants were less likely to choose the downscale store when
they had a narrow focus on a moderate option than when they had a broad focus (χ2(1) = 3.0, p < .05). In the
two narrow-focus conditions, participants were more likely to choose the downscale store when one of the
moderately priced options was focal than when the extension option was focal at both stores (χ2(1) = 3.7, p <
.05).
Discussion
This experiment provides support for the notion that broad or narrow focus drives the impact of consumer
goals on price-image formation. The data show that when participants had a broad focus, they formed price
images that were directionally consistent with the vertical extension, as found in the previous experiments.
When participants were focused on one of the moderately priced options, they formed price images that were
20
directionally opposite to the vertical extension (i.e., a contrast effect). This experiment also provides insight
into a boundary condition of the proposed impact of vertical extensions and consumer goals on price-image
formation by showing that this contrast effect is reversed when consumers focus on the vertical extension
rather than on a moderately priced item. Further, by manipulating focus directly through perceptual salience
rather than indirectly through consumer goals, this experiment provides additional support for the role of
attentional focus in driving the integration and contrast effects proposed in the theoretical account.
In this study we manipulated consumer focus through perceptual salience of price information. An
alternative method for examining the role of focus in moderating the observed contrast effect is to measure
which option consumers focus on, rather than manipulating it. In particular, when consumers with a buying
goal select an item from a set, they are likely to focus on the chosen item when forming a price image.
According to the theory proposed in this research, consumers who choose very few vertical extensions (opting
instead for moderately priced options) are likely to exhibit a stronger contrast effect than those who choose
more vertical extensions. In other words, consumers who choose the fewest vertical extensions during a
shopping trip are the most likely to form a high price image of a downscale store and a low price image of an
upscale store. Experiment 5 tests this prediction by examining whether participants with a buying goal choose
extensions or moderately priced options when forming a price image.
EXPERIMENT 5
The goal of this experiment was to test the proposition that when consumers have a buying goal, the
impact of product line extensions on price image is a function of which option consumers contrast with the rest
of the set. In particular, we examine how price image is influenced by whether participants with a buying goal
choose a moderately priced option or a vertical extension.
Method
Ninety-five students from a large Midwestern university participated in an experiment on consumer
preferences in exchange for course credit. Participants were randomly assigned to the conditions of a 2
(product line extension: upscale vs. downscale) x 2 (goal: browsing vs. buying) mixed design, where consumer

21
goal was manipulated between subjects and product line extension was manipulated within subjects.
Participants shopped in two virtual grocery stores for a list of the same nine items: laundry detergent, canned
tuna, maple syrup, ketchup, apple juice, frozen pizza, pasta sauce, rice, and cat food. For each category on the
shopping list, participants were shown pictures of three, four, or five branded packages, arranged as if they
were on store shelves with the price displayed prominently below each item (36 prices in total).
The first store participants saw was an upscale store (i.e., it included upscale extensions), and the second
was a downscale store (i.e., it included downscale extensions). To illustrate, in the pasta sauce category, the
upscale store had the following assortment: Barilla ($3.59), Prego ($3.36), Ragu ($3.42), and Isola ($7.12).
The downscale store carried the first three brands at the same prices, but replaced the upscale extension with a
downscale extension, Hunt’s ($1.39).
The consumer goal manipulation was a choice/no choice task similar to that in Experiment 1. Participants
in the buying goal condition were asked to select the option they would buy in each of the nine categories in
each store. In contrast, participants in the browsing goal condition did not make a choice, but were instead
asked to take a moment to consider the prices before moving on to the next category. After participants had
shopped for each of the nine items, first at one store then at the other, they were asked to select the store they
expected to have the lower prices on items for which they had not yet seen prices.
Results
The store choice data are consistent with the findings of the previous experiments. Among participants
with a browsing goal, 79.3% (N = 29) chose the downscale store, compared with only 48.5% (N = 66) of
participants with a buying goal (χ2(1) = 7.28, p < .01). These results support the hypothesis that the impact of
vertical extensions on price image is moderated by consumer browsing and buying goals.
This experiment also allowed for a test of the proposition that the contrast effect observed in the buying-
goal condition depends on which options command the focus of consumers’ attention. In particular, we
predicted that participants who chose fewer vertical extensions would form lower price images of the upscale
store than participants who chose more vertical extensions. We examined the 18 choices these participants
22
made (one choice in each category X nine categories X two stores) and divided them into five groups based on
how frequently they chose a vertical extension. These groups consisted of 1) those who never chose a vertical
extension; 2) those who chose only one extension; and those who chose 3) two extensions, 4) three or four
extensions, and 5) five or more extensions.
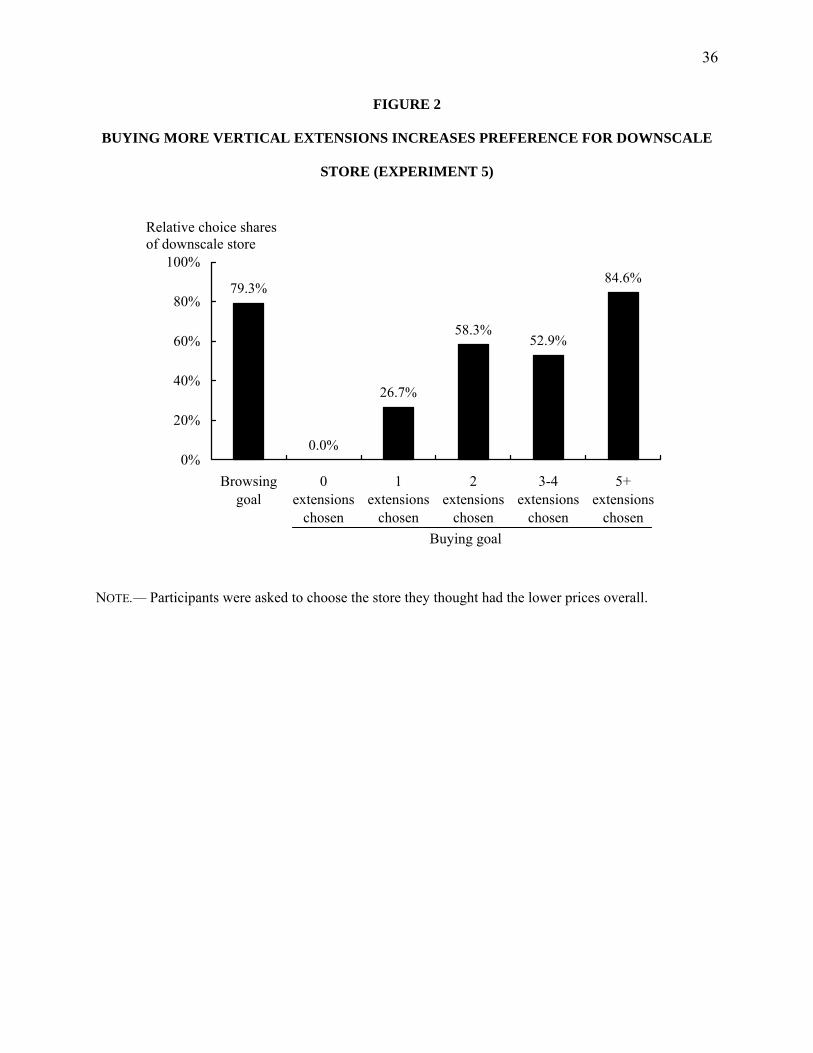
The store choice data summarized in Figure 2 show that choice of the downscale store generally
increased as participants chose more vertical extensions. Specifically, among the participants who included no
vertical extensions in any of their 18 choices, not a single participant chose the downscale store. Consistent
with predictions, the percentage of participants indicating that the downscale store had a lower price image
increased as the number of extensions chosen increased.
--------------------------------------------- Insert Figure 2 about here.
---------------------------------------------
The significance of these choice data was tested using a logistic regression predicting choice of store
(upscale store vs. downscale store) as a function of the number of vertical extensions chosen (0 vs. 1 vs. 2 vs.
3-4 vs. 5+). Consistent with our hypotheses, the results reveal that the frequency of focusing on an extension
option is a significant predictor of store choice (χ2(1) = 13.48, p < .001). As might be expected from a student
population, the majority of the vertical extensions chosen were downscale extensions. The pattern of choices
was similar and still significant when choice data was predicted by just the number of downscale items
selected instead of using both upscale and downscale extensions.
Discussion
The results of this experiment show that the contrast effect previously observed when consumers have a
buying goal is reversed when consumers choose vertical extensions instead of moderately priced options. The
results show that as participants select fewer vertical extensions, they are less likely to form a low price image
of a store that includes low-priced options. Testifying to the strength of the observed contrast effect, every
single participant who never chose a vertical extension indicated that the store with upscale extensions was
actually lower priced than the store with downscale extensions.

23
This experiment, as well as Experiments 3 and 4, used store choice as a measure of price image. Choice
among retailers is an especially important dependent variable for several reasons. One of the primary reasons
retailers are concerned about managing their price image is its anticipated effects on store choice (A. T.
Kearney 2005; Urbany, Dickson, and Sawyer 2000; van Heerde, Gijsbrechts, and Pauwels 2008). In addition,
choice among retailers has been demonstrated by previous research to be a reliable measure of price image
(Alba et al. 1994; Bell and Lattin 1998). Furthermore, choice among retailers provides a robust test of the
proposed theory because it asks participants to make a relative price-image judgment between two stores for
which they have been given equivalent information. The results across these three store-choice experiments are
consistent in supporting the experimental hypothesis.
GENERAL DISCUSSION
A common strategy for retailers trying to manage their price image is to add a few very low-priced
options when they want to convey a low-price image and a few very high-priced options when they want to
appear more upscale (A. T. Kearney 2005; Barbaro 2006; Sun 2008). Despite the intuitive appeal of this
strategy, the research presented in this article suggests that this strategy may be effective only some of the time,
and may, on occasion, backfire. We show that the impact of vertical extensions on price image is moderated by
consumer goals. In particular, when consumers have a browsing goal, the result is a consistent shift in price
image, such that upscale extensions lead to higher price images and downscale extensions lead to lower price
images. When consumers have a buying goal, however, the result can be reversed, such that upscale extensions
lead to lower price images and vice versa.
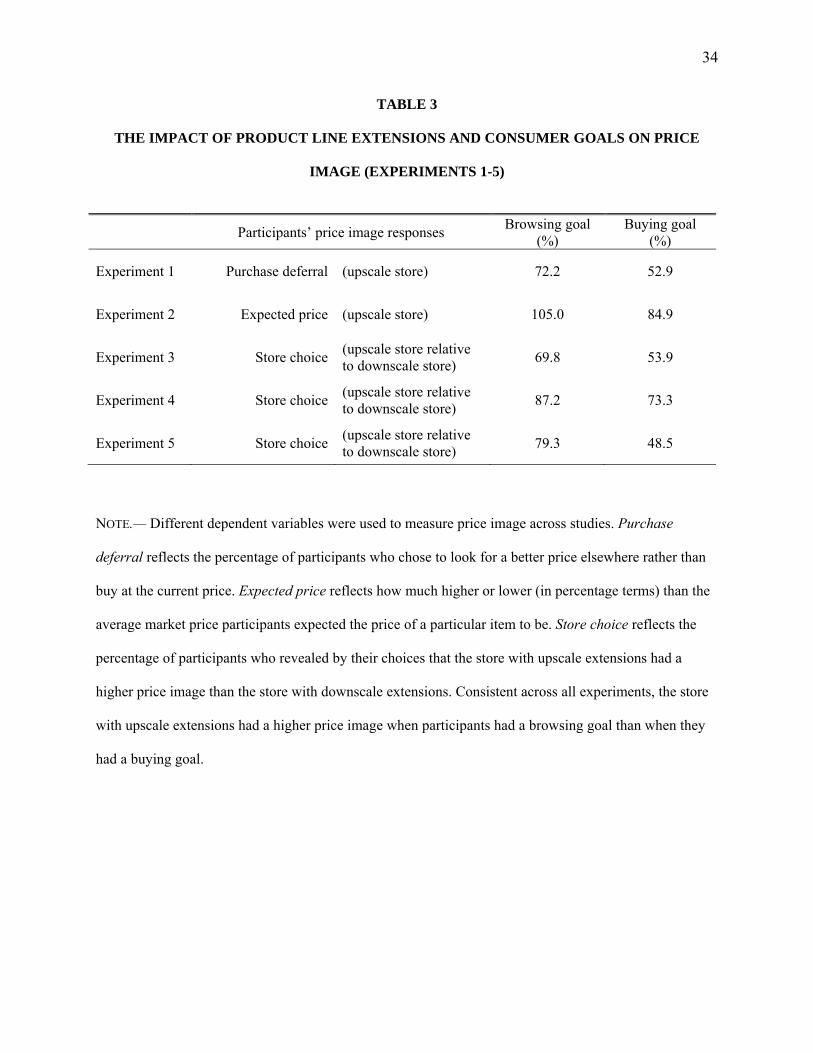
The research in this article offers convergent evidence for the role of consumer goals in moderating the
impact of vertical extensions on price image by using multiple dependent variables to measure price image.
Across experiments, price image was measured using purchase deferral (Experiment 1), ratings (Experiment
2), price expectations (Experiment 2), and store choice (Experiments 3-5). These divergent dependent
measures were consistent in supporting the proposed theoretical predictions (see Table 3). The findings were
24
also reliable across a variety of retail contexts (electronics, small appliances, office supplies, home
improvement, grocery, etc.) and price ranges.
--------------------------------------------- Insert Table 3 about here.
---------------------------------------------
Theoretical Contributions
The influence of goals on consumer behavior has become an important topic for marketing researchers.
Previous research has investigated various specific consumer goals as drivers of preference formation and
choice (e.g., Lee and Ariely 2006; Markman and Brendl 2000). However, the role of the common consumer
goals of browsing and buying in judgment and decision making has received relatively little attention. This
research contributes to the literature on consumer goals by showing that browsing and buying goals lead to
differences in the way consumers allocate attention when forming impressions. In particular, we find that a
browsing goal leads consumers to be less focused, allocate attention more broadly, and be more likely to make
judgments (Johnson and Russo 1984). A buying goal, on the other hand, leads consumers to be more focused,
to concentrate on fewer options, and be more likely to make choices (Bettman, Luce, and Payne 1998; Johnson
and Russo 1984).
This research also contributes to our understanding of price image formation by demonstrating the
importance of context in investigating how consumers form price images. Previous research into the impact of
prices on price image has focused on how consumers form a price image using individual prices within a
category, examining price-image formation by stripping out the context in which prices are typically evaluated
in a real-world setting (e.g., the prices of the rest of the offerings in a product category). In contrast to previous
research, we examined the distribution of prices within a category (as opposed to just the price of a single
chosen item) as a driver of price image. In this context, we show the influence of vertical extensions on price
image—both when the extension is chosen by the consumer and when the extension simply forms a part of the
context in which prices are evaluated.
25
This research also contributes to work done in the area of price perception by demonstrating when and
how price perceptions can influence price-image formation. In particular, previous research has shown that the
local context can have a powerful impact on how consumers perceive prices. For example, the range of prices
in the consideration set can influence price perception, such that when the range extends above [below] a focal
item’s price, that price seems less [more] expensive (Adaval and Monroe 2002; Janiszewski and Lichtenstein
1999). This work builds on these findings by showing that when consumers have a buying goal, these
reference point effects can spill over from individual price perceptions to price-image formation. The current
research also shows, however, that when consumers have a browsing goal, these range and reference point
effects are reversed, and consumers instead tend to integrate the available price information into an overall
impression.
Managerial Implications
The research presented in this paper offers important insights for retailers seeking to manage their price
image through vertical extensions. As we have shown, the influence of vertical extensions on price image is a
function of consumers’ browsing and buying goals. Based on our findings, we propose that retailers should
anticipate or influence consumers’ goal states when designing a price image strategy built on vertical
extensions. Specifically, for any given category retailers may be able to anticipate whether consumers are
likely to focus narrowly on just a few options or broadly on many options when evaluating prices. Further,
when consumers have a narrow focus, retailers may also be able to anticipate or influence which option is
focal.
One basic observation is that consumers are more likely to browse in some categories than in others. To
illustrate, for some big-ticket items such as durable goods, consumers are especially likely to engage in
extensive browsing before buying (Claxton, Fry, and Portis 1974). Likewise, the placement of some categories
in the store makes consumers likely to browse more frequently than they buy. For example, many retailers
place flashy, attention-grabbing categories, such as televisions, in high-traffic areas of the store. This
placement encourages shoppers to stop and peruse the selection, even if they purchase from these categories

26
relatively infrequently. The research in this article suggests that in categories such as these, where consumers
are relatively more likely to have a browsing goal, a retailer seeking to lower its price image should consider
extending its assortments with low-priced options.
By the same logic, there are other categories such as food staples like milk and eggs in which consumers
are more likely to have a buying goal than a browsing goal, making them more likely to focus narrowly on the
options they purchase. Categories in which brand loyalty is especially high may also be more strongly
associated with a buying goal than a browsing goal. Thus, if consumers already have a very clear preference
for a particular brand, there will be less need for them to search the available offerings—in other words, more
likely to evince a buying goal than a browsing goal. The research in this article suggests that in categories such
as these, where consumers are relatively likely to have a buying goal, a retailer seeking to lower its price image
should consider extending their assortments with high-priced options.
In addition to anticipating consumer goals, this research suggests that retailers may also be able to
influence price image by changing a consumer’s focus. The visual manipulation used in Experiment 4 is very
similar to tactics used by retailers in the store (e.g., shelf-talkers, end-cap displays), catalogues, and websites
that draw attention to particular items. Strategically encouraging consumers to focus on particular prices may
also allow retailers to better manage their price images.
Limitations and Directions for Future Research
This research has several limitations which are important to remember when generalizing the results.
First, this study used a student sample, making hypothetical choices from hypothetical retailers. Future
research could seek to replicate these findings in real-world settings. Field studies conducted in a retail
environment are an especially promising way to test the theory proposed in this article. In general, by
anticipating or influencing consumers’ breadth of focus in a particular category, a retailer may be able to
customize its vertical extension strategy to best manage its price image. This prediction could be tested by
retailers who systematically extend categories based on consumers’ likely browsing or buying states. Thus, a
27
retailer wishing to lower its price image could add downscale extensions in browsing-likely categories and
upscale extensions in buying-likely categories and examine the resulting impact on price image.
Another promising area for future research is to extend the findings of retailer price image research into
the domain of other types of brands. This research concentrated on the price image of retailers, but our findings
also may be applied to the broader notion of brand image (Gardner and Levy 1955; Keller 1998), since any
entity with a brand image will also have a price image. Manufacturer brands can have high-price images (e.g.,
Rolex watches, Evian water, Bose sound systems) or low-price images (e.g., Bic pens, Keds sneakers, Shasta
beverages), independent of the specific retailers through which they are sold. It has become common for
manufacturers to vertically extend brand lines, both upscale (e.g., Levi’s has launched a Vintage Clothing line
that carries 501 jeans priced at more than $500) and downscale (e.g., the Porsche Boxster was introduced at
almost half the price of a 911). The findings reported in this research make specific predictions about the
impact of these vertical extensions on the price image of manufacturer brands, depending on whether
consumers focus on the brand’s entire product line or on one offering in particular.

28
REFERENCES
A. T. Kearney, Inc. (2005), "'No Insult' Pricing and Promotions." Chicago, IL: A. T. Kearney, Inc.
Adaval, Rashmi and Kent B. Monroe (2002), "Automatic Construction and Use of Contextual Information for
Product and Price Evaluations," Journal of Consumer Research, 28 (March), 572.
Alba, Joseph W., Susan M. Broniarczyk, Terence A. Shimp, and Joel E. Urbany (1994), "The Influence of
Prior Beliefs, Frequency Cues, and Magnitude Cues on Consumers' Perceptions of Comparative Price
Data," Journal of Consumer Research, 21 (September), 219-35.
Alba, Joseph W., Carl F. Mela, Terence A. Shimp, and Joel E. Urbany (1999), "The Effect of Discount
Frequency and Depth on Consumer Price Judgments," Journal of Consumer Research, 26
(September), 99-114.
Anderson, Norman H. (1965), "Averaging Versus Adding as a Stimulus-Combination Rule in Impression
Formation," Journal of Experimental Psychology, 70 (4), 394-400.
Barbaro, Michael (2006), "Whole Foods Talks Dollars and Cents," in The New York Times. New York City.
Bell, David R. and James M. Lattin (1998), "Shopping Behavior and Consumer Preference for Store Price
Format: Why 'Large Basket' Shoppers Prefer Edlp," Marketing Science, 17 (March), 66-88.
Berry, Leonard L. (1969), "The Components of Department Store Image: A Theoretical and Empirical
Analysis," Journal of Retailing, 45 (Spring), 3-20.
Bettman, James R., Mary Frances Luce, and John W. Payne (1998), "Constructive Consumer Choice
Processes," Journal of Consumer Research, 25 (December), 187-217.
Boatwright, Peter and Joseph C. Nunes (2001), "Reducing Assortment: An Attribute-Based Approach,"
Journal of Marketing, 65 (July), 50-63.
Brown, Francis E. (1969), "Price Image Versus Price Reality," Journal of Marketing Research, 6 (May), 185-
91.
Brown, Tom J. and Peter A. Dacin (1997), "The Company and the Product: Corporate Associations and
Consumer Product Responses," Journal of Marketing, 61 (January), 68-84.
Buyukkurt, B. Kemal (1986), "Integration of Serially Sampled Price Information: Modeling and Some
Findings," Journal of Consumer Research, 13 (December), 357-73.
Buyukkurt, B. Kemal and Meral D. Buyukkurt (1986), "Perceived Correlates of Store Price Image: An
Application of the Bootstrap," in Advances in Consumer Research Vol. 13.
Carmon, Ziv, Klaus Wertenbroch, and Marcel Zeelenberg (2003), "Option Attachment: When Deliberating
Makes Choosing Feel Like Losing," Journal of Consumer Research, 30 (June), 15-29.
Chernev, Alexander (2006), "Differentiation and Parity in Assortment Pricing," Journal of Consumer
Research, 33 (September), 199-210.
29
Claxton, John D., Joseph N. Fry, and Beanard Portis (1974), "A Taxonomy of Prepurchase Information
Gathering Patterns," Journal of Consumer Research, 1 (December), 35-42.
Dhar, Ravi and Itamar Simonson (1992), "The Effect of the Focus of Comparison on Consumer Preferences,"
Journal of Marketing Research, 29 (November), 430-40.
_______ (1999), "Making Complementary Choices in Consumption Episodes: Highlighting Versus
Balancing," Journal of Marketing Research, 36 (February), 29-44.
Draganska, Michaela and Dipak C. Jain (2005), "Product-Line Length as a Competitive Tool," Journal of
Economics & Management Strategy, 14 (March), 1-28.
Fiske, Susan T. (1980), "Attention and Weight in Person Perception: The Impact of Negative and Extreme
Behavior," Journal of Personality and Social Psychology, 38, 889-906.
Gardner, Burleigh B. and Sidney J. Levy (1955), "The Product and the Brand," Harvard Business Review, 33
(March/April), 33-39.
Hamilton, Ryan, Jiewen Hong, and Alexander Chernev (2007), "Perceptual Focus Effects in Choice," Journal
of Consumer Research (August).
Horsky, Dan and Paul Nelson (1992), "New Brand Positioning and Pricing in an Oligopolistic Market,"
Marketing Science, 11 (Spring), 133-53.
Janiszewski, Chris and Donald R. Lichtenstein (1999), "A Range Theory Account of Price Perception,"
Journal of Consumer Research, 25 (March), 353-69.
Johnson, Eric J. and J. Edward Russo (1984), "Product Familiarity and Learning New Information," Journal of
Consumer Research, 11 (June), 542-50.
Keller, Kevin Lane (1998), Strategic Brand Management : Building, Measuring and Managing Brand Equity.
Upper Saddle River N J: Prentice Hall.
Krishna, Aradhna, Mary Wagner, Carolyn Yoon, and Rashmi Adaval (2006), "Effects of Extreme-Priced
Products on Consumer Reservation Prices," Journal of Consumer Psychology, 16 (2), 176-90.
Lee, Leonard and Dan Ariely (2006), "Shopping Goals, Goal Concreteness, and Conditional Promotions,"
Journal of Consumer Research, 33 (June), 60-70.
Levin, Irwin P. (1974), "Averaging Processes in Ratings and Choices Based on Numerical Information,"
Memory & Cognition, 2, 786-90.
Mackenzie, Scott B. (1986), "The Role of Attention in Mediating the Effect of Advertising on Attribute
Importance," Journal of Consumer Research, 13 (September), 174-95.
Markman, Arthur B. and C. Miguel Brendl (2000), "The Influence of Goals on Value and Choice," The
Psychology of Learning and Motivation, 39, 97-128.

30
Martin, Leonard L., John J. Seta, and Rick A. Crelia (1990), "Assimilation and Contrast as a Function of
People's Willingness and Ability to Expend Effort in Forming an Impression," Journal of Personality
and Social Psychology, 59, 27-37.
Martineau, Pierre (1958), "The Personality of the Retail Store," Harvard Business Review, 36
(January/February), 47-55.
Mazumdar, Tridib and Kent B. Monroe (1990), "The Effects of Buyers' Intentions to Learn Price Information
on Price Encoding," Journal of Retailing, 66 (Spring), 15-32.
Moe, Wendy W. (2003), "Buying, Searching, or Browsing: Differentiating between Online Shoppers Using in-
Store Navigational Clickstream," Journal of Consumer Psychology, 13, 29-39.
Monroe, Kent B. (1973), "Buyers' Subjective Perceptions of Price," Journal of Marketing Research, 10
(February), 70-80.
Myers, Robert H. (1960), "Shaping Your Store Image," Journal of Retailing, 36 (Fall), 129-37.
Pieters, Rik and Michel Wedel (2004), "Attention Capture and Transfer in Advertising: Brand, Pictorial, and
Text-Size Effects," Journal of Marketing, 68 (April), 36-50.
Putsis, Jr., William P. and Narasimhan Srinivasan (1994), "Buying or Just Browsing? The Duration of
Purchase Deliberation," Journal of Marketing Research, 31 (August), 393-402.
Rosbergen, Edward, Rik Pieters, and Michel Wedel (1997), "Visual Attention to Advertising: A Segment-
Level Analysis," Journal of Consumer Research, 24 (December), 305-14.
Schmalensee, Richard (1978), "Entry Deterrence in the Ready-to-Eat Breakfast Cereal Industry," Bell Journal
of Economics, 9 (Autumn), 305-27.
Simester, Duncan (1995), "Signalling Price Image Using Advertised Prices," Marketing Science, 14, 166-88.
Simonson, Itamar and Amos Tversky (1992), "Choice in Context: Tradeoff Contrast and Extremeness
Aversion," Journal of Marketing Research, 29 (August), 281-95.
Singh, Vishal, Karsten Hansen, and Robert Blattberg (2006), "Market Entry and Consumer Behavior: An
Investigation of a Wal-Mart Supercenter," Marketing Science, 25 (September-October), 457-76.
Srivastava, Joydeep and Nicholas Lurie (2001), "A Consumer Perspective on Price-Matching Refund Policies:
Effect on Price Perceptions and Search Behavior," Journal of Consumer Research, 28 (September),
296-307.
Srivastava, Joydeep and Nicholas H. Lurie (2004), "Price-Matching Guarantees as Signals of Low Store Prices:
Survey and Experimental Evidence," Journal of Retailing, 80 (Summer), 117-28.
Sun, The (2008), "Cheeseburger to Cost Beefy ₤85." London.
Thaler, Richard (1985), "Mental Accounting and Consumer Choice," Marketing Science, 4 (3), 199-214.
Troutman, C. Michael and James Shanteau (1976), "Do Consumers Evaluate Products by Adding or
Averaging Attribute Information?," The Journal of Consumer Research, 3, 101-06.
31
Urbany, Joel E., Peter R. Dickson, and William L. Wilkie (1989), "Buyer Uncertainty and Information
Search," Journal of Consumer Research, 16 (September), 208-15.
Urbany, Joel F., Peter R. Dickson, and Alan G. Sawyer (2000), "Insights into Cross- and within-Store Price
Search: Retailer Estimates Vs. Consumer Self-Reports," Journal of Retailing, 76 (Summer), 243.
van Heerde, Harald J., Els Gijsbrechts, and Koen Pauwels (2008), "Winners and Losers in a Major Price War,"
Journal of Marketing Research, 45, 499-518.
Wyer, Robert S., Jr. and Stanley F. Watson (1969), "Context Effects in Impression Formation," Journal of
Personality and Social Psychology, 12, 22-33.
32
TABLE 1
UPSCALE EXTENSIONS INCREASE PRICE IMAGE WHEN BROWSING BUT DECREASE
PRICE IMAGE WHEN BUYING (EXPERIMENT 2)
Asked to consider (browsing goal) Asked to choose (buying goal)
Upscale extension
No extension
Downscale extension
Upscale extension
No extension
Downscale extension
Price image rating (1-100) 53.4 49.0 47.6 38.2 47.5 59.7
Expected prices (relative to $10 price at a nearby store)
$10.50 $9.50 $8.49 $9.04 $10.00 $10.41
(N = 12) (N = 13) (N = 14) (N = 13) (N = 13) (N = 15)
33
TABLE 2
BROWSING INCREASES PREFERENCE FOR DOWNSCALE STORE RELATIVE TO
BUYING (EXPERIMENT 3)
Saving mode Spending mode Combined
Browsing
goal (%)
Buying goal (%)
Browsing goal (%)
Buying goal (%)
Browsing goal (%)
Buying goal (%)
Tote bags 75.9 62.1 29.4 41.7 73.0 60.0
Office supplies 65.5 55.2 32.4 45.7 66.7 54.7
Small appliances 58.6 34.5 20.6 42.9 69.8 46.9
Total 66.7 (N = 36)
50.6 (N = 29)
27.5 (N = 34)
43.4 (N = 29)
69.8 (N = 70)
53.9 (N = 58)
NOTE.— Choice shares of downscale store relative to upscale store. In saving mode, choice indicates the
store with the lower price image; in spending mode, choice indicates the store with the higher price
image. These data were combined to reveal the total proportion of respondents in both saving and
spending mode conditions who indicated by their choice that the downscale store had the lower price
image.
34
TABLE 3
THE IMPACT OF PRODUCT LINE EXTENSIONS AND CONSUMER GOALS ON PRICE
IMAGE (EXPERIMENTS 1-5)
Participants’ price image responses Browsing goal (%)
Buying goal (%)
Experiment 1 Purchase deferral (upscale store) 72.2 52.9
Experiment 2 Expected price (upscale store) 105.0 84.9
Experiment 3 Store choice (upscale store relative to downscale store) 69.8 53.9
Experiment 4 Store choice (upscale store relative to downscale store) 87.2 73.3
Experiment 5 Store choice (upscale store relative to downscale store) 79.3 48.5
NOTE.— Different dependent variables were used to measure price image across studies. Purchase
deferral reflects the percentage of participants who chose to look for a better price elsewhere rather than
buy at the current price. Expected price reflects how much higher or lower (in percentage terms) than the
average market price participants expected the price of a particular item to be. Store choice reflects the
percentage of participants who revealed by their choices that the store with upscale extensions had a
higher price image than the store with downscale extensions. Consistent across all experiments, the store
with upscale extensions had a higher price image when participants had a browsing goal than when they
had a buying goal.
35
FIGURE 1
UPSCALE EXTENSIONS INCREASE PURCHASE DEFERRAL WHEN BROWSING BUT
DECREASE PURCHASE DEFERRAL WHEN BUYING (EXPERIMENT 1)
NOTE.— Purchase deferral is the relative share of participants who chose to forego buying at the current
price and instead look for a better price at other stores. Rates of purchase deferral increase as price image
increases.
Purchase deferral
72.2%
52.9%44.4%
75.0%
0%
20%
40%
60%
80%
100%
Asked to consider (browsinggoal)
Asked to choose (buying goal)
Upscale extension Downscale extension
36
FIGURE 2
BUYING MORE VERTICAL EXTENSIONS INCREASES PREFERENCE FOR DOWNSCALE
STORE (EXPERIMENT 5)
NOTE.— Participants were asked to choose the store they thought had the lower prices overall.
Relative choice shares of downscale store
79.3%
0.0%
26.7%
58.3%52.9%
84.6%
0%
20%
40%
60%
80%
100%
Browsinggoal
0extensions
chosen
1extensions
chosen
2extensions
chosen
3-4extensions
chosen
5+extensions
chosenBuying goal