the impact of recombination hotspots on genome … · 79 role in disease outbreaks caused by...
TRANSCRIPT

1
The impact of recombination hotspots on genome evolution of 1
a fungal plant pathogen 2
3
Daniel Croll*,§, Mark H. Lendenmann*, Ethan Stewart*, Bruce A. McDonald* 4
5
Affiliations 6
* Plant Pathology, Institute of Integrative Biology, ETH Zurich, 8092 Zurich, Switzerland 7
§ Michael Smith Laboratories, University of British Columbia, V6T 1Z4 Vancouver BC, 8
Canada 9
10
11
ACCESSION NUMBERS 12
NCBI BioSample accessions for parental strains are SRS383146, SRS383147, SRS383142 and 13
SRS383143. Progeny sequence data is deposited under NCBI BioProject accession numbers 14
PRJNA256988 (cross ST99CH3D1 x ST99CH3D7) and PRJNA256991 (cross ST99CH1A5 x ST99CH1E4). 15
16
17
SHORT TITLE 18
Recombination hotspot variability 19
20
21
Genetics: Early Online, published on September 21, 2015 as 10.1534/genetics.115.180968
Copyright 2015.

2
Corresponding author: 22
Daniel Croll 23
LFW B28 24
Universitätsstrasse 2 25
CH-8092 Zürich 26
Switzerland 27
E-mail: [email protected] 28
Telephone: +41 44 632 33 87; Fax +41 44 632 15 72 29
30
31
32
Keywords: Recombination hotspots, pathogen evolution, restriction site associated DNA sequencing, 33
population genomics, linkage disequilibrium 34

3
Abstract 35 36
Recombination impacts genome evolution by maintaining chromosomal integrity, affecting 37
the efficacy of selection and increasing genetic variability in populations. Recombination 38
rates are a key determinant of the co-evolutionary dynamics between hosts and their 39
pathogens. Historic recombination events created devastating new pathogens, but the 40
impact of ongoing recombination in sexual pathogens is poorly understood. Many fungal 41
pathogens of plants undergo regular sexual cycles and sex is considered a major factor 42
contributing to virulence. We generated a recombination map at kilobase-scale resolution 43
for the haploid plant pathogenic fungus Zymoseptoria tritici. In order to account for intra-44
specific variation in recombination rates, we constructed genetic maps from two 45
independent crosses. We localized a total of 10,287 crossover events in 441 progeny and 46
found that recombination rates were highly heterogeneous within and among 47
chromosomes. Recombination rates on large chromosomes were inversely correlated with 48
chromosome length. Short, accessory chromosomes often lacked evidence for crossovers 49
between parental chromosomes. Recombination was concentrated in narrow hotspots that 50
were preferentially located close to telomeres. Hotspots were only partially conserved 51
between the two crosses, suggesting that hotspots are short-lived and may vary according 52
to genomic background. Genes located in hotspot regions were enriched in genes 53
encoding secreted proteins. Population resequencing showed that chromosomal regions 54
with high recombination rates were strongly correlated with regions of low linkage 55
disequilibrium. Hence, genes in pathogen recombination hotspots are likely to evolve 56
faster in natural populations and may represent a greater threat to the host. 57
58

4
Introduction 59 60
Recombination is a fundamental process shaping the evolution of genomes. Crossover 61
between homologous chromosomes ensures proper segregation during meiosis (MATHER 62
1938; BAKER et al. 1976; HASSOLD and HUNT 2001) and the integrity of chromosomal structure 63
over evolutionary time is affected by the frequency of recombination. Sex chromosomes in 64
plants and animals and mating type regions of fungi experience degeneration, including 65
significant gene loss and sequence rearrangements, after cessation of recombination 66
between homologs (BULL 1983; CHARLESWORTH and CHARLESWORTH 2000; BROWN et al. 2005; 67
MENKIS et al. 2008; WILSON and MAKOVA 2009). Recombination breaks up linkage between 68
alleles of different loci and creates novel haplotypes and phenotypic diversity. Through this 69
process, recombination promotes adaptation because selection acting across multiple loci 70
becomes more efficient as linkage between loci decreases (HILL and ROBERTSON 1966; OTTO 71
and BARTON 1997; OTTO and LENORMAND 2002). 72
73
Recombination also plays a major role in the co-evolutionary dynamics of hosts and their 74
pathogens. A major driver to maintain sexual reproduction in hosts was proposed to be the 75
constant selection to evade disease caused by pathogens (HAMILTON 1980; LIVELY 2010; 76
MORRAN et al. 2011). However, pathogens are also under strong selection to overcome 77
newly evolved host resistance mechanisms. Recombination in pathogens plays a central 78
role in disease outbreaks caused by viruses, bacteria and eukaryotic microorganisms. 79
Epidemic influenza is driven by annual re-occurring outbreaks of recombined viral strains 80
(NELSON and HOLMES 2007). The highly virulent lineage of Salmonella enterica causing 81
typhoid fever (DIDELOT et al. 2007; HOLT et al. 2008) emerged from recombination with the 82
related Paratyphi A lineage. Recombination between ancestral lineages of Toxoplasma 83
created hypervirulent clones of the protozoan human pathogen T. gondii (GRIGG et al. 2001) 84
and ongoing outcrossing and clonal expansion contributes to extant Toxoplasma 85

5
outbreaks (WENDTE et al. 2010). Some of the most threatening fungal pathogen lineages 86
were generated by historic recombination events between lineages. Reshuffling between 87
different genotypes may have contributed to the emergence of the hypervirulent human 88
pathogen Cryptococcus gattii in the Pacific Northwest (FRASER et al. 2005; BYRNES et al. 89
2011), where same-sex mating was suggested to have enabled the creation of a 90
recombinant hypervirulent genotype (FRASER et al. 2005). The chytrid fungus 91
Batrachochytrium dendrobatidis is causing a global epidemic on a wide range of 92
amphibians (FISHER et al. 2009). The pathogen is comprised of a complex set of lineages. 93
However, the outbreak is overwhelmingly caused by a single hypervirulent lineage that 94
was created by hybridization and subsequent recombination of two distinct, allopatric 95
Batrachochytrium lineages (ROSENBLUM et al. 2008; FARRER et al. 2011). 96
97
In contrast to the evidence that historic recombination events led to the creation of novel 98
fungal pathogens, the impact of frequent recombination on genome evolution in extant 99
sexual pathogens is poorly understood (AWADALLA 2003). As the extent of recombination 100
correlates with the evolutionary potential of a population, the occurrence of sexual 101
reproduction was suggested to be a predictor of a pathogen's capacity to overcome host 102
resistance mechanisms (MCDONALD and LINDE 2002; STUKENBROCK and MCDONALD 2008). 103
Pathogenic fungi of plants span a broad range of lifestyles from asexual to mainly sexual 104
or mixed reproduction and can include multiple sexual cycles per year (MCDONALD and 105
LINDE 2002). Hence, these fungi are ideal models to study the impact of recombination on 106
pathogen evolution. Loci contributing to virulence in pathogens undergo rapid allele 107
frequency changes in response to changes in host populations (BARRETT et al. 2009; 108
THRALL et al. 2012) and fungal pathogenicity is often found to be encoded by a large 109
number of virulence loci distributed throughout the genome (KARASOV et al. 2014). 110

6
Recombination enables the emergence of pathogen strains carrying novel combinations of 111
virulence alleles that may increase virulence on specific hosts. 112
113
A key determinant of the speed of adaptation of a pathogenic organism may be 114
intragenomic variation in recombination rates that locally increase the efficacy of selection. 115
Strong signatures of selection at linked sites were found in nematodes and humans, 116
however evidence for such signatures was weak or absent in plants and the yeast S. 117
cerevisiae (CUTTER and PAYSEUR 2013). Nevertheless, recombination rates in a genome 118
can vary dramatically. In some model organisms, a majority of crossovers occurring during 119
meiosis are focused in narrow chromosomal regions termed recombination hotspots 120
(KONG et al. 2002; JENSEN-SEAMAN et al. 2004; MYERS et al. 2005; ARNHEIM et al. 2007). 121
Hotspots can have a profound effect on the recombination landscape of a genome. In the 122
human genome, hotspots with a mean width of 2.3 kb accounted for 70-80% of all 123
recombination events (1000 GENOMES PROJECT CONSORTIUM et al. 2010). Hotspots were 124
preferentially located near telomeres in humans, plants and the yeast S. cerevisiae (MYERS 125
et al. 2005; DROUAUD 2005; TSAI et al. 2010). Recombination hotspots are thought to be 126
inherently unstable due to a "hotspot drive" mechanism that continuously replaces alleles 127
favoring higher recombination rates (WEBSTER and HURST 2012). Genomic signatures of 128
elevated recombination rates comprised increased GC content, likely resulting from the 129
preferential incorporation of C and G during the mismatch repair process initiated by the 130
pairing of homologous sequences (DURET and GALTIER 2009). 131
132
We aimed to identify recombination rate heterogeneity and its impact on the genome of a 133
pathogenic fungus. Zymoseptoria tritici is a globally occurring pathogen of wheat causing 134
severe yield losses (O'DRISCOLL et al. 2014). The fungus undergoes sexual reproduction at 135
least once per wheat growing season (Kema et al. 1996; Cowger et al. 2002; 2008). 136

7
Recombination between isolates was suggested to facilitate the evolution of virulence on 137
previously resistant wheat varieties (ZHAN et al. 2007). The genetic basis of virulence was 138
shown to have a strong quantitative component (ZHAN et al. 2005). Z. tritici populations 139
undergo rapid allele frequency shifts in response to the application of fungicides (TORRIANI 140
et al. 2009). The genome is haploid and was assembled into 21 complete chromosomes 141
including telomeres (GOODWIN et al. 2011). Eight chromosomes were termed accessory 142
because these chromosomes were not present in all isolates. Meiosis frequently 143
contributed to the loss, fusion or rearrangement of these accessory chromosomes 144
(WITTENBERG et al. 2009; CROLL et al. 2013). 145
146
We generated a high-density SNP-based recombination map of two large progeny 147
populations of Z. tritici. First, we used the map to precisely locate recombination hotspots, 148
identified correlations with genome characteristics and tested whether hotspots were 149
conserved between crosses. We then compared recombination rates between the small, 150
accessory and large, core chromosomes in Z. tritici to determine whether recombination 151
differently affects the two chromosomal classes. Next, we investigated whether hotspots 152
were enriched in specific sequence motifs and whether hotspots were more likely to 153
contain specific functional categories of genes. Finally, we tested whether recombination 154
hotspots identified in the mapping populations predicted local breakdowns in linkage 155
disequilibrium in a resequenced natural pathogen population. 156
157

8
Results 158 159
High-throughput progeny genotyping and crossover detection 160
Four parental isolates (3D1, 3D7, 1A5 and 1E4) collected from Swiss wheat fields in 1999 161
were used to construct two independent genetic maps. Progeny were genotyped based on 162
restriction-associated DNA sequencing (RADseq) (ETTER et al. 2011) which consists of 163
Illumina sequencing DNA fragments immediately adjacent to a defined restriction site in 164
the genome (generated by PstI in this study). Illumina reads obtained from each progeny 165
were aligned to the reference genome of Z. tritici for SNP genotyping and filtering. The 166
reference genome IPO323 is completely assembled including telomeres and centromeres 167
(GOODWIN et al. 2011). Whole-genome re-sequencing data from the parental isolates 168
(TORRIANI et al. 2011) was used to validate segregating SNPs among progeny. 169
170
Recombination between homologs can result in either a crossover or a non-crossover. 171
Crossovers result in the exchange of alleles over long chromosomal intervals. Non-172
crossovers lead to short intervals of unidirectional transfer among homologs (i.e. gene 173
conversion). Distinguishing between non-crossover and crossover events is important as 174
only the latter increase genetic diversity and break up haplotypes. In the model fungus S. 175
cerevisiae, tracts of gene conversions resulting from non-crossover span a median of 1.8 176
kb and a maximum observed tract length of 40.8 kb (MANCERA et al. 2008). Hence, we 177
investigated the interval length between recombination events for all progeny and 178
chromosomes. We observed a bimodal distribution of recombination event interval lengths 179
(Figure 1). In both crosses, we found two modes corresponding to recombination event 180
interval distances of 3-4 kb and ~1000 kb, respectively. 181
182

9
Genetic map construction and recombination rate variation among chromosomes 183
In order to conservatively estimate genetic map lengths based on crossover events, we 184
required a minimum distance of 50 kb between recombination events. Genetic maps were 185
constructed using the marker order known from physical positions of the SNP markers 186
based on the reference genome sequence. The consistency of the physical and genetic 187
marker distances and marker order was evaluated. A single problematic region was found 188
on chromosome 13, so this chromosome was excluded from analyses requiring physical 189
positions on the chromosome (see Methods and Figure S1). 190
191
The total genetic map constructed for cross 3D1x3D7 was based on 227 progeny and 192
spanned 2723.6 cM. For cross 1A5x1E4, the total map was based on 214 progeny and 193
was slightly smaller (2158.9 cM). The number of genotyped SNP markers greatly 194
exceeded (by ~12-15 X) the number of genetic map positions (the minimal set of markers 195
separated by at least one crossover). This shows that the SNP markers largely saturate 196
the number of genetic map positions in the two crosses (Tables 1 and 2, Figure 2). 197
Recombination rates were inversely related to the length of the chromosome (Figure 2). 198
The two crosses contained different sets of accessory chromosomes (i.e. chromosomes 199
not present in all isolates of the species). In cross 3D1x3D7, both parents carried a copy of 200
accessory chromosomes 16, 17, 19 and 20. In cross 1A5x1E4, accessory chromosomes 201
14-16 and 18-21 were present in both parents. Accessory chromosome 17 in the cross 202
1A5x1E4 was found to undergo spontaneous chromosomal fusion (CROLL et al. 2013), 203
however no other chromosomal rearrangements were documented in the two crosses. 204
Accessory chromosomes are significantly shorter than core chromosomes and this is 205
reflected in genetic map lengths. Chromosomes 14 (33.2 cM), 18 (22.1 cM) and 21 (16.5 206
cM) showed the shortest genetic maps (Table 2, Figure 2). Chromosomes 18 and 21 were 207

10
also found to have the lowest recombination rates of any chromosome (38.5 and 40.4 208
cM/Mb). 209
210
Infrequent crossovers on some accessory chromosomes 211
We assessed the minimal number of crossover events that generated each progeny 212
genotype. Average crossover counts decreased as expected with chromosome length 213
(Figure S2; Table 3). Crossover counts for a given core chromosomes followed a Poisson-214
like distribution and for each core chromosome we identified progeny with zero crossovers. 215
We found that accessory chromosomes 16, 17, 19 and 20 of cross 3D1x3D7 had 216
crossover counts of 0.45 - 0.54 per progeny. Average crossover counts were lower in 217
cross 1A5x1E4. The lowest average crossover counts were 0.15 and 0.2 for chromosomes 218
21 and 18, respectively. The low crossover counts per accessory chromosome resulted in 219
a large proportion of progeny that did not show a single crossover event (Figure S2). Most 220
crossover events on accessory chromosomes occurred in narrow segments of the 221
chromosome as shown by large linked chromosomal segments among progeny (Figure 222
S3). Chromosome 14 was found to recombine only in two narrow subtelomeric 223
chromosomal sections. 224
225
Recombination rate heterogeneity on chromosomes 226
In order to identify variation in recombination rates, we estimated recombination rates in 227
non-overlapping 20 kb segments along chromosomes. Recombination rates in these 228
segments were highly heterogeneous and varied between 0 and 1135 cM / Mb (Figure 3). 229
Central tracts of the chromosomes that were devoid of any recombination signal may 230
indicate centromere locations. Recombination rates estimated per 20 kb segments were 231
significantly correlated between the two crosses (Pearson’s product moment correlation 232
coefficient r = 0.61; p-value < 2.2e-16). We tested whether recombination rate 233

11
heterogeneity along chromosomes was significantly different than expected from a random 234
distribution of crossovers. For this, we tested whether the observed crossover counts per 235
chromosomal segment deviated significantly from a predicted random distribution of 236
crossovers. We found that crossovers were non-randomly distributed in both crosses and 237
at two different chromosomal scales (counting crossover in 10 kb and 200 kb segments; 238
detailed statistics are reported in Figure S4). In addition, we found that crossovers were 239
non-randomly distributed on all core chromosomes when analyzed individually. On 240
accessory chromosomes for which statistical analyses could be performed, crossovers 241
were also non-randomly distributed (see Table S1 for details on the statistical tests). 242
In order to identify systematic variations in recombination rates depending on 243
chromosomal position, we summarized recombination rates on core chromosomes 244
according to the relative distance to the closest telomere (Figure 4). Visual trends suggest 245
that median recombination rates were highest in subtelomeric regions of chromosomes in 246
both crosses (5-15% distance to the telomere). The lowest median recombination rates 247
were found closest to the telomeres (within 5% distance). However, individual core 248
chromosomes differed significantly for the distribution of recombination rates in relation to 249
telomere distance (Figure S5). 250
251
Localization of recombination hotspots 252
We aimed to identify narrow sequence tracts with the highest rates of exchange. For this, 253
we counted the observed number of crossover events in non-overlapping 10 kb sequence 254
segments in both crosses. The average recombination rate per segment was 1.1 and 1.46 255
crossover events in the crosses 1A5x1E4 and 3D1x3D7, respectively. In cross 1A5x1E4 256
we found that 76 segments showed 10 or more crossovers, representing 1.9% of the 257
genome but 27.8% of all crossovers (Table S2). Similarly, in cross 3D1x3D7, 130 hotspot 258
segments were found representing 3.3% of the genome and 38.2% of all crossovers 259

12
(Table S3). The probability to observe 10 or more crossovers by chance was p-value < 260
4.3e-7 (Poisson distribution with lambda = 1.1 and 1.46, respectively for 1A5x1E4 and 261
3D1x3D7). Hence, these hotspot segments represent highly unusual regions in the 262
genome. The rate of exchange in the hotspots ranged from 4.4 – 17.6% of all progeny 263
showing evidence for a crossover event. Hotspot locations were shared between crosses 264
1A5x1E4 and 3D1x3D7 in 35 segments. The overlap between hotspots corresponds to 265
46.1% of all hotspots identified in 1A5x1E4 and to 26.9% of all hotspots identified in 266
3D1x3D7. 267
268
Association of recombination hotspots with genome characteristics 269
The Z. tritici genome is gene dense (31.5% coding sequences) and GC-rich (51.7%). 270
Chromosomal sequences contain long sections of high GC-content interspersed with short 271
sections of low GC-content and low gene density (GOODWIN et al. 2011). In order to test for 272
genome characteristics associated with the presence of hotspots, we divided the entire 273
genome into non-overlapping 10 kb sequence segments and assessed differences 274
between 10 kb sequences identified as hotspots (see above) versus all other 10 kb 275
segments. GC-content was slightly but significantly higher in hotspots versus the genomic 276
background (53.6% versus 52.2%, Student’s t test t = 3.42 and 5.17 and p-value = 0.0009 277
and 6.2e-7 for the cross 1A5x1E4 and 3D1x3D7, respectively). Coding sequence densities 278
were not significantly different between the hotspots and the genomic background 279
(Student’s t test, p-value ~ 0.8; Figure 5A). However, hotspot segments were significantly 280
more polymorphic between parental genomes than the genomic background. The mean 281
SNP density was 1.37% and 1.60% for the cross 1A5x1E4 and 3D1x3D7, respectively, 282
versus the genomic background diversity of 1.01% (Student’s t test t = 4.50 and 5.45 and 283
p-value = 1.41e-5 and 6.27e-7 for the cross 1A5x1E4 and 3D1x3D7, respectively; Figure 284
5B). Relationships between recombination rates and GC-content, gene density and 285
13
polymorphism between parental genomes, respectively, are shown in Figures S6, S7 and 286
S8. 287
288
Recombination hotspots are enriched with GC-rich sequence motifs 289
Recombination hotspots were found to be enriched in short sequence motifs in animals 290
and protozoa (ARNHEIM et al. 2007; MYERS et al. 2008; JIANG et al. 2011). Evidence for 291
motifs from fungi is species-dependent. A simple sequence motif predicted recombination 292
hotspots in the fission yeast Schizosaccharomyces pombe (STEINER and SMITH 2005), 293
however no association was found for S. cerevisiae (MANCERA et al. 2008). In order to 294
identify potential motifs associated with recombination hotspots in Z. tritici, we analyzed 10 295
kb sequence segments showing 10 or more crossover events as described above using 296
HOMER. We restricted the search to any possible 8, 10 and 12 bp motifs in order to avoid 297
confounding effects of overlapping motifs. In the cross 3D1x3D7 the 10 bp 298
(GGGGGGGATG) GC-rich motif was found in 53.9% of the hotspots compared to 22.4% 299
of sequence segments not containing hotspots. After accounting for differences in GC-300
content between hotspots and the genomic background, we found that hotspots were 301
significantly enriched in this motif (p-value = 1e-14; Figure 6). Similarly, three GC-rich 302
motifs were found to be significantly enriched in hotspots of the cross 1A5x1E4. The most 303
significant motif was 12 bp (GTTGGCTGGGGA) and found in 21.1% of all hotspot 304
sequences compared to 1.6% in the genomic background (p-value = 1e-13; Figure 6). 305
306 Recombination hotspots are enriched in genes encoding secreted proteins 307
Genes located in recombination hotspots may be subject to both increased mutation rates 308
and higher rates of reshuffling of allelic variants in the population. Hence, the mutagenic 309
potential and higher rates of adaptive evolution of recombination hotspots may lead to an 310
enrichment in fast-evolving gene categories near hotspots. As above, we defined 311
recombination hotspots as 10 kb segments showing 10 or more crossover events. Protein 312

14
secretion is an important component of virulence in plant pathogenic fungi. We tested 313
whether recombination hotspots were more likely to contain genes encoding secreted 314
proteins. We used the dataset of predicted secretory signal peptides to test for enrichment 315
in hotspots. We found that in cross 3D7x3D1, hotspots were significantly enriched for 316
genes encoding secreted proteins (hypergeometric test; p-value = 0.0076). In cross 317
1A5x1E4, hotspots were also enriched in genes encoding secreted proteins (p-value = 318
0.021). 319
320
We screened genes overlapping recombination hotspots for previously identified virulence 321
candidate genes (GOODWIN et al. 2011; MORAIS DO AMARAL et al. 2012; BRUNNER et al. 322
2013). We identified several categories of genes underlying important components of 323
virulence in plant pathogenic fungi. Three small secreted proteins were found in hotspots 324
overlapping in both crosses (Table 4). In cross 3D1x3D7 hotspots, we identified genes 325
encoding cell wall degrading enzymes: the cutinase MgCUT4, the beta-xylosidase 326
MgXYL4 and an alpha-L-arabinofuranosidase. 327
328
Recombination rates are correlated with population linkage disequilibrium 329
The extent of linkage disequilibrium (LD) among markers is a defining characteristic of 330
genetic variation in a population. High LD is indicative of partial selective sweeps or 331
population substructure. Recombination rates are expected to influence the extent of LD in 332
populations because high recombination rates may reduce LD among markers. We tested 333
whether recombination rates were correlated with LD in a natural Z. tritici population. For 334
this, we resequenced 25 isolates from the same field population (including the parental 335
isolates in this study). All isolates were genotyped at the same marker positions that were 336
used in the recombination rate analyses. We calculated both the LD in the population and 337
the recombination rate between all adjacent markers that were separated by at least 500 338
15
bp. We found that the recombination rate was negatively correlated with LD in both 339
crosses (Spearman’s rank correlation p < 2.2e-16 and rho = -0.213 and -0.184 for 340
3D1x3D7 and 1A5x1E4, respectively; Figure 7). Adjacent markers with the highest LD in 341
the natural field population were among the markers with the lowest recombination rates in 342
the crosses. 343
344
345
16
Discussion 346 347
We established a dense map of recombination rates in the genome of a fungal plant 348
pathogen based on two independent crosses. The SNP marker density was ~12-15 times 349
greater than the number of unique marker positions in the genetic map, hence crossover 350
events could be precisely localized to narrow chromosomal tracts. As genomic analyses of 351
all four meiotic products are currently not feasible in Z. tritici, we used a conservative 352
approach to avoid confounding effects due to non-crossover events. By requiring a 353
minimum distance of 50 kb between recombination events in a progeny, a small number of 354
double crossovers occurring in a narrow interval may have been missed. 355
356
Recombination rates were highly heterogeneous and highest in subtelomeric 357
recombination hotspots. The genetic maps produced for the two crosses were 358
substantially larger than previously published maps for Z. tritici (2158.9 - 2723.6 cM versus 359
1216 - 1946 cM) (KEMA et al. 2002; WITTENBERG et al. 2009). The larger map lengths were 360
likely due to denser marker coverage in subtelomeric regions and larger progeny 361
populations. Furthermore, in contrast to the present study, no recombination was 362
previously detected on accessory chromosomes (WITTENBERG et al. 2009). The new 363
genetic map of Z. tritici was also substantially longer than the map of the model fungi 364
Coprinus cinereus (948 cM; (STAJICH et al. 2010)) and Neurospora crassa (1000 cM; 365
(LAMBREGHTS et al. 2009)). The genetic map of Saccharomyces cerevisiae was estimated 366
to be 4900 cM (BARTON et al. 2008). The genetic maps differed between the two analyzed 367
crosses by 565 cM. The genetic distance between the parental genomes, number of 368
analyzed progeny, number of genotyped markers and genotyping rates differed only 369
marginally between the two crosses. Hence, these parameters are unlikely to explain 370
differences in estimated genetic map lengths. However, analyzing physical distances 371
between recombination events showed that the cross 1A5x1E4 had a lower proportion of 372
17
long distance (> 50 kb) recombination events compared to cross 3D1x3D7. Unknown 373
recombination modifiers could be responsible for differences in crossover rates between 374
crosses. 375
376
Low recombination rates and non-canonical meiosis on accessory chromosomes 377
We found that the frequency of reciprocal recombination (or crossover) per chromosome 378
was positively correlated with chromosomal length. However, the recombination rate 379
expressed per Mb was higher for smaller core chromosomes. The inverse relationship 380
between recombination rate and chromosomal length is well established in S. cerevisiae 381
(MORTIMER et al. 1989; CHERRY et al. 1997; KABACK et al. 1999). Crossover counts per 382
chromosome reached 0.94-1.14 for the smallest core chromosomes. The occurrence of at 383
least one crossover event per chromosome and meiosis promotes proper homologous 384
segregation (MATHER 1938; HASSOLD and HUNT 2001). Non-disjunction of chromosomes 385
leads to aneuploidy (BAKER et al. 1976). We found that some Z. tritici accessory 386
chromosomes had unusually low crossover rates, as approximately half of the progeny of 387
cross 3D1x3D7 showed no crossovers and in cross 1A5x1E4 per progeny crossover 388
counts ranged from 0.15 to 0.45 per chromosome. Failure to undergo crossovers may 389
contribute to frequent non-disjunction of particular accessory chromosomes (WITTENBERG 390
et al. 2009; CROLL et al. 2013). Accessory chromosomes were frequently found to be lost 391
or disomic following meiosis, indicative of non-disjunction (WITTENBERG et al. 2009; CROLL 392
et al. 2013). 393
394
Lower than expected recombination rates (in cM per Mb) on some accessory 395
chromosomes are expected to lead to substantial linkage disequilibrium among genetic 396
variants in a population. The purging of deleterious mutations critically depends on 397
sufficient recombination between loci. Therefore, some accessory chromosomes may be 398
18
subject to more rapid mutation accumulation and decay. Reduced levels of gene density 399
and shorter transcript lengths (GOODWIN et al. 2011) may be indicative of a degeneration 400
process operating on accessory chromosomes. Degeneration and rearrangements in turn 401
may lead to further recombination suppression; a process similar to the one observed in 402
sex chromosome evolution. 403
404
Recombination rate heterogeneity and hotspots 405
Recombination rates were highly heterogeneous along chromosomes. A large fraction of 406
all crossover events were restricted to narrow chromosomal bands or hotspots of 407
recombination. In the strongest hotspots, 18.5% of all progeny showed a crossover event 408
within a 10 kb region. Recombination rates tended to be highest in subtelomeric regions of 409
the chromosomes. Increased recombination rates in the chromosomal periphery were 410
widely reported in animals (e.g. BACKSTRÖM et al. 2010; BRADLEY et al. 2011; AUTON et al. 411
2012; ROESTI et al. 2013), and plants (AKHUNOV et al. 2003; ANDERSON et al. 2003). In 412
fungi, hotspot associations with subtelomeric regions were found in C. cinereus and S. 413
cerevisiae (BARTON et al. 2008; STAJICH et al. 2010). Peripheral clustering of chromosomes 414
(bouquet formation) during prophase I of meiosis is thought to favor proper homologous 415
pairing and by this process promote crossovers (BROWN et al. 2005; NARANJO and 416
CORREDOR 2008). 417
418
Recombination hotspots showed no strong difference in GC content or coding sequence 419
density compared to the genomic background. However, associations of GC content and 420
recombination rates are ubiquitous in eukaryotes (GERTON et al. 2000; JENSEN-SEAMAN et 421
al. 2004; DURET and ARNDT 2008; BACKSTRÖM et al. 2010; MUYLE et al. 2011; AUTON et al. 422
2012). In S. cerevisiae, experimentally introduced GC-rich regions generate novel 423
recombination hotspots (WU and LICHTEN 1995). Hotspots of Z. tritici were enriched in G/C 424

19
mononucleotide repeats compared to the genomic background. Similarly, S. cerevisiae 425
hotspots were found to be enriched in 20-41 bp poly(A) stretches (MANCERA et al. 2008). 426
Z. tritici hotspots were in regions of higher diversity between the parental genomes 427
compared to the genomic background. A potential explanation is that if hotspot locations 428
persist over many generations, frequent gene conversion events may cause a higher 429
mutation rate in hotspots and, hence, higher sequence diversity (HURLES 2005). Reduced 430
diversity in regions of low recombination rates is well supported both by theory and 431
empirical data (BEGUN and AQUADRO 1992; NACHMAN 2002; CUTTER and PAYSEUR 2013). 432
433
Divergent hotspot locations within a species 434
Hotspots are thought to be ephemeral in genomes because of their inherent self-435
destructive properties. A crossover is initiated by a double-strand break on one 436
chromosome. The homologous chromosome serves as a template to repair the crossover 437
initiator sequence. Therefore, the conversion process continually replaces any allele that 438
favors increased recombination with its homolog. Studies of humans and chimpanzees 439
showed that hotspot locations are rarely conserved, consistent with rapid turnover (COOP 440
and MYERS 2007; AUTON et al. 2012). In contrast, hotspots were frequently conserved 441
among a pair of divergent Saccharomyces species (TSAI et al. 2010). The unexpected 442
conservation was attributed to the low frequency of sex, reducing the opportunity for 443
biased gene conversion to erode hotspots. Z. tritici undergoes sexual reproduction very 444
frequently (ZHAN et al. 2002). Hotspot locations were only partially conserved (27 - 46%) 445
between the two crosses established from isolates of the same regional population. A lack 446
of overlap in hotspot locations may be due to the fact that not all hotspot locations were 447
used during specific rounds of meiosis. However, each of the two analyzed crosses 448
contained a large number of individual meiosis events reflecting the large number of 449

20
analyzed ascospore progeny. Hence, stochastic variations in hotspot occupancies should 450
be minimal. 451
452
Functional enrichment of genes in recombination hotspots 453
Plant pathogenic fungi rely on secretion to deliver effectors and toxins into the host and 454
genes encoding short secreted polypeptides were found to evolve very rapidly in pathogen 455
genomes (RAFFAELE et al. 2010; PETRE and KAMOUN 2014). Recombination hotspots in Z. 456
tritici were enriched in genes encoding secreted proteins. This may indicate that the 457
localization of these genes in hotspots was favored by selection. We also screened 458
hotspots in both crosses for the presence of candidate effector genes likely to play a role 459
in pathogenesis (Table 4). Hotspots overlapping in both crosses contained genes 460
encoding small, cysteine-rich secreted proteins. This gene category was found to be up-461
regulated during host infection and gene products likely modulate the host resistance 462
response (MORAIS DO AMARAL et al. 2012; MIRZADI GOHARI et al. 2014). Two cell wall 463
degrading enzymes (MgCUT4 and MgXYL4) were specifically up-regulated during host 464
infection and showed evidence for selection in the pathogen population (BRUNNER et al. 465
2013). However, MgCUT4 and MgXYL4 were located in hotspots exclusive to the 466
3D1x3D7 cross, suggesting that associations of virulence genes and hotspots may be 467
ephemeral over evolutionary time. 468
469
Consequences of recombination hotspots for genome evolution of pathogens 470
Regions of the genome with high recombination rates showed significantly lower levels of 471
linkage disequilibrium in the natural population. This suggests that effects of demography, 472
periods of clonal reproduction and selection were insufficient to affect the inverse 473
relationship between recombination rates and linkage disequilibrium in the population. An 474
emerging paradigm in the study of pathogenic organisms is that the genome organization 475

21
reflects the intense selection pressure faced by pathogens (CROLL and MCDONALD 2012; 476
RAFFAELE and KAMOUN 2012). The observed genome compartmentalization was termed 477
the "two-speed" genome (RAFFAELE et al. 2010). The genome of the causative agent of the 478
Irish potato famine, the oomycete Phytophthora infestans, contains fast-evolving, repeat-479
rich compartments hosting an abundance of pathogenicity genes (RAFFAELE et al. 2010). 480
In contrast, genes encoding essential functions are preferentially located in GC-rich, gene-481
dense compartments. However, the enrichment of effector genes in repeat-rich regions is 482
not universal among pathogens. Many pathogen genomes are neither repeat-rich nor 483
contain large tracts of low GC-content. Our findings in Z. tritici suggest that genome 484
organization can evolve to compartmentalize gene functions correlated with variations in 485
recombination rates. Recombination hotspots may constitute a previously unrecognized 486
genomic compartment that favors the emergence of fast-evolving virulence genes in 487
pathogens. 488
489

22
Materials and Methods 490 491
Establishment of controlled sexual crosses 492
We performed two sexual crosses between four different Z. tritici isolates collected from 493
two wheat fields separated by ~10 km in Switzerland. All isolates were previously 494
characterized phenotypically and genetically (ZHAN et al. 2005; CROLL et al. 2013). The 495
two crosses were performed between the isolates ST99CH1A5 and ST99CH1E4 496
(abbreviated 1A5 and 1E4) and ST99CH3D1 and ST99CH3D7 (abbreviated 3D1 and 497
3D7), respectively. The parental isolates were used to co-infect wheat leaves according to 498
a protocol established for Z. tritici (Kema et al. 1996). Shooting ascospores were collected, 499
grown in vitro and genotyped by microsatellite markers to confirm that progeny genotypes 500
were recombinants of the parental genotypes. 501
502
SNP genotyping based on restriction-associated DNA sequencing (RADseq) 503
We chose a high-throughput genotyping method originally developed for animal and plant 504
population genomics (BAIRD et al. 2008). We adapted the RADseq protocol (ETTER et al. 505
2011) for Z. tritici by using PstI for the digestion of 1.3 µg of genomic DNA per progeny. 506
After DNA digestion, shearing and adapter-ligation, we performed 100 bp Illumina paired-507
end sequencing on pooled samples. Progeny were identified by combining 24 distinct 508
inline barcodes located in the P1 adapter and 6 index sequences in the P2 adapter. 509
510
Illumina data analysis and reference alignment 511
Raw Illumina reads were quality trimmed with Trimmomatic v. 0.30 (BOLGER et al. 2014) 512
and split into unique sets for each progeny with the FASTX toolkit v. 0.13 513
(http://hannonlab.cshl.edu/fastx_toolkit/). We used the short-read aligner bowtie version 514
2.1.0 (LANGMEAD and SALZBERG 2012) to align the read set of each progeny to the 515
reference genome IPO323 (assembly version MG2, Sep 2008; (GOODWIN et al. 2011)). We 516

23
used the default settings for a sensitive end-to-end alignment (-D 15; -R 2; -L 22; -i 517
S,1,1.15). The whole genomes of all four parental isolates were previously re-sequenced 518
(TORRIANI et al. 2011) and available under the NCBI SRA accession numbers SRS383146 519
(3D1), SRS383147 (3D7), SRS383142 (1A5) and SRS383143 (1E4). We used identical 520
trimming and assembly parameters to align the whole genome sequencing dataset to the 521
reference genome IPO323. All Illumina sequence data generated for progeny re-522
sequencing is available under the NCBI BioProject accession numbers PRJNA256988 523
(cross 3D1x3D7) and PRJNA256991 (cross 1A5x1E4). 524
525 Variant calling and filtration 526
Single nucleotide polymorphisms (SNP) were identified based on the Genome Analysis 527
Toolkit (GATK) version 2.6-4-g3e5ff60 (DEPRISTO et al. 2011). SNPs were called 528
separately for each cross with the GATK UnifiedGenotyper. Each UnifiedGenotyper run 529
combined all progeny and their two respective parents. For UnifiedGenotyper we set the 530
sample-level ploidy to 1 (haploid) and permitted a maximum of 2 alternative alleles 531
compared to the reference genome. The genotype likelihood model was set to the SNP 532
general ploidy model. 533
534
We used the GATK filtering and variant selection tools to remove spurious SNP calls from 535
the dataset. We set the following requirements for a SNP to pass the filtering: Overall 536
quality score (QUAL � 100), mapping quality (MQ � 30), haplotype score (HaplotypeScore 537
� 13), quality by depth (QD � 5), read position rank sum test (ReadPosRankSumTest � -8) 538
and Fisher's Exact Test for strand bias (FS � 40). After a joint SNP locus filtering, we 539
filtered genotypes for each parental isolate and progeny at each retained locus. We 540
required that each included isolate had a minimum mean genotyping depth of 5 high-541

24
quality reads. We retained individual genotypes if the phred-scaled genotype quality (GQ) 542
assigned by GATK UnifiedGenotyper was at least 30. 543
544
Genetic map construction and quality assessment 545
We constructed a genotype matrix containing all progeny that were genotyped at a 546
minimum of 90% of all SNPs. Subsequently, we removed all SNP markers that were 547
genotyped in less than 90% of the progeny. We assessed the clonal fraction among the 548
progeny in the offspring populations using the r/qtl package in R (ARENDS et al. 2010). If 549
two progeny were identical at 90% or more of the SNPs, we randomly excluded one of the 550
two likely clones. We inspected the quality of the progeny genotype set for problematic 551
double crossovers at very closely spaced markers. For this, we calculated error LOD 552
scores (LINCOLN and LANDER 1992) as implemented in the r/qtl package. The error LOD 553
score compares likelihoods for a correct genotype versus an erroneous genotype based 554
on pairwise linkage. We excluded genotypes exceeding an error LOD score of 2 from the 555
dataset. We filtered the progeny genotype data for random genotyping errors. We required 556
that any double crossover event in a progeny must be spanned by at least three 557
consecutive SNPs. Furthermore, any double crossover event had to span at least 500 bp. 558
These filtering steps ruled out that double crossover events could be erroneously 559
produced by a single stack (i.e. restriction site) of RAD sequencing reads. In addition, we 560
visually inspected the genotype grid for potential erroneous read mapping or translocation 561
events indicated by switched genotypes in all progeny of a cross. We identified three 562
potential erroneous locations in the cross of 3D1x3D7, with each spanning a maximum 563
physical distance of 650 bp. In the 1A5x1E4 cross, we found three potential erroneous 564
locations with SNP loci spanning a maximum of 50 bp for each region. SNP loci within an 565
erroneous mapping location were excluded from further analyses. 566
567
25
In summary, we retained 23,563 SNPs in 227 progeny of the cross between parental 568
isolates 3D1 and 3D7. We analyzed 214 progeny at 23,284 SNP markers for the cross 569
between parental isolates 1A5 and 1E4. The SNP marker density was 0.6 SNP per kb. 570
The genotyping rate averaged 96.5% (chromosomal averages 93.7 - 97.3%) for cross 571
3D1x3D7 and 95.0% (chromosomal averages 90.9 - 98.3%) for cross 1A5x1E4 (Table 1). 572
SNP markers covered the entire length of all core chromosomes with the exception of 573
telomeric regions. Marker densities were similarly distributed along chromosomes in both 574
crosses. 575
We calculated recombination fractions among all pairs of retained markers using the r/qtl 576
package. We set the maximum of iterations to 10,000 and the tolerance for recombination 577
fraction estimates to 0.0001. Using identical settings, we calculated genetic distances for 578
marker pairs on each chromosome. 579
580
Genetic map reconstruction of chromosome 13 581
Based on pairwise recombination fractions, we identified one problematic region located 582
on chromosome 13 (Figure S1). In both crosses, the pattern of recombination fractions 583
suggested that the parental isolates differed from the reference genome used for read 584
mapping. In order to generate the correct marker order on chromosome 13, we produced 585
the genetic map using r/rqtl. We used 10,000 iterations and a tolerance of 0.0001 for cM 586
estimates between markers. The re-calculated marker order showed that the problematic 587
region contains a large weakly recombining region (Figure S1). As the marker order in 588
weakly recombining regions is difficult to confirm with a high confidence, we excluded 589
chromosome 13 from analyses requiring exact physical locations of markers. 590
591

26
Correlations of recombination rates and genome characteristics 592
We downloaded the reference genome IPO323 (assembly version MG2, Sep 2008; 593
(GOODWIN et al. 2011)) from http://genome.jgi-psf.org/Mycgr3/Mycgr3.home.html 594
(accessed March 2014). Gene annotations of Z. tritici related to the RefSeq assembly ID 595
GCF_000219625.1 were accessed in January 2014. SignalP annotations for gene models 596
of IPO323 were retrieved from http://genome.jgi-psf.org/Mycgr3/Mycgr3.home.html 597
(accessed March 2014). Enrichment for signalP secretion signals (probability > 0.9) was 598
tested using a hypergeometric test in R. 599
600
Motif search in recombination hotspots 601
We searched recombination hotspots for enriched sequence motifs with HOMER v 4.3 602
(HEINZ et al. 2010). For this, we divided the chromosome sequences into non-overlapping 603
10 kb segments. For each cross, we identified segments showing at least 10 crossover 604
events. We used the HOMER findMotifsGenome module to identify enriched oligo-605
nucleotides in the hotspot segments compared to the genomic background divided into 606
equally long segments of 10 kb. We used GC-content auto-normalization to correct for 607
bias in sequence composition. The motif length search was restricted to 8, 10 and 12 bp. 608
The top scoring motif was then used to detect chromosomal regions containing the motif 609
using the annotatePeaks tool included in Homer. 610
611 Population genomic analyses of linkage disequilibrium 612
We analyzed Illumina whole-genome sequence data from all four parental isolates and 21 613
additional isolates (data available under NCBI BioProject PRJNA178194) from the same 614
Swiss population (TORRIANI et al. 2011). We used identical reference genome alignment 615
and SNP quality filtering procedures as described above for the RADseq analyses. In 616
order to correlate recombination rates and linkage disequilibria, we retained SNP positions 617
for the population dataset if these positions were included in the genetic map construction. 618

27
Adjacent SNP marker pairs were omitted if markers were separated by less than 500 bp. 619
All linkage disequilibria calculations were made with vcftools v. 0.1.12a (DANECEK et al. 620
2011). 621
622
623 Acknowledgements 624 625
We are grateful to Christine Grossen, Sam Yeaman, Alan Brelsford and Jessica Purcell for 626
helpful comments on previous versions of the manuscript. The Genetic Diversity Center 627
and the Quantitative Genomics Facility at ETH Zurich were used to generate sequence 628
data. Funding was provided by Swiss National Science Foundation grants to DC 629
[PA00P3_145360], BAM [31003A_134755] and an ETH Zurich grant [ETH-03 12] to DC 630
and BAM.631

28
References 632
633
1000 GENOMES PROJECT CONSORTIUM, ABECASIS G. R., ALTSHULER D., AUTON A., BROOKS L. D., 634 DURBIN R. M., GIBBS R. A., HURLES M. E., MCVEAN G. A., 2010 A map of human genome 635 variation from population-scale sequencing. Nature 467: 1061–1073. 636
AKHUNOV E. D., GOODYEAR A. W., GENG S., QI L.-L., ECHALIER B., GILL B. S., MIFTAHUDIN, 637 GUSTAFSON J. P., LAZO G., CHAO S., ANDERSON O. D., LINKIEWICZ A. M., DUBCOVSKY J., LA 638 ROTA M., SORRELLS M. E., ZHANG D., NGUYEN H. T., KALAVACHARLA V., HOSSAIN K., KIANIAN S. 639 F., PENG J., LAPITAN N. L. V., GONZALEZ-HERNANDEZ J. L., ANDERSON J. A., CHOI D.-W., CLOSE 640 T. J., DILBIRLIGI M., GILL K. S., WALKER-SIMMONS M. K., STEBER C., MCGUIRE P. E., QUALSET 641 C. O., DVORAK J., 2003 The organization and rate of evolution of wheat genomes are 642 correlated with recombination rates along chromosome arms. Genome Res 13: 753–763. 643
ANDERSON L. K., DOYLE G. G., BRIGHAM B., CARTER J., HOOKER K. D., LAI A., RICE M., STACK S. 644 M., 2003 High-resolution crossover maps for each bivalent of Zea mays using recombination 645 nodules. Genetics 165: 849–865. 646
ARENDS D., PRINS P., JANSEN R. C., BROMAN K. W., 2010 R/qtl: high-throughput multiple QTL 647 mapping. Bioinformatics 26: 2990–2992. 648
ARNHEIM N., CALABRESE P., TIEMANN-BOEGE I., 2007 Mammalian meiotic recombination hot 649 spots. Annual Review of Genetics 41: 369–399. 650
AUTON A., FLEDEL-ALON A., PFEIFER S., VENN O., SÉGUREL L., STREET T., LEFFLER E. M., BOWDEN 651 R., ANEAS I., BROXHOLME J., HUMBURG P., IQBAL Z., LUNTER G., MALLER J., HERNANDEZ R. D., 652 MELTON C., VENKAT A., NOBREGA M. A., BONTROP R., MYERS S., DONNELLY P., PRZEWORSKI 653 M., MCVEAN G., 2012 A fine-scale chimpanzee genetic map from population sequencing. 654 Science 336: 193–198. 655
AWADALLA P., 2003 The evolutionary genomics of pathogen recombination. Nat Rev Genet 4: 50–656 60. 657
BACKSTRÖM N., FORSTMEIER W., SCHIELZETH H., MELLENIUS H., NAM K., BOLUND E., WEBSTER M. 658 T., OST T., SCHNEIDER M., KEMPENAERS B., ELLEGREN H., 2010 The recombination landscape 659 of the zebra finch Taeniopygia guttata genome. Genome Res 20: 485–495. 660
BAIRD N. A., ETTER P. D., ATWOOD T. S., CURREY M. C., SHIVER A. L., LEWIS Z. A., SELKER E. U., 661 CRESKO W. A., JOHNSON E. A., 2008 Rapid SNP discovery and genetic mapping using 662 sequenced RAD markers. PLoS ONE 3: e3376. 663
BAKER B. S., CARPENTER A. T., ESPOSITO M. S., ESPOSITO R. E., SANDLER L., 1976 The genetic 664 control of meiosis. Annual Review of Genetics 10: 53–134. 665
BARRETT L. G., THRALL P. H., DODDS P. N., LINDE C. C., 2009 Diversity and evolution of effector 666 loci in natural populations of the plant pathogen Melampsora lini. Mol Biol Evol 26: 2499–2513. 667
BARTON A. B., PEKOSZ M. R., KURVATHI R. S., KABACK D. B., 2008 Meiotic Recombination at the 668 Ends of Chromosomes in Saccharomyces cerevisiae. Genetics 179: 1221–1235. 669
BEGUN D. J., AQUADRO C. F., 1992 Levels of naturally occurring DNA polymorphism correlate with 670 recombination rates in D. melanogaster. Nature 356: 519–520. 671
BOLGER A. M., LOHSE M., USADEL B., 2014 Trimmomatic: a flexible trimmer for Illumina sequence 672 data. Bioinformatics. 673

29
BRADLEY K. M., BREYER J. P., MELVILLE D. B., BROMAN K. W., KNAPIK E. W., SMITH J. R., 2011 An 674 SNP-Based Linkage Map for Zebrafish Reveals Sex Determination Loci. G3 (Bethesda) 1: 3–675 9. 676
BROWN P. W., JUDIS L., CHAN E. R., SCHWARTZ S., SEFTEL A., THOMAS A., HASSOLD T. J., 2005 677 Meiotic synapsis proceeds from a limited number of subtelomeric sites in the human male. Am 678 J Hum Genet 77: 556–566. 679
BRUNNER P. C., TORRIANI S. F. F., CROLL D., STUKENBROCK E. H., MCDONALD B. A., 2013 680 Coevolution and life cycle specialization of plant cell wall degrading enzymes in a 681 hemibiotrophic pathogen. Mol Biol Evol 30: 1337–1347. 682
BULL J. J., 1983 Evolution of sex determining mechanisms. The Benjamin/Cummings Publishing 683 Company, Inc. 684
BYRNES E. J., LI W., REN P., LEWIT Y., VOELZ K., FRASER J. A., DIETRICH F. S., MAY R. C., 685 CHATURVEDI S., CHATUVERDI S., CHATURVEDI V., CHATUVERDI V., HEITMAN J., 2011 A diverse 686 population of Cryptococcus gattii molecular type VGIII in southern Californian HIV/AIDS 687 patients. PLoS Pathog 7: e1002205. 688
CHARLESWORTH B., CHARLESWORTH D., 2000 The degeneration of Y chromosomes. Philos Trans 689 R Soc Lond, B, Biol Sci 355: 1563–1572. 690
CHERRY J. M., BALL C., WENG S., JUVIK G., SCHMIDT R., ADLER C., DUNN B., DWIGHT S., RILES L., 691 MORTIMER R. K., BOTSTEIN D., 1997 Genetic and physical maps of Saccharomyces 692 cerevisiae. Nature 387: 67–73. 693
COOP G., MYERS S. R., 2007 Live hot, die young: transmission distortion in recombination 694 hotspots. PLoS Genet 3: e35. 695
COWGER C., BRUNNER P. C., MUNDT C. C., 2008 Frequency of sexual recombination by 696 Mycosphaerella graminicola in mild and severe epidemics. Phytopathology 98: 752–759. 697
COWGER C., MCDONALD B. A., MUNDT C. C., 2002 Frequency of Sexual Reproduction by 698 Mycosphaerella graminicola on Partially Resistant Wheat Cultivars. Phytopathology 92: 1175–699 1181. 700
CROLL D., MCDONALD B. A., 2012 The accessory genome as a cradle for adaptive evolution in 701 pathogens. PLoS Pathog 8: e1002608. 702
CROLL D., ZALA M., MCDONALD B. A., 2013 Breakage-fusion-bridge cycles and large insertions 703 contribute to the rapid evolution of accessory chromosomes in a fungal pathogen. PLoS Genet 704 9: e1003567. 705
CUTTER A. D., PAYSEUR B. A., 2013 Genomic signatures of selection at linked sites: unifying the 706 disparity among species. Nat Rev Genet 14: 262–274. 707
DANECEK P., AUTON A., ABECASIS G., ALBERS C. A., BANKS E., DEPRISTO M. A., HANDSAKER R. E., 708 LUNTER G., MARTH G. T., SHERRY S. T., MCVEAN G., DURBIN R., 1000 GENOMES PROJECT 709 ANALYSIS GROUP, 2011 The variant call format and VCFtools. Bioinformatics 27: 2156–2158. 710
DEPRISTO M. A., BANKS E., POPLIN R., GARIMELLA K. V., MAGUIRE J. R., HARTL C., PHILIPPAKIS A. 711 A., DEL ANGEL G., RIVAS M. A., HANNA M., MCKENNA A., FENNELL T. J., KERNYTSKY A. M., 712 SIVACHENKO A. Y., CIBULSKIS K., GABRIEL S. B., ALTSHULER D., DALY M. J., 2011 A framework 713 for variation discovery and genotyping using next-generation DNA sequencing data. Nat Genet 714 43: 491–498. 715
DIDELOT X., ACHTMAN M., PARKHILL J., THOMSON N. R., FALUSH D., 2007 A bimodal pattern of 716

30
relatedness between the Salmonella Paratyphi A and Typhi genomes: Convergence or 717 divergence by homologous recombination? Genome Res 17: 61–68. 718
DROUAUD J., 2005 Variation in crossing-over rates across chromosome 4 of Arabidopsis thaliana 719 reveals the presence of meiotic recombination “hot spots.” Genome Res 16: 106–114. 720
DURET L., ARNDT P. F., 2008 The impact of recombination on nucleotide substitutions in the 721 human genome. PLoS Genet 4: e1000071. 722
DURET L., GALTIER N., 2009 Biased gene conversion and the evolution of mammalian genomic 723 landscapes. Annu Rev Genom Hum G 10: 285–311. 724
ETTER P. D., BASSHAM S., HOHENLOHE P. A., JOHNSON E. A., CRESKO W. A., 2011 SNP discovery 725 and genotyping for evolutionary genetics using RAD sequencing. Methods Mol. Biol. 772: 157–726 178. 727
FARRER R. A., WEINERT L. A., BIELBY J., GARNER T. W. J., BALLOUX F., CLARE F., BOSCH J., 728 CUNNINGHAM A. A., WELDON C., PREEZ DU L. H., ANDERSON L., POND S. L. K., SHAHAR-GOLAN 729 R., HENK D. A., FISHER M. C., 2011 Multiple emergences of genetically diverse amphibian-730 infecting chytrids include a globalized hypervirulent recombinant lineage. Proc Natl Acad Sci 731 USA 108: 18732–18736. 732
FISHER M. C., GARNER T. W. J., WALKER S. F., 2009 Global emergence of Batrachochytrium 733 dendrobatidis and amphibian chytridiomycosis in space, time, and host. Annu Rev Microbiol 734 63: 291–310. 735
FRASER J. A., GILES S. S., WENINK E. C., GEUNES-BOYER S. G., WRIGHT J. R., DIEZMANN S., ALLEN 736 A., STAJICH J. E., DIETRICH F. S., PERFECT J. R., HEITMAN J., 2005 Same-sex mating and the 737 origin of the Vancouver Island Cryptococcus gattii outbreak. Nature 437: 1360–1364. 738
GERTON J. L., DERISI J., SHROFF R., LICHTEN M., BROWN P. O., PETES T. D., 2000 Global mapping 739 of meiotic recombination hotspots and coldspots in the yeast Saccharomyces cerevisiae. Proc 740 Natl Acad Sci USA 97: 11383–11390. 741
GOODWIN S. B., M'BAREK S. B., WITTENBERG A. H. J., CRANE C. F., HANE J. K., VAN DER LEE T. A. 742 J., GRIMWOOD J., AERTS A., ANTONIW J., BOWLER J., VAN DER BURGT A., COUTINHO P. M., 743 CSUKAI M., DEHAL P., HAMMOND-KOSACK K. E., HENRISSAT B., KILIAN A., LINDQUIST E., 744 MEHRABI R., RUDD J. J., SALAMOV A., SCHMUTZ J., SCHOUTEN H. J., SHAPIRO H., 745 STERGIOPOULOS I., TORRIANI S. F. F., DE VRIES R. P., WAALWIJK C., WARE S. B., ZWIERS L.-H., 746 OLIVER R. P., GRIGORIEV I. V., KEMA G. H. J., 2011 Finished genome of the fungal wheat 747 pathogen Mycosphaerella graminicola reveals dispensome structure, chromosome plasticity, 748 and stealth pathogenesis. PLoS Genet 7: e1002070. 749
GRIGG M. E., BONNEFOY S., HEHL A. B., SUZUKI Y., BOOTHROYD J. C., 2001 Success and 750 virulence in Toxoplasma as the result of sexual recombination between two distinct ancestries. 751 Science 294: 161–165. 752
HAMILTON W. D., 1980 Sex versus non-sex versus parasite. Oikos 35: 282–290. 753
HASSOLD T., HUNT P., 2001 To ERR (meiotically) is human: The genesis of human aneuploidy. 754 Nat Rev Genet 2: 280–291. 755
HEINZ S., BENNER C., SPANN N., BERTOLINO E., LIN Y. C., LASLO P., CHENG J. X., MURRE C., SINGH 756 H., GLASS C. K., 2010 Simple combinations of lineage-determining transcription factors prime 757 cis-regulatory elements required for macrophage and B cell identities. Mol. Cell 38: 576–589. 758
HILL W. G., ROBERTSON A., 1966 The effect of linkage on limits to artificial selection. Genetical 759 Research 8: 269–294. 760

31
HOLT K. E., PARKHILL J., MAZZONI C. J., ROUMAGNAC P., WEILL F.-X., GOODHEAD I., RANCE R., 761 BAKER S., MASKELL D. J., WAIN J., DOLECEK C., ACHTMAN M., DOUGAN G., 2008 High-762 throughput sequencing provides insights into genome variation and evolution in Salmonella 763 Typhi. Nat Genet 40: 987–993. 764
HURLES M., 2005 How homologous recombination generates a mutable genome. Hum. Genomics 765 2: 179–186. 766
JENSEN-SEAMAN M. I., FUREY T. S., PAYSEUR B. A., LU Y., ROSKIN K. M., CHEN C.-F., THOMAS M. 767 A., HAUSSLER D., JACOB H. J., 2004 Comparative recombination rates in the rat, mouse, and 768 human genomes. Genome Res 14: 528–538. 769
JIANG H., LI N., GOPALAN V., ZILVERSMIT M. M., VARMA S., NAGARAJAN V., LI J., MU J., HAYTON K., 770 HENSCHEN B., YI M., STEPHENS R., MCVEAN G., AWADALLA P., WELLEMS T. E., SU X.-Z., 2011 771 High recombination rates and hotspots in a Plasmodium falciparum genetic cross. Genome 772 Biol 12: R33. 773
KABACK D. B., BARBER D., MAHON J., LAMB J., YOU J., 1999 Chromosome size-dependent control 774 of meiotic reciprocal recombination in Saccharomyces cerevisiae: the role of crossover 775 interference. Genetics 152: 1475–1486. 776
KARASOV T. L., HORTON M. W., BERGELSON J., 2014 Genomic variability as a driver of plant-777 pathogen coevolution? Curr Opin Plant Biol 18C: 24–30. 778
KEMA G. H. J., GOODWIN S. B., HAMZA S., VERSTAPPEN E. C. P., CAVALETTO J. R., VAN DER LEE T. 779 A. J., DE WEERDT M., BONANTS P. J. M., WAALWIJK C., 2002 A combined amplified fragment 780 length polymorphism and randomly amplified polymorphism DNA genetic kinkage map of 781 Mycosphaerella graminicola, the septoria tritici leaf blotch pathogen of wheat. Genetics 161: 782 1497–1505. 783
KEMA G. H. J., VERSTAPPEN E. C. P., TODOROVA M., WAALWIJK C., 1996 Successful crosses and 784 molecular tetrad and progeny analyses demonstrate heterothallism in Mycosphaerella 785 graminicola. Curr Genet 30: 251–258. 786
KONG A., GUDBJARTSSON D. F., SAINZ J., JONSDOTTIR G. M., GUDJONSSON S. A., RICHARDSSON B., 787 SIGURDARDOTTIR S., BARNARD J., HALLBECK B., MASSON G., SHLIEN A., PALSSON S. T., FRIGGE 788 M. L., THORGEIRSSON T. E., GULCHER J. R., STEFANSSON K., 2002 A high-resolution 789 recombination map of the human genome. Nat Genet. 790
LAMBREGHTS R., SHI M., BELDEN W. J., DECAPRIO D., PARK D., HENN M. R., GALAGAN J. E., 791 BAŞTÜRKMEN M., BIRREN B. W., SACHS M. S., DUNLAP J. C., LOROS J. J., 2009 A high-density 792 single nucleotide polymorphism map for Neurospora crassa. Genetics 181: 767–781. 793
LANGMEAD B., SALZBERG S. L., 2012 Fast gapped-read alignment with Bowtie 2. Nat Methods 9: 794 357–359. 795
LINCOLN S. E., LANDER E. S., 1992 Systematic detection of errors in genetic linkage data. 796 Genomics 14: 604–610. 797
LIVELY C. M., 2010 A Review of Red Queen Models for the Persistence of Obligate Sexual 798 Reproduction. J Hered 101: S13–S20. 799
MANCERA E., BOURGON R., BROZZI A., HUBER W., STEINMETZ L. M., 2008 High-resolution mapping 800 of meiotic crossovers and non-crossovers in yeast. Nature 454: 479–485. 801
MATHER K., 1938 Crossing-over. Biol Rev Camb Philos Soc 13: 252–292. 802
MCDONALD B. A., LINDE C., 2002 Pathogen population genetics, evolutionary potential, and 803

32
durable resistance. Annu Rev Phytopathol 40: 349–379. 804
MENKIS A., JACOBSON D. J., GUSTAFSSON T., JOHANNESSON H., 2008 The mating-type 805 chromosome in the filamentous ascomycete Neurospora tetrasperma represents a model for 806 early evolution of sex chromosomes. PLoS Genet 4: e1000030. 807
MIRZADI GOHARI A., MEHRABI R., ROBERT O., INCE I. A., BOEREN S., SCHUSTER M., STEINBERG G., 808 DE WIT P. J. G. M., KEMA G. H. J., 2014 Molecular characterization and functional analyses of 809 ZtWor1, a transcriptional regulator of the fungal wheat pathogen Zymoseptoria tritici. Mol Plant 810 Pathol 15: 394–405. 811
MORAIS DO AMARAL A., ANTONIW J., RUDD J. J., HAMMOND-KOSACK K. E., 2012 Defining the 812 Predicted Protein Secretome of the Fungal Wheat Leaf Pathogen Mycosphaerella graminicola. 813 PLoS ONE 7: e49904. 814
MORRAN L. T., SCHMIDT O. G., GELARDEN I. A., PARRISH R. C., LIVELY C. M., 2011 Running with 815 the Red Queen: host-parasite coevolution selects for biparental sex. Science 333: 216–218. 816
MORTIMER R. K., SCHILD D., CONTOPOULOU C. R., KANS J. A., 1989 Genetic map of 817 Saccharomyces cerevisiae, edition 10. Yeast 5: 321–403. 818
MUYLE A., SERRES-GIARDI L., RESSAYRE A., ESCOBAR J., GLÉMIN S., 2011 GC-biased gene 819 conversion and selection affect GC content in the Oryza genus (rice). Mol Biol Evol 28: 2695–820 2706. 821
MYERS S., BOTTOLO L., FREEMAN C., MCVEAN G., DONNELLY P., 2005 A fine-scale map of 822 recombination rates and hotspots across the human genome. Science 310: 321–324. 823
MYERS S., FREEMAN C., AUTON A., DONNELLY P., MCVEAN G., 2008 A common sequence motif 824 associated with recombination hot spots and genome instability in humans. Nat Genet 40: 825 1124–1129. 826
NACHMAN M. W., 2002 Variation in recombination rate across the genome: evidence and 827 implications. Curr. Opin. Genet. Dev. 12: 657–663. 828
NARANJO T., CORREDOR E., 2008 Nuclear architecture and chromosome dynamics in the search 829 of the pairing partner in meiosis in plants. Cytogenet Genome Res 120: 320–330. 830
NELSON M. I., HOLMES E. C., 2007 The evolution of epidemic influenza. Nat Rev Genet 8: 196–831 205. 832
O'DRISCOLL A., KILDEA S., DOOHAN F., SPINK J., 2014 The wheat–Septoria conflict: a new front 833 opening up? Trends in plant …. 834
OTTO S. P., BARTON N. H., 1997 The evolution of recombination: removing the limits to natural 835 selection. Genetics 147: 879–906. 836
OTTO S. P., LENORMAND T., 2002 Resolving the paradox of sex and recombination. Nat Rev 837 Genet 3: 252–261. 838
PETRE B., KAMOUN S., 2014 How do filamentous pathogens deliver effector proteins into plant 839 cells? PLoS Biol 12: e1001801. 840
RAFFAELE S., KAMOUN S., 2012 Genome evolution in filamentous plant pathogens: why bigger 841 can be better. Nat Rev Microbiol 10: 417–430. 842
RAFFAELE S., FARRER R. A., CANO L. M., STUDHOLME D. J., MACLEAN D., THINES M., JIANG R. H. Y., 843 ZODY M. C., KUNJETI S. G., DONOFRIO N. M., MEYERS B. C., NUSBAUM C., KAMOUN S., 2010 844

33
Genome evolution following host jumps in the Irish potato famine pathogen lineage. Science 845 330: 1540–1543. 846
ROESTI M., MOSER D., BERNER D., 2013 Recombination in the threespine stickleback genome--847 patterns and consequences. Molecular Ecology 22: 3014–3027. 848
ROSENBLUM E. B., STAJICH J. E., MADDOX N., EISEN M. B., 2008 Global gene expression profiles 849 for life stages of the deadly amphibian pathogen Batrachochytrium dendrobatidis. Proc Natl 850 Acad Sci USA 105: 17034–17039. 851
STAJICH J. E., WILKE S. K., AHRÉN D., AU C. H., BIRREN B. W., BORODOVSKY M., BURNS C., 852 CANBÄCK B., CASSELTON L. A., CHENG C. K., DENG J., DIETRICH F. S., FARGO D. C., FARMAN M. 853 L., GATHMAN A. C., GOLDBERG J., GUIGÓ R., HOEGGER P. J., HOOKER J. B., HUGGINS A., JAMES 854 T. Y., KAMADA T., KILARU S., KODIRA C., KÜES U., KUPFER D., KWAN H. S., LOMSADZE A., LI W., 855 LILLY W. W., MA L.-J., MACKEY A. J., MANNING G., MARTIN F., MURAGUCHI H., NATVIG D. O., 856 PALMERINI H., RAMESH M. A., REHMEYER C. J., ROE B. A., SHENOY N., STANKE M., TER-857 HOVHANNISYAN V., TUNLID A., VELAGAPUDI R., VISION T. J., ZENG Q., ZOLAN M. E., PUKKILA P. 858 J., 2010 Insights into evolution of multicellular fungi from the assembled chromosomes of the 859 mushroom Coprinopsis cinerea (Coprinus cinereus). Proc Natl Acad Sci USA 107: 11889–860 11894. 861
STEINER W. W., SMITH G. R., 2005 Natural meiotic recombination hot spots in the 862 Schizosaccharomyces pombe genome successfully predicted from the simple sequence motif 863 M26. Mol Cell Biol 25: 9054–9062. 864
STUKENBROCK E. H., MCDONALD B. A., 2008 The origins of plant pathogens in agro-ecosystems. 865 Annu Rev Phytopathol 46: 75–100. 866
THRALL P. H., LAINE A.-L., RAVENSDALE M., NEMRI A., DODDS P. N., BARRETT L. G., BURDON J. J., 867 2012 Rapid genetic change underpins antagonistic coevolution in a natural host-pathogen 868 metapopulation. Ecol Lett 15: 425–435. 869
TORRIANI S. F. F., STUKENBROCK E. H., BRUNNER P. C., MCDONALD B. A., CROLL D., 2011 870 Evidence for extensive recent intron transposition in closely related fungi. Curr Biol 21: 2017–871 2022. 872
TORRIANI S. F., BRUNNER P. C., MCDONALD B. A., SIEROTZKI H., 2009 QoI resistance emerged 873 independently at least 4 times in European populations of Mycosphaerella graminicola. Pest 874 Manag. Sci. 65: 155–162. 875
TSAI I. J., BURT A., KOUFOPANOU V., 2010 Conservation of recombination hotspots in yeast. Proc 876 Natl Acad Sci USA 107: 7847–7852. 877
WEBSTER M. T., HURST L. D., 2012 Direct and indirect consequences of meiotic recombination: 878 implications for genome evolution. Trends Genet 28: 101–109. 879
WENDTE J. M., MILLER M. A., LAMBOURN D. M., MAGARGAL S. L., JESSUP D. A., GRIGG M. E., 2010 880 Self-mating in the definitive host potentiates clonal outbreaks of the apicomplexan parasites 881 Sarcocystis neurona and Toxoplasma gondii. PLoS Genet 6: e1001261. 882
WILSON M. A., MAKOVA K. D., 2009 Genomic analyses of sex chromosome evolution. Annu Rev 883 Genom Hum G 10: 333–354. 884
WITTENBERG A. H. J., VAN DER LEE T. A. J., BEN M'BAREK S., WARE S. B., GOODWIN S. B., KILIAN A., 885 VISSER R. G. F., KEMA G. H. J., SCHOUTEN H. J., 2009 Meiosis drives extraordinary genome 886 plasticity in the haploid fungal plant pathogen Mycosphaerella graminicola. PLoS ONE 4: 887 e5863. 888

34
WU T. C., LICHTEN M., 1995 Factors that affect the location and frequency of meiosis-induced 889 double-strand breaks in Saccharomyces cerevisiae. Genetics 140: 55–66. 890
ZHAN J., KEMA G., WAALWIJK C., MCDONALD B. A., 2002 Distribution of mating type alleles in the 891 wheat pathogen Mycosphaerella graminicola over spatial scales from lesions to continents. 892 Fungal Genet Biol 36: 128–136. 893
ZHAN J., LINDE C. C., JÜRGENS T., MERZ U., STEINEBRUNNER F., MCDONALD B. A., 2005 Variation 894 for neutral markers is correlated with variation for quantitative traits in the plant pathogenic 895 fungus Mycosphaerella graminicola. Molecular Ecology 14: 2683–2693. 896
ZHAN J., MUNDT C. C., MCDONALD B. A., 2007 Sexual reproduction facilitates the adaptation of 897 parasites to antagonistic host environments: Evidence from empirical study in the wheat-898 Mycosphaerella graminicola system. International Journal for Parasitology 37: 861–870. 899
900
901
902
903

35
Figure legends 904 905
Figure 1: Physical distance between all detected recombination events per progeny 906
summarized for each of the two analyzed crosses (3D1x3D7 and 1A5x1E4). A short 907
distance between recombination events in a progeny may indicate a potential 908
noncrossover. In this case the two recombination events would be boundaries of a gene 909
conversion tract. In order to conservatively identify true crossovers, a minimum distance of 910
50 kb was required for a recombination event to be considered a crossover (shaded in 911
black) instead of a putative noncrossover event (shaded in grey). All analyses of 912
recombination rates and hotspots are based on recombination events at least 50 kb from 913
the nearest neighboring recombination event. 914
915
Figure 2: Summary statistics of the genetic maps constructed for the two crosses 916
3D1x3D7 and 1A5x1E4. A) Genetic map length per chromosome. Horizontal hatches 917
show the positions of genetic markers in the genetic maps. In cross 3D1x3D7, four 918
accessory chromosomes were shared between the parental isolates and could therefore 919
be used for map construction. In cross 1A5x1E4, seven accessory chromosomes were 920
shared between the parental isolates. B) Recombination rates per chromosome expressed 921
as cM per Mb. Genetic maps for the two crosses are distinguished by color. See panel C 922
for color legend. C) Number of genetic map positions per chromosome (minimal set of 923
markers separated by at least one crossover). 924
925
Figure 3: Recombination landscape of the plant pathogenic fungus Zymoseptoria 926
tritici. Recombination rates were estimated in two crosses by calculating genetic map 927
distances (in cM) for non-overlapping segments of 20 kb along chromosomes. Variations 928
in recombination rates are shown for cross 1A5x1E4 (blue) and 3D1x3D7 (red). 929
Recombination rates on accessory chromosomes are shown only for chromosomes that 930
36
were found in both parental isolates of a cross. Chromosome 13 contains a region for 931
which recombination rate variations could not be accurately determined (see Methods). 932
933
Figure 4: Recombination rate variations in relation to telomere distance. 934
Recombination rates were calculated in non-overlapping 10 kb segments for core 935
chromosomes. Recombination rates were then summarized into 5% bins representing the 936
relative distance to the telomere end. The boxplot shows the median recombination rate 937
(horizontal bar), the 25% and 75% quartiles as a solid box and the 5% and 95% quantiles 938
as vertical lines. Recombination rates were highest in both crosses for subtelomeric 939
distances of 10-15% of the chromosome length. Core chromosomes vary from 1.19 – 6.09 940
Mb in length. 941
942
Figure 5: Differences in gene density and sequence diversity in the recombination 943
hotspots and non-hotspots of crosses 3D1x3D7 and 1A5x1E4. For both panels the 944
boxplots show the median of the distribution (horizontal bar), the 25% and 75% quartiles 945
as a solid box and the 5% and 95% quantiles as vertical lines. A) Differences in coding 946
sequence density between hotspot segments (each 10 kb) and segments of the genomic 947
background (“non-hotspots”) divided into 10 kb segments. B) Differences in diversity 948
between the two parental genomes (% SNP) assessed for hotspot segments (each 10 kb) 949
and segments of the genomic background (“non-hotspots”) divided into 10 kb segments. 950
951
Figure 6: The top enriched oligonucleotide motifs that were identified by a de novo 952
motif search in the recombination hotspots of crosses 3D1x3D7 and 1A5x1E4. The 953
enrichment of sequence motifs in recombination hotspots was tested using a 954
hypergeometric test. The genomic background was segmented and binned according to 955
GC-content. Enrichment tests were performed using weighted background sequences 956

37
reflecting the GC-content distribution found in hotspots. Weighting background sequences 957
avoided spurious enrichments due to differences in GC-content between the genomic 958
background and hotspots. 959
960
Figure 7: Recombination rates estimated from linkage analyses in crosses 961
compared to linkage disequilibrium estimated from population resequencing data. 962
Recombination rates between adjacent SNP markers were calculated as cM per Mb in 963
crosses 3D1x3D7 and 1A5x1E4. Resequencing data of field isolates from the same 964
regional population as the parents was used to calculate linkage disequilbria (r2). For this, 965
whole genome sequencing data was analyzed for SNPs segregating at identical positions 966
in the genome as in the SNP dataset generated for the two crosses. Different symbols are 967
used to show data points from core and accessory chromosomes. 968
969

38
Tables 970 971
Table 1: Summary of restriction-associated DNA sequencing (RADseq) SNP markers 972
used for the construction of genetic maps. The average genotyping rate of the SNP 973
markers is shown as an average per chromosome and cross. Chromosomes 1-13 are core 974
chromosomes found in all strains of the species, chromosomes 14-21 are accessory. 975
976
977
Cross 3D1x3D7 (227 progeny)
Cross 1A5x1E4 (214 progeny)
Chromosome Number of SNPs Genotyping rate (%) Number of SNPs Genotyping rate (%)
1 4697 96.16 4629 96.15
2 2486 97.26 2290 96.28
3 2299 97.31 2233 96.02
4 1614 96.87 1447 96.08
5 1634 95.62 1778 96.16
6 1398 97.03 1349 96.28
7 1379 97.27 1401 96.16
8 1576 96.54 1537 96.10
9 1448 97.08 1309 95.62
10 1013 97.09 1115 95.95
11 920 97.26 982 96.08
12 923 96.90 775 95.50
13 806 96.95 721 95.94
14 - - 118 90.97
15 - - 461 93.93
16 193 95.49 109 92.37
17 395 93.72 - -
18 - - 110 90.93
19 461 97.06 411 94.13
20 321 94.25 271 94.63
21 - - 238 93.58
978
979
980

39
Table 2: Overview of genetic maps constructed in two crosses of Zymoseptoria 981
tritici. For each chromosome the physical length (in kb), genetic map length (cM) and the 982
number of genetic map positions (minimal number of markers separated by at least one 983
crossover) is shown for each chromosomal map. The recombination rate per chromosome 984
is indicated in cM/Mb. 985
986
987
Cross 3D1x3D7 (227 progeny)
Cross 1A5x1E4 (214 progeny)
Chromosome Physical length (kb)
Genetic map length
(cM)
Recombination rate (cM per Mb)
Genetic map
positions
Genetic map length
(cM)
Recombination rate (cM per Mb)
Genetic map
positions 1 6088.8 351.58 57.74 287 255.62 41.98 211 2 3860.1 250.74 64.96 177 165.97 43.00 148 3 3505.3 240.19 68.52 176 183.56 52.37 134 4 2880.0 217.03 75.36 180 147.23 51.12 111 5 2861.8 201.39 70.37 161 156.52 54.69 117 6 2675.0 188.22 70.36 124 174.2 65.12 109 7 2665.3 166.57 62.50 109 143.18 53.72 102 8 2443.6 165.56 67.75 124 132.77 54.33 91 9 2142.5 169.94 79.32 120 127.35 59.44 84
10 1682.6 140.97 83.78 86 108.63 64.56 77 11 1624.3 154.48 95.11 76 113.57 69.92 76 12 1462.6 138.58 94.75 89 96.74 66.14 68
13 1185.8 121.46 102.43 64 97.56 82.28 72 14 773.1 - - - 33.22 42.97 19 15 639.5 - - - 45.98 71.90 35 16 607.0 49.24 81.11 29 42.26 69.62 22 17 584.1 53.34 91.32 30 - - - 18 573.7 - - - 22.08 38.49 17 19 549.9 58.39 106.19 30 48.36 87.95 30 20 472.1 55.94 118.49 30 47.58 100.78 24 21 409.2 - - - 16.54 40.42 15 all 39’686.3 2723.6 1892 2158.9 1592
988
989
990

40
Table 3: Overview of crossover counts per chromosome in progeny of cross 1A5x1E4 and 991
3D1x3D7. 992
993
Cross 3D1x3D7 Cross 1A5x1E4
Chromosome Median
crossover count
Mean crossover
count
Crossing over count
per Mb
Median crossover
count
Mean crossover
count
Crossing over count
per Mb 1 3 3.34 0.55 2 2.46 0.40 2 2 2.42 0.63 2 1.62 0.42 3 2 2.30 0.65 2 1.76 0.50 4 2 2.10 0.73 1 1.43 0.49 5 2 1.89 0.66 1 1.51 0.53 6 2 1.79 0.67 2 1.67 0.63 7 2 1.61 0.60 1 1.39 0.52 8 2 1.59 0.65 1 1.29 0.53 9 2 1.61 0.75 1 1.22 0.57
10 1 1.33 0.79 1 1.04 0.62 11 1 1.45 0.90 1 1.08 0.66 12 1 1.33 0.91 1 0.92 0.63 13 1 1.14 0.96 1 0.94 0.79 14 - - - 0 0.29 0.37 15 - - - 0 0.43 0.67 16 0 0.45 0.75 0 0.38 0.62 17 0 0.48 0.83 - - -
18 - - - 0 0.20 0.34 19 1 0.54 0.99 0 0.45 0.82
20 0 0.48 1.03 0 0.42 0.89
21 - - - 0 0.15 0.38 ,994
,995
,996 997
998
999

41
Table 4: Genes with a predicted function in virulence located in recombination 1000
hotspots of Zymoseptoria tritici. Functional predictions and population genetic analyses 1001
of cell wall degrading enzymes and small secreted proteins are summarized where 1002
available (GOODWIN et al. 2011; MORAIS DO AMARAL et al. 2012; BRUNNER et al. 2013). 1003
1004
Cross Protein ID Protein characteristics Chromosome and position
3D1x3D7 107758 Small secreted tandem repeat protein (TRP18) 1 5652012-5653092
1A5x1E4 90262 Small, secreted protein 1 5790864-5792208
3D1x3D7 99331 Cutinase MgCUT4, under diversifying selection in Z. tritici for evasion of host 2 3479067-3479856
3D1x3D7 & 1A5x1E4 104283 Small, cysteine-rich secreted protein 4 2371447-2372597
3D1x3D7 42164 Small, secreted protein (ZPS1 family) 5 224006-225198
1A5x1E4 105351 Small, secreted protein 8 444217-444909
3D1x3D7 105728 Beta-xylosidase MgXYL4, under purifying selection in Z. tritici for substrate optimization 9 989316-990401
3D1x3D7 & 1A5x1E4 110790 Small, secreted protein 9 1270903-1271945
3D1x3D7 & 1A5x1E4 95797 Small, secreted protein 9 1274185-1275470
3D1x3D7 111130 Hemi-cellulase (ABFa alpha-L-arabinofuranosidase-A) 10 1379647-1381988
3D1x3D7 111451 Secreted alpha-1,2-mannosyltransferase ALG 12 554075-555902
1A5x1E4 97702 Aspartic protease 16 71035-72069
1005
1006

3D1x3D7 1A5x1E4
0
100
200
300
400
500
1 2 5 10 20 50 100 200 50010002000 5000 1 2 5 10 20 50 100 200 50010002000 5000
Distance between recombination events (kb)
Num
ber o
f eve
nts
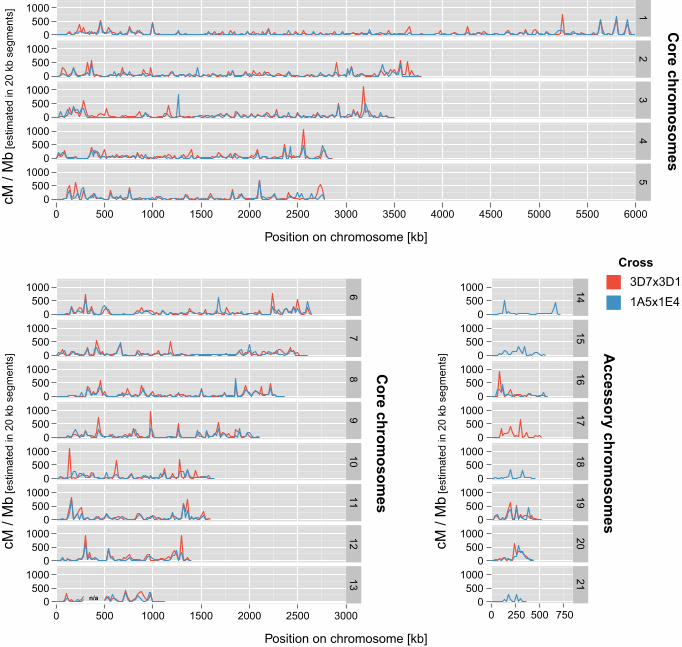
0500
1000
0500
1000
0500
1000
0500
1000
0500
1000
0500
1000
0500
1000
0500
1000
0500
1000
0500
1000
0500
1000
0500
1000
5001000
12
34
5
67
89
1011
1213
0 500 1000 1500 2000 2500 3000
Position on chromosome [kb]
cM /
Mb
[est
imat
ed in
20
kb s
egm
ents
]
0
0500
1000
0500
1000
0500
1000
0500
1000
0500
1000
0500
1000
0500
1000
0500
1000
1415
1617
1819
2021
0 500
0 500 1000 1500 2000 2500 3000 3500 4000 4500 5000 5500 6000
Position on chromosome [kb]
250 750
3D7x3D11A5x1E4
Cross
Core chromosom
es
Core chromosom
es
Accessory chromosom
es
cM /
Mb
[est
imat
ed in
20
kb s
egm
ents
]
cM /
Mb
[est
imat
ed in
20
kb s
egm
ents
]
n/a

1 2 3 4 5 6 7 8 9 10 11 12 13 14 15 16 18 19 20 210
100
200
Chromosomes
Gen
etic
map
leng
th (c
M)
1 2 3 4 5 6 7 8 9 10 11 12 13 16 17 19 200
100
200
300
Chromosomes
Gen
etic
map
leng
th (c
M)
A Cross 3D7x3D1
Cross 1A5x1E4
B C
0
100
200
300
1 2 3 4 5 6 7 8 9 10 11 12 13 14 15 16 17 18 19 20 21
Num
ber o
f gen
etic
map
pos
itions
0
50
100
1 2 3 4 5 6 7 8 9 10 11 12 13 14 15 16 17 18 19 20 21
Reco
mbin
ation
rate
(cM
/Mb)
Chromosomes Chromosomes
3D7x3D1
1A5x1E4
Cross

0-5 5-10 10-15 15-20 20-25 25-30 30-35 35-40 40-45 45-50Distance to closest telomere (% chromosome length)
Rec
ombi
natio
n ra
te (c
M /
Mb)
Rec
ombi
natio
n ra
te (c
M /
Mb)
0
100
200
300
0
100
200
300
Cross 1A5x1E4
Cross 3D1x3D7

3D1x3D71A5x1E4 1A5x1E4 3D1x3D7
●
●
●
●●
●
●
●
●
●
●
●
●
●
●
●
●
●
●●●
●●
●
●
●
●
●
●
●
●
●
●
●●●
●
●
●
●●●
●
●●
●
●
●
●
●
●
●
●●
●
●
●
●
●
●
●●
●
●
●
●●
●
●
●
●
●
●
●
●
●
●
●●
●
●
●
●
●
●
●
●
●
●
●
●
●
●
●
●
●
●
●
●
●
●
●●
●
●
●
●
●
●
●
●
●
●
●
●
●
●
●
●●
●
●●
●
●●
●●
●
●
●●
●
●●
●
●
●
●
●
●
●
●
●
●
●
●
●
●●
●
●
●
●●
●
●
●
●●
●●
0
1
2
3
4
5
Div
ersi
ty b
etw
een
pare
ntal
gen
omes
(% S
NP)
Hotspots Non−hotspots Hotspots Non−hotspot Hotspots Non−hotspots Hotspots Non−hotspot
A B
0
10
20
30
40
50
60
70
80
90
100
Cod
ing
sequ
ence
den
sity
(% C
DS)

Cross 3D1x3D7
Cross 1A5x1E4
C
TA
GATGATGTAGCATGTAGC
GGTAGATG
Background sequenceswith motif (%)
Hotspots withmotif (%)
Enrichment pvalue
2
1
0
bits
core
motif length (10 bp)
22.42 53.85 1e-14
1.62 21.05 1e-13
13.94 48.68 1e-12
2.61 23.68 1e-12
CAGAGG
TCAC
ATGC
A
GTAGTCAC
ATGATCGT
C
AGCAGC
GTA
TGATGTGGC
GTGCGTAGCTGA
GTGACGAATGCGCTGCGTGGT
2
1
0
bits
core
motif length (12 bp)
2
1
0
bits
core
motif length (12 bp)
2
1
0
bits
core
motif length (12 bp)

●
●
●●
●●●●●●
●
●
●
●
●
●
●
●
●
●●●
●
●
●●●
●
●
●
●
●
●
●
●
●●●●
●●●●●
●
●
●●
●
●●●
●
●
●
●
●
●
●
●
●
●
●
●
●
●
●●
●●
●●
●
●●
●●●●●
●
●
●
●
●
●
●
●●
●●●
●●●
●●
● ●
●
●
●
●
●
●
●
●●
●
●●
●
●●
●●●●
●
●●
●●
●
●
●
●
●
●
●
●
●
●
●●
●
●
●●
●
●●
●
●
●●●
●
●
●●●
●●●
●●
●
●●●●
●
●●
●
●
●
●
●●●●
●
●
●
●●●●●●
●
●●●
●
●
●●
● ●
●
● ●
●
●
●
●
●
●
●
●
●
●
●
●
●●
●
●
●●
●
●
●
●●
●
●●
●●
●●●
●
●●●
●
●
●●
●
●●
●
●
●
●
●
●●●●
●
●
●●●
●
●
●
●●
●
●●
●
●●●
●
●●
●
●●●
●
●
●●
●●
●
●
●
●
●●
●
●
●
●
●
●
●
●
●
●
●
●
●
●
●
●●
●
●
●●
●
●
●
●●
●
●
●
●
●● ●
●
●
●
●
●
●
●
●
●
●
●●
●●
● ●
●
●
●
●
●
●
●●
●●
●
●
●
●
●
●
●
●●
●
●
●
●
●
●
●●
●
●
●●●
●
●●
●
●
●●
●
●
●
●
●
●
●●●
●
●
●
●●
●●
●
●
●
●●●
●●●
●●
●
●
●
●●
● ●●●●
●
●
●
●
●
●●
●
●
●
●●●●●●
●
●
●●
●●●●
●
●●
●
●●
●
●
●
●
●
●●
●
●
●●
●
●
●●
●
●
●
●
●
●
●
●
●●
●
●
●
●
●
●
●
●
●
●
●●●
●●●
●
●
●●
●
●
●
●
●
●
●
●
●●●●
●
●
●●
●●●
●
●
●
●
●
●
●
●
●●●
●
●
●
●
●●
●
●
●●
●
●
●
●
●
●
●●●
●
●
●
●●
●●
●
●
●●
●●
●
●●●●●
●
●
●
●
●●
●
●
●
●
●
●
●
●
●
●
●●
●● ●
●
●
●
●
●
●
●
●
●
●
●
●
●
●●
●
●
●
●
●
●
●●●●
● ●
●
● ● ●
●
●
●
●
●●
●
●
●
●
●
●●
●●
●
●
●
●
●●●●
●
●
●
●
●
●
●
●
●●
●
●●●
●
●
●
●
●
●
●
●
●●●●
●
●●
●
●
●
●
●●
●●
●
●
●
●
●
●
●
●
●
●
●
●●
●
●
●
●
●
●
●●
●●
●●
●
●
●
●
●●●●●
●
●
●
●
●
●●
●●
●
●
●●●
●●
●●●
●●
●
●●●
●
●
●●●
●
●●
●
●●●●●
●
●●●
●
●●●
●
●
●
●
●
●●
●●●
●
●●
●●●●
●●●●●
●●
●●
●
●
●
●
●
●
●
●
●●
●
●
●
●
●●
●●
●
●
●
●●
●●●
●●●●
●
●
●
●
●
●
●
●
●
●●●
●
●
●●●
●
●
●
●
●
●●
●●●
●
●
●
●
●
●●●
●
●●●●●●
●
●
●
●
●
●
●
● ●●
●●
●
●
●
●●
●
●
●
●
●
●
●●●●
●
●
●●●
●
●●●
●
●
●
●●
●
●
●●●
●●
●
●
●●●
●
●●●●●
●
●
●
●
●
●
●●
●
●
●
●
●●●●
●
●
●
●
●
●
●●
●
●
●
●
●
●●●
●
●
●●
●
●●
●
●
●●
●
●
●
●
●
●●
●
●
●
●
●
●
●
●
●
●
●●
●
●
●
●
●
●●
●
●
●●
●
●●●
●
●
●
●●
●
●
●●
●
●
●
●
●
●
●
●
●
●●
●
●●
●
●
●
●●
●
●
●
●
●●
●
●
●
●
●
●●●
●
●●
●
●
●
●
●
●
●
●
●
●
●
●
●
●
●●●
●
●●●●
●
●
●
●●●
●●●
●
●
●
●●
●●
●
●
●●
●
● ●
●
●
●
0.00
0.25
0.50
0.75
1.00
0 250 500 750 1000
●●
●
●
●●
●
●●
●
●
●
●
●
●
●
●●
●
●
●●
●
●
●●
●●●
●
●
●
●
●
●
●
●●
●
●
●
●
●
●
●
●
●
●●
●
●
●
●
●
●
●
●●●●●
●
●
●●
●●
●
●
●
●
●●
●●
●
●
●
●
●
●
●
●
●●
●●
●
●●
●●
●
●
●●●
●
●
●
●●
●
●
●
●
●
● ●●
●
●
●
●
●●
●●●
●
●
●
●
●●●●
●
●●●
●●
●●
●●
●●●
●●
●
●●
●
●
●
●
●● ●●●
●
●
●●
●●●●●
●
●
●
●
●●●
●
●●
●
●●●●
●
●
●
●
●
●
●
●
●●
●●
●
●●●
●
●
●●
●
●●●
●
●
●
●
●
●
●
●
●
●
●
●
●
●
●
●
●
●●
●
●
●
●●
●
●
●●
●
●●
●
●●
●
● ●
●
●
●
●
●
●
●
●●
●
●
●● ●●
●
●
●
●
●
●●
●● ●
●
●
●
●
●
●
●
●
●
●
●
●
●
●
●
●
●
●
●
●
●
● ●
●
●
●
●●
●
●
●
●
●
●
●
●
●
●
●●●●●
●
●
●
●
●●
●● ●●●●
●●●
●
●
●
●●
●
●
●●
●
●
●
●
●
● ●●●
●●
●
●●
●●
●
●●
●
●
●
●
●●
●
●
●
●●
●
●
●
●
●
●
●●●
●
●
●●●●
●
●
●
●
●
●
●
●●
●
●
●
●
●●●
●
●
●●
●●
●
●
●
●
●●
●
●●
●
●
●
●
●●
●
●
●
●●
●●
●●●
●
●
●●●●
●
●
●
● ●●●●
●
●
●●
●
●
●
●
●
●●
●●●
●
●
●
●●
●●
●●●●
●
●
●
●●
●
●
●
●
●
●
●●●
●
●
●
●
●●
●
●
● ●●●●
●
●
●
●
●
●●
●
●
●
●●●
●
●
●
●
●
●
●
●
●
●
●●
●
●
●
●
●
●
●
●●
●
●●
●
●●
●●
●
●
●●
●
●
●● ●
●
●
●
●●●
●
●
●
● ●●
●
●●
●
●●
●●
●
●●
●
●
●●
●
●
●
●
●
●●●●
●
●●
●
●
●●
●
●
●
●●●
●
●
●●
●●
●
●
●
●
●
●
●
●
●●
●
●
●
●
●●
●●
●●●●●
●
●
●
●
●●
●●●
●
●
●
●
●
●
●●
●
●
●●
●
●
●
●
●
●
●●
●
●
●●
●
●
●●
●
●
●
●
●
●
●
●
●
●●●
●
●●
●
●
●●●
● ●●● ●●
●
●●
●●
●
●
● ●
●
●
●
●●
●
●
●
●●
●●●●
●
●●
●●
●
●
●
●
●
●
●
●
●●
●
●
●
●
●
●
●
●
●
●●●
●●
●
●●●
●
●
●●●
●
●
●
●●●●
●
●
●
●
●
●
●
●
●
●
●
●●
●
●●
●
●
●
●
●
●
●
●●●
●●
●
●●
●
●
●
●
●
●
●●
●●
●
●
●
●
●
●●
●
●
●
●
●
●●●●●
●
●●●
●
●●
●
●
●
●
●●●
●
●
●
●
●
●
●
●
●●
●
●
●
●
●
●
●●
●●
●●
●
●
●
●
●●●
●●
●
●
●
●
●●
●●
●
●
●
●
●
●
●●
●
●
●
●
●
●●
●●
●
●
●●
●
●●
●●
●
●
●●
●
●
●
●
●
●●
●●
●
●
●●
●
●
●
●
●● ●
●
●●●
●
●
●●●
●
●
●
●
●
●
●
●
●
●●
●
●
●
●
●●
●●
●
●
●●
●
●
●
●
●
●
●
●
●
●●
●●
●●
●
●
●
●
●
●
●
●
●
●●●
●
●
●
●●
●
●
●
●
●
●●
●
●
●
●
●●
●
●●
●●
●
●●●
●
●
●
●
●
●
●
●●●●
●●
●
●
●
●
●
●
●
●●●
●●●
●
●●●
●
●
●
●●
●
●●
●●
●
●
●●
●
●
●
●
●
●●●
●●
●
●
●
●●
●
●
●
●
●
●
●
●
●
●
●● ●
●
●●●
● ●
●
●
●
●
●
●●●
●
●
●●●
●
●●●●●
●
●
●
●●
●
●
●
●
●
●●●●
●
●
●
●
●
●
●
●●●●
●
●
●●
●
●
●●●
●
●
●
●
●
●
●
●●●
●
●
●
●
●
●
●●●
●
●
●●
●
●●●
●
●
●●●
●
●
●●
●
●●●
●
●●●●
●
●●
●●
●
●
●
●
●
●●●●
●●
●●●●
●
● ●
●
●●
●
●
●
●
●
●
●
●
●
●●
●
●
●
●
●
●
●
●●●
●●
●
●
●
●
●
●
●
●
●●
●●●
●
●
●
●
●●
●
●
●●
●
●
●
●
●
●
●
●
●
●
●
●●
●
●
●●●●
●●●
●●
●●
●
●●
●
●●●●●●
●●
●
●
●
●●
●●●
●●
●
●
●
●
●
●
●●
●
●
●
●●
●
●
●
●
●●
●
●●
●
●●●●●●●
●
●●
●●●
●
●
●
●
●
●
●●●●● ●●
●
●
●
●
●
●●0.00
0.25
0.50
0.75
1.00
0 250 500 750 1000
Link
age
dise
quilib
rium
(r2 )
[Pop
ulat
ion
rese
quen
cing
]
Link
age
dise
quilib
rium
(r2 )
[Pop
ulat
ion
rese
quen
cing
]
Recombination rate between adjacent markers (cM/Mb)[Linkage analyses in crosses]
Cross 3D1x3D7
Cross 1A5x1E4
Accessory chromosomes
Core chromosomes
●