the impact of rising food and fuel prices on small business · the impact of rising food and fuel...
TRANSCRIPT


2
Contents 1. Background .............................................................................................................................................................................................................15
1.1 History and Profile of FABCOS........................................................................................................................................................................15
1.2 Why this report? ................................................................................................................................................................................................15
1.3 Scope of Work and Deliverables......................................................................................................................................................................16
1.4. Approach and Methodology ............................................................................................................................................................................17
1.4.1 Oil Price Review........................................................................................................................................................................................17
1.4.2 Food Price Review....................................................................................................................................................................................18
2. Analysis and Impact of Fuel Prices .........................................................................................................................................................................19
2.1. The Economic Significance of Oil....................................................................................................................................................................19
2.2. Historic Oil Prices .............................................................................................................................................................................................19
2.3. From the Oil Price to the Petrol Price..............................................................................................................................................................22
2.3.1 Calculating the Petrol Price.......................................................................................................................................................................22
2.4. Fuel Price Drivers.............................................................................................................................................................................................24
2.5. The impact on the National Economy and on Small Businesses..................................................................................................................25
2.6. Fuel Price Forecast ..........................................................................................................................................................................................28
2.7. What About Biofuels? ......................................................................................................................................................................................28
3. Analysis and Impact of Food Prices.......................................................................................................................................................................29
3.1. Food price Inflation in South Africa..................................................................................................................................................................29
3.2. The Impact of Rising Food Prices on Small Businesses...............................................................................................................................35
3.3. Food Price Forecasts.......................................................................................................................................................................................38
3.4. The International Response ............................................................................................................................................................................40
3.4.1. Interventions to ensure household food supply through safety nets...................................................................................................40
3.4.2. Ensuring household food security by lowering domestic food prices..................................................................................................40
3.4.3. Measures to stimulate medium-term food grain supply.......................................................................................................................41
4. Conclusions and Recommendations......................................................................................................................................................................42
4.1 Recommendations on Food Production..........................................................................................................................................................42
4.1.1 Increasing the level of Food Production...................................................................................................................................................43
4.1.2 Increasing access to food for the poor.....................................................................................................................................................44

3
4.1.3 Greater transparency................................................................................................................................................................................44
4.2. Recommendations Pertaining to the Business Operators........................................................................................................................45
4.2.1. Tapping onto current government support and working with the authorities........................................................................................45
4.2.2. Developing Business Skills......................................................................................................................................................................46
4.2.3. Developing a locational advantage .........................................................................................................................................................47
4.3 Recommendations on Food Retailing..............................................................................................................................................................48
4.3.1 Managing Relationships with Producers and Suppliers..........................................................................................................................48
4.3.2 Managing logistics including distribution and stock.................................................................................................................................50
4.3.3 Developing and maintaining customer relationships...............................................................................................................................50
Tables Table 1: History of Oil Price Shocks............................................................................................................................................................................19
Table 2: Growth Rate of Oil Prices..............................................................................................................................................................................20
Table 3: Composition of Petrol Pump Price................................................................................................................................................................23
Table 4: Illustrative scale of transport cost reductions from using increasingly larger trucks...................................................................................26
Table 5: CPIF Weights.................................................................................................................................................................................................29
Table 6: Price Level Increases – key basic food items ..............................................................................................................................................33
Table 7: Distribution of household annual expenditure on food ................................................................................................................................36
Figures Figure 1: Historic Oil Prices..........................................................................................................................................................................................20
Figure 2:$/bbl Price vs. ZAR/ Litre Price .....................................................................................................................................................................22
Figure 3: CPI and CPI-F (Year 2000 = 100)...............................................................................................................................................................30
Figure 4: CPIF-F – High Growth Items .......................................................................................................................................................................31
Figure 5: CPI-F – Slow Growth Items .........................................................................................................................................................................32
Figure 6: CPI – Rural and Urban.................................................................................................................................................................................37
Figure 7: Cereal Prices ................................................................................................................................................................................................38
Figure 8: Maize Prices in South Africa ........................................................................................................................................................................39
Figure 9: Wheat Prices in South Africa .......................................................................................................................................................................39
4
Abbreviations
ACHIB African Co-operative for Hawkers & Informal Businesses
ASGISA Accelerated Shared Growth Initiative of South Africa
BBBEE Broad Based Black Economic Empowerment
BFAP Bureau for Food and Agricultural Policy research
BFP Basic Fuel Price
BMR Bureau for Market Research
CEF Central Energy Fund
COSATU Congress of South African Trade Unions
CPI Consumer Price Inflation
CPI-F Food Price Inflation
DME Department of Minerals and Energy
EIA Energy Information Agency
FABCOS The Foundation for African Business and Consumer Services
FAO Food and Agricultural Organisation
FMCGs Fast Moving Consumer Goods
IES Income and Expenditure Survey
NAMC National Agricultural Marketing Council
OECD The Organisation for Economic Development and Cooperation
OPEC Organisation of Petroleum Exporting Countries
SAFEX South African Futures Exchange
SAPIA South African Petroleum Industry Association
SARB South African Reserve Bank
SEDA Small Enterprises Development Agency
SMMEs Small, Medium and Micro Enterprises
SOL Survey of Logistics
StatsSA Statistics South Africa
ZAR (South African) Rand (currency)

5
Executive Summary Background FABCOS (The Foundation for African Business and Consumer Services) was established in 1988, to provide organisation to and proper representation for informal sector traders. More than 70% of FABCOS’ members are active in the small retail sector and the majority of these are operating in urban markets. Most of FABCOS’ members can be classified as small or micro enterprises, and the client base of these businesses would fall almost overwhelmingly into the lower-income categories.
Supporting and growing small enterprises is a key component not only of South Africa’s economic growth strategy, but also its Broad Based Black Economic Empowerment (BBBEE) strategy. The ability of small businesses to deal with external shocks is a key factor in their survival, and this ability can be enhanced by having:
(i) Better information and understanding of the key drivers of those shocks; and
(ii) Targeted policy interventions that work with, and not against markets.
The aim of this research project, and this report falls within these two key areas.
A limited period of time was made available to complete this project. Therefore, it was necessary to narrow our focus and, in addition, the project is based on the collection and analysis of existing data sources, such as Statistics SA and the National Agricultural Marketing Council, rather than new data collection. We did, however, have a focus working session with a group of Gauteng-based FABCOS members to supplement these sources. The focus session combined a questionnaire completed by each participant and then a more informal discussion session around the impact of rising food prices on personal and business incomes.
Fuel Prices Oil has many economic uses around the world, but its most important is in its role as a liquid fuel for most major forms of transportation of goods and persons. Fundamentally, the global oil price is determined by the global demand and supply of oil. Significantly, demand is governed by the global economic climate. Economic growth can be considered the foremost reason for increased demand, since as economies expand they require more energy sources to power this growth.
The period between 2003 and 2008 has witnessed several “price shocking” events in global oil markets. The increase in prices was largely due to the fact that, although demand for oil derivatives grew strongly over the period, the total amount of oil reserves has remained more or less the same. In addition, the major oil companies have not invested enough in building refining capacity over the period. Oil production has increased 40% over the last 20 years, yet refining capacity has only grown by 15%.
In the past two months, the collapse of global financial markets and the very real prospect of recession across the major economies have pushed the oil price back to below $70/bbl. Although this is obviously a positive
6
development, the fact that oil supplies are finite is not going to change. It is becoming quite clear that OPEC will move to reduce supply in order to prevent any long-term decline in the oil price to below $65/bbl.
The petrol price is composed of a number of elements - international and domestic. The international element, or Basic Fuel Price (BFP), is based on what it would cost a South African importer to buy petroleum from an international refinery and transport it to South Africa. The BFP includes international petroleum spot prices, in Rands; freight cost to bring product to South Africa; insurance costs; and coastal storage fees. The most important of these is obviously the international price of petroleum, which is determined by the oil price, refining costs and the exchange rate.
To get the final domestic pump price of petrol, certain domestic transport costs, government taxes and levies, and the retail and wholesale margins must be added to the BFP. However, the BFP still makes up around 61% of the petrol price and 70% of the diesel price. Government taxes account for 25% of the petrol price and 22% of the diesel price. Guaranteed margins for wholesalers and retailers make up almost 12% of the price, so allowing retailers to sell at a lower price may be one way to bring the price down, although this will probably contribute to only a very small price differential.
What about the alternatives? Sasol is the world’s biggest producer of oil from coal. It produces roughly 23% of South Africa’s petroleum needs, and does so at a price well below the current price of oil. Unfortunately, all petroleum types in South Africa are priced at import parity, that is, at the prevailing international price. This means that Sasol cannot sell its products at a price different from the regulated retail price.
The finding that ethanol manufactured from maize and sugar could be used quite easily as an alternative to petrol was initially hailed as a key breakthrough in the race to find alternative sources of energy. However, over the past year, there has been increasing awareness around the world that directing food production toward biofuels is in fact a key contributing factor towards higher food prices and reduced food security. For this reason, when the South African government released its draft industrial strategy for biofuels at the end of 2007, maize was specifically excluded. This position is unlikely to change in the medium-term, given rising global food prices and the fact that South Africa is now a net importer of food.
The main effects of high fuel prices can be observed within the macro-economic framework. The first impact reflects the role of transportation in determining the price of goods: South Africa is a large country and highly dependent on the transportation of goods by road (given the currently very poor state of the rail network). More specifically, data shows that 98% of all FMCG are transported via road (State of Logistics, 2006). This is a critical issue: South Africa’s economy is almost totally reliant on a road-based transport system, which in turn is underpinned by fuel prices.
Most micro enterprises are dependent on hired transport to fetch items from wholesalers and/or manufacturers. Although the cost of these services increases as the fuel price increases, there is good evidence to suggest that these prices are both downwardly “sticky” (i.e. that they do not go down when the petrol price declines) and that transport service providers take advantage of general perceptions about rapidly rising fuel prices to increase their margins. The result is that small business owners who are dependant on these forms of transport probably face disproportionate transport cost increases, compared to bigger businesses that control their own logistics. This reduces the competitiveness of the smaller businesses.

7
The second impact is through the regulatory response to inflation. Higher interest rates reduce the disposable income of consumers, by raising debt service costs. As consumers spend more of their disposable income on servicing debt, so they have less to spend on other items.
The third issue for small businesses arising from higher inflation is that, generally, they are not in a position either to negotiate price concessions from manufacturers or wholesalers or to pass inflationary costs on to their consumers. While it is, of course, true that lower consumer expenditure affects all business; small businesses are generally in a much weaker position to ride out periods of reduced consumer spending. The smaller the business, the more vulnerable it is to this.
To date, the ability of many small retail enterprises to survive has been based in large part on their proximity to their clients (convenience), and the (rising) cost of travelling to shop at a large retail centre. However, the official development policy of most Metros in South Africa is to encourage large retailers to penetrate the townships, and this is having a considerable impact on the ability of small traders to survive. These small businesses are not opposed to anti development in the townships per se, but they do feel a certain level of resentment towards economic planners who trumpet the necessity of encouraging small business development on the one hand, whilst on the other hand encouraging development that puts those enterprises at considerable risk.
Food Prices According to Statistics South Africa, food’s weight in the Consumer Price Index (CPI) is just under 21%. As such, an increase in food prices will have an impact on general price levels. However, we should not confuse the official weighting of food in the CPI with the actual role of food in monthly household expenditure for many South Africans. Given that South Africa has one of the world’s worst distributions of income, there is really no such thing as an “average” consumer. In general terms, the poorer a person, the greater the share of their income that they will spend on food, and the greater the impact on their disposable income of food price inflation that exceeds the rate at which their wages are increasing. Data indicate that the very poorest South Africans spend as much as 80% of their income on food.
These issues around how food price inflation is experienced differently by different parts of the population are not intended to cast any doubt over the calculation or components of the CPI, nor to suggest that we should have different inflation calculations for different groups. Rather, it is intended to highlight that, given our particular demographics, the way in which price pressures on particular items are experienced by households can be very different, and understanding these differences is key to an effective response.
Whilst general prices have increased steadily over the past five years, the data show that food inflation (CPI-F) generally increased faster than general inflation, but has done so in particular since the end of 2005. Except for the periods between August-October 2005 and the same period in 2006, food inflation has tended to be higher than the general price level (CPI) of all items. In particular, for the period between September 2007 and 2008, the gap between the two has been widening, implying that more price pressure is being observed in food than for other items.
Therefore, those who allocate a relatively high share of their expenditure towards food – typically the poorest households – would be the most relatively affected by a gap between food and general prices. In general, wage adjustments (and increases in social grants) take into account general rather than food price inflation, and thus are biased against those at the lowest income level. The combined result is that the relative purchasing power of lower
8
income households would tend to come under the most pressure. This contributes to deterioration in equity, with poorer households suffering disproportionately.
Another key issue is that for the period between November 2005 and 2006, price increases in rural and urban areas were similar. However, since early 2007, rural prices have tended to grow faster than urban prices. The fact that rural populations spend roughly double (IES, 2006) on food compared to urban groups leaves rural populations at a disadvantage since they generally have less disposable income than urban populations.
The two main impacts of rising food prices on micro enterprises are a direct impact (through the erosion of purchasing power of their clients) and an indirect impact (through the erosion of the businesses own purchasing power).
In terms of the direct impact on business through the erosion of their clients’ purchasing power, the first point to be made is that the small enterprises that we are considering tend to have lower-income people as their main clients. When food prices are rising more rapidly than the “official” rate of inflation (which sets wage and social grant increases) then these people will have less non-food disposable income and may be forced into actually purchasing less food. Both of these are bad news for small business.
The indirect impact of rising food prices on small businesses comes via the reduction in the disposable income of the business owner. Most of the small businesses under consideration are owned by people who do not fall into the high-income category. Therefore, they tend to spend a relatively high portion of their income on food, and higher food prices mean less income available for other items. The reason why this is important is because most of these small businesses finance their expansion and cash flow requirements from their own savings, and are not able to source other types of finance. Therefore, a reduction in disposable income means less money is available for investing in the business or helping to ride out adverse business periods. This makes small businesses relatively more vulnerable than other type of businesses to adverse price changes.
Key Recommendations Given the factors that influence fuel prices and food prices, different responses are required. The fuel price is largely determined by developments on international commodity and currency markets, and there are only limited interventions that can be made by the South African government (apart from revitalising or creating non-oil based modes of widely accessible transport). Therefore, the response to rising fuel prices by small businesses has to be a business one. There are several ways in which small businesses can ameliorate the impact of rising fuel prices on their direct business costs, and these are largely related to ownership of modes of transport, which could be facilitated via a group scheme, such as FABCOS.
Other possible solutions include bringing collective pressure to bear on wholesalers and other sellers of goods in large volumes either to provide subsidised deliveries to small businesses or to set up more localised distribution systems, in return for a buying commitment from their customers. Co-operation efforts are required in this regard and clear information needs to be provided about the potential liability of those who take part in such a scheme.
The price of food, on the other hand, has a much more significant and more indirect impact on small businesses than other businesses, and requires a macro policy response, but that is not to say that a strategic business response would not be warranted. The South African government understands the severe impact on poverty and equity caused by rising food prices, but to date a tangible response has been very limited.

9
South Africa is not the only country concerned about the impact of rising food prices on poverty and economic development. A recent World Bank study on the global food crisis highlighted 3 broad categories of policy interventions, namely:
• Measures to ensure household food supply by strengthening targeted safety nets;
• Measures which lower domestic food prices through short-term trade policy measures; and
• Measures to enhance long-term food supply.
The key policy fact remains that commercial food production and sales (from farming, through to processing and sales) are primarily activities that are private in nature. Therefore, the role of government is to identify those key market factors that are contributing to rising food prices, and to work, within a market structure, to address those. The key issues here are supply, access and transparency.
Increasing the level of food production Sustained production of key food stuffs is the key to keeping prices low. Recently there has been much debate recently about the fact that a significant amount of re-distributed commercial agricultural land has failed to remain as productive under its new owners. There is an emerging view in South Africa that enhanced agricultural production levels should take precedence over land re-distribution issues. This line of thinking presupposes that the goals of land re-distribution and food production are mutually exclusive, which is not the case.
However, it is clear that the current approach to land re-distribution is doing very little for either national food production or rural livelihoods, and a drastic re-think of how these programmes are designed, implemented and supported is required. The national government and local agriculture ministries must be lobbied to offer greater support to emerging farmers in order not only to secure food supply but to accelerate economic growth by supporting viable emerging farm operations.
The key institutional support issues that contribute to agricultural project failure are around:
o Training and skills development; and
o Project management and oversight.
Increasing Access to food for the poor The key issues here are:
o Supporting households to produce more of their own food; and
o Developing effective social safety net and food emergency responses; and
o Developing effective food vulnerability mapping systems.
Given that nearly half of South Africa’s population lives below the poverty line and is thus very vulnerable to rising food prices, government must create a safety net for those individuals who cannot afford even the most basic of foodstuffs.

10
The government needs good, timeous and comprehensive information on households which require assistance. In this regard, standardized poverty measures are needed so as to identify the neediest of households.
Greater transparency There is very little detailed information available in South Africa about agricultural value chains and the share of each market participant in the final price. Given the seasonal nature of much agricultural production, it is not easy to make quick conclusions. In an environment of rising food prices and angry consumers, retailers and producers are quick to accuse each other of being the source of high food inflation.
It is important that there is a detailed investigation of all the main food value chains in South Africa. This is not so much so that “blame” can be apportioned for a particular price, but rather because unless we clearly understand the detailed drivers of the food prices that consumers have to pay, policy interventions will be a question of guesswork.
Recommendations Pertaining to the Business Operators
A number of recommendations emanate from the fact that FABCOS’ members operate within the informal sector.
Tapping into current government support and working with the authorities Informal businesses and operators are constrained by factors that operate at a variety of levels. Nevertheless, one
key constraint is located at the individual and business unit level: the lack of human and financial capital.
Of note for FABCOS is the fact that SEDA (Small Enterprise Development Agency) has a key role to play in
enhancing specialised and entrepreneurial skills. The Agency has, moreover, some amount of commitments
towards informal traders. In 2006 SEDA also worked with the African Co-operative for Hawkers & Informal
Businesses (ACHIB) by providing training to the members of ACHIB. More broadly, SEDA provides information,
helps businesses with registration, promotes co-operatives and facilitates access to financial services.
It is important to note that government has a role to play in facilitating economic activities, irrespective of whether
these are formal or informal in nature. Complicated legislation and unfavourable borrowing conditions (including
high rates of interest and difficulties in providing collateral to expand a business) contribute to the difficulties
currently experienced by the informal trading sector. Issues at this level can be raised and negotiated by FABCOS
with the relevant authorities. In contrast, it is worth emphasizing that little attention is paid by government to the
conditions affecting the trading sector per se. This is also an area in which FABCOS can engage with some
negotiations. Government (more specifically the Department of Trade and Industry) is still weakly informed about
the issues facing the traders and this is another role which FABCOS, as a representative association can play in
this regard.

11
A strengthened platform for dialogue that takes into account other informal traders association (e.g. ACHIB noted
above), might further contribute to putting issues that are specific to informal traders closer to policy makers.
Developing business skills
In addition some recommendations can be made that are specifically linked to the fact that those who operate
informal businesses have limited endowments e.g. limited capital, skills, etc. The observation that those who secure
a livelihood from the informal sector have limited levels of skills is frequently raised for the recurrent
recommendation that skills need to be developed. Limited access to capital by micro and very small economic
actors has also generated steps seeking to make capital easily and more cheaply available in South Africa. In
parallel, it is also recognized that informal actors who are involved with trading activities are linked to a limited
number of key suppliers. Steps to enhance the links with these are important. Beyond these broad
recommendations is the fact that the economic segment within which spaza shop owners, taverns, etc. operate is
characterized by low barriers to entry, limited investments, a high degree of competition and limited product
diversity. It is around these dimensions that basic business skills (e.g., inventory, accounting and marketing) are
important.
Whilst the development of business skills would possibly offer some amount of resilience to shocks to those
operating informally, we must positively note that informal trading occurs because of unsatisfied demand for
services and products. There is, in other words, a niche component in the presence of informal activities. These
niches and core areas of competences need to be identified by the FABCOS members before these can be
strengthened and business/management training can be designed.
Developing a locational advantage
Locational characteristics are important for competitiveness and for entrepreneurship. Poor infrastructure (in the
sense of inadequate access to water, to electricity and to a safe trading place - for instance spaza shops are
spaces that are frequented by women and children) matters to the customers of FABCOS’ members.
Changes need to be made so that the trading spaces (and for the taverns) are more attractive. Attractiveness
refers here to a clean space where products are well laid out/easy to locate; to a space that is well advertised (with
functions easy to identify) etc.
Generally, a poor location and a poor locale will dampen consumer loyalty to a particular shop/tavern. In parallel,
geographical location might affect the setting up of particular business equipment - refrigerated units, for instance,
need a regular supply of electricity – and the business client base. In turn, infrastructure problems and location
issues affect quality standards (for instance hygiene) which affect linkages with other actors in the value chain
(including suppliers) and weaken leverage possibilities. Location also determines the type of premises available as
well as the investments which a shop owner or operator will make over the trading or operator space. A particular
point here is that investments into the shop or trading space need to be made to ensure consumer satisfaction and
loyalty, as well as to enhance visibility. This is particularly important when economic conditions are poor.

12
The “limited market” characteristic confronting informal units is typically associated with the fact that informal units
compete with the same customers in a particular area. Differentiation is an important feature of the survival of
informal enterprises. Efforts are required by the FABCOS members themselves to identify the possibility for further
differentiation.
Whilst differentiation requires that a minimum amount of business skills is in place, FABCOS members should
perhaps investigate how credit is obtained by the consumers in their vicinity: whereas some efforts have been
deployed by the authorities towards enhancing access to finance by the operators, consumers have found
themselves penalized and increasingly constrained in their borrowing ability. Consumer credit is another area which
FABCOS might want to investigate in the future in co-operation with support available from government.
Recommendations on Food Retailing
Retailers (informal and otherwise) have three easily identifiable areas of operation. These are:
• Managing relationships with producers and suppliers,
• Managing logistics such as distribution and stock, and
• Developing and maintaining customer relationships.
The recommendations herein apply to these three functions.
Managing Relationships with Producers and Suppliers This critical factor relates to the source of members’ stock items. The maintenance of sustainable partnerships
gives informal traders the leverage to negotiate lower prices with the suppliers with whom they have developed
relationships. The process of sourcing goods is principally linked to the cost price incurred by traders in that it
determines the costs associated with acquiring goods. FABCOS as a large body can be at the forefront of exploring
and advising its members on alternative and cheaper suppliers. In parallel, a pooled purchasing effort of bulk goods
could prove highly profitable, since individual members would be able to capitalize on lower per unit costs.
FABCOS needs to investigate the availability of particular products that are most relevant for the poorest income
segment and might want to approach particular groups (e.g. Unilever) directly to enquire about their full portfolio of
products. In parallel, dedicated or specialized wholesalers also need to be approached since their prices are
typically below those of more general “wholesalers” (e.g. Makro).
Managing logistics including distribution and stock
The management of distribution channels allows for the efficient utilization of transportation modes in sourcing
goods. FABCOS is positioned to explore means of deploying logistics and lobbying for the development of
infrastructure with the aim of developing linkages to the mainstream suppliers and to offer consumers easy access

13
to their “markets”. The proximity of an enterprise to its supplier has an expected impact on the profitability of an
enterprise, since the location is a key determinant in the pricing procedures (where transportation is a critical cost
especially for smaller firms).
FABCOS should consider developing transport booking offices for shared logistical use. Other means could entail
the establishment of shared storage facilities and even the introduction of shared transport operations aimed at
utilizing pooled vehicles. Small businesses such as FABCOS members will need to develop strategies to improve
logistical operations. Due to low volumes in goods purchased, innovation and collaboration will be the key to
mitigate against high transport costs.
The management of stock is also a critical skill for any successful enterprise. Given that business administration
skills are usually lacking in informal enterprises, an opportunity exists for FABCOS to engage public training
institutions in order to impart basic administrative skills to their members. Basic bookkeeping and stock control
mechanisms would go a long way towards empowering small enterprises to have financial control over their
employees.
Developing and maintaining customer relationships
Small enterprises must develop and maintain customer relations. Given that FABCOS members are small, informal
operations, this is especially critical. Market orientation (i.e. the use of market-related information on consumers)
can be usefully utilized in order to cater for popular preferences. Businesses need to be innovative so as to gain
insights about their regular customers and preferences. Information on the gender of buyers, frequency and volume
of purchases, as well as average expenditure could be highly useful in exposing local purchasing patterns.
Lower income buyers are highly price sensitive and small business owners must be aware of this fact. When faced
with higher prices, consumers will:
I. Stay with a particular retailer or service provider, but buy alternative (cheaper) products or
II. Switch retailers and buy the same products.
Switching retailers has associated costs, and consumers weigh these according to the shopping experiences of the
various competing retailers. The cost of goods, variety of stock, and the proximity and associated transport costs of
getting to the business are all factors which determine the consumers’ experiences. Co-operation between
suppliers and retailers (or retailer-to-retailer co-operation) can be crucial to providing customers with the right
products, at the right levels and at the right price.

14
FABCOS as a business membership organisation gives small businesses a platform to
lobby together for the creation of sustainable business linkages.
We acknowledge the following invaluable contributors who assisted in compiling this research project
FABCOS members that participated in the survey working group
Office of the FABCOS Presidency Authors: Tracy Van der Heijden and Mbofholowo Tsedu
TIPS research team.
15
1. Background
1.1 History and Profile of FABCOS
FABCOS (The Foundation for African Business and Consumer Services) was established in 1988 on the belief that black business people operating in the informal sector would require organisation and proper representation to ensure that the ongoing political transformation would result in tangible economic improvements for them.
The challenge for the foundation has always been to transform the members of FABCOS from informal traders into fully-fledged entrepreneurs. More than 70% of FABCOS’ members are active in the small retail sector and the majority of these are operating in urban markets. Most of FABCOS’ members can be classified as small or micro enterprises, operating small retail outlets (such as taverns and spaza shops). They deal mostly in basic foodstuffs, limited groceries and alcohol. The client base of these businesses would fall almost overwhelmingly into the lower-income categories. Their generally small turnover implies that these businesses have very little buying power, and tend to purchase their stock from wholesalers or large retail outlets (such as Makro or Trade Centre), rather than manufacturers.
The current FABCOS membership is 978 small businesses (as of 1 November 2008). Although this is only a small portion of the total number of small and micro enterprises in South Africa, they are nonetheless representative of a much larger group as far as activities, ownership profiles and areas of operation are concerned. This feature matters for the purpose of the general validity of the recommendations raised in this report.
The largest proportion of FABCOS members at present are in Gauteng (730) followed by Limpopo (142) and Mpumalanga (130). Approximately 37% of all members are women, reflecting the relatively higher-than-average share of women generally in small and informal business. The vast majority of members are over the age of 40, and are the main breadwinners in their households. The majority of the businesses are turning over less than R10, 000 per month, but have been established for 3 or more years.
1.2 Why this report?
Although only a small portion of all informal traders and small businesses are members of FABCOS, the considerable challenges presented to the FABCOS members by rising fuel and food prices reflect those presented to the wider constituency of South African SMMEs. Therefore, what is relevant to FABCOS’ members is also relevant to a much wider audience.
Small and micro enterprises in South Africa make a significant contribution to employment and income in many poorer communities. Supporting and growing these enterprises is a key component not only of South Africa’s economic growth strategy, but also of its Broad Based Black Economic Empowerment (BBBEE) strategy. The ability of small businesses to deal with external shocks is a key factor in their survival. The ability to cope with external shocks can be enhanced by having:

16
• Better information and understanding of the key drivers of those shocks. The more informed these entrepreneurs are around the various factors that impact on food and fuel prices, the better equipped they are to participate in the policy and strategy debates. Better information puts businesses in a better position to develop ameliorating strategies.
• Targeted policy interventions that work with, and not against markets can have a significant impact on the growth and viability of SMMEs. There is a key role for organisations such as FABCOS to lobby for these policy interventions and to participate in their development.
1.3 Scope of Work and Deliverables
It was necessary to narrowly focus on those issues that are of greatest relevance and concern to the members of FABCOS. In addition, the limited time frame of this project has prevented an in-depth analysis of many related issues. Specifically, it was not feasible to undertake any significant new data collection. Therefore, the project is based on the collection and analysis of existing data sources, such as Statistics SA, and the National Agricultural Marketing Council among others.
The aim of the research is to:
• Assess the key factors (both local and international) that are associated with escalating food and fuel prices.
• Obtain a better understanding of how rising food and fuel prices are impacting on FABCOS’ members, through the erosion of margins, the impact on the disposable incomes of their customers and the impact on the disposable incomes of the business owners.
• Develop a medium-term outlook for the likely impact of various scenarios around food and fuel prices on the specified small businesses.
• Make recommendations as to how these likely impacts could be ameliorated. These would cover both strategic recommendations for FABCOS’ members, and broad policy recommendations for policy interventions.
Accordingly, the scope of work was defined as follows:
I. Contextualise the issues: a history and analysis of food and fuel prices. A key source of data analysed for the latter is from Statistics SA.
II. Provide an analysis of the key drivers of food and fuel prices, in both local and international markets.
III. Provide a medium term outlook for food and fuel prices in South Africa.
IV. Evaluate the impact of food and fuel prices on the FABCOS constituency: this entailed interviews with, and data collection from, a representative sample of FABCOS’ members, in order to determine their mix of sales, and the profile of their customers. Therefore, both direct and indirect impacts will be considered. Only FABCOS’ members within Gauteng were interviewed.
17
V. Based on the medium-term outlook developed and the information collected around the key drivers of food and fuel prices, a set of detailed recommendations as to how these could best be ameliorated was compiled.
1.4. Approach and Methodology
The report is divided into two separate parts. The first part provides an analysis of rising fuel prices; the second part focuses on rising food prices. Although the two parts are closely related,1 the factors that affect fuel and food prices, from the perspective of implications for domestic policy and individual business strategies, are quite different. In addition, the way in which consumers (particularly lower-income consumers) are affected by these two are somewhat distinct.
Our approach has been a combination of desk-top research and a small focus working session with a group of Gauteng based FABCOS members. The focus session combined a questionnaire completed by each participant and then a more informal discussion session around the impact of rising food prices on personal and business incomes. The aim of the discussion was to obtain greater insight into how rising food and fuel prices are impacting small businesses, and also how they are impacting these consumers’ incomes and spending habits, since this then has a further indirect impact on small businesses. The results of the aforementioned questionnaire and discussion are included in the body of this document where they are relevant.
In terms of methodology, the following was applied with respect to the oil price and the food price reviews:
1.4.1 Oil Price Review
Given that South Africa is a net importer of crude oil, global oil prices and the level of the dollar exchange rate are of great significance to the final petroleum cost incurred by end consumers. We have, therefore, highlighted some of the key drivers of global oil prices as well as those domestic factors which determine petrol prices.
Data collected from the Energy Information Agency (EIA), which tracks the historical dollar oil price per barrel, was incorporated as well as the historical rand price per litre of petrol from the Department of Minerals and Energy (DME). This was done in order to extrapolate the trend relationship between the global price of oil and the local price of petrol.
Also highlighted in the report is the approach employed by the government in calculating the petrol price, including an insight into state taxes and levies on petroleum products.
1 The relationship tends to run from fuel prices to food prices via farming input costs and transportation

18
1.4.2 Food Price Review
The basis of this part of the report is the official inflation data from Statistics SA. The Consumer Price Index (CPI) is used to calculate the official or headline rate of inflation and consists of price increases for all goods and services in the main metropolitan areas of the country. The CPI-F, or food price index, is an index containing only the food items appearing in the CPI basket. The index is regarded as useful to assess the impact of price increases on poverty, as food is the single biggest expenditure item for lower-income households. CPI data is readily available and shows that, since 2000, food prices have grown faster than prices of other tradable goods generally. In July 2008 Stats SA officially announced new CPI weights to take effect as from January 2009.
This report examines price increases for particular foodstuffs, namely wheat, maize, dairy and meat products in more detail.
Data from the National Agricultural Marketing Council (NAMC) has been used to disaggregate the different food sectors and the changes in price levels. A primary outcome is to highlight any discrepancies between urban and rural prices, and secondly to analyse the impact of these price increases on different income groups.

19
2. Analysis and Impact of Fuel Prices
2.1. The Economic Significance of Oil
Oil is arguably the most sought after commodity in a modern industrial economy and has a major influence on an economy such as that of South Africa. Oil has many economic uses around the world, including electricity generation (although this is not the case for South Africa as coal is the primary source), for heating and cooking purposes and as a key raw material input in the manufacture of many items. However, its most important use is its role as a liquid fuel for most major forms of transportation of goods and persons. All industries are, to a lesser or larger degree, reliant on oil or its derived petroleum products.
2.2. Historic Oil Prices
Historically there have been a few “shocks” in the oil industry, which have typically (but not always) resulted in sharp price changes since the early 1970s.
Table 1: History of Oil Price Shocks
Period Start Price End Price % Change in Price Cause
1973-1974 US$3 US$11.50 +95.79% Arab-Israeli War & Organisation of Petroleum Exporting Countries (OPEC) collusion on price setting
1979-1980 US$14 US$35 +58.11% Iranian Revolution and the Iraq-Iran War
1982-1985 US$29 US$22.50 -11.92% OPEC Quotas
1990 US$17 US$35 +43.49% Iraq-Kuwait invasion
2007-2008* US$63 US$96 +29.09% See text
Source: Wakeford (2006) *and updated by authors
Table 1 illustrates the volatility in prices which has been experienced in the oil industry. There are a few distinct periods where dramatic price changes have occurred. The numerous conflicts in the Middle East have profoundly impacted oil prices as the region is home to the largest oil reserves in the world. Closer inspection also reveals that
20
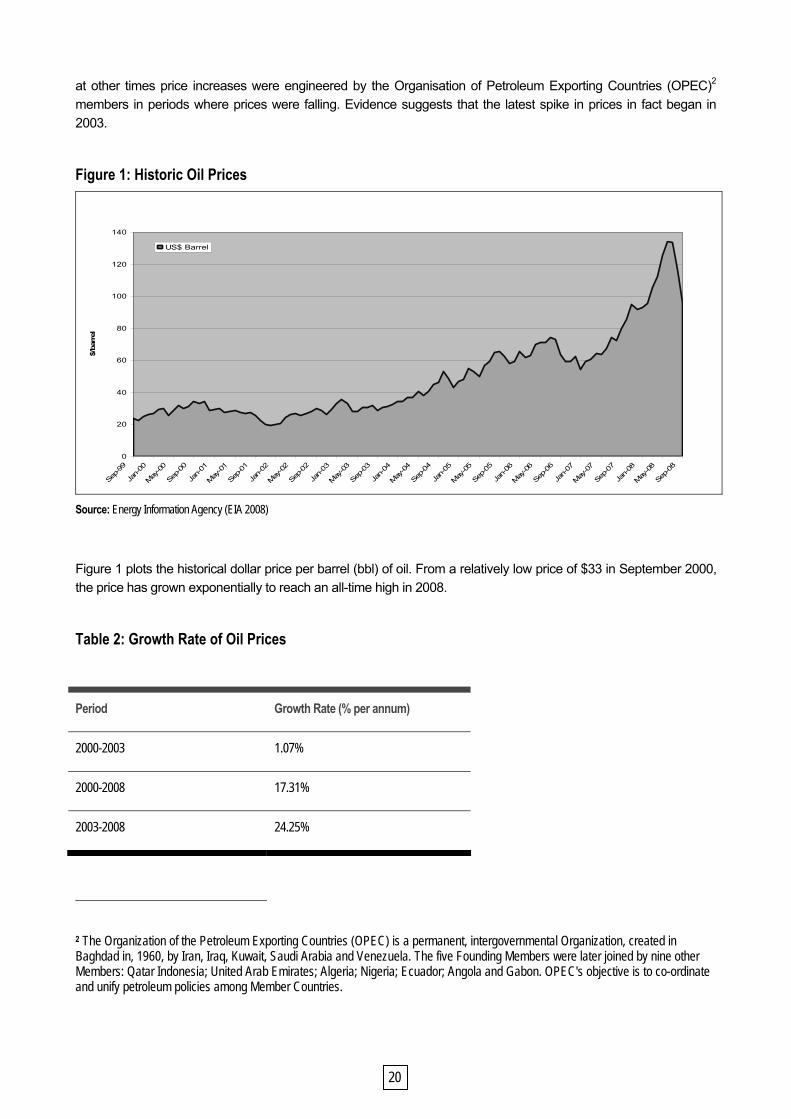
at other times price increases were engineered by the Organisation of Petroleum Exporting Countries (OPEC)2 members in periods where prices were falling. Evidence suggests that the latest spike in prices in fact began in 2003.
Figure 1: Historic Oil Prices
0
20
40
60
80
100
120
140
Sep-99
Jan-00
May
-00
Sep-00
Jan-01
May
-01
Sep-01
Jan-02
May
-02
Sep-02
Jan-03
May
-03
Sep-03
Jan-04
May
-04
Sep-04
Jan-05
May
-05
Sep-05
Jan-06
May
-06
Sep-06
Jan-07
May
-07
Sep-07
Jan-08
May
-08
Sep-08
$/ba
rrel
US$ Barrel
Source: Energy Information Agency (EIA 2008)
Figure 1 plots the historical dollar price per barrel (bbl) of oil. From a relatively low price of $33 in September 2000, the price has grown exponentially to reach an all-time high in 2008.
Table 2: Growth Rate of Oil Prices
Period Growth Rate (% per annum)
2000-2003 1.07%
2000-2008 17.31%
2003-2008 24.25%
2 The Organization of the Petroleum Exporting Countries (OPEC) is a permanent, intergovernmental Organization, created in Baghdad in, 1960, by Iran, Iraq, Kuwait, Saudi Arabia and Venezuela. The five Founding Members were later joined by nine other Members: Qatar Indonesia; United Arab Emirates; Algeria; Nigeria; Ecuador; Angola and Gabon. OPEC's objective is to co-ordinate and unify petroleum policies among Member Countries.

21
2007-2008* 29.09%
Source: EIA & own calculations*
Table 2 above lists the different annual growth rates of oil prices for designated periods. The data shows that the most pronounced increase occurred during 2007 and 2008, when prices rose from $63/bbl to a peak of $133/bbl in June 2008. At the turn of the millennium prices were steady at around $29/bbl. Over the next 3 years prices remained relatively stable only increasing by just over 1%. As clearly illustrated in Table 2, the most significant fuel price increases occurred over the last 5 years, when prices grew on average by 24% per annum, well above the average rate of inflation of the industrialised world. Therefore, in real terms, the price of oil has increased significantly.
The period between 2003 and 2008 has witnessed several “price shocking” events. Many factors can be linked to these increases, including the Iraq conflict, Nigerian Rebels, hurricanes Katrina and Rita (which affected some parts of the American continent) and stability concerns in the Middle East. Although minor disruptions to production did occur during this period, these have had a minimal effect on the actual oil price. What influenced the price was continuous speculation on the oil market, and fears among oil traders about peace prospects in the Middle East.
Most significant is the latest price spike. Prices showed a steep upward trend from January 2007 to June 2008. This period was witness to the most significant rise ever recorded with oil prices breaking the $100/bbl mark to a high of $133. No easily discernable causes can be attributed to this price spike - no major natural causes, or deeply geo-political factors were at play in those years. The main contributing factor was in fact linked to a fear that the world’s oil reserves were coming to an end.
Why the Recent High Oil Prices?
As Figure 1 shows, oil prices have been increasing since 2003. Prices have tripled since 2003 from $28 in September to $96 in September 2008. Oil prices displayed a peak during July 2008, with a record $135 per barrel, before stabilizing at $96.
The increase in prices was partly due to the fact that although demand has grown strongly over the period, supply has remained unchanged. The major oil companies have not invested enough in building refining capacity over the period. Oil production has increased 40% over the last 20 years, yet refining capacity has only grown by 15%. This has exposed a scenario where new oil and gas fields are not being found to replace the sources that are being exhausted. In other words, additional demand is rising faster than new supply sources.
In the past two months, the collapse of global financial markets and the very real prospect of recession across the major economies have triggered the oil price falling back to below $70/bbl. Although this is a positive development, the fact that oil supplies are finite is not going to change. Therefore, any indication that the global economy is going to move out of recession will put the pressure back on prices. In addition, it is becoming quite clear that OPEC will move to reduce supply in order to prevent any long-term decline in the oil price to below $65/bbl.

22
2.3. From the Oil Price to the Petrol Price
As noted previously, oil’s major use is in its role as a liquid fuel. Figure 2 plots the dollar barrel (a barrel is equivalent to 159 litres) price of crude oil against the South African Rand (ZAR) price per litre of petrol for the period September 2003 – September 2008.
Figure 2:$/bbl Price vs. ZAR/ Litre Price Oil $Barrel vs Petrol ZAR
20
60
100
140
180
220
260
Sep-2
003
Jan-
2004
May-20
04
Sep-2
004
Jan-
2005
May-20
05
Sep-2
005
Jan-
2006
May-20
06
Sep-2
006
Jan-
2007
May-20
07
Sep-2
007
Jan-
2008
May-20
08
Sep-2
008
$ B
arre
l Pric
e
0.0
200.0
400.0
600.0
800.0
1000.0
1200.0
ZAR
Litr
e Pe
trol
Pric
e
Crude Oil Future (Dollars per Barrel)Petrol Gauteng SA c/lPetrol Coast SA c/lDiesel Gauteng SA c/lDiesel Coast SA c/l
Source: EIA & Central Energy Fund (CEF) 2008
Figure 2 illustrates the analogous trend between the price of petrol, diesel and the crude oil. This trend substantiates the intricate transmission link between oil and petrol. This graph also shows a cyclical trend where prices peak during June and September, and decrease again between December and March.
2.3.1 Calculating the Retail Petrol Price
The petrol retail price is regulated by the government and changes whenever one of the key influencing factors that make up the petrol price (see below) changes. The calculation of the new price is done by the Central Energy Fund (CEF) on behalf of the Department of Energy and Minerals.
The petrol price is composed of a number of elements, which can be divided into international and domestic elements. The international element, or Basic Fuel Price, is based on what it would cost a South African importer to buy petroleum from an international refinery and transport it to South Africa.
Basic Fuel Price (BFP)
The BFP formula reflects the realistic cost per litre of importing from international refineries. The BFP is made up of the following:

23
• International petroleum spot prices, in Rand; • Freight cost to bring product to South Africa; • Insurance costs and ocean loss costs; • Cargo dues; • Coastal storage fee; • Stock financing costs.
Domestic Elements
To get to the final pump price of petrol, certain domestic transport costs, government taxes and levies, and the retail and wholesale margins must be added to the basic fuel price. The following local costs apply:
• Transport Costs (zone Differential) • Delivery Costs (Service Differential) • Wholesale (Marketing) margin • Retail Margin • Fuel Levy • Customs and Excise Levy • Road Accident Fund Levy • Slate Levy • Demand Side Management Levy
Table 3: Composition of Petrol Pump Price
Petrol Diesel
Wholesale margin 4.77% 4.82%
Service cost recoveries 1.01% 1.02%
Storage, handling & delivery costs 1.01% 1.02%
Dealers margin 7.15% 0.00%
Zone differential in Gauteng 1.54% 1.56%
Fuel levy 13.50% 11.97%
Customs & Excise Duty 0.43% 0.43%
RAF Levy 4.94% 5.01%
Petroleum Products Levy 0.02% 0.02%
Slate Levy 4.77% 4.84%
Demand Side Management Levy (DSML) 1.06% 0.00%

24
Recovery Levy 0.16% 0.16%
Sub-total 39.34% 29.84%
Contribution to the Basic Fuel Price 60.66% 70.16%
Retail Price 100.00%
Wholesale price 100.00%
Taxes (as % of the fuel price) 24.87% 22.43%
Source: CEF 2008
Table 3 shows the different proportions of each element of the petrol pump price. Clearly the BFP is the most critical component of the price to the consumers, accounting for 61% of the petrol price and 70% of the diesel price. Given that government taxes account for 25% of the petrol price, international price factors account for the greatest impact on the price. Considering the fiscal needs of the state, it is doubtful that the government will consider any reduction in levies.
This data highlights the fact the national government, though significant, is directly responsible for only a quarter of the price elements, and therefore, international events, and how they impact the price of oil, together with the ZAR/$ exchange rate (i.e. the main components of the BFP) are far more important in determining the retail price of fuel than government’s regulation and taxation policy. It should be noted, however, that guaranteed margins for wholesalers and retailers make up almost 12% of the price, so allowing retailers to sell at a lower price may be one way to bring the price down, although this will probably contribute to only a very small price differential.
2.4. Fuel Price Drivers
International Price Drivers
Fundamentally, the global oil price is determined by the global demand and supply of oil. Significantly, demand is governed by the global economic climate. Economic growth can be considered the foremost reason for increased demand, since as economies expand they require more energy sources to power this growth. Comparative global growth rates are important in that South Africa has to compete with other growing economies for the commodity. China has illustrated an almost insatiable appetite for oil, along with other energy sources and commodities.
South Africa is unfortunately a net importer of oil. The lack of viable substitutes or cheaper sources means South Africa is in global competition to secure energy. Given that 95% (SAPIA, 2006) of South Africa’s crude oil is sourced from OPEC members, and that 38% of world oil is from OPEC, South Africa has limited alternative sources from which to import. Another key factor affecting international prices is the ZAR/US$ exchange rate. Both crude oil and international petrol prices are dollar based, hence any weakening in the ZAR/US$ rate will lead to higher domestic prices.

25
It is important to remember that the international price of oil is in a large part controlled by the cartel of the largest producers – OPEC. All these countries are very aware of the fact that oil is a limited resource, and they need to maximise the value of that limited resource to their national economies. This is a perfectly rational response, but it does imply that the days of cheap international oil prices are definitely over.
Domestic Price Drivers
Apart from the exchange rate level and international oil prices, there are two key domestic factors which influence the pricing of petroleum products.
Firstly, the geographic location within South Africa where the petrol is sold has an impact on price. The petrol price is lower on the coast as opposed to inland. These prices are based on the transportation mode used to transport fuel from the coastal depots to inland retailers. Secondly and more importantly, are the taxes and levies of state on petroleum fuels. Cumulatively, these represent close to 25% of the final price charged at petrol pumps in South Africa.
Info Box: Sasol
Sasol is the world biggest producer of oil from coal. It produces roughly 23% of South Africa’s petroleum needs, and does so at a price well below the current price of oil. Given that Sasol is a local firm, expectations are for lower prices than those which currently prevail in the country. Unfortunately, all petroleum types in South Africa are priced at import parity levels, that is, at prevailing international prices. In turn, because Sasol’s Synfuels petrol is regulated by the Petroleum Products Act, Sasol cannot sell its products at a price different from the regulated retail price. In essence this means that South Africa is not able to source cheaper petrol, not even from local companies that produce it at a significant discount.
2.5. The impact on the National Economy and on Small Businesses
The main effects of high fuel prices can be observed within the macro-economic framework. The first impact reflects the role of transportation in determining the price of goods: South Africa is a large country highly dependent on the transportation of goods by road (given the currently very poor state of the rail network). South Africa also remains fairly dependent on imported goods.
Very little that is consumed by South Africa’s producers is “local” in that it is not produced/manufactured within 50kms of where such producers are located. Distribution networks as well as wholesale and retail trade systems rely on intricate logistics systems which allow large volumes of goods to move across the country. Therefore, any increase in the petrol and diesel prices almost immediately translates into higher input and final goods’ prices. More specifically, data shows that 98% of all Fast Moving Consumer Goods (FMCGs) are transported via road (CSIR, 2006). This is a critical issue: South Africa’s economy is heavily reliant on a road-based transport system, which in turn is underpinned by fuel prices. The short-term lack of viable road transport alternatives means that almost all prices in South Africa are determined in part by the fuel price, although considerable cost savings can be made simply through the load consolidation and the use of more economical truck sizes. (The cost of transporting grain reported in the table below illustrates this.)

26
Table 4: Illustrative scale of transport cost reductions from using increasingly larger trucks
Truck Type Payload (tons) Cost per ton (Rand) Cost per bag (Rand)
4x2 Rigid LDV 1.00 218.76 19.69
4x2 Rigid Dropsides 2.30 174.56 15.71
4x4 Rigid Dropsides 8.20 100.43 9.04
6x4 Truck & Semi trailer 27.60 53.19 0.79
Source: CSIR (2006, Table 1, page 12)
Small businesses do not have the luxury of integrated logistics systems. Most micro enterprises are dependent on hired transport to fetch items from wholesalers and/or manufacturers. Although the cost of these services increases as the fuel price increases, there is sound evidence to suggest that these prices are both downwardly “sticky” (i.e. that they do not go down when the petrol price declines) and that transport service providers take advantage of general perceptions about rapidly rising fuel prices to increase their margins. The result is that small business owners who are dependent on these forms of transport probably face disproportionate transport costs increases, compared to bigger businesses that control their own logistics. This reduces the competitiveness of the smaller businesses.
The second impact is through the regulatory response to inflation. The South African Reserve Bank (SARB) has recorded consumer price inflation increases beyond their 3-6% target since early 2007, rising to 13.7% in August 2008. These increases have been anchored by rising food and fuel prices. This price growth resulted in regular interest rate increases which have seen the interest rate increase by 500 basis points in the past two years, setting the REPO rate – that is the rate at which the Reserve Bank lends to private banks - at 12%. Higher interest rates reduce the disposable income of consumers, by raising debt service costs. As consumers spend more of their disposable income on servicing debt and purchasing food, so they have less to spend on other items.
The third issue for small businesses arising from higher inflation is that generally, they are in a position where they can neither negotiate price concessions from manufacturers or wholesalers nor pass inflationary costs onto their consumers. This is particularly relevant when we consider the profile of FABCOS’ members, who generally enjoy little market share and tend to service mainly lower-income communities. Thus, these enterprises are faced with the dual problems of higher costs, contributing to lower profit margins, and of eroded spending power of their customers.
While it is, of course, true that lower consumer expenditure affects all businesses, small businesses are generally in a much weaker position to ride out periods of reduced consumer spending. The smaller the business, the more vulnerable it is to this. All the enterprises interviewed as part of this study indicated that they were aware of this: the most common example cited were large retailers being able to demand (and get) considerable price reductions from key suppliers in order to protect their margins when times are tough.

27
It is a fact of business that a big company will always get a better price from a supplier than a small company, and small businesses need to take account of this in their business models. However, when times get tough and all businesses are competing for a share of a smaller pool of disposable income, bigger businesses are able to put even greater pressure on suppliers for a better deal, and consumers become more conscious of small differences in price when making buying decisions. This reduces the ability of small businesses to compete.
Many FABCOS members cite the ability of large retailers to have regular “special offers” of staple items which are well supported by consumers under income pressure.
Until now, the ability of small retail enterprises to survive has been based in large part on their proximity to their clients (convenience), and the (rising) cost of travelling to shop at a large retail centre. However, the official development policy of most Metros in South Africa is to encourage large retailers to penetrate townships, and this is having a considerable impact on the ability of small traders to survive. All the enterprises interviewed for this report indicated that one of their most serious business threats is the influx of big retailers which is accompanying much township development. These small businesses are not opposed to development in the townships per se, but they do feel a certain level of resentment towards economic planners who trumpet the necessity of encouraging small business development on the one hand, whilst on the other hand encouraging development that puts those enterprises at considerable risk.
CASE: Spaza Shops in Phillipi Township
Phillipi is one of the most densely populated townships in Cape Town, surrounded by Khayelitsha and Crossroads. There is a sufficient supply of public transport and nearby new business centres such as a shopping mall in Khayelitsha. There is a variety of businesses that compete against and complement each other: different sizes of spaza shops, supermarket-like shops (that act as wholesalers to small shops) and specialised businesses such as fisheries and fast foods outlets.
The major challenge facing spaza owners in this environment is the customer’s ability to make use of the available transport to buy directly from wholesalers at low prices and to get to shopping centres that offer variety. Spaza owners who have to use public transport cannot compete, since they have to pay separately for the transport of large items such as 50 litres of paraffin. The South African spaza owners claim to have lost business to non-South African spaza owners that do manage to stock larger items. Spaza shops do benefit from the direct delivery of cooldrinks and bread, and business tends to shift towards these items. This trend is accelerated by the increase in food-related businesses in the townships which increases the sale of complementary goods and products: fisheries and fast foods increase the sale of bread and drinks.
Spaza shop owners will remain under pressure if they do not innovate. The difference between the prices of goods in supermarkets in town and the spaza shops in the townships is mostly justified by consumer transportation costs, and if this factor is reduced, the rationale for the presence of spaza shops will be undermined.
Source: CSIR (2006).

28
2.6. Fuel Price Forecast
In the current volatile climate of global commodity and currency markets, it is very difficult to predict the longer-term direction of either the dollar price of oil, or the Rand price of petrol. However, the fact that oil is a disappearing commodity, together with the clear determination of OPEC to maintain high prices, suggests that a longer-term oil price below $60/bbl is an unlikely scenario.
At the same time, global economic factors suggest that the Rand will remain under pressure in the medium-term. This will be supported by inflation higher than that of the industrialised world.
If we consider both these factors together, it seems likely that South Africans will have to deal with higher retail fuel prices in the medium term.
2.7. What About Biofuels?
The finding that ethanol manufactured from maize and sugar could be used as an alternative to petrol was initially hailed as a key breakthrough in the race for alternative sources of energy. In 2006, the South African government named bio fuels as one of its target high-growth sectors. There is a widespread belief that the production of bio fuels has become increasingly viable, given surging oil prices and should, therefore, be a priority for both the South African government and the public.
However, over the past year, there has been increasing awareness around the world that directing food production toward bio fuels is in fact a key contributing factor towards higher food prices and reduced food security. For this reason, when the South African government released its draft industrial strategy for bio fuels at the end of 2007, maize was specifically excluded. The draft strategy makes provision for the use of sugar cane to produce bio fuel.
This position is unlikely to change in the medium-term given rising global food prices and the fact that South Africa is now a net importer of food. The key factor that could affect this policy would be an increase in agricultural production to a point where it can be shown that food security is not compromised by the use of maize for bio fuels.

29
3. Analysis and Impact of Food Prices
3.1. Food price Inflation in South Africa
According to Statistics South Africa (Table 4 below), food’s weight in the Consumer Price Index (CPI) is just under 21%. That is, food prices make up 21% of total CPI. This share is significant since it highlights the importance of food in determining total price increases. As such, an increase in food prices will have an impact on general price levels.
However, we should not confuse the official weighting of food in the CPI with the actual role of food in monthly household expenditure for many South Africans. Given that South Africa has one of the world’s worst distributions of income, there is really no such thing as an “average” consumer. In general terms, the poorer a person, the greater the share of the income that a person will spend on food, and the greater the impact on that person’s disposable income of food price inflation that exceeds the rate at which their wages are increasing. Data indicate that the very poorest South Africans spend as much as 80% of their income on food.
Table 5: CPIF Weights
Product Weight
CPI Excluding Food 79.01
Food (Total)3 20.99
Grain Products 3.81
Meat 5.66
Fish and other seafood 0.69
Milk, cheese and eggs 1.96
Fats and oils 0.76
Fruit and Nuts 1.09
Vegetables 2.00
3 The current CPI F weighting of 21% is to be revised to just below 16%, this is not to say people are spending less on food, but rather that disposable income is being spent on other goods. Transport will have an increased weighting. Currently it is at 15.5% and is set to increase to 18.8% of total CPI. Refer to Stats SA’s Booklet on CPI Changes: http://www.statssa.gov.za/cpi/documents/CPI_booklet_final_16_Oct_08.pdf

30
Sugar 0.50
Coffee, tea and cocoa 1.07
Other [food] 3.45
Source: NAMC (2007)
Table 4 shows the relative share in the total CPI weights for food of the three main products - meat, grains and vegetables. The table indicates that meat is the single biggest component of food expenditure for the South African consumer. However, once again there are wide discrepancies within consumer consumption habits: for poorer households, for instance, the consumption of maize meal is much more important than the consumption of meat. The poorest households in South Africa spend as much as 50% of food expenditure on maize meal.
These issues around how food price inflation is experienced differently by different parts of the population are not intended to cast any doubt over the calculation or components of the CPI, or to suggest that we should have different inflation calculations for different groups. Rather, it is intended to highlight that, given our particular demographics, the way in which price pressures on particular items are experienced by households can be very different, and understanding these differences is key to an effective response.
Figure 3: CPI and CPI-F (Year 2000 = 100)
100
120
140
160
180
200
Sept. 2
003
Jan.
2004
May 20
04
Sept. 2
004
Jan.
2005
May 20
05
Sept. 2
005
Jan.
2006
May 20
06
Sept. 2
006
Jan.
2007
May 20
07
Sept. 2
007
Jan.
2008
May 20
08
CPI-All Items, Total country
CPI: All items, excluding food
CPI: Food
Source: Stats SA (2008)
Figure 3 above illustrates how the various CPI series have evolved over the last 5 years. Whilst prices have increased steadily, the data show that food inflation (CPI-F) generally increased faster than general inflation, but did so in particular since the end of 2005. Except for the periods between August-October 2005 and the same period in

31
2006, food inflation has tended to be higher than the general price level (CPI) of all items. In particular, for the period between September 2007 and 2008, the gap between the two has been widening, implying that more price pressure is being observed in food than in other items.
Therefore, those who allocate a relatively high share of their expenditure towards food – typically the poorest households – would be the most relatively affected by a gap between food and general prices. The 2005/2006 Income Expenditure Survey (IES) reports that the share of expenditure4 of those within the bottom income quintile on food and non-alcoholic beverages stands at about 37%, while the share of those in the top income quintile is 9.6%. In general, wage adjustments (and increases in social grants) take into account general rather than food price inflation, and thus are biased against those at the lowest income level. The combined result is that the relative purchasing power of lower income households would tend to come under the most pressure. This contributes to a deterioration in equity, with poorer households suffering disproportionately.
Figure 4: CPIF-F – High Growth Items
120
140
160
180
200
220
Sept. 2
003
Jan.
2004
May 20
04Sep
t. 200
4Ja
n. 20
05May
2005
Sept. 2
005
Jan.
2006
May 20
06Sep
t. 200
6Ja
n. 20
07May
2007
Sept. 2
007
Jan.
2008
May 20
08
Food
Meat
Milk, cheese and eggs
Fruit and nuts
Vegetables
Fats and oils
Source: Stats SA (2008)
Figure 4 above plots the monthly CPI-F against food groups which have shown higher-than-average growth in prices in the last 5 years. Figure 4 shows that meat and dairy product prices have grown faster than average food prices. Meat prices experienced the most pronounced growth during September 2005 and January 2007. Meat prices have been affected by periods of drought, and rising input costs. Dairy product prices have gradually picked up pace since early 2007, due to a decline in production. It is important to note however, that there is not always a direct relationship between the farm gate price of agricultural commodities and the prices that consumers pay, suggesting value chain issues and leverage possibilities within agricultural produce value chains.
4 This is excluding imputed rent, mortgage and other unclassified expenditure.

32
Fruit and vegetable prices exhibit seasonal fluctuations in accordance with a pattern of seasonal production. Fat and oils prices have shown tremendous growth over recent years. Higher prices have resulted from increased demand for oils (including palm oil in food processing).
In both the case of meat, as well as fruit and vegetables, it is interesting to note a slow down of the price increase. Specifically, 2008 prices of fruits, nuts and vegetables have declined relative to their levels at the end of 2007. Though a slowing down of the prices of meat prices has occurred, prices have not dropped to the 2007 level.
Figure 5: CPI-F – Slow Growth Items
120
140
160
180
200
220
Sept. 2
003
Jan.
2004
May 20
04
Sept. 2
004
Jan.
2005
May 20
05
Sept. 2
005
Jan.
2006
May 20
06
Sept. 2
006
Jan.
2007
May 20
07
Sept. 2
007
Jan.
2008
May 20
08
Food
Grain products
Fish and other seafood
Sugar
Coffee, tea and cocoa
Other
Source: Stats SA (2008)
Figure 5 plots the trends in those food groups which have generally displayed a “below average” (CPI-F) growth in prices. Sugar and coffee prices have historically shown growth below that observed in general prices, and this is a reflection of lower world prices for these items. Fish and seafood prices have also stood below average growth, except between 2006 and 2007 when prices grew faster for these products than for other groups generally.
Grain prices are particularly important for lower-income South Africans. A key finding on grain product prices is that for the most part price increases for these products were below the food price average. Only since early 2008 have prices for grain products been growing faster than average food inflation. The rise in grain prices in large part reflects the increase in the price of specific inputs used in (usually large-scale) grain farming, such as diesel. The historical grain price trend suggests that the rise in meat prices is influenced by factors other than cereal prices, although grains are a key input for the industry.

33
Table 6 below tracks retail prices of surveyed retailers for different food products for the beginning of the year in 2006, 2007 and 2008 in South Africa.
Table 6: Price Level Increases – key basic food items
Price level (Rands) Percentage change
Mar-06 Mar-07 Apr-07 Apr-08 Apr 05 to Apr 06
Mar 06 to Mar07
Apr-07 to Apr-08
Wheat Products
Bread - White Sliced 4.74 5.18 5.31 6.71 1.78% 9.20% 26.37%
Bread - Brown Sliced 4.25 4.68 4.82 5.86 3.75% 10.10% 21.58%
Flour 2.5kg 10.3 11.25 11.9 18.1 0.18% 9.20% 52.10%
Spaghetti Plain 500g 4.75 5.46 5.8 8.53 5.62% 14.90% 47.07%
Macaroni Plain 500g 4.76 5.47 5.53 6.27 6.61% 14.80% 13.42%
Average 3.59% 11.60% 32.11%
SAFEX Wheat R/ton 1409.3 2051.54 2162 3973 45.60% 83.73%
Maize Meal
Maize Super 5kg 14.47 18.08 19.6 20.63 12.47% 25.00% 5.23%
Maize Special 5kg 11.25 14.8 15.88 16.78 9.61% 31.50% 5.66%
Average 11.04% 28.20% 5.45%
SAFEX White Maize R/ton 1122.67 1920.48 1663 1862 71.10% 11.95%
Red Meat and Chicken
Rindless Back Bacon 250g 15.07 15.54 15.41 18.07 5.24% 3.20% 17.26%
Streaky Bacon 250g 13.9 14.94 39.08 42.11 7.27% 7.50% 7.76%
Pork Chops per kg 42.13 41.66 42.4 48.79 1.40% -1.10% 15.07%
Lamb Chops per kg 42.86 54.15 63.94 70.31 13.85% 26.30% 9.96%

34
Boerewors per kg 29.37 29.35 65.72 70.1 1.76% -0.10% 6.67%
Brisket per kg 30.82 36.08 36.53 40.33 17.68% 17.10% 10.40%
Beef Mince per kg 30.98 30.69 26.42% -0.90%
Beef Stewing per kg 32.11 34.38 20.89% 7.10%
Chicken - Whole Frozen 18.09 24.21 22.65 26.58 12.36% 33.80% 17.33%
Chicken - Whole Fresh 20.33 21.86 28.08 32.17 18.81% 7.50% 14.55%
Dairy Products
Butter 500g 15.92 16.32 16.5 20.68 -0.55% 2.60% 25.36%
Fresh Milk Full Cream 2l 10.01 10.69 11.29 14.57 -1.14% 6.80% 29.08%
Fresh Milk Low Fat 2l 10.26 10.95 11.53 14.57 0.48% 6.70% 26.44%
Fresh Milk Low Fat 1L 4.82 5.01 5.14 6.32 -1.66% 3.90% 22.91%
LongLife Milk Full Cream 1L 6.27 6.71 7.02 7.91 -3.66% 7.10% 12.66%
Eggs 30's 26.89 28.3 29.98 34.9 3.28% 5.20% 16.40%
Processed Foods
Pilchards in Tomato 425g 7.17 7.5 8.06 8.84 10.80% 4.60% 9.68%
Tuna Shredded in Brine 170g 6.66 7.13 6.79 8.27 -1.11% 7.10% 21.80%
Source: NAMC (2008)
All maize price indices for selected intermediate inputs have shown an upward trend since 1990 (NAMC, 2006). The producer price indices for maize, fertilizer, fuel, animal health and crop protection, maintenance and repairs and animal feed prices have increased dramatically since 2002.
South Africa produces both white and yellow maize. White maize (which dominates maize production in South Africa) is used for human consumption in the form of maize meal, while yellow maize is used for animal feed and other uses, such as biofuel. The South African Futures Exchange (SAFEX) White Maize R/ton price experienced a major price increase between 2006 and 2007. Prices increased by 71.1% for the period before stabilizing somewhat in the period between 2007 and 2008, growing at a “modest” 12%, more in line with overall inflation. Maize products (maize meal) increased by 28% on average between 2006 and 2007 before stabilizing at 5.45% on average for the latest period.

35
The higher price of maize is not necessarily going to translate into higher production, since the price of agricultural inputs such as fertilizer (derived from oil) and diesel have increased sharply over the past 12 months. This may indicate that higher production will need to be associated with higher prices if farmers are to be incentivised to grow more. The situation for maize is particularly important since this is the major food product for the poor in both urban and rural areas. Whilst for some of the cereal prices – wheat, maize and rice - there are lagged effects, distinct trends affect distinct products depending on their usage and degree of substitution5.
The SAFEX Wheat R/ton price experienced its biggest increase between April 2007 and April 2008. The R/ton price of wheat increased by nearly 84% over this period. Wheat products increased on average by 32%, with bread price increases averaging 24% and flour price increases 52%.
Red meat and poultry prices increased by 12%, with chicken and pork products as the major products driving the price of this particular food group. Among fish products shredded tuna prices exhibited the largest growth at nearly 22% over the latest period.
Dairy products and egg prices have shown a dramatic upward trend, increasing by just over 5% on 2006/7 in contrast to latest price increases of just over 25% in 2007/8. Full cream milk increased by close to 30% in the latter period.
In terms of the contribution to total variable cost of cereal products over the last 7 years, fertilizer contributed more than 20% (between 21% and 27%) and seed costs contribution saw an upward trend. Maintenance and repairs experienced a downward cost contribution trend while fuel and labour (unsurprisingly) contributed, on average, 24% of the total variable cost.
3.2. The Impact of Rising Food Prices on Small Businesses
The two main impacts of rising food prices on micro enterprises, as represented in the FABCOS constituency, are a direct impact (through the erosion of purchasing power of their clients) and an indirect impact (through the erosion of the businesses own purchasing power).
In terms of the direct impact on business through the erosion of their clients’ purchasing power, the first point to be made is that the small businesses that we are considering tend to have lower-income people as their main clients. As we have discussed above, the poor are disproportionately affected by higher food prices, since they tend to spend more of their income on food. When food prices are rising more rapidly than the “official” rate of inflation (which sets wage and social grant increases) these individuals will have less non-food disposable income and may be forced into actually purchasing less food. Both of these are bad news for those that sell foodstuff.
5 For instance, as there is little transformation for rice and since it is not really used as an input/feed, rice prices have been affected by large and growing demand as well as by export bans in key rice producing countries.

36
Table 7: Distribution of household annual expenditure on food
Main Food Group 1st Quintile (Poorest) 5th Quintile (Richest) Total
Total Expenditure 100% 100% 100%
Food In Kind 5.1% 1.2% 3.4%
Grain products 36.5% 16.2% 22.3%
Meat Products 15.1% 24.1% 22.0%
Fish Products 2.1% 3.5% 3.0%
Fats and Oils 3.9% 3.2% 3.5%
Milk, milk products and eggs 6.1% 9.8% 8.8%
Vegetables 12.0% 8.8% 9.7%
Fruit and Nuts 2.6% 5.9% 4.9%
Sugar 7.8% 4.0% 4.8%
Non Alcoholic beverages 5.4% 8.3% 7.5%
Misc. food 3.1% 4.9% 4.3%
Prepared food 0.4% 10.0% 5.8%
Average expenditure R4 044 R24 924 R12 540
Source: Martins (2005)
As can be seen in Table 6 above, lower income groups spend a higher proportion of their disposable income for food on grain products (36.5%), meat products (15.1%) and vegetables (12%) than those at higher income levels. Higher income groups spend more of their disposable income on a variety of foodstuffs, with the highest share of expenditure at 24.1% in meat followed by grain (16.2%) and prepared food (10%).
The vulnerability of low income households to food inflation has shown a marked increase over time. In 1998 and 1999 individual food products were generally less important to inflation than non-food items. However, in more recent periods, food items have registered a more significant effect on inflation levels.
The higher inflation levels erode the purchasing power of households. Lower income households are therefore re-aligning their spending so as to acquire the same products which are now more expensive (Van Aardt, 2008).
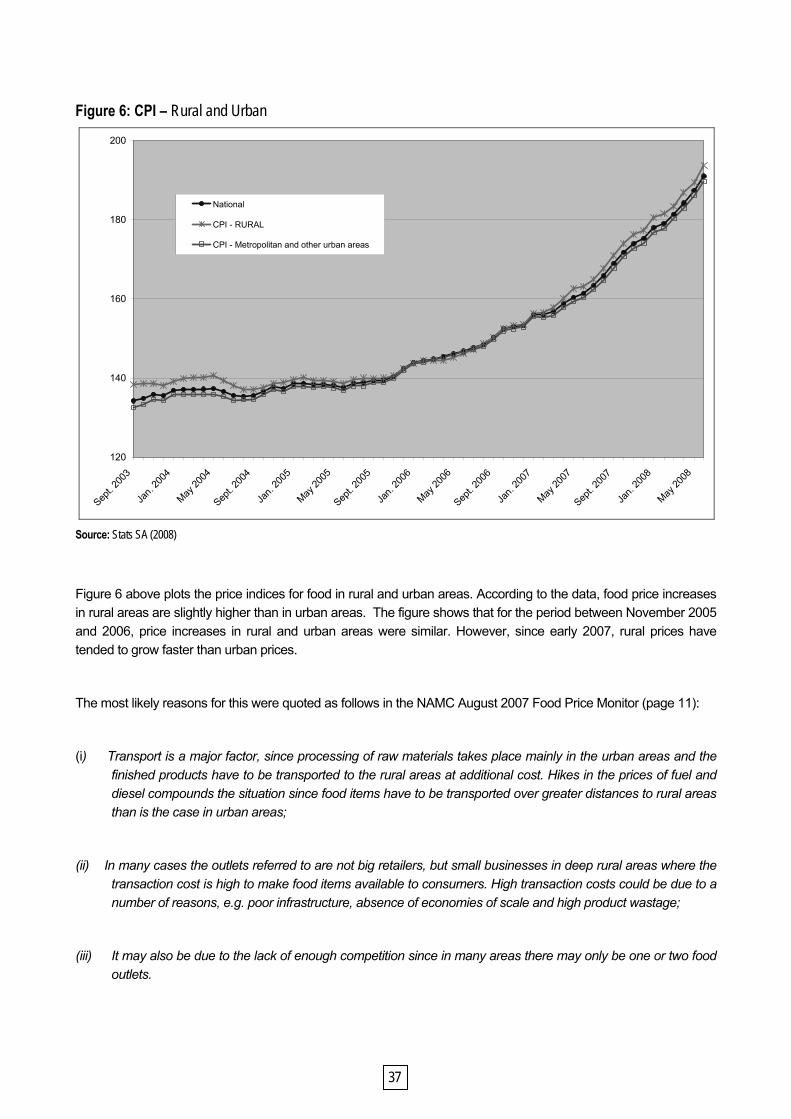
37
Figure 6: CPI – Rural and Urban
120
140
160
180
200
Sept. 2
003
Jan.
2004
May 20
04
Sept. 2
004
Jan.
2005
May 20
05
Sept. 2
005
Jan.
2006
May 20
06
Sept. 2
006
Jan.
2007
May 20
07
Sept. 2
007
Jan.
2008
May 20
08
National
CPI - RURAL
CPI - Metropolitan and other urban areas
Source: Stats SA (2008)
Figure 6 above plots the price indices for food in rural and urban areas. According to the data, food price increases in rural areas are slightly higher than in urban areas. The figure shows that for the period between November 2005 and 2006, price increases in rural and urban areas were similar. However, since early 2007, rural prices have tended to grow faster than urban prices.
The most likely reasons for this were quoted as follows in the NAMC August 2007 Food Price Monitor (page 11):
(i) Transport is a major factor, since processing of raw materials takes place mainly in the urban areas and the finished products have to be transported to the rural areas at additional cost. Hikes in the prices of fuel and diesel compounds the situation since food items have to be transported over greater distances to rural areas than is the case in urban areas;
(ii) In many cases the outlets referred to are not big retailers, but small businesses in deep rural areas where the transaction cost is high to make food items available to consumers. High transaction costs could be due to a number of reasons, e.g. poor infrastructure, absence of economies of scale and high product wastage;
(iii) It may also be due to the lack of enough competition since in many areas there may only be one or two food outlets.

38
The fact that rural populations spend roughly double the portion of their income on food (IES, 2006) compared to urban groups, leaves rural populations at a disadvantage. Moreover, rural populations face higher price increases than their urban counterparts who generally tend to have more disposable income on average, and are thus better able to absorb price increases.
The indirect impact of rising food prices on small businesses comes via the reduction in the disposable income of the business owner. Most of the small businesses under consideration are owned by people who do not fall into the high-income category. Therefore, they tend to spend a relatively high portion of their income on food, and higher food prices mean less income available for other items. The reason why this is important is because most of the small businesses that we are considering finance their expansion and cash flow requirements from their own savings, and are they unable to source other types of finance. Therefore, a reduction in disposable income translates into less money being available for investing in the business or helping to ride out adverse business periods. This makes small businesses relatively more vulnerable than other type of businesses to adverse price changes.
3.3. Food Price Forecasts
The Food and Agricultural Organisation (FAO) and the Organisation for Economic Development and Cooperation (OECD) have forecast that key food prices (cereals) will not drop in the forthcoming decade to the levels observed in the last decade. Figure 7 below illustrates that prices are likely to stand at 10% to 35% above their former levels depending on the product considered.
Figure 7: Cereal Prices
Source: BFAP (2008)
Maize
Maize cultivation areas increased in 2007/08 due to higher producer prices. However, the area under cultivation is expected to decrease by 11% in 2008/09 as production shifts to wheat and oilseeds. This is due to the sharp increases in input costs and the relative movements in the commodity market, meaning that the growth in net

39
returns on wheat and oilseeds has outpaced the growth in net maize returns. Prices are expected to continue to rise on the back of increasing import parity prices.
Figure 8: Maize Prices in South Africa
Source: BFAP (2008)
Wheat
Domestic wheat prices increased by 47% in 2007 and they increased by another 67% this year. The wheat price is expected to decline over the next two years due to lower world prices. Beyond 2010, wheat price are set to continue to rise as the exchange rate is forecast to weaken even though world prices are set to possibly stabilise.
Figure 9: Wheat Prices in South Africa
Source: BFAP (2008)

40
3.4. The International Response
South Africa is not the only country concerned about the impact of rising food prices on poverty and economic development.
A recent World Bank study on the global food crisis highlighted 3 broad categories of policy interventions, namely:
• Measures to ensure household food supply by strengthening targeted safety nets; • Measures which lower domestic food prices through short-term trade policy measures; and • Measures to enhance long-term food supply.
It is important to take a closer look at the content of the main policy recommendations, since many are particularly relevant for South Africa.
3.4.1. Interventions to ensure household food supply through safety nets.
The best option in this regard, according to the World Bank, would include targeted cash transfers to vulnerable groups. This intervention supports poorer households by increasing their purchasing power and does not reduce the incomes of poor food sellers. Various variations of this program are in existence around the world in countries such as Brazil, China, Ethiopia, Egypt, Mozambique and Sri Lanka. South Africa had its own short-term program early in 2008, where poor households were issued food vouchers which were redeemable from major supermarkets. These vouchers covered a selection of basic foodstuffs. The main disadvantage of such a programme from the point of view of small businesses is that recipient consumers are “forced” to direct food expenditure towards large retailers, whereas a cash programme lets consumers decide where to shop.
Other countries, especially in the East, have resorted to using self-targeted food-for-work programs while others have turned to emergency food aid distribution. While these measures might save costs, food for work could lead to real expenses in terms of transferring food to the beneficiaries whereas food aid has the distinct probability of becoming entrenched if used beyond the emergency period.
Lastly, school based food programs are also being taken advantage of around the world. The danger lies in that school feeding projects do not tackle the real problem which is malnutrition in young children.
3.4.2. Ensuring household food security by lowering domestic food prices.
The best option highlighted would be to lower tariffs and other taxes on key staples. Although this measure could provide some relief for consumers there is an inherent fiscal cost from lower revenues. VAT has been stated as one of the best tax measure which can be used to the benefit of poorer consumers. In South Africa’s case the majority of basic foodstuffs are already zero-rated VAT products, meaning that those goods are already tax free since they are the staples of poorer households.
Another measure which has historically been utilized is to offer bread or grain subsidies specifically targeted at the poor. Measures targeted at the poor would directly impact on their welfare. The risk with this measure is that it too could become entrenched and could translate into relatively high fiscal costs for the government.
41
For grain exporting countries there may be pressure to ban or tax exports. Unfortunately such measures tend to have a limited impact on domestic price levels, and could have a significant negative effect on the earnings of domestic producers and exporters. Ultimately this is disastrous for countries which depend on food imports.
3.4.3. Measures to stimulate medium-term food grain supply
While higher food prices are clearly a burden for poor net purchasers of food, they also represent an opportunity to stimulate food grain production and enhance the contribution of agriculture to medium-run growth.
This year the South African government has committed over R100 million to supply agricultural starter packs for households to produce their own food. More importantly emerging commercial farmers must be supported more strongly. Finally, basic investment in infrastructure will help to limit the effect of transport costs by strengthening inland transport linkages and ensuring that food can be distributed at a lower cost.
Cautionary Note Many of the above policy recommendations have significant fiscal implications. Any additional budgetary costs which are financed by additional borrowing could lead to higher inflation in an already highly inflated economy. Fiscal expansion financed through taxation of richer households for this purpose could be tricky given the political economy considerations of South Africa. Given the potentially important economic and political costs of not addressing food security, a temporary increase in the budget deficit may be warranted.
In general, government policy choices are likely to be better accepted and understood if they are accompanied by a transparent and effective communications strategy on the causes of high food prices and the accompanying policy measures.

42
4. Conclusions and Recommendations
Given the factors that influence fuel prices and food prices, different responses are required to both. The fuel price is largely determined by developments on international commodity and currency markets, and there are limited interventions that can be made by the South African government (apart from revitalising or creating non-oil based modes of widely accessible transport). Therefore, the response to rising fuel prices by small businesses has to be a business response. There are several ways in which small businesses can ameliorate the impact of rising fuel prices on their direct business costs, and these are largely related to ownership of modes of transport, which could be facilitated via a group scheme, such as FABCOS.
More specifically, small businesses will feel a significant positive impact if they are able to transport goods at a lower price and are better able to predict what those prices may be. One solution in this regard could be a not-for-profit transport business, owned by a small business organisation, operating on behalf of its members.
Other possible solutions include bringing collective pressure to bear on wholesalers and other sellers of goods in large volumes to either provide subsidised deliveries to small businesses or to set up more localised distribution systems, in return for a buying commitment from their customers. Co-operation efforts are required in this regard and information needs to be provided that is clear about the liability of those who take part in such a scheme.
The price of food, on the other hand, has a much more significant and more indirect impact on small businesses than other businesses, and requires a macro policy response, but that is not to say that a strategic business response would not be warranted. The South African government understands the severe impact on poverty and equity caused by rising food prices, but to date a tangible response has been very limited.
4.1 Recommendations on Food Production
In 2002 the government set up the Food Price Monitoring Committee under the auspices of the NAMC in order to advise the Minister of Agriculture. Although pertinent, this committee was created to solely monitor, investigate and make recommendations on prices, and cannot take any pro-active steps to reduce the price of any food item.
In the same year (2002), the government endorsed the Integrated Food Security Strategy. This strategy was developed based on five pillars:
• Food production and trade • Food safety and nutrition • Community asset development • Social safety net and food emergencies • Food insecurity vulnerability information and mapping systems.
However, the fact remains that commercial food production and sales (from farming, through to processing and sales) are primarily activities that are private in nature. Therefore, the role of government is to identify those key market factors that are contributing to rising food prices, and to work, within a market structure, to address those. The key issues here are supply, access and transparency.

43
4.1.1 Increasing the level of Food Production
Sustained production of key food stuffs is the key to keeping prices low. One key issue in increasing agricultural production is to address the issue of land re-distribution in a different way. Recently there has been much debate about the fact that a significant amount of re-distributed commercial agricultural land has failed to remain as productive under its new owners. There is an emerging view in South Africa that enhanced agricultural productions levels should take precedence over land re-distribution issues. This line of thinking presupposes that the goals of land re-distribution and food production are mutually exclusive, which they are not.
However, it is clear that the current approach to land re-distribution is doing very little for either national food production or rural livelihoods, and a drastic re-think of how these programmes are designed, implemented and supported is required. The national government and local agriculture ministries must be lobbied to offer greater support to emerging farmers in order to not only secure food supply but to accelerating economic growth by supporting viable emerging farm operations.
One of the most important issues around developing emerging farmers is the provision of adequate and suitable support services.
The key institutional support issues that contribute to agricultural project failure are around:
o Training and skills development; and o Project management and oversight.
Training and Skills Development
All small enterprise development projects require technical support and mentoring, to compensate for low levels of management, technical and financial skills. It is clear that agricultural projects require more of this type of support than many other types of projects, over a longer period of time, but they seldom receive it. Unlike training for a manufacturing or production enterprise, which can be condensed into a few weeks, and applied immediately on the job, agricultural production is both seasonal and requires experiential learning. A person cannot learn the correct way to manage calving if he does not have the opportunity to practice under supervision of a trainer, and a cow cannot be commanded to give birth at the time that the trainer is available. Given that mixed agricultural enterprises tend to run in 12-month cycles, following the seasons, this is the minimum time period over which hands-on support (in addition to training) must be available. There are a very large number of agricultural skills that cannot be taught in a classroom. Soils, weather patterns, animals, etc all behave and produce differently in different locations and different times.
A very important part of creating a successful agricultural enterprise is learning on the job. Training is certainly beneficial, but there are many, many things that make someone a good farmer that are only learned by experience. The result of this is very often that, in the first year (or few) of a project, the quality of goods produced is of a lower standard. It is often very difficult for the project to sell these items for a price that will even cover their costs. Once again, the problem is compounded when the project is based on a monoculture.

44
Project Management & Oversight
Previously disadvantaged rural communities cannot reasonably be expected to manage a project on their own, without the input of specialised skills. The failure of existing institutional support structures in this regard is well documented. To date, most of the government’s focus on developing agricultural projects has been on making land or finance for capital equipment available. Although these are both necessary inputs, in the absence of the necessary management support structures they cannot guarantee project success. The main stumbling block to providing these services to more projects is the cost, but project designers should be aware of the reality that failure to allocate a portion of funding to this requirement may very well result in all the funds allocated to the project being wasted. In this regard, project funders need to develop a more pragmatic “value for money” approach towards the allocation of funds, on the basis that the value of each Rand allocated to production can be leveraged up by every Rand that is allocated to management and oversight, and reduced in value by every Rand that is not allocated to management and oversight.
4.1.2 Increasing access to food for the poor
The key issues here are:
o Supporting households to produce more of their own food; and o Developing effective social safety net and food emergency responses; and o Developing effective food vulnerability mapping systems.
Communities need to be at the forefront of tackling the food crisis. The creation and maintenance of community assets such as communal urban and rural garden farms will give communities local sources of fresh fruits and vegetables, thereby reducing the share of disposable cash income that is spent on food. In particular, food gardens in rural areas can have a significant impact, given the fact that rural populations tend to be poorer and face higher food prices.
Given that nearly half of South Africa’s population lives below the poverty line and is thus very vulnerable to rising food prices, government must create a safety net for those individuals who cannot afford even the most basic of foodstuffs.
The government has already started issuing food vouchers for poor households. Linking the “cashing in” of these food vouchers to emerging producers and small enterprises (particularly local businesses) will bring additional benefits, through “recycling” those funds through the local community and supporting small businesses. Therefore, government support programmes need to look at all the ways in which support for poor consumers can translate into opportunities for poor communities.
The government needs coherent, timeous and comprehensive information on households which require assistance. In this regard, standardized poverty measures are needed so as to identify the neediest of households.
4.1.3 Greater transparency
There is very little detailed information available in South Africa about agricultural value chains and the share of each market participant in the final price. Given the seasonal nature of much agricultural production, it is not easy to

45
make quick conclusions. In an environment of rising food prices and angry consumers, retailers and producers are quick to accuse each other of being the source of high food inflation.
It is important that there is a detailed investigation of all the main food value chains in South Africa. This is not so much so that “blame” can be apportioned for a particular price, but rather because unless we clearly understand the detailed drivers of the food prices that consumers have to pay, policy interventions will be a question of guesswork.
In terms of rising food prices, there is very little that individual small businesses can do to ameliorate the impact, on their own households and businesses. Therefore, it will be important to support and lobby for the structured public sector interventions outlined above.
4.2. Recommendations Pertaining to the Business Operators
A number of recommendations emanate from the fact that FABCOS’ members mainly operate within the informal
sector. Whereas there are many definitions and groupings of what constitutes informality and whilst numerous
factors can be reported that shape and trigger a process of graduation from informal to formal activities, some of
the characteristics associated with informality are worth noting for the purpose of generating a process of positive
change.
4.2.1. Tapping into current government support and working with the authorities
Informal businesses and operators are constrained by factors which operate at a variety of levels. Nevertheless,
key constraints are located at the individual and business unit level: the lack of human and financial capital.
The South African authorities are actively trying to help reduce both aforementioned constraints. The second
economy is a key target area for the Accelerated Shared Growth Initiative of South Africa (ASGISA) and it is
relatively clear that issues pertaining to informal activities have started to find their ways into the policy arena. For
the purpose of informal traders, efforts have been most evident through an expansion of the capacity and role
played by the Small Enterprises Development Agency (SEDA). The scope of SEDA’s interventions themselves has
moreover grown progressively.
Of note for FABCOS is the fact that SEDA has a key role to play in enhancing specialised and entrepreneurial
skills. The Agency has, moreover, some amount of commitments towards informal traders. In 2006 SEDA also
worked with the African Co-operative for Hawkers & Informal Businesses (ACHIB) by providing training to the
members of ACHIB. More broadly, SEDA provides information, helps businesses with registration, promotes co-
operatives and facilitates access to financial services.
46
It is important to note that government has a role to play in facilitating economic activities, irrespective of whether
these are formal or informal in nature. Difficult legislation and unfavourable borrowing conditions (including high rate
of interests and difficulties in establishing collateral to expand a business) contribute to the difficulties currently
experienced by the informal trading sector. Issues at this level can be raised and negotiated by FABCOS with the
relevant authorities. In contrast, it is worth emphasizing that little attention is paid by government to the conditions
affecting the trading sector per se. This is also an area in which FABCOS can engage with some negotiations.
Government (more specifically the Department of Trade and Industry) is still weakly informed about the issues
facing the traders and this is another role which FABCOS, as a representative association, can play in this regard.
A strengthened platform for dialogue that takes into account other informal traders association (e.g. ACHIB noted
above), might further contribute to putting issues that are specific to informal traders closer to policy makers.
4.2.2. Developing Business Skills
In addition some recommendations can be made that are specifically linked to the fact that those who operate
informal businesses have limited endowments e.g. limited capital, skills, etc. The observation that those who secure
a livelihood from the informal sector have limited levels of skills is frequently raised for the recurrent
recommendation that skills need to be developed. Limited access to capital by micro and very small economic
actors has also generated steps seeking to make capital easily and more cheaply available in South Africa. In
parallel, it is also recognized that informal actors who are involved with trading activities are linked to a limited
number of key suppliers. Steps to enhance the links with these are important. Beyond these broad
recommendations is the fact that the economic segment within which spaza shop owners, taverns, etc. operate is
characterized by low barriers to entry, limited investments, very intense competition and limited product diversity. It
is around these dimensions that basic business skills (e.g., inventory, accounting and marketing) are important.6
The fact that few business skills are developed around the informal activities has been documented in both the
greater Johannesburg and Durban informal work surveys7. This dimension is critical for a number of reasons.
Firstly, a large proportion of those engaged with informal trading activities in South Africa do so for survivalist
reasons. Women in particular exhibit this feature since they operate within the informal economy to survive as well
as to support their households. Secondly, because the informal sector offers the opportunity to earn a little income
while economic conditions are deteriorating in South Africa (and will continue to be poor for some more time to
come) and because migration from the rural into the urban areas is continuing, new entry into the informal sector is
growing.8 Thus, whilst the body of the report has noted growing competition between informal and formal traders, it
6 For instance Skinner (2005: 34) notes for Durban that “[t]he rate of general record keeping is very low”, standing at 47.5% in 2005 amongst informal actors in Durban.
7 When attempts were made to establish the income and expenditure level of those involved with the sector
8 It is internationally recognised that there is a link between poor economic conditions and the expansion of the informal sector. In particular, the informal sector is associated with absorbing retrenched workers in a context of limited welfare support and in the absence of safety nets.
47
should be emphasized that, in parallel, competition between informal traders is intense. It is also set to grow further
from within the informal economy itself.
Whilst the development of business skills would possibly offer some amount of resilience to shocks to those
operating informally, we must positively note that informal trading occurs because of unsatisfied demand for
services and products. There is, in other words, a niche component in the presence of informal activities. These
niches and core areas of competences need to be identified by the FABCOS members before these can be
strengthened and business/management training can be designed.
4.2.3. Developing a locational advantage
Locational characteristics are important for competitiveness and for entrepreneurship. Poor infrastructure (in the
sense of inadequate access to water, to electricity and to a safe trading place - for instance spaza shops are
spaces that are frequented by women and children) matters for the customers of FABCOS’ members.
Strategies need to be put in place for the trading spaces (and for the taverns) to be made more attractive.
“Attractiveness” refers here to a clean space where products are well laid out and/or easy to locate, to a space that
is well advertised (with functions easy to identify) etc.
Generally, a poor location and a poor locale will dampen consumer loyalty to a particular shop/tavern. In parallel,
geographical location might affect the setting up of particular business equipment - refrigerated units, for instance,
need a regular supply of electricity – and the business client base. In turn, infrastructure problems and location
issues affect quality standards (for instance hygiene) which affect linkages with other actors (including suppliers)
and weaken leverage possibilities. Location also determines the type of premises available as well as the
investments which a shop owner or operator will make over the trading or operator space. A particular point here is
that investments into the shop or trading space need to be made to ensure consumer satisfaction and loyalty, as
well as to enhance visibility. This is particularly important when economic conditions are poor.
Government has a role to play to ensure that basic components of infrastructure are in place, since the
establishment of infrastructure by the traders themselves significantly would increase their operating costs. There is
a twist in this: informal traders have typically limited access to public infrastructure. The point nevertheless remains
that the traders have to look after their premises and space to help develop consumer loyalty. Also, the space might
need to be altered to allow for cheaper products to be better displayed. In a similar line, some amount of
partnership within the community can also be investigated for spaza operators to provide cooked food to their
consumers if there are opportunities for this and if standards of hygiene are acceptable.
However, economic growth is not systematically observed to be associated with a reduction of informal activities (and the number of those involved with a sector). A range of factors in fact matters for the presence and development of informal activities.

48
The “limited market” characteristic confronting informal units is typically associated with the fact that informal units
compete with the same customers in a particular area. Differentiation is an important feature of the survival of
informal enterprises. Efforts are required by the FABCOS members themselves to identify the possibility for further
differentiation.
Whilst differentiation requires that a minimum amount of business skills is in place, FABCOS members should
perhaps investigate how credit is obtained by the consumers in their vicinity: whereas some efforts have been
deployed by the authorities towards enhancing access to finance by the operators, consumers have found
themselves penalized and increasingly constrained in their borrowing ability. Consumer credit is another area which
FABCOS might want to investigate in the future in co-operation with support available from government.
4.3 Recommendations on Food Retailing
Retailers (informal and otherwise) have three easily identifiable areas of operation. These are:
• Managing relationships with producers and suppliers,
• Managing logistics such as distribution and stock, and
• Developing and maintaining customer relationships.
The recommendations herein apply to these three functions.
4.3.1 Managing Relationships with Producers and Suppliers
This critical factor relates to the source of members’ stock items. The maintenance of sustainable partnerships
gives informal traders the leverage to negotiate lower prices with the suppliers with whom they have developed
relationships.
The process of sourcing goods is principally linked to the cost price incurred by traders in that it determines the
costs associated with acquiring goods. FABCOS as a large body can be at the forefront of exploring and advising
its members on alternative and cheaper suppliers. In parallel, a pooled purchasing effort of bulk goods could prove
highly profitable, since, individual members would be able to capitalize on lower per unit costs.
Other options to ensure the decline of food prices for poor households are scarce. The text box below serves to
highlight some other options currently being discussed.

49
Value Added Tax (VAT)
In essence food is becoming expensive. The issue of taxation of basic foodstuffs has been raised recently
especially in political discourse by COSATU. The zero-rating of more basic foodstuffs has been mooted, but the
National Treasury has not minced its words; Finance Minister Trevor Manuel said earlier this year that any
additional zero-rating would not necessarily impact on the poorer households as richer households generally spend
more on food than their poorer counterparts.
Currently there are 19 basic foods which are zero-rated for VAT purposes. This basket includes the majority of
basic foodstuffs consumed by lower income households. Foodstuffs currently listed include oil, bread, mielie meal
and fruits and vegetables. Those currently lobbying for the zero-rating measure have not successful mentioned
which (if any) other foodstuffs could be zero-rated for the greater benefit of poor households.
An alternative approach would be to consider the “formalization” of informal enterprises. Through this measure
small enterprises would be entitled to reclaim the VAT costs incurred by them and transfer them to the larger
wholesalers. This measure would undoubtedly translate into visible cost savings which can only be accessed
through formal administrative registration.
The transition from an informal to a formal operation is complex since it has been associated with added costs and
burdens especially on the sellers. A cost-benefit analysis of the transition could serve the purpose of ascertaining
whether this move would be beneficial to more FABCOS members.
An aspect to draw upon (with regard to managing relations) is that the informal sales channel is increasingly being
integrated by mainstream retailers and wholesalers. Some producers have indeed incorporated the informal
segment as part of their multi-channels model. Other producers are also engaging with a revamping of spaza
shops to enhance their images and are developing new packaging tactics designed specifically for the lower
income segments (e.g. smaller shampoo packets for the poorer people). Unilever, as a group, has undertaken
much research into expanding its sales amongst the poorer through measures such as these.
FABCOS needs to investigate the availability of particular products targeting the poorest income segment directly
from producers and might want to approach particular groups (e.g. Unilever) to enquire about the full portfolio of
products. In parallel, dedicated or specialized wholesalers also need to be approached since their prices are
typically below those of more general “wholesalers” (e.g. Makro).
50
4.3.2 Managing logistics including distribution and stock
As discussed in the report, the sourcing of stock items is a critical component in determining the competitiveness
(and profitability) of an enterprise.
The management of distribution channels allows for the efficient utilization of transportation modes in sourcing
goods. FABCOS is positioned to explore means of deploying logistics and lobbying for the development of
infrastructure with the aim of developing linkages to the mainstream suppliers and to offer consumers easy access
to their “markets”. The proximity of an enterprise to its supplier has an expected impact on the profitability of an
enterprise, since the location is a key determinant in the pricing procedures (where transportation is a critical cost
especially for smaller firms).
FABCOS could consider developing transport booking offices for shared logistical use. Other means could entail
the establishment of shared storage facilities and even the introduction of shared transport operations aimed at
utilizing pooled vehicles. Small businesses such as FABCOS members will need to develop strategies to improve
logistical operations. Due to low volumes in goods purchased, innovation and collaboration will be the key to
mitigate against high transport costs. The management of stock is also a critical skill for any successful enterprise.
Given that business administration skills are usually lacking in informal enterprises, an opportunity exists for
FABCOS to engage public training institutions in order to impart basic administrative skills to their members. Basic
bookkeeping and stock control mechanisms would go a long way towards empowering small enterprises to have
better financial control over their businesses and their employees.
4.3.3 Developing and maintaining customer relationships
Small enterprises must develop and maintain customer relations. Given that FABCOS members are in essence
small operators, this is especially critical. Market orientation (i.e. the use of market-related information on
consumers) can also be utilized in order to cater for popular preferences. Enterprises should strive to provide the
right products in the right quantities at the right price.
Businesses need to be innovative so as to gain insights about their regular customers and preferences. Information
on the gender of buyers, frequency and volume of purchases, as well as average expenditure could be highly
useful in exposing local purchasing patterns.
Small businesses with this kind of insight are better positioned than their competitors (other traders) to cater for
their immediate consumer base. These enterprises are therefore equipped to adapt to the changing preferences of
their consumers.

51
Lower income buyers are highly price sensitive and small business owners must be aware of this fact. When faced
with higher prices, consumers will:
I. Stay with a particular retailer or service provider but buy alternative (cheaper) products (if the cost of
shifting another supplier is comparatively high) or
II. Switch retailers and buy the same products if prices are sufficiently lower elsewhere.
The shopping preferences shown by consumers present small enterprises with a choice predicament. Small
enterprises must be able to respond most readily to option one above. Switching retailers has associated costs,
and consumers weigh these according to the shopping experiences of the various competing retailers. The cost of
goods, variety of stock, and the proximity and associated transport costs of getting to the business are all factors
which determine the consumers’ experiences. Co-operation between suppliers and retailers (or retailer-to-retailer
co-operation) can be crucial to providing customers with the right products, at the right levels and at the right price.
FABCOS as a business member organisation gives small enterprises a platform to
lobby together for the creation of sustainable business linkages
52
References
Bureau for Food and Agricultural Policy Research (2008), The South African Agricultural Baseline, pages 9-13
Central Energy Fund (2008), Petroleum Product Prices. Available at http://www.cef.org.za/content/view/42/39/
Ittman, H.W. (2007). State of Logistics Survey for South Africa - 2006, CSIR. Available at www.csir.co.za/Built_environment/Logistics_and_quantitative_methods/index.html [Last accessed 7/10/08]
Energy Information Agency (2008). World OPEC Average Spot Price. Available at http://tonto.eia.doe.gov/dnav/pet/hist/wtotopecw.htm [last accessed 12/10/08]
Martins, J.H. (2005). “The household food budget of the wealthy and poor in South Africa”. Journal of Family Ecology and Consumer Sciences 2005, Volume 33:37-45.
National Agricultural Marketing Council (2007). The South African Food Cost Review, 2007. Table 1, page 3. Available at http://www.namc.co.za/pages/pub_FoodPriceMonitoring.htm [last accessed 14/10/08]
National Agricultural Marketing Council (2007). The South African Food Price Trends, August 2007. Page 11. Available at http://www.namc.co.za/pages/pub_FoodPriceMonitoring.htm [last accessed 14/10/08]
National Agricultural Marketing Council (2008). Quarterly Food Price Monitor, May 2008. Available at http://www.namc.co.za/pages/pub_FoodPriceMonitoring.htm [last accessed 6/10/08]
Skinner, C. (2005) “Constraints to Growth and Employment in Durban: Evidence from the Informal Economy”, School of Development Studies, Research Report No. 65. Durban: School of Development Studies, University of KwaZulu-Natal
South African Petroleum Industry Association (2006), Annual Report 2006. Available at http://www.sapia.co.za/pubs/2006.htm [last accessed 10/10/08]
Statistics South Africa (2008). Historical CPI, Statistical release PO141 (2008). Available at www.statssa.gov.za/timeseriesdata/t_series_data/excell/Consumer%20Price%20Index%20(200809).zip [last accessed 02/10/08]
Statistics South Africa (2006). Income and Expenditure Survey 2006, Statistical release PO100. Available at http://www.statssa.gov.za/ies/publications.asp [last accessed 02/10/08]
Van Aardt, C.J. (2008). Income and Expenditure Patterns of Households in Gauteng. Bureau of Market Research, University of South Africa.
53
Wakeford, J. (2006). The Impact of Oil Price Shocks on the South African Macroeconomy: History and Prospects. Paper presented at the TIPS/DPRU Conference, 18-20 October 2006.
World Bank (2008). Rising Food Prices: Policy Options and World Bank Response. Background note, April 2008. Available at http://siteresources.worldbank.org/NEWS/Resources/risingfoodprices_backgroundnote_apr08.pdf [last accessed 29/10/08

