the impact of roo on africa’s textiles and clothing trade ... · the impact of roo on africa’s...
TRANSCRIPT

The Impact of ROO on Africa’s Textiles and
Clothing Trade under AGOA ***
Terrie L. Walmsley* and Sandra A. Rivera** Center for Global Trade Analysis,
Purdue University
Paper prepared for: The 7th Annual Conference
On Global Economic Analysis
June 17-19, 2004 Washington, DC
*Corresponding author: Co-Director, Center for Global Trade Analysis, Department of Agricultural Economics -Purdue University, West Lafayette IN 47907, U.S. ; (765)494-5837; [email protected] **Visiting Scholar, Center for Global Trade Analysis through the Office of Economics, U.S. International Trade Commission, [email protected]
*** Draft; do not quote without explicit written permission of the authors. The findings, interpretations, and conclusions expressed in this paper are entirely those of the authors and do not necessarily represent the view of the U.S. International Trade Commission or any individual Commissioner.

2
I. Introduction
Bilateral trade agreements have become more prevalent since the end of the Uruguay
round, leading to continuing uncertainty about future multilateral trade negotiations. While
bilateral negotiations could potentially lead to welfare improvements for the economies involved,
often these agreements are hampered by exceptions and restricting rules which reduce these
welfare gains considerably. The ROO clauses which permeate many of the current bilateral
agreements are an example of such a restriction which could significantly reduce the impact of
these agreements. Current research suggests that these ROO could reduce or eliminate
completely the gains from bilateral agreements.
Despite evidence that ROO could have a substantial impact on gains from trade
agreements, there has been very little research undertaken to include these rules in our analysis of
bilateral trade agreements. This is not surprising since the incorporation of such rules and the
way in which these rules cause agent’s to significantly alter their behavior is difficult to model.
In this paper, we model how the African Growth Opportunity Act (AGOA) affects
welfare in the regional areas of Africa compared to other world regions. The paper follows the
earlier work by Rivera, Agama and Dean (2003), with one important addition: ROO constraints
are explicitly executed into the data base and model. Our aim is therefore to examine not only
how this agreement is likely to affect the African and US economies but also how the
incorporation of ROO affects these welfare gains to Africa and the U.S.. Mattoo et al. (2002)
argue that much of the impact of AGOA is linked to the ROO requirements that are to be kept in
place until September 2004.1 The incorporation of ROO into the analysis of AGOA therefore
enables the results to be viewed more credibly.
Following the introduction, we examine in more detail the history behind the AGOA
agreement. Then in section 3, the methodology is outlined including the modifications made to
the model and the data. We also outline the experiments and the shocks undertaken. In section 4,
the effects of the AGOA agreement are examined. We compare the impact on the African
economies with and without taking the ROO clauses into account. In section 5, some policy
implications and conclusions are drawn from this analysis.
While this paper takes an initial step towards modeling ROO clauses in a bilateral
agreement, this research and the modeling of ROO is still in its infancy. Further work still needs
to be undertaken to examine the decision making process of and the costs to producers of altering
1 For a fuller discussion of relevant literature, see Sandra Rivera, Laurie-Ann Agama and Judith Dean, “Africa Beyond 2005: Understanding the Impact of Eliminating NTBs and tariffs on Textile and Clothing,” presented at the 6th Annual Conference on Global Trade Analysis, June 12-14, 2003, The Hague, The Netherlands. Full text available at www.gtap.org.
3
the suppliers of their intermediate inputs to be ROO compliant.
II. Background to AGOA
The AGOA was implemented as part of the U.S. Trade Act of 2000; in the same
legislation, the Caribbean Basin Trade Preference Act (CBTPA) was also enacted. CBTPA and
AGOA have very similar although not identical provisions. The general intention of AGOA was
to provide the developing economies increased access to U.S markets, and in particular the
clothing market, in exchange for making progress toward a market economic principles. To be
eligible for the unilateral program, countries must show the U.S. that they are making progress
toward a market-based economy, free trade, rule of law and protection of worker rights, and
economic policies that fight poverty. Although no country is expected to enact all said changes,
according to U.S. policy makers, “these criteria have been embraced by the vast majority of
African nations.”2 This annual determination is announced by the White House annually at the
end of each year.3
As such this unilateral program provids for duty-free and quota-free treatment for certain
products imported from eligible Sub-Saharan Africa (SSA).4 Of interest to this paper, the AGOA
agreement provides zero tariffs and quota free access to the U.S. market for clothing made in
eligible SSA countries from U.S. fabric, yarn and thread. The Act also allows for the growth of
clothing made from fabric produced in eligible SSA countries until September 30, 2008.5 Under
a Special Rule, lesser developed beneficiary countries (LDBCs) have duty-free U.S. market
access for clothing made from fabric and yarn originating anywhere in the world until September
30, 2004. 6 This original agreement is referred to as AGOA I.
2 Other areas of interest include elimination of barriers to U.S. trade and investment, protection of intellectual property, efforts to combat corruption, policies to reduce poverty, increasing availability of health care and educational opportunities, protection of human and worker rights; and elimination of certain child labor practices. For more information, see www.agoa.gov/eligibility/eligibility.html. 3 For example, in December 2003 Angola was removed from the list of SSA beneficiary countries and the Central African Republic and Eritrea were added. For more detail, see www.whitehouse.gov/news/releases/2003/12/20031230-8.html. 4 For more detail, see USITC, Year in Trade 2003: Operation of the Trade Agreements Program, Publication 3510, May 2003, especially chapter 5. 5 Clothing items made with African fabric and yarn are subject to a limit of 1.5 percent of overall U.S. clothing imports (U.S. consumption) beginning in 2000, and growing to 3.5 percent of overall U.S. imports over an 8-year period. The Trade Act of 2002 doubles the limit to a new level of 3 to 7 percent over 8 years. For more detailed information, see USITC, U.S. Trade and Investment with Sub-Saharan Africa, 4th Annual Report, Investigation 332-415, Publication 3650, December 2003, especially chapter 2, and www.agoa.gov. 6 Under AGOA, LDBCs are defined as designat ed SSA beneficiary countries with a per capita GNP of less than $1,500 in 1998. AGOA II exempts Botswana and Namibia from this constraint, granting these two countries LDBC status. Right now, there is a bill in the U.S. Congress continuing these privileges and is expected to pass by September 2004.

4
The U.S. Trade Act of 2002 modified and expanded these AGOA provisions allowing the
special clothing provision, which allowed for duty-free access to the U.S. market, to apply to
imports from eligible SSA countries. The Trade Act of 2002 also amended AGOA by doubling
the limit for clothing made in SSA beneficiary countries from regional fabric made with regional
yarn from the previous level (of 1.5 to 3.5 percent of U.S. consumption) to a new level (of 3 to 7
percent over 8 years).7 In January 2004, 37 of 48 eligible SSA countries had been designated
AGOA beneficiary countries; of these 37 countries, 23 had met the additional special clothing
provision outlined in the Trade Act of 2002. 8 This special clothing provision allows for
producers in these countries to use third country fabric and yarn in qualifying clothing items. In
addition, knit-to-shape clothing qualifies as does hybrid cutting conducted in both U.S. and
AGOA countries.9 This modified agreement is known as AGOA II.
To qualify for the special clothing provisions, AGOA beneficiary countries must meet
certain criteria that ensures illegal transshipment does not happen and thus AGOA benefits are
exclusively enjoyed by AGOA beneficiaries. To be eligible for the special clothing provision,
beneficiary countries must implement an effective visa system and have legislation and
administrative procedures that prevents transshipments and use of counterfeit documents. In
addition, beneficiary countries must follow procedures that enable verifying the product origin
shipped from these countries to the U.S.10
AGOA’s passage professes to provide significant opportunities for SSA garment
exporters. In addition to increased foreign direct investment flows, AGOA has been credited with
improving the business climate and generating more regional cooperation to take advantage of the
provisions. For example, investing in infrastructure has increased and there has been some
7 This broadening of the AGOA preferences has been come to be analogous to AGOA II. Herein, we will refer to these preferences as AGOA. See USITC, Sub-Saharan Africa, publication 3650, December 2003, especially chapter 2. 8As of December 2003, The 37 AGOA beneficiary countries are Angola, Benin, Botswana, Cameroon, Cape Verde, Chad, Republic of Congo, Côte d’Ivoire, Democratic Republic of Congo, Djibouti, Ethiopia, Gabon, Gambia, Ghana, Guinea, Guinea-Bissau, Kenya, Lesotho, Madagascar, Malawi, Mali, Mauritania, Mauritius, Mozambique, Namibia, Niger, Nigeria, Rwanda, Sao Tome and Principe, Senegal, Seychelles, Sierra Leone, South Africa, Swaziland, Tanzania, Uganda, and Zambia. The 23 countries that qualify for the special clothing provisions are Benin, Botswana, Cameroon, Cape Verde, Cote d’Ivoire, Ethiopia, Ghana, Kenya, Lesotho, Madagascar, Malawi, Mali, Mauritius, Mozambique, Niger, Namibia, Rwanda, Senegal, South Africa, Swaziland, Tanzania, Uganda, and Zambia. See www.whitehouse.gov/news/releases/2003/12/2003-8.html.
9 Two countries, Mauritius and South Africa, were disallowed from using the special clothing provision in the AGOA legislation. 10 For more detail, see 2003 Comprehensive Report on U.S. Trade and Investment Policy toward Sub-Saharan Africa and Implementation of the African Growth and Opportunity Act, Third of Eight Annual Reports (May 2003), especially chapter 3. www.agoa.gov

5
reduction of bureaucracy.11 Significant increases in textiles and clothing trade occurred in 2002,
accounting for 8.9 percent of total AGOA exports to the United States, up from a 4.4 percent
share in 2001. In addition, many countries in SSA, including South Africa, committed to a
program of trade liberalization, resulting in expanded levels of textiles and clothing trade. The
textile manufacturing industry in SSA is a small, albeit growing, industry.
In 2003, AGOA accounted for 55 percent of total U.S. imports from the region. The
overwhelming majority (80 percent) of AGOA 2003 imports into the U.S. were petroleum
products. Excluding fuel products, AGOA imports were slightly less than $3 billion, of which
textile and clothing total 1.2 billion, demonstrating an impressive growth rate of 50 percent over
2002. 12 Although the U.S. is Africa’s largest single country market, purchasing almost 21 percent
of the area’s exports in 2002, Africa accounted for less than 2 percent of U.S. merchandise
imports.13
The United States, EU, and Canada still maintained high tariffs and quantitative
restrictions on many textile and clothing imports from more than 40 countries as of 2003.14
Under the Uruguay Round, the Agreement on Textiles and Clothing (ATC, replacing the Multi
Fiber Agreement) began the process of integrating textile and clothing trade. Under the ATC,
QRs were to be eliminated in three stages over a 10-year period, ending on January 1, 2005. 15 As
we approach the final months of the ATC, little liberalization has actually occurred, as the final
49 percent of textile and clothing trade is to be integrated on January 1, 2005. 16
11 USITC, Sub-Saharan Africa 332-415, Publication 3650, December 2003, p. 2-10 and especially tables 2-6 and 2-7, pp. 2-17 to 2-22. 12 International Trade Administration, U.S. Department of Commerce, U.S.-Africa Trade Profile , p. 1. (find website…) 13 The EU accounted for 43.3 percent of Africa’s exports in 2002. If recognized as one country, EU would be SSA’s largest single-country market. Ibid, 3. 14 The AGOA removed U.S. quotas on clothing imports from Mauritius and Kenya in 2000. These barriers originated under the Multi Fiber Agreement, which permitted the use of quantitative restrictions on imports of T&C without compensation. The quantitative restrictions negotiated under the MFA are voluntary export restraints. As such, these barriers were discriminatory, differed from country to country in terms of product coverage and degree of restrictiveness; and generated a transfer of rent from the importing country to the exporting country. 15 Beginning Jan. 1, 1995, countries were required to: integrate at least 16 percent of textiles and clothing trade into the GATT regime, based on their respective 1990 import volumes; implement accelerated annual growth rates for the remaining QRs, with an increase of 16 percent for the major supplier countries and 25 percent for small suppliers. Starting Jan. 1, 1998, an additional 17 percent of trade was integrated, and quota growth rates were increased by 25 percent for major supplier countries and 27 percent for smaller suppliers. Finally, on Jan. 1, 2002, an additional 18 percent of trade was integrated and annual growth rates for the remaining quotas were increased by 27 percent. 16 In its first report, the Textile Monitoring Body of the WTO stated that, with one exception, the products integrated by the importing developed countries in the first stage were not subject to quotas and consisted mainly of relatively lower value-added products, such as yarns and fabrics. The Body also stated that

6
Sub-Saharan African trade is occurring in an international context of textiles and clothing
trade liberalization, and SSA export opportunities are evolving together with shifts in the posit ion
of competing suppliers. The goal of AGOA was to give SSA an earlier start in building capacity
before the full implementation of the ATC. Thus, the execution of ATC’s final stage in January
2005 can be expected to have a deep impact on trade, as international textiles and clothing
producers are forced to rationalize production methods and wages. Throughout the processes,
higher cost producers are displaced by more efficient producers. Although the ATC will impact
this region, the implementation experiment is beyond the scope of the current work and is
addressed in an upcoming paper.
III. Methodology, Data and Shocks
a. Methodology and Data
The data and model used for the analysis is derived from the Global Trade Analysis
Project (GTAP), which is widely used for international trade policy analysis. We apply a
modified version of the static model (Hertel and Tsigas, 1997) to an aggregation of the GTAP
Data Base v.5.4 (Dimaranan and McDougall, 2002), which combines detailed bilateral trade,
transportation and protection data, and accounts for inter-regional linkages among economies and
input/output data bases for inter-sectoral linkages within countries. The model used herein
assumes perfectly competitive markets and constant returns to scale technology. The database
includes a fully specified record of trade transactions and duties among different regions for the
commodities (Gehlhar et al. 1997).
We employ a 14 region (SACU, Other Southern Africa, Rest of SSA, Latin America,
Mexico, Central America/Caribbean, China, Old NICs, ASEA, South Asia, U.S., Canada, EU-15
and Rest of World), 12 sector aggregation (textiles; clothing; cotton; crops; animal agriculture;
crops; mining; food; heavy manufacturing; light manufacturing; utilities; construction; services)
to conduct our scenarios.
The model and database are modified in two important ways to incorporate ROO. First,
clothing production in the AGOA countries is split into two distinct commodities: one which
does not comply with the ROO and a second commodity which does comply with ROO.
The total value of production of ROO compliant clothing produced is set equal to 10
percent of the U.S. quota. This reflects that in 2000, it was established that 15 percent of the
quota was being filled by the African economies. Therefore in 1997, the proportion of the quota
products integrated in the second stage consisted mainly of relatively lower value-added products. In its second report, the Textile Monitoring Body confirmed these conclusions, and emphasized that the large majority of products under restrictions would be integrated between Jan. 1, 2002 and Jan. 1, 2005. See WTO (2001), par. 277-281, 329.

7
filled is most likely to be somewhat less than 15 percent.17 This production is then allocated
across the African regions in the same proportions as their production of clothing.
The incorporation of a ROO compliant clothing commodity adds an additional level of
choice for U.S. consumers of clothing. 18 Figure 1 below demonstrates this choice. First the U.S.
consumers choose how much clothing they wish to purchase, whether it will be purchased from
domestic or foreign suppliers, and which foreign suppliers. Then, if they are choosing African
clothing, they will select whether they wish the ROO compliant variety or the non-ROO
compliant variety of clothing. In all cases, the standard GTAP elasticities are used. In the
decision on whether to purchase the ROO compliant commodity or the non-ROO compliant
commodity, an elasticity equal to double that at the previous level19 is used. U.S. tariffs and
quotas (tariff equivalents) are then only reduced on the ROO compliant variety of clothing from
the African regions.
17 Given the values provided in the GTAP data base for 1997 it was not possible for 15 percent of the quota to be filled by the African economies – hence 10 percent was chosen. 18 It is assumed that only the U.S. will demand this ROO compliant clothing commodity and only the African economies will supply it. It is not significantly differentiated from the clothing commodity currently produced in Africa to warrant other consumers paying the higher prices. Note that while the equations allow for other commodities to purchase the ROO compliant commodity the value of initial purchases and hence updated values are zero. 19 In the GTAP model, this elasticitiy is ESUBM. For clothing, it has a value of 8.8 and hence, we use 17.6 for the decision between clothing variants.

8
Figure 1: Decision tree for U.S. Private Consumer/Government20
USA Consumer (private or
government)
Commodity 1 Clothing Commodity n
Domestic Imports
Africa
ROO clothing
Other Regions
Non-ROO Clothing
The second modification is that imports by firms must now be traced to their source. The
data and model are modified so that firms (and government and private consumption) can now
track not only how much they want to import, but also from which region they wish to import.
Hence for all intermediate inputs (e.g. textiles in Figure 2), the producer chooses how much it
requires, and whether it will source these intermediate inputs from domestic or imported sources
Finally, the producer will then choose from which country to purchase the imported textiles.
Likewise private consumers and government will also chose which region to demand their
imported commodities from.21
20 Note that firms in the U.S. also have a similar decision making tree. 21 In the standard GTAP model imports of private households, government and firms are first aggregated before the source of the imported commodities is decided.

9
Figure 2: Decision tree for African Producers
African Producer of Clothing ROO
Value Added Textiles Other Commodities
Domestic Imports
AGOA Other AGOA = 0
Endowments
With the exception of the ROO compliant clothing, the split is done in such a way that
private consumption, government and firms demand the same proportions of their imports from
each of the regions. Hence the choice of region is independent of the agent.
In the case of the ROO compliant clothing commodity, these are only purchased by the
U.S. from the African economies. Furthermore, the data is also adjusted to ensure that the share
of textiles imported from non-AGOA regions and used in production of the ROO compliant
variety of clothing is zero (Figure 2) and remains zero after the tariffs and quotas on these ROO
compliant commodities are eliminated. This ensures that the ROO restrictions are satisfied for
the ROO compliant clothing commodity.
B. Policy Shocks and Counterfactual Baseline
Before examining the impact of AGOA we need to take into account the CBTPA shock,
whereby allowing the Caribbean and Central American have unrestricted access to the U.S.
market on textiles and clothing. Since an earlier version of CBTPA was implemented prior to
1997, we incorporate this unilateral agreement using an altertax experiment.22
22 The Caribbean Basin Initiative and Caribbean Basin Economic Recovery Act were earlier iterations of CBTPA. For more detail, see USITC, The Year in Trade, various years. The baseline altertax experiment incorporates CBTPA into the GTAP data base with minimal impact on the structure of the GTAP data base. Although CBTPA was passed the same time as AGOA, another version of the U.S.-Caribbean agreement was in place since the late 1980s.

10
We use this updated data base to then execute the AGOA agreement. The AGOA
agreement includes both a reduction in tariffs and the removal of quotas on the ROO compliant
commodity. The tariffs and quotas imposed by the U.S. on clothing are listed in Table 1.
Approximately the same rates are imposed on all clothing purchased from the Southern African
economies by the U.S..
Table 1: Tariffs and Quotas imposed by the U.S. on Clothing
Tariffs on clothing Export Tax equivalent SACU 11.0459 0.5075
Rest of South Africa 12.7921 0.5962 Rest of SSA 11.2607 0.5040
We compare the impact of four alternative experiments:
A. The AGOA agreement with ROO incorporated using the standard GTAP closure.
B. The AGOA agreement with ROO incorporated using a special closure GTAP
closure.
C. The AGOA agreement using the standard GTAP model without ROO
incorporated, standard GTAP closure.
D. The AGOA agreement using the standard GTAP model without ROO
incorporated, non-standard GTAP closure.
The special closure referred to in B above takes into account some of the non-standard
features of developing economies, including the existence of an excess supply of unskilled labor
and a fixed trade balance. In this case we assume that real wages do not change when there is an
increase in demand for labor, rather more people are drawn into the labor force. This is clearly
the case for developing countries where there is often a large pool of excess unskilled labor. The
second closure adjustment is due to the fact that we assume that the balance of trade relative to
income in fixed for the developing economies. This reflects that these economies may not have
the same access to foreign capital as developed economies do.
Finally experiment C incorporates the AGOA agreement into the standard GTAP model
(with standard closure) to examine the impact of AGOA without the ROO.

11
IV. Results
a. Macro
Figure 1 below shows that the Southern African economies examined in this paper are
very small in terms of Real GDP accounting for less than 4 percent of world GDP. The rest of
SSA is the largest of within the region followed by SACU and finally the Rest of Southern
Africa.
Figure 1: World Share of GDP
SACU0%
Rest of SSA1%
LatinAmeric5%
Mexico1%
CenAmCarib0%
China3%
OldNICs3%
ASEAN2%
SouthAsia2%
11 USA28%
Canada2%
EU1528%
ROW25%
Other4% Rest of South Africa
0%
SACU Rest of South Africa Rest of SSA LatinAmeric Mexico
CenAmCarib China OldNICs ASEAN SouthAsia
11 USA Canada EU15 ROW
The macro results set out in Table 2 show that SACU, rest of SSA and rest of Southern
Africa all gain as a result of AGOA. It is notable that it is the smaller African economies – the
rest of Southern Africa and to a lesser extent SACU – who gain the most from the AGOA
agreement. These gains are illustrated in Table 2 by the positive changes in welfare and the very
small increases in Real GDP.
Decomposition of the welfare gains under the standard closure (Exp1a) reveals that over
60 percent of these welfare gains are due to the beneficial terms of trade effect resulting from
higher prices received from clothing exports (Table 3). The U.S. also gains as a result of the
agreement, while those who are not party to the agreement lose. Most of the U.S.’s gains (and the
other country’s loses) also come from the terms of trade effect (Table 3).

Table 2: Macro Results
EV Real GDP TOT EXP1a EXP1b23 EXP1c EXP1d EXP1a EXP1b EXP1c EXP1d EXP1a EXP1b EXP1c EXP1d SACU 32.54 69.05 65.85 132.15 0.01 0.04 0.02 0.07 0.06 0.05 0.12 0.10 Rest of Southern Africa 47.68 72.81 90.25 139.47 0.04 0.12 0.08 0.23 0.23 0.19 0.45 0.38 Rest of SSA 15.21 24.90 31.12 50.09 0.00 0.01 0.01 0.02 0.02 0.02 0.04 0.04 LatinAmerica -0.36 0.03 -1.42 -0.62 0.00 0.00 0.00 0.00 0.00 0.00 0.00 0.00 Mexico -6.97 -6.92 -15.08 -15.02 0.00 0.00 0.00 0.00 -0.01 -0.01 -0.01 -0.01 Central America and Caribbean -14.21 -14.40 -30.62 -31.07 0.00 0.00 0.00 0.00 -0.03 -0.03 -0.06 -0.07 China -30.39 -30.29 -63.15 -63.08 0.00 0.00 0.00 0.00 -0.01 -0.01 -0.03 -0.03 NICs -13.69 -13.29 -26.96 -26.23 0.00 0.00 0.00 0.00 0.00 0.00 -0.01 -0.01 ASEAN -13.87 -16.24 -29.04 -33.78 0.00 0.00 0.00 0.00 -0.01 0.00 -0.01 -0.01 South Asia -10.80 -12.76 -18.57 -20.77 0.00 0.00 0.00 0.00 -0.01 -0.01 -0.02 -0.03 U.S. 43.15 46.88 114.81 122.63 0.00 0.00 0.00 0.00 0.00 0.00 0.01 0.01 Canada 2.50 2.46 4.88 4.81 0.00 0.00 0.00 0.00 0.00 0.00 0.00 0.00 EU15 -32.08 -24.67 -61.66 -47.00 0.00 0.00 0.00 0.00 0.00 0.00 0.00 0.00 ROW -5.35 -17.46 -11.40 -34.53 0.00 0.00 0.00 0.00 0.00 0.00 0.00 0.00 Exp1a: AGOA with ROO and standard closure Exp1b: AGOA with ROO and non-standard closure Exp1c: AGOA without ROO and standard closure Exp1d: AGOA without ROO and non-standard closure
23 Tax replacement was also included in this non-standard closure, however the results were only marginally affected.

Table 3: Welfare Decomposition for Exp 1a (standard closure with ROO)
WELFARE
Allocative Efficiency
effect Endowment
Effect
Tech Change effect
Terms of Trade
effect
Investment- Saving
price effect Total SACU 10.57 0 0 24.03 -2.05 32.54 Rest of Southern Africa 17.52 0 0 31.19 -1.03 47.68 Rest of SSA 3.79 0 0 9.31 2.10 15.21 Latin America 0.13 0 0 -1.14 0.64 -0.36 Mexico -0.83 0 0 -6.55 0.41 -6.97 Central America and Caribbean -1.36 0 0 -11.89 -0.95 -14.21 China -0.70 0 0 -30.48 0.79 -30.39 NICs -0.05 0 0 -14.20 0.55 -13.69 ASEAN -0.31 0 0 -13.89 0.33 -13.87 South Asia -1.13 0 0 -9.83 0.16 -10.80 U.S. 2.42 0 0 44.61 -3.88 43.15 Canada -0.16 0 0 2.40 0.26 2.50 EU15 -14.17 0 0 -18.58 0.68 -32.08 ROW -2.30 0 0 -5.05 1.99 -5.35 Exp1a: AGOA with ROO and standard closure Exp1b: AGOA with ROO and non-standard closure Exp1c: AGOA without ROO and standard closure Exp1d: AGOA without ROO and non-standard closure
A comparison of the welfare impacts from the four experiments reveals that the
incorporation of ROO has had a significant impact on the welfare gains of the African economies
(Exp1a and Exp1c). In all three African regions welfare is halved as a result of the inclusion of
ROO. This result is not surprising given that U.S. tariffs and quotas are only eliminated on those
commodities which are ROO compliant and that these producers of the ROO compliant variant
must purchase all of their intermediate inputs of textiles from within the AGOA region (including
the U.S.). These restrictions reduce the ability of producers to gain from the AGOA agreement
and hence welfare of the African economies is lower than it would have been if ROO had not
been applied.
Finally, the non-standard closure has the effect of increasing the gains to the African
economies from AGOA. This is due to there being an increase in demand for and hence supply of
unskilled workers; the increased gains therefore show up in the welfare decomposition as an
increase in the endowment effect.
b. Sectoral Results
Although the Rest of SSA is the larger region in terms of GDP (Figure 1), it was shown
previously that larger gains are made by the smaller region: the Rest of Southern Africa. The

14
reason for this is that while the rest of SSA is the largest in terms of GDP, the situation is
reversed in the case of exports of clothing to the U.S. Here the Rest of Southern Africa has the
largest share among the African economies and the Rest of SSA has the smallest share (Figure 2).
Furthermore, Figure 3 shows that while the Rest of SSA produces more clothing than the Rest of
Southern Africa and SACU, a much smaller proportion of this production is exported. The Rest
of Southern Africa exports over 50 percent of its clothing production and hence the reduction of
tariffs and the elimination of quotas is likely to have a much larger impact on the Rest of South
Africa’s clothing market.
Figure 2: Share of U.S.’s imported Clothing Market
SACU0%
Rest of South Africa1%
LatinAmeric2%
Mexico9%
CenAmCarib14%
China15%
OldNICs18%
ASEAN13%
SouthAsia12%
Canada2%
EU155%
ROW9%
Other3%
Rest of SSA0%
SACU Rest of South Africa Rest of SSA LatinAmeric Mexico
CenAmCarib China OldNICs ASEAN SouthAsia
Canada EU15 ROW

15
Figure 3: Clothing Production sold on Domestic and Export Markets
0
500
1000
1500
2000
2500
SACU Rest of South Africa Rest of SSA
1 dom 3 export
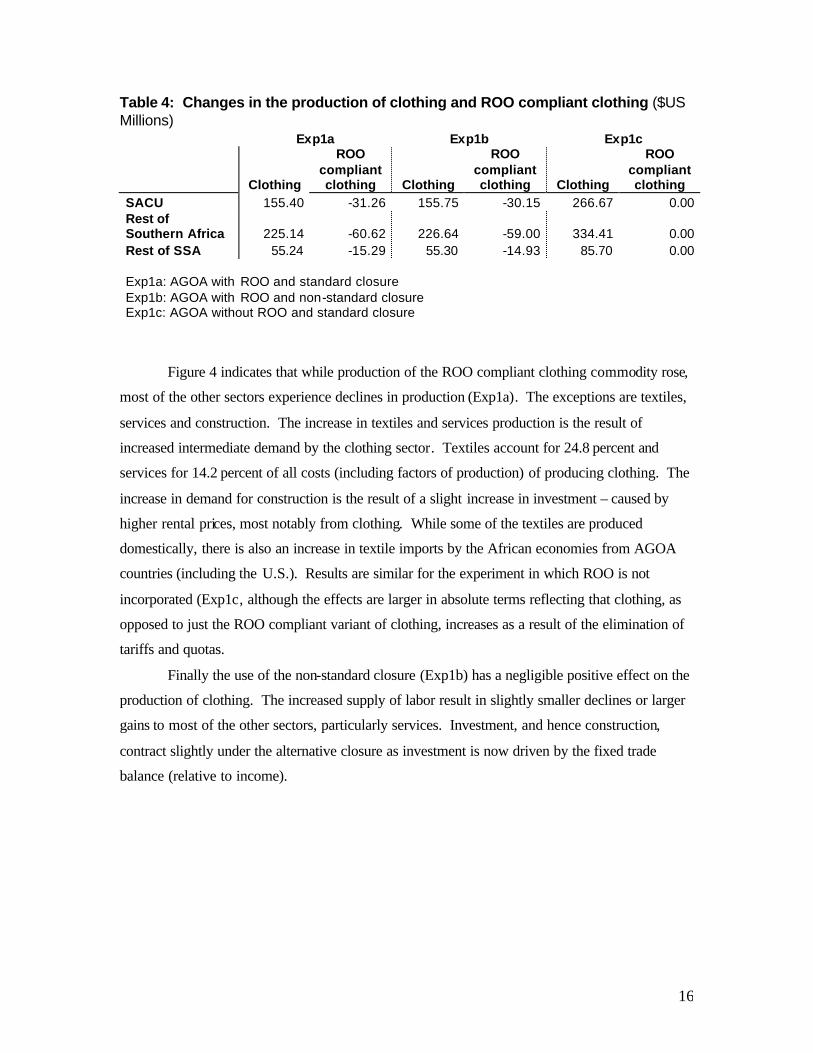
Table 4 shows how the elimination of tariffs and quotas increases the production of
clothing. Without the ROO clauses in the AGOA agreement (Exp1c), clothing production would
increase by $US266.67 million in SACU, $US334.41 million in the Rest of South Africa and
$US85.7 million in Rest of SSA. As previously noted, the large increase in production in the
Rest of South Africa reflects the importance of exports for their clothing market.
With ROO incorporated into the AGOA agreement (Exp1a) clothing production would
increase by only $US124.14 million in SACU, $US164.52 million in the Rest of South Africa
and $US39.94813 million in Rest of SSA, considerably less than the estimated increases in
production obtained when ROO is not incorporated (Exp1c). Notice these increases are the
cumulative effect once we take into account the expansion in production of the ROO compliant
clothing commodity and the reduction of the non-ROO compliant commodity. This diversion of
resources from the non-ROO compliant commodity to the ROO compliant commodity is what
would be expected under an agreement in which ROO were prevalent.24
24 Note that the change in welfare could be an overestimation of welfare since there are no tax equivalents (in the initial data base) which measure the extent to which the choice of inputs into the production of the ROO compliant clothing commodity is sub-optimal. Tax equivalents are created in the updated data as inputs continue to be restricted.
16
Table 4: Changes in the production of clothing and ROO compliant clothing ($US Millions) Exp1a Exp1b Exp1c
Clothing
ROO compliant clothing Clothing
ROO compliant clothing Clothing
ROO compliant clothing
SACU 155.40 -31.26 155.75 -30.15 266.67 0.00 Rest of Southern Africa 225.14 -60.62 226.64 -59.00 334.41 0.00 Rest of SSA 55.24 -15.29 55.30 -14.93 85.70 0.00 Exp1a: AGOA with ROO and standard closure Exp1b: AGOA with ROO and non-standard closure Exp1c: AGOA without ROO and standard closure
Figure 4 indicates that while production of the ROO compliant clothing commodity rose,
most of the other sectors experience declines in production (Exp1a). The exceptions are textiles,
services and construction. The increase in textiles and services production is the result of
increased intermediate demand by the clothing sector. Textiles account for 24.8 percent and
services for 14.2 percent of all costs (including factors of production) of producing clothing. The
increase in demand for construction is the result of a slight increase in investment – caused by
higher rental prices, most notably from clothing. While some of the textiles are produced
domestically, there is also an increase in textile imports by the African economies from AGOA
countries (including the U.S.). Results are similar for the experiment in which ROO is not
incorporated (Exp1c, although the effects are larger in absolute terms reflecting that clothing, as
opposed to just the ROO compliant variant of clothing, increases as a result of the elimination of
tariffs and quotas.
Finally the use of the non-standard closure (Exp1b) has a negligible positive effect on the
production of clothing. The increased supply of labor result in slightly smaller declines or larger
gains to most of the other sectors, particularly services. Investment, and hence construction,
contract slightly under the alternative closure as investment is now driven by the fixed trade
balance (relative to income).

17
Figure 4: Production in Rest of Southern Africa, under standard and special closures
-100
-50
0
50
100
150
200
250
300
350
400
UnskL
ab crops
animala
gMinin
g food
Textile
s
Clothing
Clothing
roo Cotton
hvyman
ufs
lghtm
anuf utils
Constru
ction
Servic
es
Exp1a Exp1b Exp1c
Exp1a: AGOA with ROO and standard closure Exp1b: AGOA with ROO and non-standard closure Exp1c: AGOA without ROO and standard closure
V. Policy Implications
While this research is still a work in progress, our findings show that ROO are an
important issue that require further investigation. It is critical that more work is done to model
the constraints associated with ROO. We find that the benefits of the AGOA agreement are
severely restricted when producers of clothing are required to purchase their fiber and textiles
from particular producers.
Further work still needs to be undertaken to account for the additional cost of applying
for and documenting the ROO clauses. In his 2001 paper, David Hummels demonstrated that
time could be a substantial barrier to trade. The documentation and adherence to the ROO
clauses are also likely to be a substantial barrier to trade.
Despite the limitations, these experiments give a glimpse into what the future might be
like for AGOA beneficiaries if the current proposed legislation of AGOA II is not voted on and
passed before September 2004, the date when the ROO exceptions expire and AGOA producers

18
need to purchase their inputs from domestic producers or the United States.

19
Table A. ROO Regional Aggregation 14x7 GTAP Regions 1 SACU Botswana, Rest of SACU (which includes South Africa, Lesotho, Namibia and
Swaziland)
2 Other Southern Africa
Malawi; Mozambique; Tanzania; Zambia; Zimbabwe; Other Southern Africa (including Angola and Democratic Republic of the Congo).
3 Rest of SSA Uganda, Rest of SSA (not included above in SACU, Other Southern Africa) Benin, Burkina Faso, Burundi, Cameroon, Madagascar, Malawi, Mali, Mauritania, Mauritius, Cape Verde, Central African Republic, Cameroon, Mozambique, Niger, Chad, Nigeria, Comoros, Republic of the Congo, Côte d’Ivoire, Rwanda, Democratic Republic of the Congo, Sao Tomé and Principe, Djibouti, Senegal, Equatorial Guinea, Seychelles, Eritrea, Sierra Leone, Ethiopia, Somalia, Gabon, The Gambia, Sudan, Ghana, Guinea, Tanzania, Guinea-Bissau, Togo, Kenya, Uganda, Zambia, Liberia, Zimbabwe
4 Latin America Colombia; Peru; Venezuela; Rest of Andean Pact; Argentina; Brazil; Chile; Uruguay; Rest of South America.
5 Mexico Mexico 6 CA, Caribbean Central America and the Caribbean 7 China China 8 Old NICs Hong Kong, Korea, Taiwan, Singapore 9 ASEAN Indonesia, Malaysia, Philippines, Thailand, Vietnam 10 South Asia Bangladesh, India, Sri Lanka; Rest of South Asia 11 U.S. U.S. 12 Canada Canada 13 EU-15 Austria, Belgium, Denmark, Finland, France, Germany, UK, Greece, Ireland, Italy,
Luxembourg, Netherlands, Portugal, Spain, Sweden 14 Rest of World Australia, New Zealand, Switzerland, Rest of EFTA, Hungary, Poland, Rest of Albania, Bulgaria, Croatia, Czech Republic, Hungary, Malta, Romania, Slovakia, Slovenia, Lithuania, Russian Federation, Rest of Former Soviet Union, Japan, Cyprus, Turkey, Rest of Middle East, Morocco, Rest of North Africa, Rest of the World.
Table B. ROO Sector Aggregation 14x7 GTAP Sectors 1 Textiles Textiles 2 Clothing Wearing apparel, leather products 3 Cotton Plant based fibers 4 Mining mineral products nec; ferrous metals; metals nec; 5 Crops Patty rice; wheat, cereal grains nec; vegetables, fruit, nuts; oil seeds; sugar cane,
sugar beet; crops nec; forestry; fishing. Animal Ag Meat: cattle, sheep goats, horses; animal products; raw mink; wool, silk work
cocoons . Mining Coal; oil; gas; minerals nec; petroleum, coal products; Food meat products; vegetable oils and fats; dairy products; processed rice; sugar; food
products nec; beverages and tobacco; Heavy
Manufacturing Leather products; wood products; paper products, publishing; chemical, rubber, plastic products; metals nec; metal products;
Light Manufacturing
motor vehicles and parts; transport equipment nec; electronic equipment nec; machinery and equipment nec; manufactures nec;
Utilities Electricity; gas manufacture, distribution; water; Construction construction; Services trade; transport nec; water transport; air transport; communication; financial
services nec; insurance; business services nec; recreational and other services; public administration, defense, education, health; dwellings.

20
REFERENCES
Andriamananjara, S. and J. Dean (2003), “The Impact of the ATC on Developing Country Suppliers,” USITC mimeo.
Baughman, L., R. Mirus, M. Morkre, and D. Spinanger (1997). “Of Tyre Cords, Ties and Tents: Window-Dressing in the ATC?” World Economy, vol. 20, No. 4, pp. 407-34.
Diao, X. and A. Somwaru. (2002)"A global Perspective of Liberalizing World Textile and Apparel Trade," Journal of Political Economy, Vol. 28 (2): 782-790.
Dimaranan, B.V. and R.A. McDougall, (2002) “Global Trade Assistance and Production: The GTAP Data Base,” Center for Global Trade Analysis, Purdue University.
Francois, J. and D. Spinanger (2001) AWith Rags to Riches, but Then What? Hong Kong=s T&C Industry vs. the ATC and China=s WTO Accession,@ Paper prepared for the Fourth Annual Conference on Global Economic Analysis, Purdue University, June 27-29, 2001.
Francois, J. and D. Spinanger (2002) AGreater China’s Accession to the WTO: Implications for International Trade/Production and for Hong Kong,@ Paper prepared for the Fifth Annual Conference on Global Economic Analysis, Taipei, Taiwan, June 5-7, 2002.
Francois, J. and D. Spinager (2001), “ATC Export Tax Equivalents,” Chapter 16 F in GTAP Version 5 Documentation, Center for Global Trade Analysis, Purdue University.
Francois, J., B. McDonald and H. Nordström, “Assessing the Uruguay Round,” in The Uruguay Round and the Developing Economies, World Bank Discussion Paper 307, ed. W. Martin and L.A Winters (Washington, D.C., The World Bank, 1985), 117-214.
Gehlhar, M. “Historical analysis of growth and trade pattern in the Pacific Rim: An evaluation of the GTAP framework, in T.W. Hertel, editor (1997) Global Trade Analysis: Modeling and Applications, Cambridge University Press.
Hertel, T.W., editor (1997) Global Trade Analysis: Modeling and Applications, Cambridge University Press.
Hertel, T.W. and M.E.Tsigas “Global Climate Change and Agriculture” Hertel, T.W., editor (1997) Global Trade Analysis: Modeling and Applications, Cambridge University Press.
Hummels, D. (2001) “Time as a Barrier” GTAP Working paper no. 18, Center for Global Trade Analysis, Purdue University, www.gtap.org.
Karingi, S.N., M. Siriwardana, and E.E. Rongu (2002) “Implications of the COMESA Free Trade Area and Proposed Customs Union: An Empirical Investigation” Paper prepared for the Fifth Annual Conference on Global Economic Analysis, Taipei, Taiwan, June 5-7, 2002.
Kathuria, S., and A. Bhardwaj (1998) “Export Quotas and Policy Constraints in the Indian Textile and Garment Industries,” mimeo, World Bank.

21
Kathuria, S., W. Martin and A. Bhardwaj (2001) “Implications for South Asian Countries Abolishing the Multifibre Arrangement,” World Bank Policy Research Working Paper 2721, November 2001.
Mattoo, A., D. Roy and A. Subramanian (2002) “The African Growth and Opportunity Act and Its Rules of Origin: Generosity Undermined?” World Bank Policy Research Working Paper 2908, October 2002.
Reinert, K. (2000) “Give Us Virtue, but Not Yet: Safeguard Actions Under the Agreement on Textiles and Clothing,” World Economy, 23 (1), 25-55;
Rivera, S., L.A. Agama and J. Dean, “Africa Beyond 2005: Understanding the Impact of Eliminating NTBs and tariffs on Textile and Clothing,” Presented at the 6th Annual Conference on Global Trade Analysis, June 12-14, 2003, The Hague, The Netherlands. http://www.gtap.agecon.purdue.edu/access_member/resources/res_display.asp?RecordID=1286
Spinanger, D. (1999) “Textiles beyond the MFA Phase-out,” The World Economy, 20 (4), June 1999, 455-476.
U.S. Department of Commerce, 2003 Comprehensive Report on U.S. Trade and Investment Policy toward Sub-Saharan Africa and Implementation of the African Growth and Opportunity Act, Third of Eight Annual Reports (May 2003), www.agoa.gov.
U.S. Department of Commerce, International Trade Administration, U.S –Africa Trade Profile www.agoa.gov
USITC, Economic Effects of Significant Import Restraints: Third Update 2002, Investigation No. 332-325, Publication 3519 (June 2002).
USITC, The Year in Trade 200: Operation of the Trade Agreements Program Publication 3510, May 2003.
USITC, U.S. Trade and Investment with Sub-Saharan Africa, Third Annual Report, Investigation No. 332-415, Publication 3650 (December 2003).
WTO (1997) “Comprehensive Report of the Textiles Monitoring Body to the Council for Trade in Goods on the Implementation of the Agreement on Textiles and Clothing during the First Stage of the Integration Process,” Document No. 97-3288.
WTO (2001) “Comprehensive Report of the Textiles Monitoring Body to the Council for Trade in Goods on the Implementation of the Agreement on Textiles and Clothing during the Second Stage of the Integration Process,” Document No. 01-3839