the impact of social network sites on the …ijecm.co.uk/wp-content/uploads/2015/11/31167.pdf ·...
TRANSCRIPT

International Journal of Economics, Commerce and Management United Kingdom Vol. III, Issue 11, November 2015
Licensed under Creative Common Page 1021
http://ijecm.co.uk/ ISSN 2348 0386
THE IMPACT OF SOCIAL NETWORK SITES ON THE
ACADEMIC PERFORMANCE OF STUDENTS IN
THE POLYTECHNICS OF GHANA
Alhassan Munkaila
Department of Mechanical Engineering (Welding and Fabrication),
Tamale Polytechnic, Tamale, Ghana
Abukari Iddrisu
Department of Languages and Liberal Studies,
Tamale Polytechnic, Tamale, Ghana
Abstract
This study looked at the influence of social media usage on academic performance of students
in tertiary institutions. It took into account types of social media sites and devices used. Tamale
polytechnic was the study area which is made up of (3) major academic schools. A sample size
of 600 was drawn out of a total population of 6000. Total 558 of the questionnaires were
retrieved which represents a response rate of 93.0%. The findings revealed that most of the
students make use smartphones, Followed by cell phones and laptops. For the use of social
network sites, it was obvious that, most of the students made use Facebook, followed by
Google and Whatsapp. As to whether social media assist academic work, 345, representing
64.6% indicated that social media enhances academic performance of students. The study also
revealed that there is no correlation between academic schools and use of social media.
likewise the year groups, there is no relationship between year group and use of social media.
Even though students generally use social media for academic purposes; they also use it for
non-academic matters. Students should be encouraged to spend more time of their social
media interactions on academic issues rather than non-academic matters.
Keywords: Social Network Sites, Academic Performance, Polytechnics, Students’ engagement
© Alhassan & Abukari
Licensed under Creative Common Page 1022
INTRODUCTION
The use of Social Network Sites (SNSs) among students of tertiary institutions especially,
polytechnics in Ghana is becoming popular and fashionable. Most students in the polytechnics
do not want to be left out but get actively connected to the social media sites, and for that matter
social websites and applications now proliferate. The question is whether students use social
networking extensively for their academic work. Social network comprises a set of individuals
who are interconnected through certain relationships such as friendship, co-working or
information exchange (Garton, Haythornthwaite & Wellman, 1997). Social network has provided
us the opportunity to connect with people and build better relationships with friends and
relations. It brings down Communication barriers and raise users voice since users are able to
communicate their thoughts and perceptions over different topics with a large number of
audiences. It offers opportunities for businesses, since businesses have noticed the value of
social networks in their life, and they are using different techniques to promote their products.
On the other hand, the extensive use of social media can actually cause addiction to the users.
It also leads to isolation since extreme usage of social media has reduced the level of human
interaction. Larry (2011) in a paper presented at the 119th Annual Convention of the American
Psychological Association, said pre-teens and teenagers who use technology, like the Internet
and Video games, on a regular basis will have more stomach aches, sleeping problems, anxiety
and depression. He pointed out that Teens who use facebook continuously may show
narcissistic tendencies and young adults show more signs of other psychological disorders.
LITERATURE REVIEW
Social media according to (Dhiraj, 2013) has been defined to refer to the many relatively
inexpensive and widely accessible electronic tools that enable anyone to publish and access
information, collaborate on a common effort, or build relationships. Kaplan and Haenlein (2007)
define social media as a group of Internet-based applications that build on the ideological and
technological foundations of Web 2.0, and that allow the creation and exchange of user-
generated content. Furthermore, social media depends on mobile and web-based technologies
to create highly interactive platforms through which individuals and communities share, co-
create, discuss, and modify user-generated content. Some SNSs are social-oriented while
others are business or relationship oriented; activities are therefore dependent on the
orientation (Salvation and Adzharuddin, 2014). Pinterest is a social curation website for sharing
and categorizing images found online (Hall and Zarro, 2012). WhatsApp (Church and de
Oliveira, 2013) is a cross-platform instant messaging application for smartphones. It enables
users to send and receive location information, images, video, audio and text messages in real-
International Journal of Economics, Commerce and Management, United Kingdom
Licensed under Creative Common Page 1023
time to individuals and groups of friends at no cost. The study of kanagarathinam(2014)
showed that students used more of Facebook, Skype, Watsapp and YouTube, however
Google+ and LinkedIn were the least used among the respondent. Google is a universally
accepted medium for searching all or any type of information through Internet; one can create
individual forums for detailed discussions relating to all fields of study (Periyar, 2015). Facebook
is a popular social-networking site (Mazman and Usluel, 2010), and also a useful educational
tool due to its structure and multiple uses. It provides users with learning opportunities by way of
sharing interests, exchanging information, sharing ideas and discussing topics. While network
sites like Facebook and Twitter attract broad audiences who socialize. LinkedIn and tribe.net
are business oriented sites that attract professional businessmen who share business ideas
together (Gangadharbatla, 2008). The use of social media sites by students have both positive
and negative repercussion on the lives of students (Boyd, 2007) indicated that SNS started as a
hobby for some computer literate people, of late it has become a social norm and way of life for
people from all over the world. Banquil & Chua (2009) came up with a conclusion that social
networking sites do affect one’s academic performance adversely. It directly causes the gradual
drop of grades of students. It directly affects students’ academic performance if the student
invest his time in social networking sites instead of his studies. Academic performance is a
multifaceted construct made of three dimensions, thus, students’ characteristics,
instructors’/lecturers’ competencies and the conduciveness of the academic environment. The
students perspective is how they deal with their studies and how they cope with or accomplish
learning situations (Salvation and Adzharuddin, 2014). Responses on the positive impact of
SNSs to students’ academic performance have higher means, which range from 3.20 to 3.70 for
all the questions. The majority of respondents clearly indicated that SNSs can be used to
discuss assignments (3.40), group discussions (3.70) and also to improve interaction between
lecturers and classmates (Helou and Ab.Rahim, 2014). A descriptive stats output
displayed(Abdelraheem, 2013) showed that there are no significant differences in the means of
the GPA and Social Network Site, implying the GPA has no effect on the use of SNSs; students
with high GPA use SNSs as those with average or low GPA. The works of Hargittai & Hsieh,
(2010) revealed that there is no relationship between social media usage and academic activity,
contrary to the findings of this study, and that most of the users use it for socializing purposes.
(Hamat, et al. 2012) contend that students spend more time for social issues rather than
learning, implying the time meant for studies is used on non-academic issues like chatting and
making friends. The findings of kanagarathinam (2014) revealed that about 61% of the
respondents used social networking sites for downloading music, posting photos and chatting.
While about 39% used the networking for research, submitting of assignment and articles. Most
© Alhassan & Abukari
Licensed under Creative Common Page 1024
of these students agreed on the fact that these sites helped them academically in getting
educational materials for their assignments and projects as well as for research work. He further
explained that about 26% of the respondents indicated that they use SNSs for academic
purposes like communicating with their supervisors and lecturers (8%), conducting academic
related discussions (9%), and communicating with friends for academic interests (9%), which is
less than the time they spend on other activities unrelated to academic matters (ibid). A study
revealed that (Helou and Ab.Rahim, 2014) there are no significant differences in students
grades before and after their involvement with SNSs. They however believe that SNSs are for
personal use as well as for education. With reference to negative impact of SNS, the highest
mean for the negative impact was on students addiction to SNSs, which affect their academic
life. Paul, Baker & Cochran, (2012) in their research on effect of online social networking on
students’ academic performance found that there is statistically insignificant negative
relationship between time spent by students on online social networking and their academic
performance. Madge, el al (2009) in a related development argue that often student use social
networking websites to discuss their academic issues formally and informally and also to
interact with their instructors, teachers and professors.
Statement of the Problem
The use of social network sites among students of tertiary institutions is now widespread. It
seem to becoming popular and fashionable in the polytechnics which may one way or the other
affect the performance of students. The researchers are so much concerned about students
spending so much time on social networks chatting with friends, watching movies, posting
photos, etc at the expense of academic activities. It is on the basis of this fact that the study had
been conducted to assess the impact of students’ use of social network sites on their academic
performance.
Scope and objective of the study
The scope covered types of social media devices as well as social network sites available to
students in the Tamale Polytechnic. The objective of the study was to investigate the effects of
the use of social media on academic performance of students, whether positive or negative.
METHODOLOGY
Tamale Polytechnic is one of the ten public tertiary polytechnics situated in the Northern part of
Ghana. The polytechnic is made up of (3) major academic schools; School of Engineering,
School of Business and School of Applied Sciences. Each School has a definite student

International Journal of Economics, Commerce and Management, United Kingdom
Licensed under Creative Common Page 1025
population within a specified period of time, especially in an academic year. These three
schools constitute the population of the study and, a sample size was drawn from these. It is
pertinent to point out that the School of Engineering was made up of four (4) Departments,
namely Mechanical Engineering (with 3 options); Agric Engineering (with 3 options), Electrical/
Electronic Engineering and lastly Building/Construction Department with a total population of
1000 students. School of Business was made up of Three (3) Departments; Accountancy,
Secretarialship / Management and Marketing Departments with a total student population of
3600 as at the time this study was conducted. School of Applied Sciences was made up of three
(3) departments, called Statistics/Mathematics, Liberal Studies and Languages, Computer
Department and Hotel, Catering and Institutional Management (HCIM). School of Applied
Sciences had a student population of 1400. A sample fraction of 1 in 10 was used to draw the
sample size of 600 students, however 558 questionnaires were retrieved, representing 93.0%.
The students were first stratified into various Schools and into various Departments as well as
year groups. A simple Random Sampling was then used based on calculations as follows: S =
1/10 ×N, where S is sample size and N is total number of students belonging to a particular
school. Obviously a total sample of 600 was drawn out of a total population of 6000 which is a
representative of the population. The distribution is clearly spelt out in the table below. The ratio
of the three schools as tabulated below is 5:18:7
Table 1. Sampling Design
Academic School Population Computation Sample Size
School of Engineering 1000 S = 1/10 × 1000 100
School of Business 3600 S = 1/10 × 3600 360
School of Applied Sc. 1400 S = 1/10 × 1400 140
Total 6000 S = 1/10 × 6000 600
The Instruments used were predominantly questionnaire, constituting both closed and open-
ended items. A total of 24 items constituted the questionnaire, including personal or bio-data,
labeled from 1 to 24 for easy identification. For validity and reliability the questionnaires were
carefully designed and test ran; all ambiguities and misunderstanding were eliminated in the
items. Data collection commenced on the 26th May, 2015 with research assistants, which took a
period of four (4) weeks. The data were analysed using both Excel and SPSS. Some variables
were cross tabulated to examine the correlation or the difference between those variables.

© Alhassan & Abukari
Licensed under Creative Common Page 1026
ANALYSIS AND RESULTS
Considering Table 1, female students were 177, representing 31.7% and male students were
381, representing 68.3%. This gives a total of 558 instead of 600, the discussion was therefore
centered on this figure. Clearly, the results showed that majority of the respondents were
males. The age distribution was as follows, 225 respondents, representing 45.7% had their
ages between 18 – 24 years old, and 273 respondents, representing 48.9% had their ages
between 25 – 31 years while 30 of them, representing 5.4% had their ages within the range of
32 – 38 years. The data showed that majority of the respondents were in the age range of 25 –
31 years. This exhibited a youthful population of the participants who normally would engage in
social media sites. The sample came from the three schools of the polytechnic in accordance
with their ratios.
Table 1. Characteristics of Respondents
Characteristic Count Percent (%)
Gender
Female 177 31.7
Male 381 68.3
Total 558 100.0
Age
18-24 255 45.7
25-31 273 48.9
32-38 30 5.4
Total 558 100.0
Programme
Business 262 47.0
Engineering 124 22.2
Applied Sciences 172 30.8
Total 558 100.0
Year Group
Year One 181 32.6
Year Two 193 34.8
Year three 181 32.6
Total 555 100.0
Knowledge of Social Media
Yes 516 92.5
No 42 7.5
Total 558 100.0
Thus School of Business (262/47.0%), School of Engineering (124/22.2%) and School of
Applied Sciences (172/30.8%). The study also considered year groups of participants (Table 2).
Exactly 181 of the participants, representing 32.6% were in year one, 193, representing 34.8%
International Journal of Economics, Commerce and Management, United Kingdom
Licensed under Creative Common Page 1027
of the participants were in year two and also 181, representing 32.6 % of the participants were
in year three. Participants knowledge and awareness of social network sites was crucial to the
researchers and this item was asked to ascertain the knowledge of participants on social media
usage, and the distribution was that 516 of the participants, representing 92.5% had knowledge
about social media while 42 of them, representing 7.5% had no knowledge about social media.
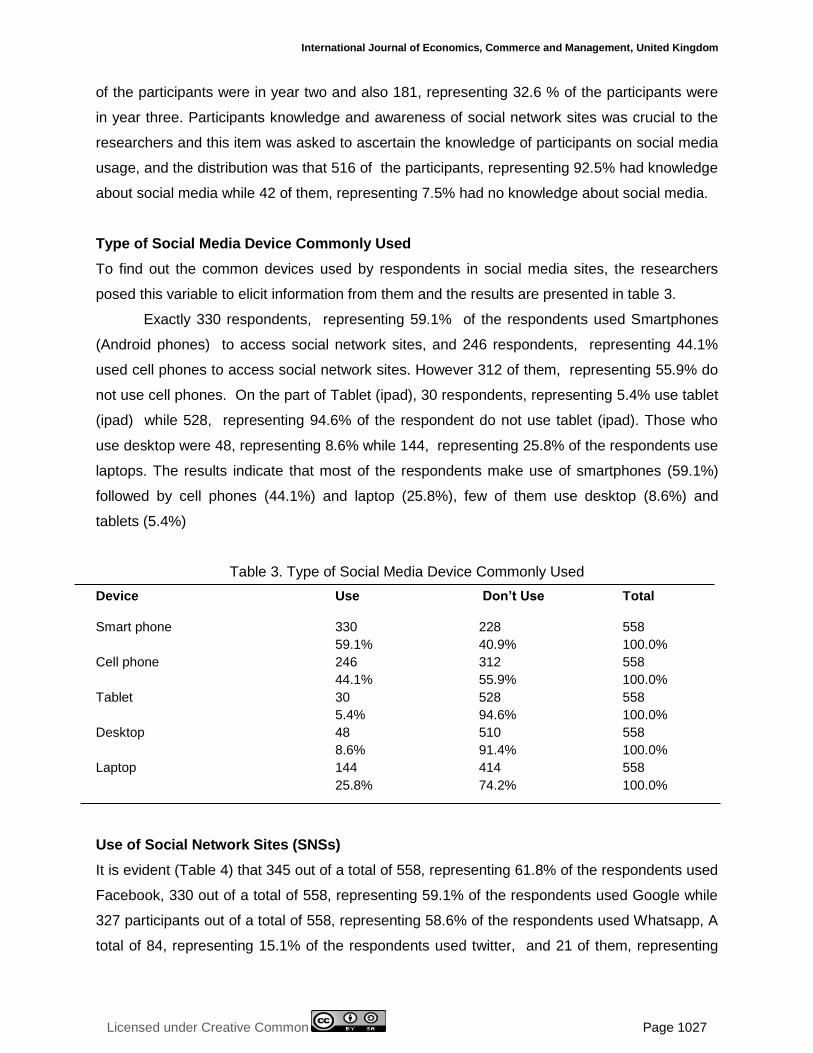
Type of Social Media Device Commonly Used
To find out the common devices used by respondents in social media sites, the researchers
posed this variable to elicit information from them and the results are presented in table 3.
Exactly 330 respondents, representing 59.1% of the respondents used Smartphones
(Android phones) to access social network sites, and 246 respondents, representing 44.1%
used cell phones to access social network sites. However 312 of them, representing 55.9% do
not use cell phones. On the part of Tablet (ipad), 30 respondents, representing 5.4% use tablet
(ipad) while 528, representing 94.6% of the respondent do not use tablet (ipad). Those who
use desktop were 48, representing 8.6% while 144, representing 25.8% of the respondents use
laptops. The results indicate that most of the respondents make use of smartphones (59.1%)
followed by cell phones (44.1%) and laptop (25.8%), few of them use desktop (8.6%) and
tablets (5.4%)
Table 3. Type of Social Media Device Commonly Used
Device Use Don’t Use Total
Smart phone 330 228 558
59.1% 40.9% 100.0%
Cell phone 246 312 558
44.1% 55.9% 100.0%
Tablet 30 528 558
5.4% 94.6% 100.0%
Desktop 48 510 558
8.6% 91.4% 100.0%
Laptop 144 414 558
25.8% 74.2% 100.0%
Use of Social Network Sites (SNSs)
It is evident (Table 4) that 345 out of a total of 558, representing 61.8% of the respondents used
Facebook, 330 out of a total of 558, representing 59.1% of the respondents used Google while
327 participants out of a total of 558, representing 58.6% of the respondents used Whatsapp, A
total of 84, representing 15.1% of the respondents used twitter, and 21 of them, representing
© Alhassan & Abukari
Licensed under Creative Common Page 1028
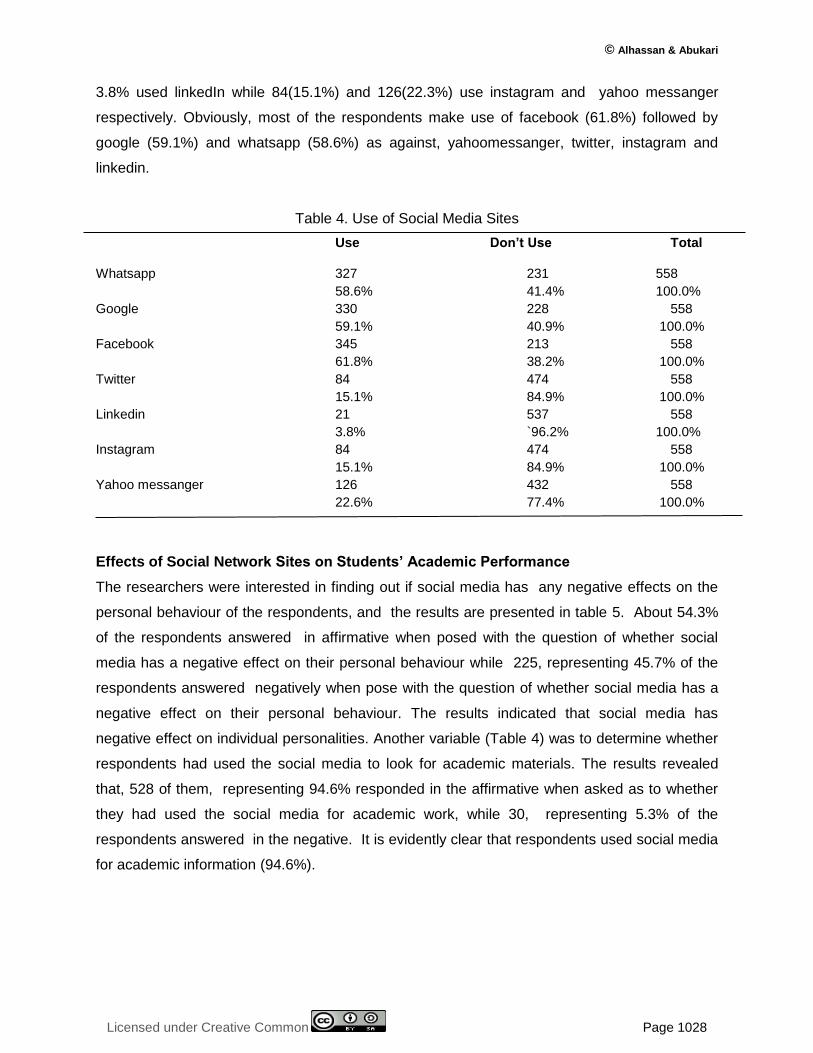
3.8% used linkedIn while 84(15.1%) and 126(22.3%) use instagram and yahoo messanger
respectively. Obviously, most of the respondents make use of facebook (61.8%) followed by
google (59.1%) and whatsapp (58.6%) as against, yahoomessanger, twitter, instagram and
linkedin.
Table 4. Use of Social Media Sites
Use Don’t Use Total
Whatsapp 327 231 558
58.6% 41.4% 100.0%
Google 330 228 558
59.1% 40.9% 100.0%
Facebook 345 213 558
61.8% 38.2% 100.0%
Twitter 84 474 558
15.1% 84.9% 100.0%
Linkedin 21 537 558
3.8% `96.2% 100.0%
Instagram 84 474 558
15.1% 84.9% 100.0%
Yahoo messanger 126 432 558
22.6% 77.4% 100.0%
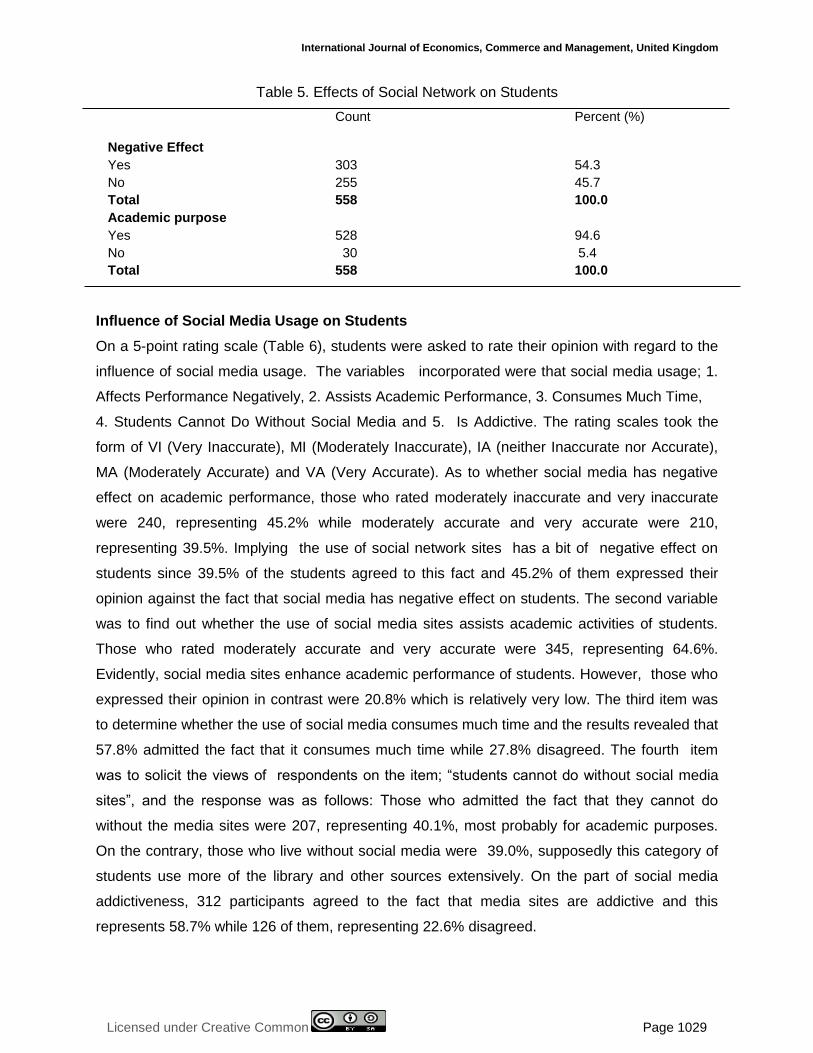
Effects of Social Network Sites on Students’ Academic Performance
The researchers were interested in finding out if social media has any negative effects on the
personal behaviour of the respondents, and the results are presented in table 5. About 54.3%
of the respondents answered in affirmative when posed with the question of whether social
media has a negative effect on their personal behaviour while 225, representing 45.7% of the
respondents answered negatively when pose with the question of whether social media has a
negative effect on their personal behaviour. The results indicated that social media has
negative effect on individual personalities. Another variable (Table 4) was to determine whether
respondents had used the social media to look for academic materials. The results revealed
that, 528 of them, representing 94.6% responded in the affirmative when asked as to whether
they had used the social media for academic work, while 30, representing 5.3% of the
respondents answered in the negative. It is evidently clear that respondents used social media
for academic information (94.6%).
International Journal of Economics, Commerce and Management, United Kingdom
Licensed under Creative Common Page 1029
Table 5. Effects of Social Network on Students
Count Percent (%)
Negative Effect
Yes 303 54.3
No 255 45.7
Total 558 100.0
Academic purpose
Yes 528 94.6
No 30 5.4
Total 558 100.0
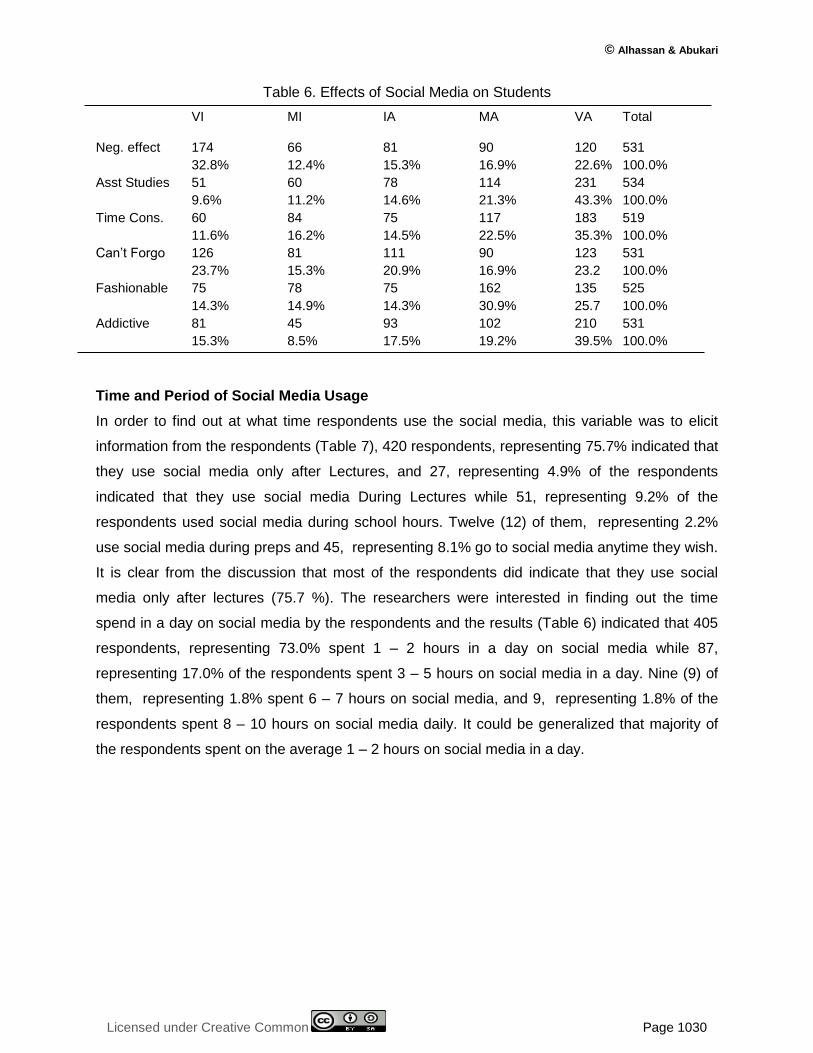
Influence of Social Media Usage on Students
On a 5-point rating scale (Table 6), students were asked to rate their opinion with regard to the
influence of social media usage. The variables incorporated were that social media usage; 1.
Affects Performance Negatively, 2. Assists Academic Performance, 3. Consumes Much Time,
4. Students Cannot Do Without Social Media and 5. Is Addictive. The rating scales took the
form of VI (Very Inaccurate), MI (Moderately Inaccurate), IA (neither Inaccurate nor Accurate),
MA (Moderately Accurate) and VA (Very Accurate). As to whether social media has negative
effect on academic performance, those who rated moderately inaccurate and very inaccurate
were 240, representing 45.2% while moderately accurate and very accurate were 210,
representing 39.5%. Implying the use of social network sites has a bit of negative effect on
students since 39.5% of the students agreed to this fact and 45.2% of them expressed their
opinion against the fact that social media has negative effect on students. The second variable
was to find out whether the use of social media sites assists academic activities of students.
Those who rated moderately accurate and very accurate were 345, representing 64.6%.
Evidently, social media sites enhance academic performance of students. However, those who
expressed their opinion in contrast were 20.8% which is relatively very low. The third item was
to determine whether the use of social media consumes much time and the results revealed that
57.8% admitted the fact that it consumes much time while 27.8% disagreed. The fourth item
was to solicit the views of respondents on the item; “students cannot do without social media
sites”, and the response was as follows: Those who admitted the fact that they cannot do
without the media sites were 207, representing 40.1%, most probably for academic purposes.
On the contrary, those who live without social media were 39.0%, supposedly this category of
students use more of the library and other sources extensively. On the part of social media
addictiveness, 312 participants agreed to the fact that media sites are addictive and this
represents 58.7% while 126 of them, representing 22.6% disagreed.
© Alhassan & Abukari
Licensed under Creative Common Page 1030
Table 6. Effects of Social Media on Students
VI MI IA MA VA Total
Neg. effect 174 66 81 90 120 531
32.8% 12.4% 15.3% 16.9% 22.6% 100.0%
Asst Studies 51 60 78 114 231 534
9.6% 11.2% 14.6% 21.3% 43.3% 100.0%
Time Cons. 60 84 75 117 183 519
11.6% 16.2% 14.5% 22.5% 35.3% 100.0%
Can’t Forgo 126 81 111 90 123 531
23.7% 15.3% 20.9% 16.9% 23.2 100.0%
Fashionable 75 78 75 162 135 525
14.3% 14.9% 14.3% 30.9% 25.7 100.0%
Addictive 81 45 93 102 210 531
15.3% 8.5% 17.5% 19.2% 39.5% 100.0%
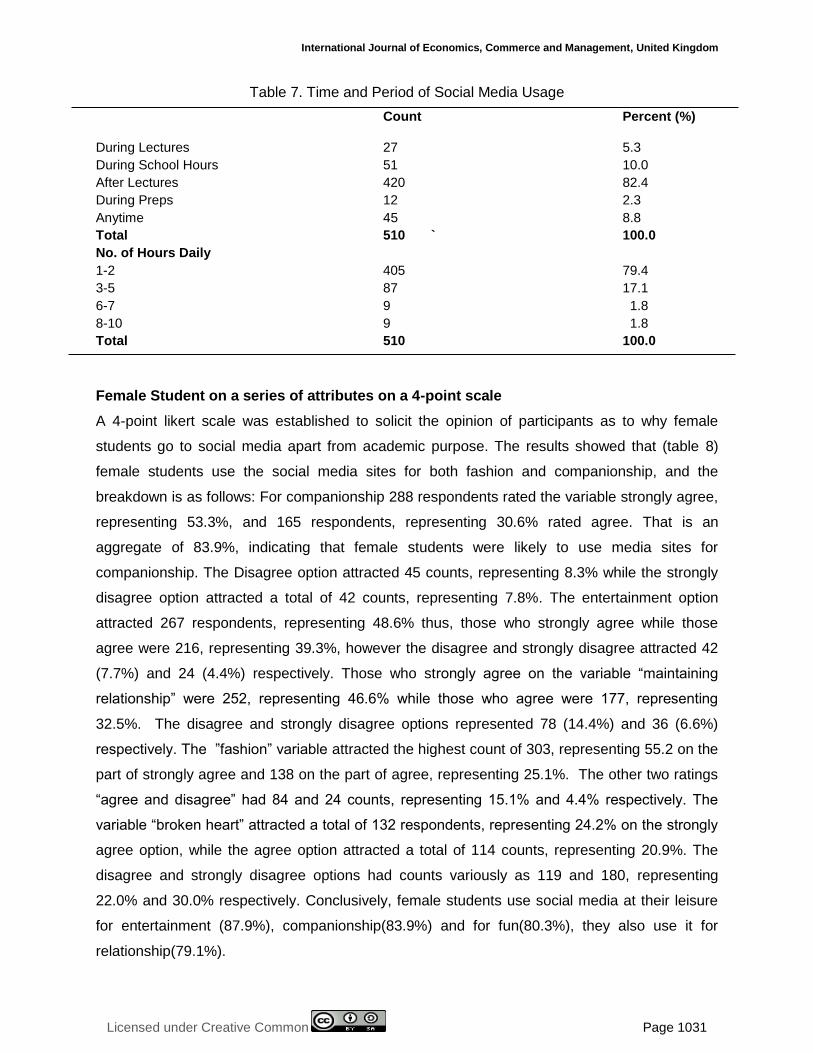
Time and Period of Social Media Usage
In order to find out at what time respondents use the social media, this variable was to elicit
information from the respondents (Table 7), 420 respondents, representing 75.7% indicated that
they use social media only after Lectures, and 27, representing 4.9% of the respondents
indicated that they use social media During Lectures while 51, representing 9.2% of the
respondents used social media during school hours. Twelve (12) of them, representing 2.2%
use social media during preps and 45, representing 8.1% go to social media anytime they wish.
It is clear from the discussion that most of the respondents did indicate that they use social
media only after lectures (75.7 %). The researchers were interested in finding out the time
spend in a day on social media by the respondents and the results (Table 6) indicated that 405
respondents, representing 73.0% spent 1 – 2 hours in a day on social media while 87,
representing 17.0% of the respondents spent 3 – 5 hours on social media in a day. Nine (9) of
them, representing 1.8% spent 6 – 7 hours on social media, and 9, representing 1.8% of the
respondents spent 8 – 10 hours on social media daily. It could be generalized that majority of
the respondents spent on the average 1 – 2 hours on social media in a day.
International Journal of Economics, Commerce and Management, United Kingdom
Licensed under Creative Common Page 1031
Table 7. Time and Period of Social Media Usage
Count Percent (%)
During Lectures 27 5.3
During School Hours 51 10.0
After Lectures 420 82.4
During Preps 12 2.3
Anytime 45 8.8
Total 510 ` 100.0
No. of Hours Daily
1-2 405 79.4
3-5 87 17.1
6-7 9 1.8
8-10 9 1.8
Total 510 100.0
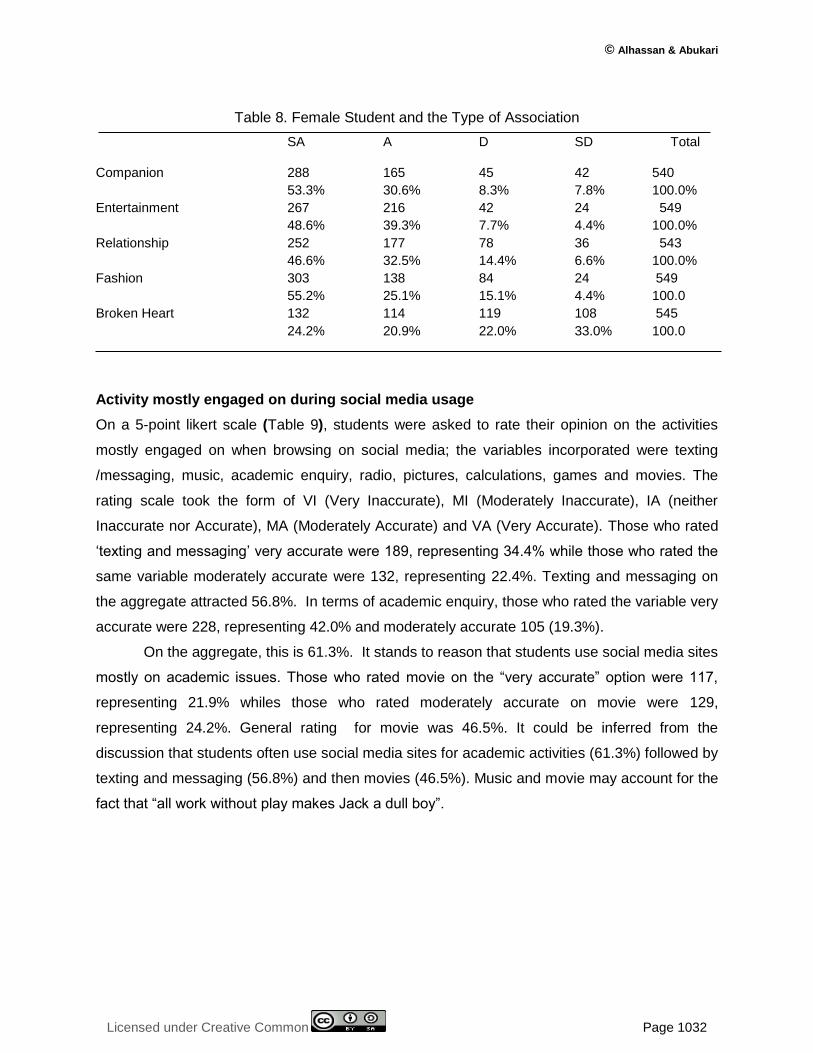
Female Student on a series of attributes on a 4-point scale
A 4-point likert scale was established to solicit the opinion of participants as to why female
students go to social media apart from academic purpose. The results showed that (table 8)
female students use the social media sites for both fashion and companionship, and the
breakdown is as follows: For companionship 288 respondents rated the variable strongly agree,
representing 53.3%, and 165 respondents, representing 30.6% rated agree. That is an
aggregate of 83.9%, indicating that female students were likely to use media sites for
companionship. The Disagree option attracted 45 counts, representing 8.3% while the strongly
disagree option attracted a total of 42 counts, representing 7.8%. The entertainment option
attracted 267 respondents, representing 48.6% thus, those who strongly agree while those
agree were 216, representing 39.3%, however the disagree and strongly disagree attracted 42
(7.7%) and 24 (4.4%) respectively. Those who strongly agree on the variable “maintaining
relationship” were 252, representing 46.6% while those who agree were 177, representing
32.5%. The disagree and strongly disagree options represented 78 (14.4%) and 36 (6.6%)
respectively. The ”fashion” variable attracted the highest count of 303, representing 55.2 on the
part of strongly agree and 138 on the part of agree, representing 25.1%. The other two ratings
“agree and disagree” had 84 and 24 counts, representing 15.1% and 4.4% respectively. The
variable “broken heart” attracted a total of 132 respondents, representing 24.2% on the strongly
agree option, while the agree option attracted a total of 114 counts, representing 20.9%. The
disagree and strongly disagree options had counts variously as 119 and 180, representing
22.0% and 30.0% respectively. Conclusively, female students use social media at their leisure
for entertainment (87.9%), companionship(83.9%) and for fun(80.3%), they also use it for
relationship(79.1%).
© Alhassan & Abukari
Licensed under Creative Common Page 1032
Table 8. Female Student and the Type of Association
SA A D SD Total
Companion 288 165 45 42 540
53.3% 30.6% 8.3% 7.8% 100.0%
Entertainment 267 216 42 24 549
48.6% 39.3% 7.7% 4.4% 100.0%
Relationship 252 177 78 36 543
46.6% 32.5% 14.4% 6.6% 100.0%
Fashion 303 138 84 24 549
55.2% 25.1% 15.1% 4.4% 100.0
Broken Heart 132 114 119 108 545
24.2% 20.9% 22.0% 33.0% 100.0
Activity mostly engaged on during social media usage
On a 5-point likert scale (Table 9), students were asked to rate their opinion on the activities
mostly engaged on when browsing on social media; the variables incorporated were texting
/messaging, music, academic enquiry, radio, pictures, calculations, games and movies. The
rating scale took the form of VI (Very Inaccurate), MI (Moderately Inaccurate), IA (neither
Inaccurate nor Accurate), MA (Moderately Accurate) and VA (Very Accurate). Those who rated
‘texting and messaging’ very accurate were 189, representing 34.4% while those who rated the
same variable moderately accurate were 132, representing 22.4%. Texting and messaging on
the aggregate attracted 56.8%. In terms of academic enquiry, those who rated the variable very
accurate were 228, representing 42.0% and moderately accurate 105 (19.3%).
On the aggregate, this is 61.3%. It stands to reason that students use social media sites
mostly on academic issues. Those who rated movie on the “very accurate” option were 117,
representing 21.9% whiles those who rated moderately accurate on movie were 129,
representing 24.2%. General rating for movie was 46.5%. It could be inferred from the
discussion that students often use social media sites for academic activities (61.3%) followed by
texting and messaging (56.8%) and then movies (46.5%). Music and movie may account for the
fact that “all work without play makes Jack a dull boy”.

International Journal of Economics, Commerce and Management, United Kingdom
Licensed under Creative Common Page 1033
Table 9: Activity mostly engaged on during social media usage
Activity VI MI IA MA VA Total
Text/Message 123 75 39 132 189 558
22.4% 13.7% 7.1% 22.4% 34.4% 100.0%
Music 135 119 105 96 84 539
25.0% 22.2% 19.4% 17.8% 15.6% 100.0%
Academic 102 48 60 105 228 543
18.8% 8.8% 11.0% 19.3% 42.0% 100.0%
Radio 168 81 114 63 102 528
30.1% 15.3% 21.6% 11.9% 19.3% 100.0
Pictures 159 81 126 93 84 543
28.5% 14.9% 23.2% 17.1% 15.5% 100.0%
Calculation 180 69 96 84 99 528
34.1% 13.1% 17.6% 15.9% 18.8% 100.0%
Games 171 78 99 114 81 543
31.5% 14.4% 18.2% 21.0% 14.9% 100.0%
Movies 102 93 93 129 117 534
19.1% 17.4% 17.4% 24.2% 21.9% 100.0%
The study also assessed the correlation between the academic schools and use of social
media, likewise between the year groups and use of social media. The inferential stat output
below (Table 10) indicated that P-value = 0.001 for the programme of study and that of the year
group, P-value = 0.015. We can therefore conclude that the use of social media is independent
of academic school and year group.
Table 10. Chi Square Statistics
Programme of Study Year Group
Social Media Social Media Sites Sites Chi-square 35. 212 Chi-square 27.782 df 14 df 14 Sig. 0.001 Sig. 0.015
CONCLUSION AND RECOMMENDATIONS
On the whole, the cardinal aim of the study was to investigate the type of social network sites
and devices used by students as well as the effects of the use of social network on academic
performance, and on personal traits of students. From the discussion, most of the students
make use of smartphones (59.1%). Followed by cell phones (44.1%) and laptops (25.8%), few
of them use desktop(8.6%) for its outmoded nature, and tablets(5.4%) for its expensive nature.
For the use of social media sites, it was obvious that, most of the students make use of
facebook (61.8%) followed by google (59.1%) and whatsapp (58.6%) as against,
© Alhassan & Abukari
Licensed under Creative Common Page 1034
yahoomessanger, twitter, instagram and linkedin. The study was to find out on a ‘Yes or No’
scale whether the use of social media enhances academic activities of students, and the
findings revealed that students use social media as such (95.0%). On a 5-point rating scale,
whether the use of social media has negative effect on students’ personality traits, those who
rated “moderately inaccurate” and “very inaccurate” were 240, representing 45.2% while
“moderately accurate” and “very accurate” were 210, representing 39.5%. Implying the use of
social media sites have a bit of negative effect on students since 39.5% of the students agreed
to this fact and 45.2% of them expressed their opinion against the fact that social media has no
negative effect on students. The next variable on the rating was to determine whether the use of
social media sites assists academic activities of students. Those who rated moderately accurate
and very accurate were 345, representing 64.6%, thus social media sites enhances academic
performance of students. However, those who expressed their opinion in contrast were 20.8%
which is relatively very low. In another instance students were asked to rate their opinion on the
activity they invariably engage themselves on in the use of social media. It was evident from the
discussion that students often use social media sites for academic activities (61.3%) followed by
texting and messaging (56.8%) and then movies (46.5%). Music and movie account for the fact
that “all work without play makes Jack a dull boy. The findings further revealed that majority of
the students spent on the average, 1 – 2 hours on social media in a day, since 420 students,
representing 75.7% indicated that they use social media only after Lectures. It is common
knowledge that female students have passion for social media. This study however tried to
investigate the activity they are invariably engaged on, and conclusively, female students use
social media at their leisure for entertainment(87.9%), companionship(83.9%) and for
fun(80.3%), they also use it for relationship(79.1%). The various schools were cross validated to
verify the particular school that uses social media most, and the findings indicated that there is
no relationship between academic schools and use of social media. For the year group, it is
evident from the descriptive stat output that there is no relationship between year group and use
of social media.
It is therefore recommended that the polytechnic should organize a semester based
lecture, at least once in every semester on departmental bases, for all those with smart phones
having internet facility. Students should be briefed the pros and cons of social media, and
should be advised to always use this media to support their studies in terms of assignment,
projects, organizing academic materials, etc. They should also be discouraged using so much
time on chatting with friends, watching movies and other activities that are not related to the
programme of study.
International Journal of Economics, Commerce and Management, United Kingdom
Licensed under Creative Common Page 1035
REFERENCES
Abdelraheem, A. Y. (2013). University Students’ Use of Social Networks Sites And Their Relation With Some Variables. WEI International Academic Conference Proceedings January 14-16, 2013 Antalya, Turke, the West East Institute 31.
Banquil, K.., & Chua, N. A. (2009). Social Networking Sites Affects One’s Academic Performance Adversely. Retrieved from http// www.Scribd. Com/ doc/2891955.
Boyd, D. M. & Elissen N. B. (2007). Social Networking Sites: Definition, History and Scholarship. Journal of Computer – Mediated Community.
Church K,. and de Oliveira, R. (2013). What’s up with WhatsApp? Comparing Mobile Instant Messaging Behaviours with Traditional SMS. Munich, Germany.
Gangadharbatla, H. (2008). Facebook me: Collective Self-esteem, Need to Belong, and Internet Self-efficacy as Predictors of the Igeneration’s Attitudes Toward Social Networking Sites. Journal of Interactive
Advertising,8(2), 5‐15.http://jiad.org/article100. 28 July, 2013.
Garton, L., Haythornthwaite, C., & Wellman, B. (1997). Studying Online Social Networks. Journal of Computer-Mediated Communication, 3(1), Retrieved January 15, 2008, From http://jcmc.indiana.edu/vol3/issue1/garton.html.
Hall, C. and Zarro, M. (2012). Social Curation On The Website Pinterest.Com, ASIST 2012, Battimore, MD, USA.
Hamat, A., Embi, M. A., and Hassan, H. A. (2012).The use of Social Networking Sites Aong Malaysian University Students. International Education Studies, 5(3), 56-66.
Hargittai, E. & Hsieh, Y.P. (2010).Predictors and consequences of differentiated practices on social network sites. Information. Communication & Society, 13(4), 515-536. http://www.tandfonline.com. 28 July, 2013.
Helou, A. M. and Ab.Rahim, N. Z. (2014). The Influence Of Social Networking Sites On Students’ Academic Performance In Malaysia.International Journal of Electronic Commerce Studies Vol.5, No.2, pp.247-254, 2014 doi: 10.7903/ijecs.1114.
Kalplan, A. M., Haenlein, M. (2010). Users of the World, Unite. The Challenges and Opportunities of Social Media. Business Horizons. 53(1) p 61.
Kanagarathinam, M. (2014). Impact of Social Networking Sites on Academic Performance of Adolescents in Coimbatore city Indian Journal of Applied Research, Volume 4, Issue : 12.
Madge, C., Meek, J., Wellens, J. & Hooley, T. (2009). Facebook, Social Integration, and Informal Learning at University: it is more for socializing and talking to friends about work than for actual doing work: Learning Media and Technology, 34(2) 141-155.
Mazman, S. G., & Usluel, Y. K. (2010). Modeling Educational Usage of Facebook. Computers & Education, 55, 444-453. doi:10.1016/j.compedu.2010.02.00.
Murthy, Dhiraj. (2013). Twitter. Social Communication in the Twitter Age. Cambridge: Polity. Pp7 -8.
Paul, J. A., Baker, H. M., & Cochran, J. D. (2012). Effect of Online Social Networking on Student Performance: Computer in Human Behaviors 28(b).
Periyar, R. S. (2015). The Academic Usage of Social Networking Sites by the University Students of Tamil Nadu, Online Journal of Communication and Media Technologies Volume: 5.
Salvation, M. and Adzharuddin, N. A. (2014). The Influence of Social Network Sites (SNS) upon Academic Performance of Malaysian Students, International Journal of Humanities and Social Science Vol. 4, No. 10(1); August 2014.