the impact of state budget cuts on u.s. postsecondary ... · of state budget cuts to higher...
TRANSCRIPT

The Impact of State Budget Cuts on
U.S. Postsecondary Attainment
David J. Deming
Harvard University and NBER
Christopher R. Walters
UC Berkeley and NBER∗
February 2018
Abstract
Increasing postsecondary attainment rates is an important economic priority, yet little is known about
whether public subsidies can increase college attendance and completion. This paper studies the impact
of state budget cuts to higher education on all U.S. public postsecondary institutions between 1990
and 2013. Using a budget shock measure driven by historical reliance on state appropriations, we nd
large impacts of budget cuts on enrollment and degree completion. We nd no evidence that enrollment
declines are due to budget cuts being passed through as higher prices - rather, all of the impact is
explained by spending cuts.
∗Emails: [email protected]; [email protected]. Thanks to John Bound, Susan Dynarski, Mark Hoek-stra, Jesse Rothstein, Kevin Stange, Lesley Turner, Sarah Turner, Seth Zimmerman, and seminar participants at NorthwesternUniversity, the UC Berkeley Goldman School of Public Policy, William & Mary, the University of Toronto, the BrookingsInstitution, the University of Chicago Booth School of Business, the 2016, 2017, and 2018 American Economic AssociationAnnual Meetings, and the 2016 APPAM Fall Conference for helpful comments. Olivia Chi, Patrick Lapid, and Tomas Monarrezprovided superb research assistance.
1

1 Introduction
Postsecondary attainment is strongly related to economic growth (Hanushek and Woessmann, 2008; Gen-
naioli et al., 2013; Hanushek et al., forthcoming). Yet the share of college-educated youth in the U.S. has
grown slowly in recent years, compared to more rapid growth in other developed nations (OECD, 2013;
Autor, 2014). Thus increasing U.S. degree attainment is an important national economic priority.
While there is a strong positive correlation between per student spending and rates of degree completion
in U.S. public postsecondary institutions, there exists little causal evidence of the impact of changes in
per-student spending on degree completion (e.g. Bound and Turner, 2007; Deming, 2017). One view is
that higher spending pays for administrative bloat and consumption amenities, in which case lower levels
of spending may be cost-eective (see, e.g., Ginsberg, 2011; Ehrenberg, 2012; Jacob et al., 2013). On the
other hand, spending cuts may reduce degree completion by harming the quality of instruction, limiting
the number and variety of course oerings, increasing class size, or moving students into non-credit-bearing
remedial courses (Bettinger and Long, 2009).
This paper studies the eects of state funding cuts on attainment and degree completion at U.S. public
postsecondary institutions. Our main data source is the Integrated Postsecondary Education Data System
(IPEDS), a panel of U.S. postsecondary institutions with continuous coverage between 1990 and 2013. The
panel design of IPEDS allows us to study the impact of budget cuts on individual institutions in an event
study framework. Our empirical strategy addresses key issues such as serial correlation in outcomes and
reverse causality (enrollment declines causing budget cuts, rather than the other way around). However, we
rst show that the impact of higher education budget cuts is visible in aggregate data.
Figure 1 presents a simple event study that compares the timing of particularly large state budget cuts -
15 percent or more - to the average percent change in state-year enrollment (left-hand panel) and bachelor's
degrees awarded (right-hand panel).1 Enrollment growth averages 2 percent per year in the three years prior
to a budget cut, but drops to less than 1 percent in the year of the budget cut and becomes negative two
years later. We nd a similar pattern for bachelor's degrees, with 2 to 3 percent yearly growth prior to a
budget cut but a sharp slowdown in the years afterward.2
While Figure 1 provides suggestive evidence of a link between budget cuts and postsecondary attainment,
the timing of budget cuts is not random. State appropriations for higher education uctuate with the
1Over the 1990 to 2013 period, 30 states cut their higher education budget by 15 percent or more in a single year. Weexpress the outcomes as yearly percent changes in order to account for dierences across states in size, and for dierences inthe timing of budget cuts (since enrollment is growing overall during this period). For budget cuts, year zero is the summerbefore the Fall-to-Spring academic year in which enrollment and degrees are measured. Appendix Figure 1 presents a similarset of results but in enrollment levels, with the sample restricted to a balanced panel of states where we observe enrollment 5years before and after the budget cut. Those gures show a clear leveling o from an otherwise upward trend in the 3-4 yearsafter a budget cut, for both enrollment and degrees awarded. We also nd similar results with slightly dierent denitions ofenrollment (such as using full-time equivalent enrollment, or restricting to full-time undergraduates). Finally, our results arerobust to choosing other thresholds for a large budget cut, such as 10 percent or 20 percent.
2Notably, while the impact on bachelor's degrees is delayed relative to enrollment, it also begins before any newly enrolledstudents would have had time to complete their studies. This timing is consistent with our main results, and suggests thatthe decline in degrees awarded is due to lower persistence among already-enrolled students rather than fewer new studentsmatriculating. See Section 4 for more details.
2
business cycle. While policy decisions about higher education funding generally operate at the state level,
uniform state-level budget cuts have greater proportional impacts on institutions that rely more heavily on
appropriations as a source of revenue (Kane et al., 2003; Barr and Turner, 2013).
In this spirit, we construct a state budget shock measure that interacts total yearly state appropriations
for higher education with each institution's historical appropriations revenue share. This approach purges
variation in funding driven by policymakers' decisions about which institutions to support in particular years,
and allows us to control for permanent dierences across institutions, changes in common outcomes within
a state, and important time-varying determinants of the demand for higher education such as state and
local unemployment rates. We also show that the budget shock variable eectively controls for dierential
pre-trends in enrollment and other outcomes. Interacting cross-sectional variation in exposure to a policy
treatment of interest with aggregate changes is common in studies of local labor markets, immigration, and
the opening of trade with China (Bartik, 1991; Blanchard and Katz, 1992; Card, 2001; Autor et al., 2013).
We nd large impacts of state budget cuts on postsecondary enrollment. Our estimates imply that a
movement from the 25th to the 75th percentile of our measure of state support in a given year generates a
3 percent increase in enrollment. We also nd positive and statistically signicant causal impacts on degree
completion, including bachelor's degrees. These impacts are driven mostly by increased persistence and
degree completion among already-enrolled students, rather than increases in initial college matriculation.
Schools respond to budget cuts both by reducing spending and raising tuition, and our approach measures
the net impact of adjustment along both margins. Understanding the policy implications of our ndings
requires distinguishing between these two causal channels. To this end, we utilize a newly assembled data
source of tuition caps and freezes to identify institutions that are constrained in their ability to adjust prices.
Using the budget shock and price cap instruments together in a two-stage least squares (2SLS) framework,
we estimate a large, positive, and statistically signicant elasticity of enrollment with respect to spending,
but a modest and statistically insignicant tuition elasticity. Moreover, we nd that academic support
spending - including tutoring, advising and mentoring - is particularly responsive to state budget shocks.
This is consistent with recent studies nding large impacts of student supports on persistence and degree
completion (Angrist et al., 2009; Bettinger and Baker, 2011; Barrow et al., 2014). While ultimately the
mechanisms are only suggestive, our results are most consistent with spending improving quality by lifting
informal capacity constraints such as course waitlists and inadequate advising (e.g. Bound et al., 2012).3
To our knowledge, this is the rst paper to directly demonstrate a causal link between state higher
education funding and degree attainment in U.S. postsecondary institutions. The most closely related paper
is Bound and Turner (2007), who show that larger state cohorts have lower degree attainment rates. While
they argue that lower public subsidies per student are the key causal mechanism, they do not directly
3In principle, spending cuts could lead to formal capacity constraints through admissions quotas. We think this is unlikelyto explain our results, for two reasons. First, most of the colleges in our sample (and nearly all of the community colleges)accept every student who applies and meets minimum academic qualications. Second, a web search revealed the existence offormal capacity constraints in only a handful of states and years. Our results are robust to excluding schools that accept fewerthan 50 or 75 percent of applicants, and they are nearly unchanged when we exclude states and years with formal capacityconstraints from the analysis.
3

measure changes in public spending on higher education, nor do they use institution-level data on student
outcomes. Our results complement studies of cohort crowding and college quality, which draw linkages
between changes in college resources, declining completion rates and increased time to degree over the
last twenty years (Turner, 2004; Bound and Turner, 2007; Bound et al., 2010, 2012). Our ndings are
also consistent with recent evidence indicating that increased resources boost educational attainment and
other outcomes at primary and secondary schools (Card and Krueger, 1992; Jackson et al., 2016; Lafortune
et al., 2016). Finally, we nd that budget cuts have large impacts on attainment at many mid-tier public
institutions, which Chetty et al. (2017) show are important mediators of intergenerational mobility.
2 Data and Background
2.1 Data Description
IPEDS is a survey of colleges, universities and vocational institutions conducted annually by the U.S. De-
partment of Education (DOE). The Higher Education Act requires postsecondary institutions to participate
in IPEDS to retain eligibility to administer Federal Title IV student aid (Pell Grants and Staord Loans).
IPEDS collects information on student enrollment overall and by race, gender, age and student status, as well
as degree completion by level and eld of study. IPEDS also collects detailed information on institutional
nances, including revenues and expenditures by source. Financial data are collected as of the scal year,
which usually begins in July. Enrollment data are counted for the fall-to-spring academic year.
IPEDS collects data at the campus level using a unique longitudinal identier. Campus-level data allows
us to separate enrollment and nances for branch campuses of university systems. We supplement the
IPEDS data with state legislative appropriations data from Grapevine, an annual survey compilation of
data on state support for higher education administered by the State Higher Education Executive Ocers
(SHEEO) Association and the Center for the Study of Education Policy at Illinois State University.4 We
also match the IPEDS to publicly available data on state and county unemployment rates collected by the
Bureau of Labor Statistics, as well as annual data on state tax receipts and other forms of state government
spending such as Medicaid. Finally, we match IPEDS to state- and county-level data from the Census and
the American Community Survey (ACS).
Appendix Table 1 presents descriptive statistics for the colleges in our sample. Most public institutions
derive almost all of their revenue from state appropriations, tuition and fees, and Federal nancial aid. The
baseline revenue share in state appropriations is generally higher for less selective institutions but it varies
widely, with a mean of 44 percent and an interquartile range of 21 percentage points.
4The Grapevine data can be found at https://education.illinoisstate.edu/grapevine/historical/. We measure appropriationsfrom Grapevine rather than IPEDS because of concerns about duplicate reporting of state funding across campus branches ofinstitutions, as well as errors in administrator survey responses. IPEDS appropriations aggregated to the state-year level aresimilar to corresponding measures in Grapevine (correlation = 0.83).
4

2.2 Higher Education Appropriations and Tuition
Our description of higher education funding relies on a SHEEO survey of state budgetary processes (Parmley
et al., 2009). While the details dier across states, a typical budgetary process unfolds as follows:
1. One to two years in advance of the scal year, a state higher education coordinating board develops a
budget request that covers all public institutions in the state.
2. The governor proposes a budget to the legislature, and they negotiate over the course of several months.
3. The budget is typically ratied in the spring and takes eect the following fall. A key source of
uncertainty in this process is the possibility that budget requests will not be fully funded, and this is
especially likely when tax revenues are less than expected.5
Importantly, states are mostly unable to smooth business cycle uctuations in tax revenue. Nearly all states
have some sort of balanced budget requirement, and higher education spending often serves as the balance
wheel used to meet these requirements when tax revenues fall short of projections (Kane et al., 2003; Delaney
and Doyle, 2011).
States dier markedly in their support for higher education - see Appendix Figure A1 for trends in per
capita approprations across four large states. There is wide variation in spending, even across nearby states
with similar demographics. However, the overall trend is toward declining support - between 2000 and
2014, ination-adjusted state appropriations per full-time equivalent student fell by 28 percent, and total
per-student spending fell by 16 percent (Baum and Ma, 2014).
3 Eects of State Support for Higher Education
3.1 State Funding and Institution Outcomes
Figure 1 suggests that cuts in state appropriations for higher education are associated with declines in enroll-
ment and degree completion. To describe the relationship between state funding and institution outcomes
more systematically, we estimate regressions of the form:
Yi,t = γi + ψt +
L∑`=−L
δ`Xi,t−` + ui,t, (1)
where Yi,t represents an outcome of interest for institution i in year t, γi and ψt are institution and year xed
eects, and Xi,t is log state appropriations. In each case, the timing of nancial variables is July of year t,
whereas enrollment and degree outcomes are measured for the following academic year, e.g. Fall of year t
through Spring of year t + 1. The coecient δ` describes the relationship between appropriations in year
5The SHEEO survey received responses from 43 states. Institutions submit budget requests individually in only six states.Governors vetoed or reduced specic budget line items in only 14 states. The executive branch fully funded the initial budgetrequest in about half of cases, and that number is slightly lower for the nal budget.
5
t and outcomes ` years earlier, controlling for permanent dierences across institutions, changes over time
common to all institutions, and tuition or spending in other years. The model includes 4 leads and 5 lags
(for ten years total), although none of our results are sensitive to this particular number of years. Standard
errors are clustered by institution.
Figure 2 plots estimates of equation (1) for log institution spending, log tuition, and log enrollment, with
coecients arranged in event time so that positive indices correspond to lagged values of state appropria-
tions. The top panel shows that increases in state support are correlated with contemporaneous increases in
spending. The base year coecient suggests that a 10 percent increase in appropriations in year t is associ-
ated with a 3 percent increase in spending in the same year. The middle panel shows that state funding is
negatively correlated with tuition prices, with a 10 percent increase in appropriations linked to a price cut of
about 0.6 percent. The bottom panel shows that increased appropriations are also associated with increased
enrollment.
While these estimates show that institution outcomes change contemporaneously with state appropria-
tions, Figure 2 also reveals signicant pre-trends in these relationships. The coecients on the rst lead of
appropriations indicate that spending and enrollment rise in the year prior to an increase in state support,
while tuition falls. This pattern may reect funding decisions that anticipate changes in the demand for
higher education. For example, state legislatures may allocate more funds for higher education when enroll-
ment is projected to grow quickly, or target extra funds to institutions where enrollment demand is growing
especially fast. These pre-trends suggest that estimates of equation (1) are unlikely to capture causal eects
of appropriations.
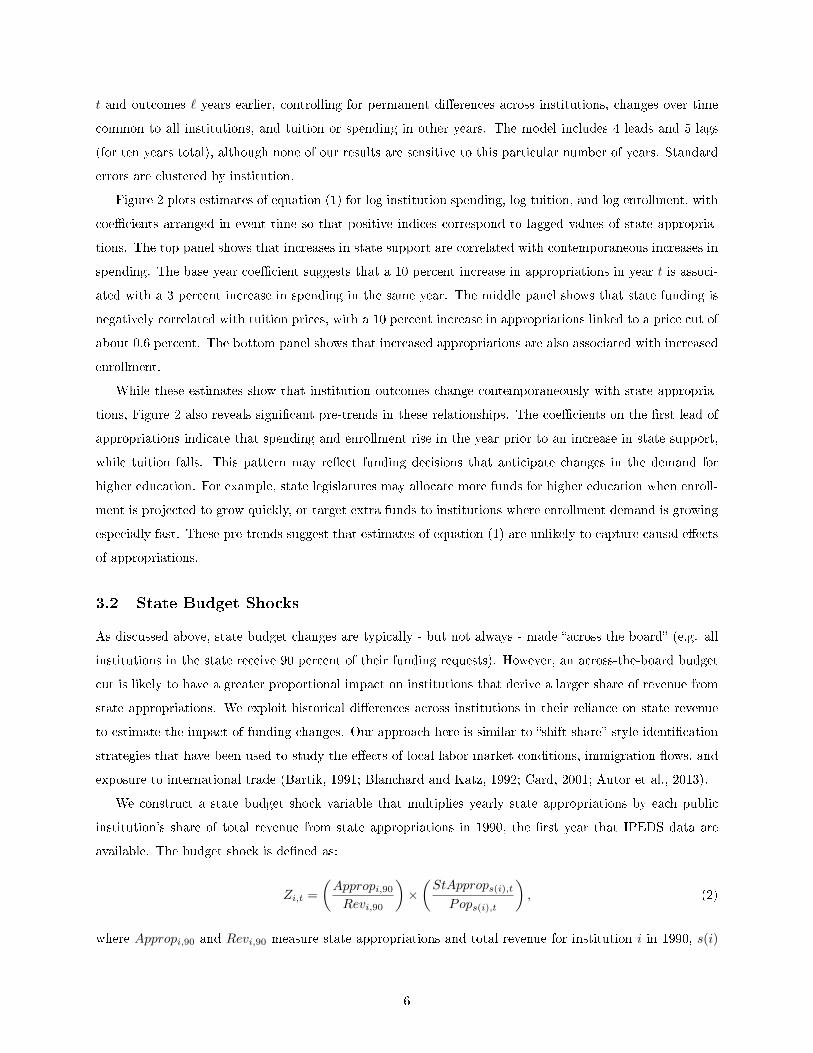
3.2 State Budget Shocks
As discussed above, state budget changes are typically - but not always - made across the board (e.g. all
institutions in the state receive 90 percent of their funding requests). However, an across-the-board budget
cut is likely to have a greater proportional impact on institutions that derive a larger share of revenue from
state appropriations. We exploit historical dierences across institutions in their reliance on state revenue
to estimate the impact of funding changes. Our approach here is similar to shift-share style identication
strategies that have been used to study the eects of local labor market conditions, immigration ows, and
exposure to international trade (Bartik, 1991; Blanchard and Katz, 1992; Card, 2001; Autor et al., 2013).
We construct a state budget shock variable that multiplies yearly state appropriations by each public
institution's share of total revenue from state appropriations in 1990, the rst year that IPEDS data are
available. The budget shock is dened as:
Zi,t =
(Appropi,90Revi,90
)×(StApprops(i),t
Pops(i),t
), (2)
where Appropi,90 and Revi,90 measure state appropriations and total revenue for institution i in 1990, s(i)
6
denotes state for institution i, and StApprops,t and Pops,t represent total appropriations and college-age
population for state s in year t. The rst factor in (2) is each institution's revenue from state appropriations
divided by total revenue in 1990. This captures a school's dependence on state funds at baseline. Using
the 1990 revenue shares shuts down variation in exposure to state budget shocks that might be driven by
endogenous institutional responses. For example, institutions might become more or less dependent on state
appropriations over time based on changing selectivity, increased ability to attract out-of-state students, or
other sources of unobserved heterogeneity.
The second factor in (2) calculates state appropriations per college-age (age 19-23) student in each
state and year, using Grapevine data rather than institution-level appropriations from IPEDS. Restricting
variation in state appropriations to the state-year level addresses the concern that schools receiving more or
less funding within a particular state and year may dier in unobserved ways. For example, a budget cut
for an individual institution may be more or less severe depending on the current political inuence of its
leadership. State legislatures might allocate additional funds to colleges in labor markets that have been hit
particularly hard by economic downturns.
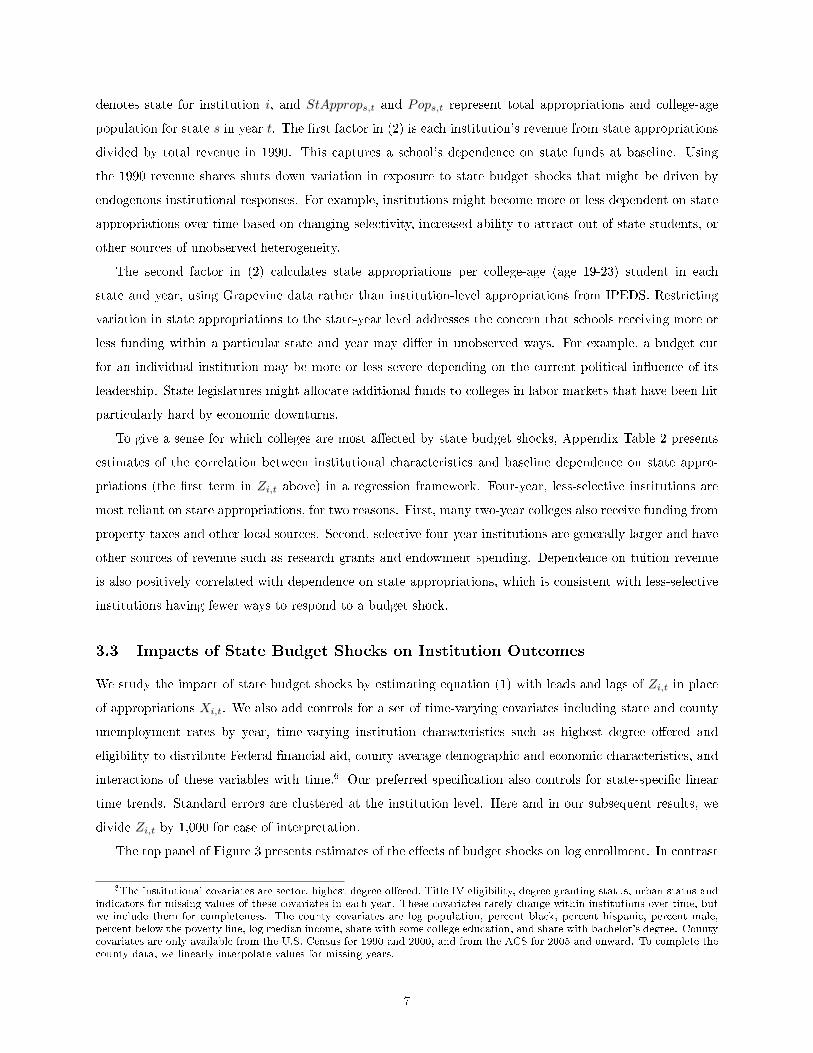
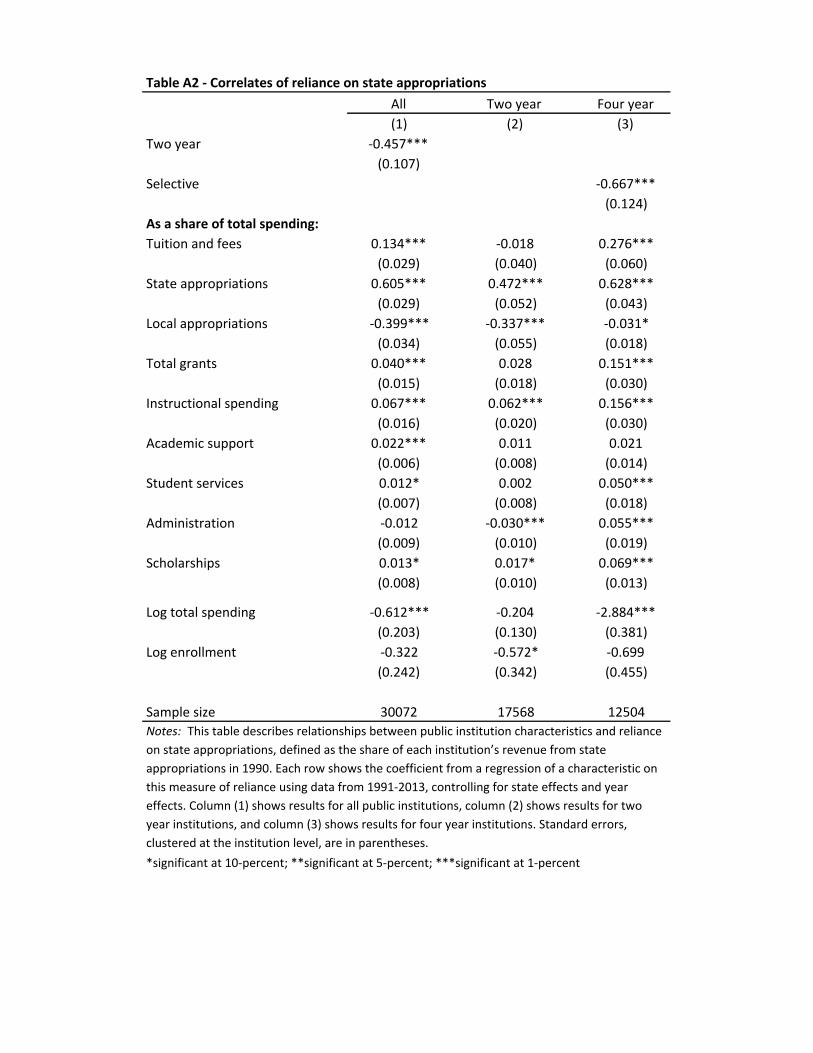
To give a sense for which colleges are most aected by state budget shocks, Appendix Table 2 presents
estimates of the correlation between institutional characteristics and baseline dependence on state appro-
priations (the rst term in Zi,t above) in a regression framework. Four-year, less-selective institutions are
most reliant on state appropriations, for two reasons. First, many two-year colleges also receive funding from
property taxes and other local sources. Second, selective four-year institutions are generally larger and have
other sources of revenue such as research grants and endowment spending. Dependence on tuition revenue
is also positively correlated with dependence on state appropriations, which is consistent with less-selective
institutions having fewer ways to respond to a budget shock.
3.3 Impacts of State Budget Shocks on Institution Outcomes
We study the impact of state budget shocks by estimating equation (1) with leads and lags of Zi,t in place
of appropriations Xi,t. We also add controls for a set of time-varying covariates including state and county
unemployment rates by year, time-varying institution characteristics such as highest degree oered and
eligibility to distribute Federal nancial aid, county average demographic and economic characteristics, and
interactions of these variables with time.6 Our preferred specication also controls for state-specic linear
time trends. Standard errors are clustered at the institution level. Here and in our subsequent results, we
divide Zi,t by 1,000 for ease of interpretation.
The top panel of Figure 3 presents estimates of the eects of budget shocks on log enrollment. In contrast
6The institutional covariates are sector, highest degree oered, Title IV eligibility, degree-granting status, urban status andindicators for missing values of these covariates in each year. These covariates rarely change within institutions over time, butwe include them for completeness. The county covariates are log population, percent black, percent hispanic, percent male,percent below the poverty line, log median income, share with some college education, and share with bachelor's degree. Countycovariates are only available from the U.S. Census for 1990 and 2000, and from the ACS for 2005 and onward. To complete thecounty data, we linearly interpolate values for missing years.
7

to the results using actual appropriations in Figure 2, we nd no evidence of pre-trends in the relationship
between the budget shock and enrollment. The coecients on all four leads are precisely estimated, near zero
and not statistically signicant. We fail to reject the hypothesis that all four pre-trend coecients are jointly
equal to zero (p = 0.64). Additionally, we nd a positive impact of the budget shock on log enrollment in the
following academic year. This estimate, which is statistically signicant at the one percent level, implies that
a $1,000 increase in the budget shock increases enrollment by 2.8 percent. Like other shift-share measures, the
budget shock variable does not have a natural scale; we follow Autor et al.'s (2013) approach to interpreting
the eects of their measure of trade with China and scale our estimates by the interquartile range of the
shock. The interquartile range of Zi,t is 1.1, so our estimate implies that a movement from the 25th to the
75th percentile of the budget shock causes a 3.1 percent increase in enrollment in the same academic year.
This equals 253 students at the sample mean enrollment value of 8,172.
We also nd eects of the budget shock on enrollment in future years. The estimated eects of a budget
increase in year t are positive in years t+1 through t+5, and the estimates in years 1, 3, and 5 are statistically
signicant. The magnitudes of the coecients indicate that a movement from the 25th to the 75th percentile
of Zi,t increases total enrollment over the subsequent ve years by about 1.4 percent, or 570 students. Overall,
the magnitudes in the top panel of Figure 3 are roughly in line with the simple time series pattern in Figure
1, which shows that enrollment declines by 1-2 percent in the years immediately following a budget cut of 15
percent or more. The mean value of Zi,t (in thousands) is 1.87, so our estimates indicate that a 15 percent
change in the budget shock results in an enrollment change of roughly 1.85 · 0.15 · 0.028× 100 = 0.8 percent.
The bottom panel of Figure 3 repeats the exercise for another key outcome - the log of total degrees and
certicates awarded. While the contemporaneous impact of the budget shock instrument on degrees and
certicates is small, we nd a large, statistically signicant, positive impact of a budget shock in year t on
log awards in year t + 1. The magnitude implies that a movement from the 25th to the 75th percentile of
Zi,t increases total awards by 5 percent in the year after the shock, which equals about 55 additional degrees
at the mean value of awards. The other post-shock coecients are mostly positive, and we decisively reject
the joint hypothesis that the coecients on degrees and certicates in years t through t + 5 all equal zero
(p = 0.001). As with the enrollment results, these estimates are qualitatively in line with the time series
relationship between budget cuts and degrees depicted in Figure 1, which shows a pronounced decrease in
awards in the year following a large budget cut. Additionally, we fail to reject the joint hypothesis that the
pre-trend coecients are equal to zero (p = 0.35) and there is no visual evidence of pre-trends.
An institution that faces a state budget cut can either reduce spending or increase tuition to maintain
spending. Thus it is plausible that institutional spending and tuition are the two key mechanisms through
which budget shocks aect enrollment and degree completion. Figure 4 presents event study estimates of
the eects of budget shocks on log total spending and log tuition. The top panel of shows clear evidence
that an increase in Zi,t boosts total spending in year t. We also nd smaller but still statistically signicant
impacts on spending in the second and fth years following the budget shock. The bottom panel shows that
8

state budget shocks aect tuition as well. The magnitudes of these estimates imply that moving from the
25th to the 75th percentile of the budget shock causes roughly a 6 percent increase in spending and a 6
percent reduction in tuition. This suggests that public institutions may react to state budget cuts in part
by increasing tuition to make up for lost revenue. In the next section we explore the contributions of these
two channels to the attainment eects displayed in Figures 3 and 4.
4 Mechanisms
4.1 Spending and Tuition
The results in Figure 4 show that institutions react to budget cuts through a mix of price increases and
spending cuts. The eect of a budget shock on educational attainment therefore measures the net impact of
adjustments on both of these margins. We would ideally like to study the impacts of changes in spending
versus price among institutions that are forced to make only one adjustment, holding the other constant. We
approximate this ideal by introducing a second source of variation based on tuition cap and freeze regulations,
which constrain institutions' ability to adjust prices in response to budget cuts. The combination of budget
shocks and tuition regulations produces independent variation in spending and prices, allow us to get a sense
of which causal mechanism is most important in explaining the reduced form eects of budget shocks.
Seventeen states imposed formal price controls on public institutions at least once between 1990 and
2013. The complete list appears in Appendix Table A3. We compiled these data by referencing ocial
sources when available, combined with Lexis-Nexis searches of state newspapers going back to 1990. Across
all years in our sample, about 9 percent of students were enrolled in public institutions operating under a
legislative tuition cap or freeze.
We use this tuition regulations to construct two instruments for price. The rst, TuitCapi,t, equals one if
institution i is subject to a cap or freeze in year t. The second, TuitMaxi,t, equals the maximum percentage
increase allowed by the state legislature between years t − 1 and t for institution i. For example, this
variable equals zero for institutions subject to tuition freezes, and 0.1 for institutions where tuition growth
is constrained to no more than 10 percent. We include both of these variables in our estimating equations
and code TuitMaxi,t to zero for cases where TuitCapi,t = 0. The combination allows us to exploit variation
in both the existence and intensity of tuition cap legislation. Appendix Figures A2 and A3 show an absence
of dierential pre-trends between institutions that are and are not subject to tuition regulations, suggesting
that these variables provide a clean experiment for tuition prices.
We use the budget shock and price cap variables as instruments in a two-stage least squares (2SLS) system
estimated in rst dierences, with changes in log spending and tuition treated as endogenous explanatory
variables. The rst stage equation for log spending is:
4 log spendi,t = φs(i) + ωt + ∆W ′i,tλ+ π14Zi,t + π24TuitCapi,t + π34TuitMaxi,t + ηi,t. (3)
9

This equation relates the change in spending relative to the previous year to changes in the budget shock
and tuition cap instruments, controlling for state and year xed eects and changes in covariates. The rst
stage equation for changes in tuition replaces the change in log spending with the change in log tuition on
the left-hand side of (3). The second stage equation is:
4Yi,t = Φs(i) + Ωt + ∆W ′i,tΛ + β1 ∆ log spendi,t + β2 ∆ log tuitioni,t + εi,t, (4)
where ∆ log spendi,t and ∆ log tuitioni,t are predicted changes in log spending and log tuition from the rst
stage. Relative to the xed eects specication in equation (1), these rst-dierenced models focus on sharp
yearly changes in budget shocks, tuition regulations, and outcomes. Appendix Table A4 shows that we
obtain similar results from a variety of dierent methods of controlling for changes in outcomes over time.7
Columns (1) and (2) of Table 1 report rst-stage impacts of the budget shock and tuition cap instruments
on log spending and log tuition. Consistent with the event studies in Figure 4, the budget shock signicantly
increases spending and reduces tuition. Column (2) shows that the tuition regulation instruments have bite:
a tuition freeze lowers in-state tuition by about 3 percent. Moreover, the stringency of the cap strongly
predicts the size of the tuition change. A ten percentage point increase in maximum tuition growth leads to
a 3 percent increase in tuition. Angrist and Pischke (2009) partial F -statistics indicate that the instruments
generate substantial independent variation in log tuition and log spending.
The second-stage estimates show that state budget shocks aect enrollment and degree completion pri-
marily through spending. Column (3) of Table 1 reveals that a 10 percent increase in log spending increases
current-year enrollment by 3 percent, and this estimate is statistically signicant at the 5 percent level.
Columns (4) and (5) show that spending has a limited contemporaneous eect on degree completion but
a large positive eect in the following year, a pattern that is similar to the reduced form eects of budget
shocks shown in Figure 3. In contrast, the estimated elasticities with respect to tuition are close to zero and
statistically insignicant in each model. Importantly, these null results for tuition hold despite the strong
rst stage predictive power of the instruments shown in column 2.
These results should not be interpreted as showing that tuition prices have no impact on educational
attainment. Our estimates correspond to changes in sticker-price tuition for a particular set of schools
subject to tuition regulations, and previous evidence establishes that tuition and nancial aid aect choices
in a variety of settings (Deming and Dynarski, 2010; Denning, 2017; Denning et al., 2017). Moreover, we
cannot reject tuition elasticities on the order of -0.17 for enrollment and -0.13 for degree completion, which
are in the range reported in the previous literature (see, e.g., Hemelt and Marcotte, 2011). Nonetheless, the
estimates in Table 1 suggest that the large reduced form impacts of state budget shocks described in Section
3 are driven by changes in spending rather than tuition prices.
7Additionally, Appendix Table A5 shows that we nd similar results in 2SLS models when we ignore endogeneity concernsand replace the change in the budget shock with the change in actual state appropriations.
10

4.2 Other Results and Discussion
Our ndings can help explain several trends and stylized facts in U.S. higher education. The results suggest
a causal link between sharp declines in state funding in the last twenty years and increases in time to degree
and decreases in college completion rates over the same period (Turner, 2004; Bound et al., 2010, 2012).
Our results are consistent with the broad trend of informal capacity constraints in public institutions,
including reduced course oerings, long waitlists, little or no student guidance, and larger class sizes (Bahr
et al., 2013). Bound and Turner (2007) argue that informal capacity constraints caused by cohort crowding
dilute college quality, while Bound et al. (2010) argue that resources per student and other supply side
factors explain a large portion of the decline in college completion rates between 1972 and 1992. Bound
et al. (2012) assemble qualitative evidence from 12 states which suggests that inadequate student advising,
decreased course availability and overcrowding have contributed to recent increases in time to degree in public
universities. Unfortunately, IPEDS data do not contain information about course waitlists or student advising
loads. However, Appendix Table A7 shows that state budget shocks generate disproportionate increases in
academic support spending compared to other spending categories. Taken together, these ndings are
consistent with the importance of academic support resources for degree attainment.
A key question is whether changes in state support for public institutions generates spillover impacts on
other nearby institutions. Our estimates could reect movement of students across institutions rather than
net changes in enrollment and degree receipt in response to funding shocks. Appendix Tables A8 and A9
investigate spillovers on private and public institutions by relating changes in outcomes to the (enrollment-
weighted) average budget shock for all public institutions in the same county. Table A8 suggests that
spillovers for private institutions are limited: while there is some evidence of a contemporaneous eect on
private enrollment, estimates for later years yields spillover eects that are near zero and sometimes in the
wrong direction. The estimates using county-level spending shocks for public institutions in Table A9 are
very similar to our main results, although somewhat larger in magnitude. This suggests that our ndings
are not driven by students sorting across nearby public institutions in response to funding shocks.
While it is easy to understand how price changes could aect student enrollment choices, the impact
of spending is less obvious. One possibility is that students observe spending increases through smaller
classes, increased course oerings or other amenities, and make matriculation decisions accordingly. This
seems unlikely to be the main explanation for our results, for two reasons. First, Appendix Table A10 shows
positive and statistically signicant impacts on bachelor's degrees in the second and third years following a
budget shock. Since median time to bachelor's degree completion in the U.S. is about ve years, impacts
in earlier years suggest that the mechanism is persistence among already-enrolled students. Second, in
Appendix Table A11 we present suggestive evidence of larger impacts on enrollment for upper division
students compared to freshmen.
11

5 Conclusion
This paper studies the impact of higher education budget cuts on U.S. postsecondary attainment. Using
exogenous variation in funding driven by dierences across institutions in historical reliance on state appro-
priations, we nd large impacts of budget cuts on enrollment and degree completion. While budget cuts
are sometimes passed on as higher tuition prices, we nd that most of the impact of budget shocks on post-
secondary attainment can be explained by spending cuts (holding prices constant). Our ndings hold for
both two-year and four-year institutions and across all types of postsecondary awards, including bachelor's
degrees.
Over the last two decades, higher education funding and per-student spending have declined in most
states (Baum and Ma 2014). Our results demonstrate a causal connection between budget cuts, higher college
dropout rates, and the slowdown in the growth of postsecondary attainment in U.S. public institutions. Our
ndings also highlight a possible tension between price and spending subsidies for higher education. We
nd that most of the impact of budget cuts can be explained by spending cuts rather than price increases,
yet nearly all Federal subsidies (and an increasing share at the state level) focus on lowering prices through
nancial aid grants and subsidized loans. Policymakers who want to subsidize spending increases rather
than price cuts could provide a matching grant directly to public institutions, similar to the Federal Title I
program for K-12 schooling (see, e.g., Deming, 2017)
We nd that budget cuts have large impacts on core spending categories such as instruction and student
support, and large downstream impacts on postsecondary attainment. Thus contrary to the narrative of
administrative bloat, higher education budget cuts are to the bone. An important caveat is that our results
are identied mostly from variation within non-selective public institutions, where per-student spending is
relatively low and extravagant consumption amenities are rarely found.
12

Figure1
Notes: Thisfiguredisplaysyearlyenrollmentgrowth(left-handpanel)andgrowthinbachelor'sdegreesawarded(right-handpanel)forpublicinstitutionsforfiveyearsbeforeandafteracutinstateappropriationsof15percentormore.Thesampleincludesallpublicinstitutionsthatexperienceda15percentcutinstatesupportinanysingleyearbetween1990and2013.
.04
.03
.02
.01
0-.
01
Perc
ent change in s
tate
-year
public e
nro
llm
ent
-5 0 5
Year of Budget Cut
Event is a One-Year State Appropriations Cut of 15 percent or more
Yearly Percent Change in State Enrollment Around a Budget Cut
.04
.03
.02
.01
0-.
01
Pe
rcen
t ch
an
ge
in
sta
te-y
ea
r p
ub
lic B
As a
wa
rde
d
-5 0 5
Year of Budget Cut
Event is a One-Year State Appropriations Cut of 15 percent or more
Yearly Percent Change in Bachelor's Degrees Awarded Around a Budget Cut

Figure2
Notes: Thisfigurepresentsestimatesand95percentconfidenceintervalsfromregressionsoflogtotalspending(toppanel),logtuition(middlepanel),andlogenrollment(bottompanel)onlagsandleadsofstateappropriationsforpublicinstitutions.Modelsalsocontrolforinstitutionandyearfixedeffects.Standarderrorsareclusteredattheinstitutionlevel.
-.35
0.3
5
-4 -3 -2 -1 0 1 2 3 4 5
Impact of Log State Appropriations on Log Spending
-.1-.0
50
.05
-4 -3 -2 -1 0 1 2 3 4 5
Impact of Log State Appropriations on Log Tuition
-.15
0.1
5
-4 -3 -2 -1 0 1 2 3 4 5Event Time
Impact of Log State Appropriations on Log Enrollment

Figure3
Notes: Thisfigurepresentsestimatesand95percentconfidenceintervalsfromregressionsoflogenrollment(toppanel)andlogtotaldegreesandcertificatesawarded(bottompanel)onlagsandleadsofthestatebudgetshock(theshareofeachinstitution’srevenuefromstateappropriationsin1990timesyearlystateappropriationspercapita,in$1000s).Themodelalsocontrolsforlagsandleadsofcountyandstateunemploymentrates,time-varyingcountyandinstitutioncharacteristics,institutionfixedeffects,yearfixedeffects,andstate-specifictimetrends.Standarderrorsareclusteredattheinstitutionlevel.
-.05
0.0
5
-4 -3 -2 -1 0 1 2 3 4 5
Impact of Budget Shock on Log Total Enrollment
-.05
0.0
5
-4 -3 -2 -1 0 1 2 3 4 5Event Time
Impact of Budget Shock on Log Degrees and Certificates

Figure4
Notes: Thisfigurepresentsestimatesand95percentconfidenceintervalsfromregressionsoflogtotalspending(toppanel)andlogtuition(bottompanel)onlagsandleadsofthestatebudgetshock(theshareofeachinstitution’srevenuefromstateappropriationsin1990timesyearlystateappropriationspercapita,in$1000s).Themodelalsocontrolsforlagsandleadsofcountyandstateunemploymentrates,time-varyingcountyandinstitutioncharacteristics,institutionfixedeffects,yearfixedeffects,andstate-specifictimetrends.Standarderrorsareclusteredattheinstitutionlevel.
-.06
0.0
6
-4 -3 -2 -1 0 1 2 3 4 5
Impact of Budget Shock on Log Spending
-.06
0.0
6
-4 -3 -2 -1 0 1 2 3 4 5Event Time
Impact of Budget Shock on Log Tuition

Logawards: Logawards:Logspending Logtuition Logenrollment currentyear yearT+1
(1) (2) (3) (4) (5)Budgetshockinstrument 0.061*** -0.081***
(0.004) (0.007)
Anytuitioncap 0.001 -0.030***(0.002) (0.003)
Maximumincrease -0.045* 0.304***(0.027) (0.056)
Logtotalspending 0.300** 0.201 0.779**(0.134) (0.259) (0.317)
Logtuition -0.017 0.115 0.226(0.076) (0.151) (0.178)
APpartialF -statistic 26.6 58.2Samplesize 27659 27659 27659 28108 26834
*significantat10-percent;**significantat5-percent;***significantat1-percent
Table1-Two-stageleastsquaresestimatesoftheeffectsoftuitionandspendingonenrollmentanddegreesFirststage
Notes :Thistablereportstwo-stageleastsquaresestimatesoftheeffectsoftuitionandspendingontotalfallenrollmentandlogdegreesandcertificates.Inthefirststageweregresseachinstitution'syearlychangeinlogtotalspendingandlogtuitiononthechangeinthebudgetshockinstrument(theshareofeachinstitution’srevenuefromstateappropriationsin1990timesyearlystateappropriationspercapita,in$1000s),thechangeinanindicatorforwhetheratuitioncapisinplaceinthecurrentstateandyear,andthechangeinthemaximumpercentageincreaseallowedunderthecap(settozerowhennocapisinplace).Thesecondstageregressesyearlychangesinoutcomesonpredictedchangesintuitionandspendingfromthefirststage.Columns(1)and(2)reportfirststageresultsinthesamplewithobservedenrollment.Columns(3)-(5)reportsecond-stageestimatesforlogenrollment,logtotaldegreesandcertificatesawardedinthecurrentyear,andlogdegreesandcertificatesthefollowingyear.Bothstagescontrolfortime-varyingcountydemographicandeconomiccovariates,time-invariantinstitutioncharacteristics,yeareffects,andstatefixedeffects.Standarderrors,clusteredattheinstitutionlevel,areinparentheses.
Secondstage

References
Angrist, J., D. Lang, and P. Oreopoulos (2009): Incentives and services for college achievement:
evidence from a randomized trial, American Economic Journal: Applied Economics, 1, 136163.
Angrist, J. D. and J.-S. Pischke (2009): Mostly Harmless Econometrics, Princeton, NJ: Princeton
University Press.
Autor, D. H. (2014): Skills, education, and the rise of earnings inequality among the other 99 percent,
Science, 344, 843851.
Autor, D. H., D. Dorn, and G. H. Hanson (2013): The China syndrome: local labor market eects
of import competition in the United States, American Economic Review, 103, 21212168.
Bahr, P. R., J. L. Gross, K. E. Slay, and R. D. Christensen (2013): First in line: student regis-
tration priority in community colleges, Educational Policy, 29, 342374.
Barr, A. and S. E. Turner (2013): Expanding enrollments and contracting state budgets: the eect
of the great recession on higher education, The Annals of the American Academy of Political and Social
Science, 650, 168193.
Barrow, L., L. Richburg-Hayes, C. E. Rouse, and T. Brock (2014): Paying for performance: the
education impacts of a community college scholarship program for low-income adults, Journal of Labor
Economics, 32, 563599.
Bartik, T. J. (1991): Who Benets from State and Local Economic Development Policies?, Kalamazoo,
MI: W. E. Upjohn Institute for Employment Research.
Baum, S. and J. Ma (2014): Trends in college pricing, College Board, Trends in Higher Education Series.
Bettinger, E. and R. Baker (2011): The eects of student coaching in college: An evaluation of a
randomized experiment in student mentoring, Tech. rep., National Bureau of Economic Research.
Bettinger, E. P. and B. T. Long (2009): Addressing the needs of underprepared students in higher
education: does college remediation work? Journal of Human Resources, 44, 736771.
Blanchard, O. and L. Katz (1992): Regional evolutions, Brookings Papers on Economic Activity, 23,
176.
Bound, J., M. F. Lovenheim, and S. Turner (2010): Why have college completion rates declined? An
analysis of changing student preparation and collegiate resources, American Economic Journal: Applied
Economics, 2, 12957.
(2012): Increasing time to baccalaureate degree in the United States, Education Finance and Policy,
7, 375424.
18

Bound, J. and S. Turner (2007): Cohort crowding: how resources aect collegiate attainment, Journal
of Public Economics, 91, 877899.
Card, D. (2001): Immigrant inows, native outows, and the local market impacts of higher immigration,
Journal of Labor Economics, 19, 2264.
Card, D. and A. B. Krueger (1992): Does school quality matter? Returns to education and character-
istics of public schools in the United States, The Journal of Political Economy, 100, 140.
Chetty, R., J. N. Friedman, E. Saez, N. Turner, and D. Yagan (2017): Mobility report cards: the
role of colleges in intergenerational mobility, Working paper.
Delaney, J. A. and W. R. Doyle (2011): State spending on higher education: testing the balance wheel
over time, Journal of Education Finance, 36, 343368.
Deming, D. and S. Dynarski (2010): College aid, in Targeting Investments in Children: Fighting
Poverty When Resources are Limited, ed. by P. B. Levine and D. J. Zimmerman, Chicago, IL: University
of Chicago Press, chap. 10, 283302.
Deming, D. J. (2017): Increasing college completion with a federal higher education matching grant, The
Hamilton Project, Policy Proposal 2017-03.
Denning, J. T. (2017): College on the cheap: Consequences of community college tuition reductions,
American Economic Journal: Economic Policy, 9, 15588.
Denning, J. T., B. M. Marx, and L. J. Turner (2017): ProPelled: The Eects of Grants on Gradua-
tion, Earnings, and Welfare, Tech. rep., National Bureau of Economic Research.
Ehrenberg, R. G. (2012): American higher education in transition, The Journal of Economic Perspec-
tives, 26, 193216.
Gennaioli, N., R. L. Porta, F. L. de Silanes, and A. Shleifer (2013): Human capital and regional
development, Quarterly Journal of Economics, 128, 105164.
Ginsberg, B. (2011): The Fall of the Faculty, Oxford University Press.
Hanushek, E. A., J. Ruhose, and L. Woessmann (forthcoming): Knowledge capital and aggregate
income dierences: development accounting for US states, American Economic Journal: Macroeconomics.
Hanushek, E. A. and L. Woessmann (2008): The role of cognitive skills in economic development,
Journal of Economic Literature, 46, 607668.
Hemelt, S. W. and D. E. Marcotte (2011): The impact of tuition increases on enrollment at public
colleges and universities, Educational Evaluation and Policy Analysis, 33, 435457.
19

Jackson, C. K., R. C. Johnson, and C. Persico (2016): The eects of school spending on educational
and economic outcomes: evidence from school nance reforms, Quarterly Journal of Economics, 131,
157218.
Jacob, B., B. McCall, and K. M. Stange (2013): College as country club: do colleges cater to students'
preferences for consumption? NBER working paper no. 18745.
Kane, T. J., P. Orszag, and D. L. Gunter (2003): State scal constraints and higher education
spending: the role of Medicaid and the business cycle, Urban Institute Discussion Paper no. 11.
Lafortune, J., J. Rothstein, and D. W. Schanzenbach (2016): School nance reform and the
distribution of student achievement, Working paper.
OECD (2013): OECD Skills Outlook 2013: First Results from the Survey of Adult Skills,
http://dx.doi.org/10.1787/9789264204256-en.
Parmley, K., A. Bell, H. L'Orange, and P. Lingenfelter (2009): State budgeting for higher
education in the united states, Report, State Higher Education Executive Ocers.
Turner, S. (2004): Going to college and nishing college: explaining dierent educational outcomes, in
College Choices: The Economics of Where to Go, When to Go, and How to Pay for it, ed. by C. M.
Hoxby, Chicago, IL: University of Chicago Press, chap. 1, 1362.
20

FigureA1
Notes: Thisfiguredisplayslevelsofenrollment(left-handpanel)andebachelor'sdegreesawarded(right-handpanel)forpublicinstitutionsforfiveyearsbeforeandafteracutinstateappropriationsof15percentormore.Thesampleincludesallpublicinstitutionsthatexperienceda15percentcutinstatesupportinanysingleyearbetween1990and2013.
2.25
milli
on2.
5 m
illion
2.75
milli
on
−5 0 5Event is a One−Year State Appropriations Cut of 15 Percent or More
State−Year Enrollment Around a Budget Cut
170
thou
sand
190
thou
sand
210
thou
sand
−5 0 5Year of Budget Cut
Event is a One−Year State Appropriations Cut of 15 Percent or More
State−Year Bachelor’s Degrees Awarded Around a Budget Cut

FigureA2
Notes: Thisfigurepresentsestimatesand95percentconfidenceintervalsfromaregressionoflogenrollmentonlagsandleadsoftuitionregulationvariables.Thetoppanelshowscoefficientsonanindicatorforwhetheranytuitioncapisinplace,andthebottompanelshowscoefficientsonthemaximumpercentageincreaseallowedunderthecap,codedtozerowhennocapisinplace.Themodelalsocontrolsforlagsandleadsofcountyandstateunemploymentrates,time-varyingcountyandinstitutioncharacteristics,institutionfixedeffects,yearfixedeffects,andstate-specifictimetrends.Standarderrorsareclusteredattheinstitutionlevel.
-.02
0.0
2
-4 -3 -2 -1 0 1 2 3 4 5
Impact of Any Tuition Cap on Log Total Enrollment
-.30
.3
-4 -3 -2 -1 0 1 2 3 4 5Event Time
Impact of Level of Tuition Cap on Log Total Enrollment

FigureA3
Notes: Thisfigurepresentsestimatesand95percentconfidenceintervalsfromaregressionoflogtotaldegreesandcertificatesawardedonlagsandleadsoftuitionregulationvariables.Thetoppanelshowscoefficientsonanindicatorforwhetheranytuitioncapisinplace,andthebottompanelshowscoefficientsonthemaximumpercentageincreaseallowedunderthecap,codedtozerowhennocapisinplace.Themodelalsocontrolsforlagsandleadsofcountyandstateunemploymentrates,time-varyingcountyandinstitutioncharacteristics,institutionfixedeffects,yearfixedeffects,andstate-specifictimetrends.Standarderrorsareclusteredattheinstitutionlevel.
-.03
0.0
3
-4 -3 -2 -1 0 1 2 3 4 5
Impact of Any Tuition Cap on Log Degrees and Certificates
-.40
.4
-4 -3 -2 -1 0 1 2 3 4 5Event Time
Impact of Level of Tuition Cap on Log Degrees and Certificates

Selective,fouryear
Nonselective,fouryear Twoyear
Selective,fouryear
Nonselective,fouryear Twoyear
(1) (2) (3) (4) (5) (6)Tuitionandfees 4,978 3,267 1,027 15,953 8,418 2,381Stateappropriations 13,695 8,108 2,549 8,626 5,290 1,890Localappropriations 45 105 1,013 0 108 1,455Totalgrants 1,676 1,111 496 5,594 3,462 1,990
Instructionalspending 11,142 6,472 2,606 15,738 7,491 3,007Academicsupport 1,593 726 230 4,630 1,700 536Studentservices 742 387 257 1,930 1,093 647Administration 1,279 746 407 3,230 1,703 950Scholarships 902 559 258 1,753 1,070 836Totalspending 31,946 16,147 5,672 45,584 20,172 7,441
Enrollment 21,278 9,306 3,626 25,865 11,752 5,451Institutioncount 36 549 1,383 35 633 1,224
TableA1-Descriptivestatistics1990 2013
Notes: Table1presentsaverageenrollmentandfinancialstatisticsforU.S.publicinstitutions.Dataare fromtheIntegratedPostsecondaryEducationDataSystem(IPEDS)for1990and2013.Selectivecollegesarerankedas"MostCompetitive"or"HighlyCompetitive"bythe2009Barron'sProfileofAmericanColleges.Thecolumn"TwoYear"alsocontainsasmallnumberofpublicinstitutionsthatofferonlylessthantwoyearcredentials.Thefirstfiverowspresentcategoriesofinstitutionalrevenue.Thenextthreerowspresentcategoriesofinstitutionalspending,andthelasttworowsaretotalFallenrollmentandthenumberofinstitutionsineachcategoryrespectively.Allfinancialfiguresarein2013dollars.TotalgrantsincludesFederalsourcessuchasthePellgrant,aswellasstatemeritaidandprivatescholarships.Thesampleforcolumns(4)-(6)isrestrictedtoinstitutionsopenin1990.
All Twoyear Fouryear(1) (2) (3)
Twoyear -0.457***(0.107)
Selective -0.667***(0.124)
Asashareoftotalspending:Tuitionandfees 0.134*** -0.018 0.276***
(0.029) (0.040) (0.060)Stateappropriations 0.605*** 0.472*** 0.628***
(0.029) (0.052) (0.043)Localappropriations -0.399*** -0.337*** -0.031*
(0.034) (0.055) (0.018)Totalgrants 0.040*** 0.028 0.151***
(0.015) (0.018) (0.030)Instructionalspending 0.067*** 0.062*** 0.156***
(0.016) (0.020) (0.030)Academicsupport 0.022*** 0.011 0.021
(0.006) (0.008) (0.014)Studentservices 0.012* 0.002 0.050***
(0.007) (0.008) (0.018)Administration -0.012 -0.030*** 0.055***
(0.009) (0.010) (0.019)Scholarships 0.013* 0.017* 0.069***
(0.008) (0.010) (0.013)
Logtotalspending -0.612*** -0.204 -2.884***(0.203) (0.130) (0.381)
Logenrollment -0.322 -0.572* -0.699(0.242) (0.342) (0.455)
Samplesize 30072 17568 12504
*significantat10-percent;**significantat5-percent;***significantat1-percent
TableA2-Correlatesofrelianceonstateappropriations
Notes: Thistabledescribesrelationshipsbetweenpublicinstitutioncharacteristicsandrelianceonstateappropriations,definedastheshareofeachinstitution’srevenuefromstateappropriationsin1990.Eachrowshowsthecoefficientfromaregressionofacharacteristiconthismeasureofrelianceusingdatafrom1991-2013,controllingforstateeffectsandyeareffects.Column(1)showsresultsforallpublicinstitutions,column(2)showsresultsfortwoyearinstitutions,andcolumn(3)showsresultsforfouryearinstitutions.Standarderrors,clusteredattheinstitutionlevel,areinparentheses.

TableA3-Listoftuitioncapsandfreezesbystate,1990-20131990 1991 1992 1993 1994 1995 1996 1997 1998 1999 2000 2001 2002 2003 2004 2005 2006 2007 2008 2009 2010 2011 2012 2013
Alabama2 -- -- -- -- -- -- -- -- -- -- -- -- -- -- -- -- 0 0 0 0 0 -- -- --Alaska -- -- -- -- -- -- -- -- -- -- -- -- -- -- -- -- -- -- -- -- -- -- -- --Arizona -- -- -- -- -- -- -- -- -- -- -- -- -- -- -- -- -- -- -- -- -- -- -- --Arkansas -- -- -- -- -- -- -- -- -- -- -- -- -- -- -- -- -- -- -- -- -- -- -- --California -- -- -- -- -- -- -- -- -- -- -- -- -- -- -- -- -- -- -- -- -- -- -- --Colorado -- -- -- -- -- -- -- -- -- -- -- -- -- -- -- -- -- -- -- -- -- -- -- --Connecticut1 -- -- -- -- -- -- -- -- -- -- 0 -- -- -- -- -- -- -- -- -- -- -- 0 --Delaware -- -- -- -- -- -- -- -- -- -- -- -- -- -- -- -- -- -- -- -- -- -- -- --Florida -- -- -- -- -- 0 -- -- -- -- -- -- -- -- -- -- -- -- 0 -- -- -- -- --Georgia -- -- -- -- -- -- -- -- -- -- -- -- -- -- -- -- -- -- -- -- -- -- -- --Hawaii -- -- -- -- -- -- -- -- -- -- -- -- -- -- -- -- -- -- -- -- -- -- -- --Idaho -- -- -- -- -- -- -- -- -- -- -- -- -- 0.1 0.1 0.1 0.1 0.1 0.1 0.1 0.1 -- 0.1 0.1Illinois -- -- -- -- -- -- -- -- -- -- -- -- -- -- -- -- -- -- -- -- -- -- -- --Indiana -- -- -- -- -- -- -- -- -- -- -- -- -- -- -- -- -- -- -- -- -- -- -- --Iowa -- -- -- -- -- -- -- -- -- -- -- -- -- -- -- -- -- -- -- -- -- -- -- --Kansas -- -- -- -- -- -- -- -- -- -- -- -- -- -- -- -- -- -- -- -- -- -- -- --Kentucky -- -- -- -- -- -- -- -- -- -- -- -- -- -- -- -- -- -- -- -- -- -- -- --Louisiana -- -- -- -- -- -- -- -- -- -- -- -- -- -- -- -- -- -- -- -- -- -- -- --Maine2 -- -- -- -- -- -- -- -- -- -- 0 0 0 0 0 0 -- -- -- -- -- 0 -- 0Maryland1 -- -- -- -- -- -- -- -- 0.04 0.04 0.04 0.04 0.04 -- -- -- -- 0 0 0 0 0.03 0.03 0.03Massachusetts -- -- -- -- -- -- -- -- -- -- -- -- -- -- -- -- -- -- -- -- -- -- -- --Michigan -- -- -- -- -- -- -- -- -- -- -- -- -- -- -- -- -- -- -- -- -- -- -- --Minnesota -- -- -- -- -- -- -- -- -- -- -- -- -- -- -- -- -- -- -- -- -- -- -- --Mississippi -- -- -- -- -- -- -- -- -- -- -- -- -- -- -- -- -- -- -- -- -- -- -- --Missouri1 -- -- -- -- -- -- -- -- -- -- -- -- -- -- -- -- -- -- -- -- 0 0 -- --Montana -- -- -- -- -- -- -- -- -- -- -- -- -- -- -- -- -- -- 0 0 -- -- -- --Nebraska -- -- -- -- -- -- -- -- -- -- -- -- -- -- -- -- -- -- -- -- -- -- -- --Nevada -- -- -- -- -- -- -- -- -- -- -- -- -- -- -- -- -- -- -- -- -- -- -- --NewHampshire2 -- -- -- -- -- -- -- -- -- -- -- -- -- -- -- -- -- 0 -- 0 -- -- -- 0NewJersey1 -- -- -- -- -- -- -- -- -- -- -- -- -- -- 0.09 0.08 0.08 0.08 -- -- 0.03 0.04 -- --NewMexico -- -- -- -- -- -- -- -- -- -- -- -- -- -- -- -- -- -- -- -- -- -- -- --NewYork3 -- -- -- -- 0 0 -- 0 0 0 0 0 0 0 -- 0 0 0 0 0 -- -- -- --NorthCarolina1 -- -- -- -- -- -- -- -- -- -- -- -- -- -- -- -- 0 -- -- 0 -- -- 0.065 --NorthDakota -- -- -- -- -- -- -- -- -- -- -- -- -- -- -- -- -- -- -- -- -- -- -- --Ohio -- -- -- -- 0.06 0.06 0.06 0.06 0.06 0.06 0.06 0.06 0.06 -- -- -- 0.06 0.06 0.035 0.035 0.035 0.035 0.035 0.035Oklahoma4 -- -- -- -- -- -- -- -- -- -- -- -- 0.07 0.07 -- -- -- -- -- -- 0 -- -- --Oregon1 -- -- -- -- -- -- -- -- 0 0 0 0 -- -- -- -- 0.03 0.03 -- -- -- -- -- --Pennsylvania -- -- -- -- -- -- -- -- -- -- -- -- -- -- -- -- -- -- -- -- -- -- -- --RhodeIsland -- -- -- -- -- -- -- -- -- -- -- -- -- -- -- -- -- -- -- -- -- -- -- --SouthCarolina -- -- -- -- -- -- -- -- -- -- -- -- -- -- -- -- -- -- -- -- -- -- -- --SouthDakota -- -- -- -- -- -- -- -- -- -- -- -- -- -- -- -- -- -- -- -- -- -- -- --Tennessee -- -- -- -- -- -- -- -- -- -- -- -- -- -- -- -- -- -- -- -- -- -- -- --Texas -- -- -- -- -- -- -- -- -- -- -- -- -- -- -- -- -- -- -- -- -- -- -- --Utah -- -- -- -- -- -- -- -- -- -- -- -- -- -- -- -- -- -- -- -- -- -- -- --Vermont -- -- -- -- -- -- -- -- -- -- -- -- -- -- -- -- -- -- -- -- -- -- -- --Virginia -- -- -- -- -- 0.03 0.03 0 0 0 -0.2 0 0 -- -- -- -- -- 0.06 0.04 -- -- -- --Washington -- -- -- -- -- -- -- -- -- -- -- -- -- -- -- -- -- -- -- -- -- -- -- --WestVirginia -- -- -- -- -- -- -- -- -- -- -- -- -- -- -- -- -- -- -- -- -- -- -- --Wisconsin1 -- -- -- -- -- -- -- -- -- -- -- 0 -- 0.08 -- -- -- -- -- -- -- -- 0.055 0.055Wyoming -- -- -- -- -- -- -- -- -- -- -- -- -- -- -- -- -- -- -- -- -- -- -- --Notes :Thistablelistsstatesandyearswherestatelegislaturesimposein-statetuitioncapsandfreezesatpublicinstitutions.Wecompiledthesedatabyreferencingofficialsourceswhenavailable,combinedwithLexis-Nexissearchesofstatenewspapersgoingbackto1990.Insomecaseswecheckedactualtuitiondatatoconfirmtheimpositionofacap,althoughinnocasedidwecodeatuitioncaporfreezeunlessitcouldbeindependentlyverified.1-Appliesonlytofour-yearinstitutionsinthestate.2-Appliesonlytotwo-yearinstitutionsinthestate.3-AppliesonlytoCUNY(except2003)andCornell(allyears).4-AppliestoallinstitutionsexcepttheOklahomaTechnologyCenters.

TableA4-Alternativestate-by-timecontrolsLogSpending LogTuition
(1) (2)Changes,stateeffects 0.300** -0.017(baselinemodel) (0.134) (0.076)
Changes,statetrends 0.268 -0.037(0.166) (0.080)
Changes,state-by-four-yeareffects 0.244 -0.046(0.158) (0.081)
Changes,institutioneffects 0.330** -0.014(0.145) (0.075)
Levels,institutioneffects 0.417*** -0.051(0.081) (0.164)
Levels,institutioneffects 0.380*** -0.111andstatetrends (0.124) (0.104)
Levels,institutioneffects 0.287 -0.160andstate-by-four-yeareffects (0.274) (0.212)
Samplesize
*significantat10-percent;**significantat5-percent;***significantat1-percent
Outcomeislogenrollment
27659
Notes :Thistablereportstwo-stageleastsquaresestimatesoftheeffectsoftuitionandspendingonlogtotalfallenrollmentwithalternativecontrolsforstate-by-timevariationinoutcomes."Changes"specificationsusetheyearlychangeinlogenrollmentasthedependentvariableandchangesinlogtuitionandlogspendingastheendogenousregressors,instrumentingwiththechangeinthebudgetshockinstrument,thechangeinwhetheratuitioncapisinplace,andthechangeinthemaximumpercentageincreaseallowedunderthecap(settozerowhennocapisinplace)."Levels"specificationsuselogenrollmentasthedependentvariable,logtuitionandlogspendingasendogenousregressors,andthebudgetshock,presenceofatutioncap,andlevelofthecapasinstruments."Changes"modelscontrolfortime-varyingcountydemographicandeconomiccovariates,time-invariantinstitutioncharacteristics,andyeareffects,while"levels"modelscontrolsfortime-varyingcountydemographicandeconomiccovariates,institutioncharacteristicsinteractedwithatimetrend,andyeareffects.Standarderrors,clusteredattheinstitutionlevel,areinparentheses.

TableA5-2SLSestimatesoftheeffectsofspendingandtuitionbasedonappropriations
Currentyear T+1 T+2 T+3PanelA:logenrollment (1) (2) (3) (4)Logtotalspending 0.331*** 0.563*** 0.480*** 0.344***
(0.095) (0.079) (0.080) (0.064)Logtuition -0.021 0.030 -0.031 -0.139
(0.064) (0.077) (0.087) (0.095)Samplesize 28197 26958 25687 24422
PanelB:logtotalawardsLogtotalspending 0.473*** 0.666*** 0.514*** 0.483***
(0.123) (0.120) (0.119) (0.104)Logtuition 0.153 0.207 0.111 -0.041
(0.131) (0.146) (0.146) (0.149)Samplesize 28108 26834 25564 24304
*significantat10-percent;**significantat5-percent;***significantat1-percent
Notes :Thistablereportstwo-stageleastsquaresestimatesoftheeffectsoftuitionandspendingontotalenrollmentandlogtotalawardsusingactualappropriationsratherthanthebudgetshocktoinstrumentforspending.Inthefirststageweregresseachinstitution'syearlychangeinlogspendingandlogtuitiononthechangeintheiractuallogappropriations,thechangeinanindicatorforwhetheratuitioncapisinplaceinthecurrentstateandyear,andthechangeinthemaximumpercentageincreaseallowedunderthecap(settozerowhennocapisinplace).Thesecondstageregresseseachinstitution'syearlychangesinoutcomesonpredictedchangesinlogspendingandtuitionfromthefirststage.PanelAreportsresultsforlogenrollment,andPanelBreportsresultsforlogtotalawards.Bothstagesalsocontrolfortime-varyingcountydemographicandeconomiccovariates,time-invariantinstitutioncharacteristicssuchassector,selectivityandhighestdegreeoffered,yearfixedeffects,andstatefixedeffects.Standarderrors,clusteredattheinstitutionlevel,areinparentheses.

TableA6-Two-stageleastsquaresestimatesbyyearandinstitutiontypeCurrentyear T+1 T+2 T+3
(1) (2) (3) (4)PanelA:allinstitutionsLogtotalspending 0.304** 0.796*** 0.845*** 0.830***
(0.131) (0.181) (0.207) (0.207)Logtuition -0.016 0.066 0.031 -0.073
(0.072) (0.100) (0.118) (0.123)
SampleSize 28197 26958 25687 24422
PanelB:two-yearinstitutionsLogtotalspending 0.283 1.020*** 1.052*** 0.951***
(0.253) (0.315) (0.371) (0.345)Logtuition -0.083 0.097 0.087 -0.100
(0.133) (0.169) (0.201) (0.204)
SampleSize 16800 16109 15389 14664
PanelC:four-yearinstitutionsLogtotalspending 0.239*** 0.472*** 0.662*** 0.574***
(0.081) (0.129) (0.164) (0.182)Logtuition 0.005 -0.039 -0.046 -0.127
(0.060) (0.085) (0.111) (0.116)
Samplesize 11397 10849 10298 9758
*significantat10-percent;**significantat5-percent;***significantat1-percent
Notes :Thistablereportstwo-stageleastsquaresestimatesoftheeffectsoftuitionandspendingonlogtotalfallenrollmentbyyearandtypeofpublicinstitution.Inthefirststageweregresseachinstitution'syearlychangeinlogtotalspendingandlogtuitiononthechangeinthebudgetshockinstrument(theshareofeachinstitution’srevenuefromstateappropriationsin1990timesyearlystateappropriationspercapita),thechangeinanindicatorforwhetheratuitioncapisinplaceinthecurrentstateandyear,andthechangeinthemaximumpercentageincreaseallowedunderthecap(settozerowhennocapisinplace).Thesecondstageregresseseachinstitution'syearlychangeinlogenrollmentonthechangesintuitionandspendingfromthefirststage.PanelAreportsresultsforallinstitutions,whilePanelsBandCshowresultsfortwo-yearandfour-yearinstitutionsrespectively.Bothstagesalsocontrolfortime-varyingcountydemographicandeconomiccovariates,time-invariantinstitutioncharacteristics,yeareffects,andstatefixedeffects.Standarderrors,clusteredattheinstitutionlevel,areinparentheses.

TableA7-2SLSestimatesoftheimpactsoftuitionandspendingonspendingandrevenuecategories
Scholarshipaid PellGrantaid Totalaid Instruction Academicsupport Studentservices(1) (2) (3) (4) (5) (6)
PanelA:allinstitutionsLogtotalspending 0.287 -0.389* 0.053 0.974*** 1.716*** 1.043***
(0.687) (0.227) (0.347) (0.124) (0.378) (0.252)Logtuition -0.536 -0.195 -0.143 -0.037 0.364 0.019
(0.460) (0.131) (0.200) (0.075) (0.233) (0.137)Samplesize 27634 27795 28135 28204 28126 28164
PanelB:two-yearinstitutionsLogtotalspending -0.117 -0.466 0.159 0.958*** 1.180* 1.076***
(0.964) (0.410) (0.418) (0.195) (0.689) (0.391)Logtuition -0.737 -0.153 -0.097 -0.027 0.163 0.111
(0.593) (0.223) (0.190) (0.106) (0.400) (0.210)Samplesize 16337 16502 16746 16812 16741 16774
PanelC:four-yearinstitutionsLogtotalspending 1.320** -0.160 0.298 0.920*** 1.685*** 1.166***
(0.624) (0.184) (0.333) (0.110) (0.286) (0.271)Logtuition -0.101 -0.296** -0.076 -0.102 0.153 0.036
(0.525) (0.127) (0.265) (0.086) (0.215) (0.157)Samplesize 11297 11293 11389 11392 11385 11390
*significantat10-percent;**significantat5-percent;***significantat1-percent
Financialaid Spendingcategories
Notes :Thistablereportstwo-stageleastsquaresestimatesoftheeffectsoftuitionandspendingoninstitutionalscholarshipaid,Pellgrantaid,andcategoriesofspending.Inthefirststageweregresseachinstitution'syearlychangeinlogtotalspendingandlogtuitiononthechangeinthebudgetshockinstrument(theshareofeachinstitution’srevenuefromstateappropriationsin1990timesyearlystateappropriationspercapita),thechangeinanindicatorforwhetheratuitioncapisinplaceinthecurrentstateandyear,andthechangeinthemaximumpercentageincreaseallowedunderthecap(settozerowhennocapisinplace).Thesecondstageregresseseachinstitution'syearlychangeineachspendingcategoryonthechangesintuitionandspendingfromthefirststage.PanelAreportsallpublicinstitutions,whilePanelsBandCreportresultsfortwo-yearandfour-yearinstitutions.Bothstagesalsocontrolfortime-varyingcountydemographicandeconomiccovariates,time-invariantinstitutioncharacteristicssuchassector,selectivityandhighestdegreeoffered,yearfixedeffects,andstatefixedeffects.Standarderrors,clusteredattheinstitutionlevel,areinparentheses.

TableA8-SpilloverimpactsofpublicbudgetshocksonoutcomesinprivateinstitutionsPanelA:logenrollment Currentyear T+1 T+2 T+3
(1) (2) (3) (4)Countyaveragebudgetshock -0.025* -0.011 0.000 -0.027
(0.014) (0.018) (0.022) (0.024)Anytuitioncap -0.002 -0.003 -0.013 -0.020**
(0.006) (0.008) (0.008) (0.009)Samplesize 55962 50018 44742 39855
PanelB:logtotalawardsCountyaveragebudgetshock -0.011 -0.049** -0.041 -0.034
(0.018) (0.021) (0.026) (0.027)Anytuitioncap 0.002 -0.001 -0.015* -0.016*
(0.007) (0.009) (0.009) (0.009)Samplesize 51066 45689 40865 36398
PanelC:logtuitionCountyaveragebudgetshock 0.003 0.007 0.009 0.020
(0.008) (0.010) (0.011) (0.012)Anytuitioncap 0.002 -0.001 0.003 -0.001
(0.003) (0.003) (0.004) (0.004)SampleSize 48794 43733 39353 35009
*significantat10-percent;**significantat5-percent;***significantat1-percent
Notes :Thistablereportsreducedformestimatesoftheimpactsofthechangeintheaverageenrollment-weightedbudgetshockinstrument(theshareofeachinstitution’srevenuefromstateappropriationsin1990timesyearlystateappropriationspercapita)acrosspublicinstitutionsinacountyandthechangeinanindicatorforwhetheranytuitioncapisinplaceinthecurrentstateandyearonthechangeinoutcomesinprivate(not-for-profitandfor-profit)institutionsinthesamecounty.PanelsA,B,andCreportresultsforlogenrollment,logtotalawards,andlogtuition.Theregressionsalsocontrolfortime-varyingcountydemographicandeconomiccovariates,time-invariantinstitutioncharacteristicssuchassector,selectivityandhighestdegreeoffered,yearfixedeffects,andstatefixedeffects.Standarderrors,clusteredattheinstitutionlevel,areinparentheses.
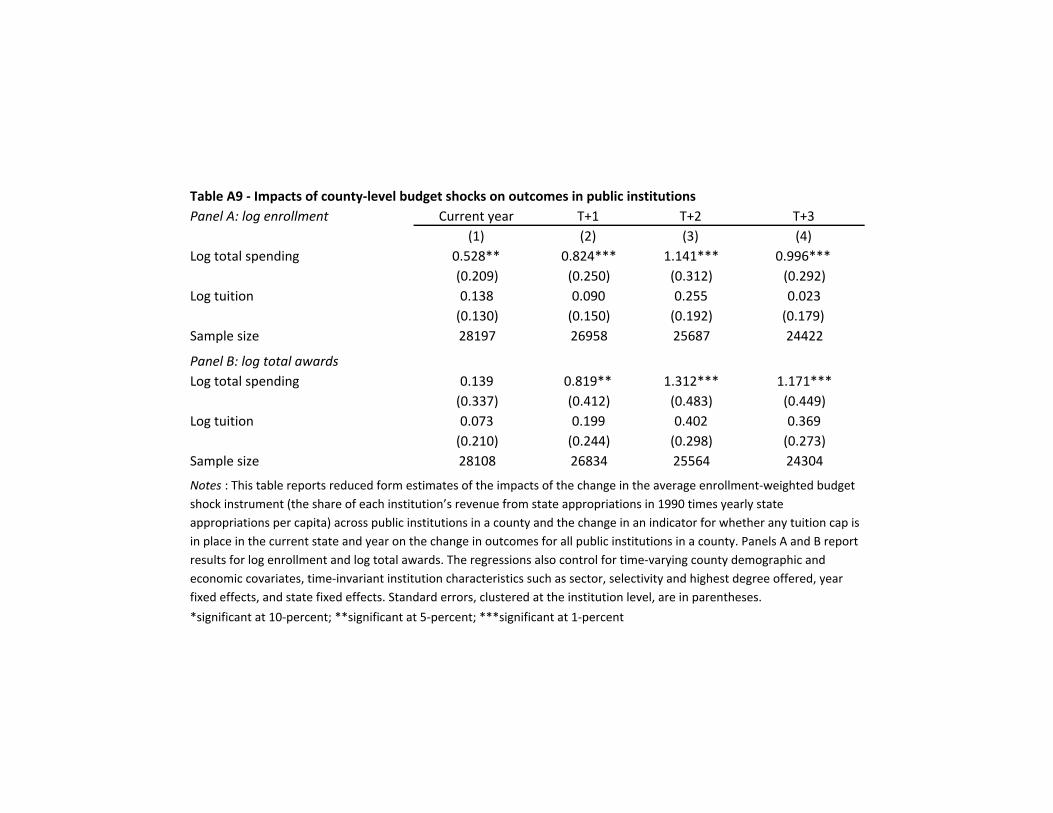
TableA9-Impactsofcounty-levelbudgetshocksonoutcomesinpublicinstitutionsPanelA:logenrollment Currentyear T+1 T+2 T+3
(1) (2) (3) (4)Logtotalspending 0.528** 0.824*** 1.141*** 0.996***
(0.209) (0.250) (0.312) (0.292)Logtuition 0.138 0.090 0.255 0.023
(0.130) (0.150) (0.192) (0.179)Samplesize 28197 26958 25687 24422
PanelB:logtotalawardsLogtotalspending 0.139 0.819** 1.312*** 1.171***
(0.337) (0.412) (0.483) (0.449)Logtuition 0.073 0.199 0.402 0.369
(0.210) (0.244) (0.298) (0.273)Samplesize 28108 26834 25564 24304
*significantat10-percent;**significantat5-percent;***significantat1-percent
Notes :Thistablereportsreducedformestimatesoftheimpactsofthechangeintheaverageenrollment-weightedbudgetshockinstrument(theshareofeachinstitution’srevenuefromstateappropriationsin1990timesyearlystateappropriationspercapita)acrosspublicinstitutionsinacountyandthechangeinanindicatorforwhetheranytuitioncapisinplaceinthecurrentstateandyearonthechangeinoutcomesforallpublicinstitutionsinacounty.PanelsAandBreportresultsforlogenrollmentandlogtotalawards.Theregressionsalsocontrolfortime-varyingcountydemographicandeconomiccovariates,time-invariantinstitutioncharacteristicssuchassector,selectivityandhighestdegreeoffered,yearfixedeffects,andstatefixedeffects.Standarderrors,clusteredattheinstitutionlevel,areinparentheses.

TableA10-2SLSestimatesoftheimpactsoftuitionandspendingonlogcertificatesanddegreesbyyearCurrentyear T+1 T+2 T+3
PanelA:allinstitutions (1) (2) (3) (4)Logtotalspending 0.201 0.779** 0.944*** 0.645**
(0.259) (0.317) (0.330) (0.304)Logtuition 0.115 0.226 0.184 -0.006
(0.151) (0.178) (0.187) (0.174)
Samplesize 28108 26834 25564 24304
PanelB:twoyearinstitutionsLogtotalspending 0.451 1.455** 1.459** 0.637
(0.488) (0.621) (0.635) (0.547)Logtuition 0.264 0.445 0.244 -0.291
(0.275) (0.337) (0.347) (0.319)
Samplesize 16791 16074 15352 14628
PanelC:fouryearinstitutionsLogtotalspending 0.259 0.325 0.459* 0.451*
(0.190) (0.226) (0.234) (0.254)Logtuition 0.123 0.189 0.252 0.306*
(0.135) (0.151) (0.173) (0.172)
Samplesize 11317 10760 10212 9676
*significantat10-percent;**significantat5-percent;***significantat1-percent
Notes :Thistablereportstwo-stageleastsquaresestimatesoftheeffectsoftuitionandspendingonthelogoftotalcertificatesanddegreesawarded.Inthefirststageweregresseachinstitution'syearlychangeinlogtotalspendingandlogtuitiononthechangeinthebudgetshockinstrument(theshareofeachinstitution’srevenuefromstateappropriationsin1990timesyearlystateappropriationspercapita),thechangeinanindicatorforwhetheratuitioncapisinplaceinthecurrentstateandyear,andthechangeinthemaximumpercentageincreaseallowedunderthecap(settozerowhennocapisinplace).Thesecondstageregresseseachinstitution'syearlychangeincertificatesordegreesonthechangesintuitionandspendingfromthefirststage.PanelAreportsresultsforallinstitutions,whilePanelsBandCshowresultsfortwo-yearandfour-yearinstitutionsrespectively.Bothstagesalsocontrolfortime-varyingcountydemographicandeconomiccovariates,time-invariantinstitutioncharacteristicssuchassector,selectivityandhighestdegreeoffered,yearfixedeffects,andstatefixedeffects.Standarderrors,clusteredattheinstitutionlevel,areinparentheses.

TableA11-2SLSestimatesofeffectsonfreshmanandupperclassmanenrollment
Currentyear T+1 T+2 T+3PanelA:logFTEfreshmenLogtotalspending 0.580* 0.032 1.276*** 0.829**
(0.349) (0.391) (0.480) (0.421)Logtuition 0.148 -0.206 0.713** 0.414
(0.194) (0.197) (0.281) (0.253)Samplesize 27311 26093 24841 23610
PanelB:logFTEupperclassmenLogtotalspending 1.298** 0.356 -0.299 1.676***
(0.589) (0.474) (0.464) (0.522)Logtuition 0.836** -0.231 -0.054 0.406
(0.373) (0.272) (0.272) (0.302)Samplesize 27896 26646 25364 24107
*significantat10-percent;**significantat5-percent;***significantat1-percent
Notes :Thistablereportstwo-stageleastsquaresestimatesoftheeffectsoftuitionandspendingonenrollmentforfreshmanandupperclassmen.Inthefirststageweregresseachinstitution'syearlychangeinlogtotalspendingandlogtuitiononthechangeinthebudgetshockinstrument(theshareofeachinstitution’srevenuefromstateappropriationsin1990timesyearlystateappropriationspercapita),thechangeinanindicatorforwhetheratuitioncapisinplaceinthecurrentstateandyear,andthechangeinthemaximumpercentageincreaseallowedunderthecap(settozerowhennocapisinplace).Thesecondstageregresseseachinstitution'syearlychangeincertificatesordegreesonthechangesintuitionandspendingfromthefirststage.PanelAreportsresultsforfull-timeequivalentfreshmen,andPanelBreportsresultsforupperclassmen(withpart-timestudentscountingas0.5inbothcases).Bothstagesalsocontrolfortime-varyingcountydemographicandeconomiccovariates,time-invariantinstitutioncharacteristicssuchassector,selectivityandhighestdegreeoffered,yearfixedeffects,andstatefixedeffects.Standarderrors,clusteredattheinstitutionlevel,areinparentheses.