the impact of sterling depreciation on prices and turnover
TRANSCRIPT

Page 1 of 16
Next release: To be announced
Release date: 15 September 2017
Contact: James Wells and Mark Stephens [email protected] +44 (0) 1633 456387
Article
The impact of sterling depreciation on prices and turnover in the UK manufacturing sector: 2017This article will show how manufacturing industries have responded to currency movements. It will highlight how the value of export turnover has steadily increased for both large and small to medium-sized businesses since the EU Referendum on 23 June 2016.
Table of contents
1. Authors
2. Main points
3. Summary
4. Methods
5. Impact of recent sterling depreciation on manufacturers’ imported inputs and export prices
6. Current price exports
7. Trends in export turnover by size of firm
8. Trends in manufacturing export and total turnover, constant prices
9. Growth rates

Page 2 of 16
1 . Authors
David Takyi and Emelia D’ Silva
2 . Main points
The sterling effective exchange rate depreciated 20% between November 2015 and October 2016, including a record 6.5% fall between June and July 2016 following the EU referendum vote.
This led to higher input costs for UK manufacturers due to rising prices for imported raw materials and fuels and also higher output prices for exported goods in sterling terms.
Experimental volume estimates suggest that while exports increased steadily from 2014, there was a 9.9 percentage point rise in the 3 month year-on-year rolling average growth rate between July 2016 and March 2017 following the EU referendum vote.
Estimates for export volumes compared with current price turnover suggest exporting businesses benefited from a combination of higher prices and increased volumes.
Large businesses were quicker to realise growth in current price turnover than small businesses, although all businesses witnessed a shift in their overall turnover towards exports.
3 . Summary
This article looks at the relationship between manufacturers’ turnover, as measured in current prices by the Monthly Business Survey (MBS), export producer prices, as measured by the Export Price Index (EPI) and an experimental measure of export volumes produced for this article.
The sterling effective exchange rate depreciated 20% between November 2015 and October 2016, which includes the period of the 2016 EU referendum vote when the rate fell by a record 6.5% between June and July. This led to higher prices for exported goods when reported in sterling terms, which in turn resulted in higher turnover for exporting manufacturers, as reported in published data from the Monthly Business Survey (MBS).
The question that is unanswered from published MBS data is whether exporting manufacturers also generated an increase in sales volume, which economic theory says can occur following currency depreciation due to manufacturers being able to drop their prices in foreign currency terms to become more competitive, while maintaining their prices in sterling terms. This article suggests that once the effect of prices are removed from MBS export turnover sales, manufacturers' export volume grew 9% between Quarter 3 (July to Sept) 2016 and Quarter 2 (Apr to June) 2017, while turnover in current prices over the same period rose 11%. The increase in current price turnover seen in the published figures would therefore appear to be a combination of price and volume effects.
Some exporting manufacturers are therefore assumed to have benefited from the recent depreciation due to a combination of price and volume effects; however, what is not clear from analyses in this article is the degree to which higher input costs for imported raw materials and fuels, also a result of the depreciation, have offset any potential gains generated from exports.

Page 3 of 16
4 . Methods
This analysis has been completed using non-seasonally adjusted, current price (nominal) pounds data, collected through the Monthly Business Survey (MBS) and published through the Turnover in the Production and Services Industry release. Through surveying 6,000 manufacturers, the MBS covers the whole of the manufacturing industry with the exception of the iron and steel and mineral oil refining industries. Users should be aware that data used in this article differs from the UK trade in goods import and export data, which is obtained from HM Revenue and Customs.
Prices data have been sourced from export price indices and producer price indices. These sources are described more fully in the . The experimental volume measure has been calculated as a GDPO source cataloguesimple deflation of current price turnover data at the three-digit industry level (SIC 2007) by the respective three-digit export and producer price indices at the product level. The data are consistent with the dataset published in the June Index of Production.
Analysis by business size has been conducted using the sampling size bands used for the MBS. Four sampling size bands are constructed using employment, with all large businesses in size band 4 selected for the survey – this threshold is typically employment of 250 or more but it can be lower for some small industries. Beneath this threshold the remaining three size bands constitute small and medium-sized businesses that are selected at random to represent business activity.
Users should note
Turnover data are collected at industry and not product level.
All volume data presented have been calculated through a simple deflation and index process. No chain linking has been used. In addition it has been assumed that the turnover of an industry only reflects the primary product of that industry. The deflation process in national accounts is more detailed and involves breaking down the output of each industry into a variety of products and deflating these with the most appropriate product deflator.
Data before January 2011 were collected on a Standard Industrial Classification 2003 (SIC 2003) basis and have since been converted to SIC 2007, thus some caution should be observed when using data at the lowest levels.
Data used for this analysis goes up to June 2017 for both prices and turnover data.
5 . Impact of recent sterling depreciation on manufacturers’ imported inputs and export prices
Between November 2015 and October 2016 the value of sterling fell sharply. Over the same period, import and export prices for the UK manufacturing sector rose. Figure 1 shows the input Producer Price Index (PPI) for imported materials and fuels (Imported Inputs), Export Price Index (EPI) and the sterling effective Exchange Rate Index (ERI), which measures changes in the strength of sterling relative to a basket of other currencies. Between November 2015 and October 2016, the sterling effective exchange rate fell, which is associated with an increase in import and export prices when reported in sterling terms.

Page 4 of 16
1.
2.
3.
Figure 1: Imported Inputs, EPI and the Sterling Effective Exchange rate Index (ERI)
Source: Office for National Statistics, Bank of England
Notes:
Series are not seasonally adjusted.
The sterling effective change rate measures changes in the strength of sterling relative to a basket of other currencies.
The sterling effective exchange rate is only indicative of the rates applied to producer prices. This is because the sterling effective exchange rate is a trade weighted index that represents all UK trade, whereas producer prices reflect transactions in the manufacturing sector.

Page 5 of 16
Figure 2 shows the 3-month year-on-year rolling average growth rate for the price of imported inputs, EPI and the sterling effective exchange rate. Between November 2015 and November 2016, the sterling effective exchange rate fell from 5.7% growth to a decline of 16.9%, implying a sharp fall in the value of sterling. This period coincided with the EU referendum vote, which resulted in a month-on-month fall in ERI of 6.5% between June and July 2016, which was the largest movement in the monthly rate since November 2008. Between January and June 2017, the sterling effective rate has stabilised (Figure 1), while the 3-month year-on-year rolling average comparison has moved in an upward direction due to 2016 movements falling from the annualised figures.
Figure 2: Growth of Imported inputs, EPI and the Sterling Effective Exchange rate (ERI), 3 months-on-same 3 months a year ago rolling average

Page 6 of 16
1.
2.
3.
Source: Office for National Statistics, Bank of England
Notes:
Series are not seasonally adjusted.
The sterling effective change rate measures changes in the strength of sterling relative to a basket of other currencies.
The sterling effective exchange rate is only indicative of the rates applied to producer prices. This is because the sterling effective exchange rate is a trade weighted index that represents all UK trade, whereas producer prices reflect transactions in the manufacturing sector.
The impact of the depreciation on UK manufacturing prices was twofold; input costs associated with raw materials and fuel prices increased, while output prices for exported goods rose in sterling terms.
Between November 2015 and June 2017, which spanned the depreciation, growth for prices of imported inputs ranged from a decline of 13.2% to an increase of 18.9% in February 2017 (Figure 2). All else equal, a fall in the value of sterling will lead to higher costs associated with imported inputs.
The depreciation of sterling was not the only upward pressure on input prices across the period, however, as international commodity prices also recovered following two years of falling prices. The sector has also experienced domestic cost pressures. Over the past two years unit labour costs for manufacturers have grown at a faster pace than domestic output prices; for further analyses on unit labour costs see section 6 of July's Prices
.economic commentary
In addition to rising costs, the depreciation has also presented some manufacturers with an opportunity, as when a currency falls in value exporters have two extreme options. They can leave their prices unchanged in foreign currency terms and capitalise from higher prices once currency is exchanged into sterling. Alternatively they can drop their prices in the importing country by the full change in the exchange rate (keeping the sterling price the same) to become more competitive internationally with the aim of increasing their sales volume. There is also a case between these extremes where some of the competitive gains from the currency depreciation could be shared between the exporting manufacturer and the importing country. This latter situation is more likely when the importing country is more price sensitive, and where there are home-produced alternatives to the imported British goods.
According to EPI, export prices for UK manufactured goods increased in sterling terms following the depreciation from November 2015 (Figure 2), suggestive that UK firms did not immediately drop the price of their goods in foreign currency terms.
At their peak in December 2016, export prices increased 12.7% year-on-year on a rolling 3-month average basis (Figure 2), while the sterling effective exchange rate fell 16.9%. Since the beginning of 2017, growth in export prices has slowed (Figure 2).
The upward impact on export prices can also be seen in export turnover sales. By construction, prices multiplied by quantity give turnover:
All else equal, if export prices in the manufacturing sector rise (in sterling terms, but not necessarily in foreign currency terms), turnover for firms will also rise. If the foreign currency price were also to rise, provided the demand (quantity) response away from the British good was not too strong (that is, the export was relatively price inelastic), turnover in sterling terms could also be expected to rise.

Page 7 of 16
Figure 3 shows export turnover sales growth for the manufacturing sector as reported by the Monthly Business Survey (MBS), along with export price growth reported by EPI. Between June 2016 and June 2017, export turnover rose by an average 9.7%, while export prices rose by an average 8.6%. Following the depreciation, export turnover growth peaked at 19.1% in January 2017 when looking at a 3-month year-on-year rolling average basis, while export prices peaked at 12.7% in the 3 months to December 2016 on the same basis.
Some UK manufacturers are therefore assumed to have benefited from the recent depreciation by realising higher prices in sterling terms and therefore turnover, for exported goods; however, what is not clear from these analyses is the degree to which higher input costs for imported raw materials and fuels, also a result of the depreciation, have offset any potential gains generated from exports.
Figure 3: EPI and Export Turnover growth, 3 months-on-same 3 months a year ago rolling average
Source: Office for National Statistics

Page 8 of 16
6 . Current price exports
Figure 4 shows the data for 3 months on 3 months a year ago growth for total and export turnover from 2007. Growth in the inverted Exchange Rate Index (ERI) is shown as a 12-month rate.
Figure 4: Manufacturing total and export turnover 3 month on 3 months a year ago growth; 12 month inverted ERI current prices, Non-seasonally adjusted
UK, January 2007 to June 2017
Source: Office for National Statistics, Bank of England

Page 9 of 16
These data show that export turnover growth has tended to be more volatile than total turnover growth and that in recent periods export performance has been stronger than the totals performance. For example, in the 3 months to January 2017 compared with the same 3 months a year ago, export turnover increased by 19.1% while total turnover increased by 8.7%.
September 2010 and July 2010 experienced the largest increase in export turnover growth of 23.2% since the start of our analysis period in 2007. We observe that total turnover growth remained significantly lower than export turnover growth during the recent period with the biggest difference being 10.5 percentage points in January 2017; this is the largest difference in the analysis period since September 2010 where the difference was 13.0 percentage points. We also observe an inverse relationship between the exchange rate and export turnover.
7 . Trends in export turnover by size of firm
We can split the Monthly Business Survey (MBS) sample into two groups: small and medium businesses, and large businesses. Small and medium businesses are defined as those with employment of less than 250 (note this can be lower for some small industries). Large businesses are defined as those with employment of greater than 250 or those with employment of greater than 10 and an annual turnover of more than £80 million.

Page 10 of 16
Figure 5: large and small and medium-sized businesses export turnover: Index= Jan 2013
Current prices, Non-seasonally adjusted
Source: Office for National Statistics
Figures 5 represents export turnover for each month from January 2013 to June 2017 for large and small and medium-sized businesses indexed to January 2013. These data show that export turnover levels have risen by 39.5 index points for large businesses and by 37.5 index points for small and medium-sized businesses (SMEs). Figure 5 shows that large businesses were quicker to realise growth in current price turnover than small businesses in the second half of 2016.
Until the summer of 2016 the proportion of export turnover of large businesses was around 35% and 20% for SMEs but since then the proportions have become in general a few 5 index points higher, as shown in figure 6. This may be related to movements in the sterling exchange rate alongside other factors such as higher economic growth rates in a range of other countries. For example, has increased from GDP growth in the G7 countries1.6% in Quarter 4 2015 to 2% in Quarter 2 2017

Page 11 of 16
Figure 6: Proportion of total turnover that is exports
Current prices, Non-seasonally adjusted
Source: Office for National Statistics
8 . Trends in manufacturing export and total turnover, constant prices
Long-term trends and relationship with the exchange rate
As described in section 4, turnover is defined as:
Page 12 of 16
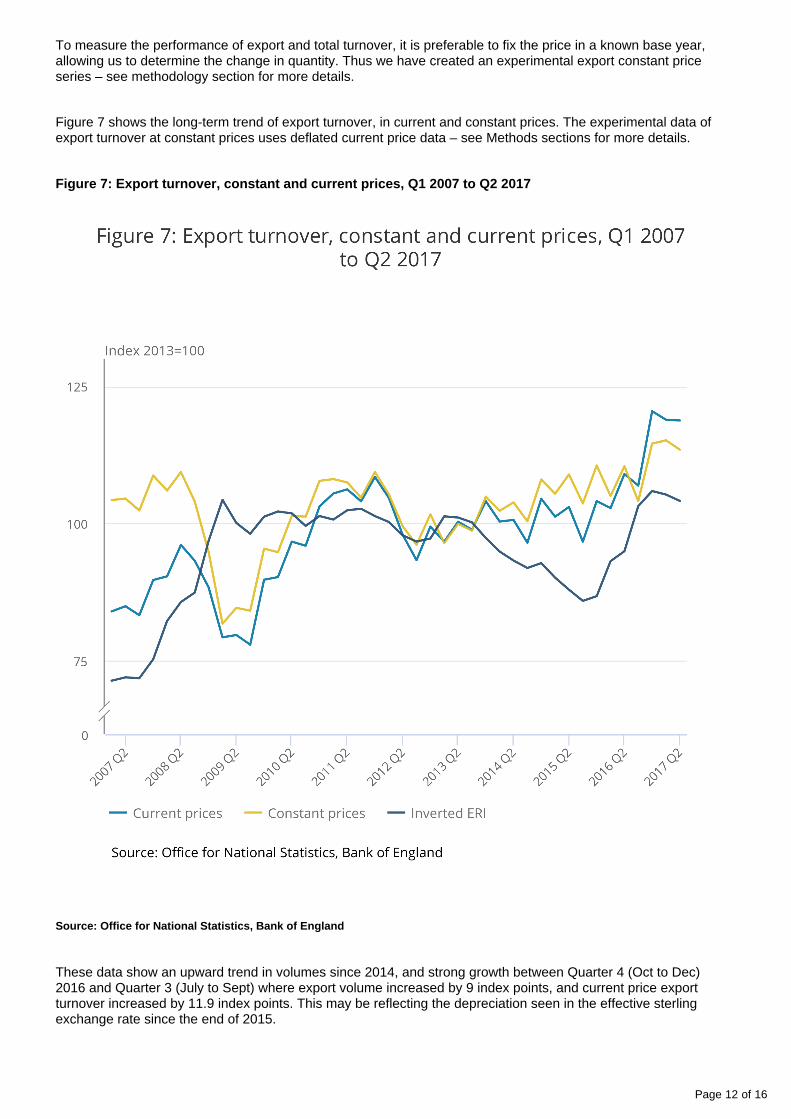
To measure the performance of export and total turnover, it is preferable to fix the price in a known base year, allowing us to determine the change in quantity. Thus we have created an experimental export constant price series – see methodology section for more details.
Figure 7 shows the long-term trend of export turnover, in current and constant prices. The experimental data of export turnover at constant prices uses deflated current price data – see Methods sections for more details.
Figure 7: Export turnover, constant and current prices, Q1 2007 to Q2 2017
Source: Office for National Statistics, Bank of England
These data show an upward trend in volumes since 2014, and strong growth between Quarter 4 (Oct to Dec) 2016 and Quarter 3 (July to Sept) where export volume increased by 9 index points, and current price export turnover increased by 11.9 index points. This may be reflecting the depreciation seen in the effective sterling exchange rate since the end of 2015.

Page 13 of 16
In contrast, the 2008 to 2009 economic downturn saw export volumes and turnover fall by around 20% due to lack of world demand or global trading conditions at the same time as sterling depreciated. However, export turnover in current and constant prices recovered relatively quickly, and was back at pre-downturn levels by Quarter 4 2010. 2010 to 2016 experienced fairly flat volume and turnover growth while the exchange rate was also relatively stable.
Sterling was depreciating from the end of 2015, and fell sharply following the EU referendum vote in Quarter 2 2016. While current price export turnover also began to increase from the same point at the end of 2015, the experimental series of constant price export turnover showed less of an immediate response. The current price series showed a large step-increase of 13.6 index points in Quarter 4 2016 compared with Quarter 3 2016 while the constant price change was only 10.5 index points. It is clear from the previous analysis that part of the increase in the current price export path is due to a price effect, but the experimental constant price series shows that there is also some increase in export volume experienced by UK manufacturers.
Since the start of 2017 export volume and turnover growth has levelled out, this may be partly affected by the stabilisation of the effective sterling exchange rate.

Page 14 of 16
Figure 8: Export volumes as a share of total manufacturers’ volumes, Quarter 1 (Jan to Mar) 2007 to Quarter 2 (Apr to June) 2017 UK
(Non-seasonally adjusted)
Source: Office for National Statistics
Figure 8 shows the share of export volume and current price turnover as a proportion of the total since 2007. These data show there has been an increase in the share of export volume and turnover of UK manufacturers since Quarter 1 (Jan to Mar) 2007. The average share of export volumes for UK manufacturers for the past 10 years is 31%; however, 2017 Quarter 1 and 2 and 2017 Quarter 2 measured above the average at 32.8% respectively. These data also show that for the past 10 years the average export turnover in current prices is 30% of the total; 2017 Quarter 1 and 2 and 2017 Quarter 2 measured above the average at 33.2% respectively.
Page 15 of 16
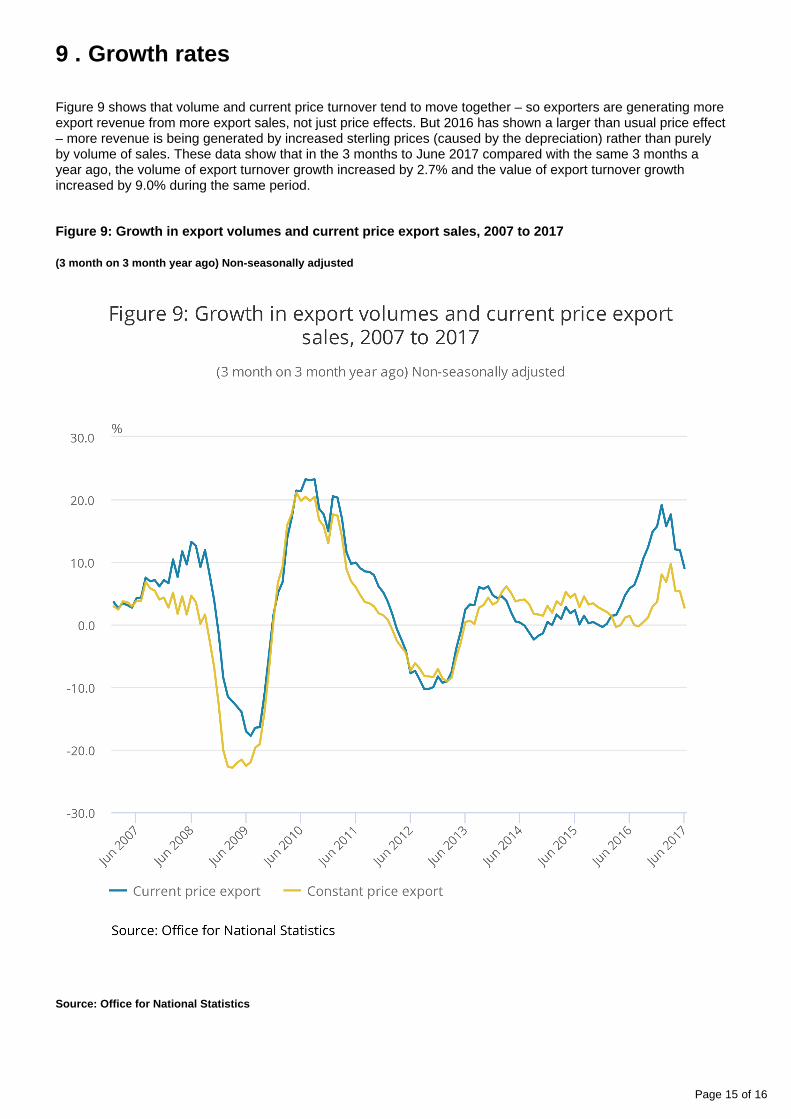
9 . Growth rates
Figure 9 shows that volume and current price turnover tend to move together – so exporters are generating more export revenue from more export sales, not just price effects. But 2016 has shown a larger than usual price effect – more revenue is being generated by increased sterling prices (caused by the depreciation) rather than purely by volume of sales. These data show that in the 3 months to June 2017 compared with the same 3 months a year ago, the volume of export turnover growth increased by 2.7% and the value of export turnover growth increased by 9.0% during the same period.
Figure 9: Growth in export volumes and current price export sales, 2007 to 2017
(3 month on 3 month year ago) Non-seasonally adjusted
Source: Office for National Statistics

Page 16 of 16