the impact of storm events on solute exports from a...
TRANSCRIPT

HYDROLOGICAL PROCESSESHydrol. Process. 20, 3423–3439 (2006)Published online 22 May 2006 in Wiley InterScience (www.interscience.wiley.com). DOI: 10.1002/hyp.6141
The impact of storm events on solute exports from aglaciated forested watershed in western
New York, USA
S. P. Inamdar,1* N. O’Leary,2 M. J. Mitchell3 and J. T. Riley1
1 Great Lakes Center and Geography, Buffalo State College, Buffalo, NY 14222, USA2 Environmental Studies, Wells College, Aurora, NY 13026, USA
3 Environmental and Forest Biology, State University of New York, College of Environmental Science and Forestry, Syracuse, NY 13210,USA
Abstract:
This study analysed the importance of precipitation events from May 2003 to April 2004 on surface water chemistryand solute export from a 696 ha glaciated forested watershed in western New York State, USA. The specific objectivesof the study were to determine: (a) the temporal patterns of solutes within individual storm events; (b) the impactof precipitation events on seasonal and annual export budgets; and (c) how solute concentrations and loads variedfor precipitation events among seasons as functions of storm intensity and antecedent moisture conditions. Analysisof solute trajectories showed that NH4
C, total Al and dissolved organic nitrogen (DON) peaked on the hydrographrising limb, whereas dissolved organic carbon (DOC) concentrations peaked following the discharge peak. Sulphateand base-cations displayed a dilution pattern with a minimum around peak discharge. End-member mixing analysisshowed that throughfall contributions were highest on the rising limb, whereas valley-bottom riparian waters peakedfollowing the discharge peak. The trajectories of NO3
� concentrations varied with season, indicating the influence ofbiotic processes on the generation, and hence flux, of this solute. Storm events had the greatest impact on the annualbudgets for NH4
C, KC, total dissolved Al, DON and DOC. Storm events during summer had the greatest impacton seasonal solute budgets. Summer events had the highest hourly discharges and high concentrations of solutes.However, NO3
� and DOC exports during a spring snowmelt event were considerably more than those observed forlarge events during other periods of the year. Comparisons among storms showed that season, precipitation amount,and antecedent moisture conditions affected solute concentrations and loads. Concentrations of solutes were elevatedfor storms that occurred after dry antecedent conditions. Seven of the largest storms accounted for only 15% of theannual discharge, but were responsible for 34%, 19%, 64%, 13%, 39% and 24% of the annual exports of NH4
C, KC,Al, NO3
�, DON and DOC respectively. These results suggest that the intense and infrequent storms predicted forfuture climate-change scenarios will likely increase the exports of solutes like DOC, DON, NH4
C, Al and KC fromwatersheds. Copyright 2006 John Wiley & Sons, Ltd.
KEY WORDS storm events; solute budgets; dissolved organic carbon; dissolved organic nitrogen; watershed;hydrochemistry; season
INTRODUCTION
There is increasing recognition that high-frequency sampling of stream chemistry, especially during stormevents, is critical for quantifying solute export patterns from watersheds and for identifying the processesresponsible for the release of solutes (Hinton et al., 1997; Swistock et al., 1997; McHale et al., 2000; Inam-dar et al., 2004; Kirchner et al., 2004). Kirchner et al. (2004) argued that high-frequency sampling conductedover longer time periods is certain to yield new insights into hydrologic and biogeochemical processes regulat-ing stream chemistry (processes that occur over time-scales of minutes to hours in small watersheds). Through
* Correspondence to: S. P. Inamdar, Bioresources Engineering, University of Delaware, Newark, DE 19716, USA..E-mail: [email protected]
Received 29 December 2004Copyright 2006 John Wiley & Sons, Ltd. Accepted 30 August 2005

3424 S. P. INAMDAR ET AL.
detailed storm-event monitoring, Hinton et al. (1997) found that 10% of the stream discharge accounted for41 to 57% of dissolved organic carbon (DOC) export in the autumn, with one large event contributing 31%.McClain et al. (2004) referred to such events as ‘hot moments’, i.e. short periods of time that have a dispropor-tionate influence on catchment hydrologic and solute response. Swistock et al. (1997) found that storm eventswere important contributors to solute budgets, especially for solutes that were strongly correlated to streamdischarge. Storm events were also responsible for most of the annual dissolved organic nitrogen (DON) exportfrom a forested watershed in the Adirondack Mountains of New York (McHale et al., 2000). The importanceof storm events in acidification of surface waters has also been shown (Wigington et al., 1990). However, theimpact of storm events on surface water acidification or other changes in solute chemistry may vary with eventsize, season, and antecedent moisture conditions. Wellington and Driscoll (2004) found that events followingwet conditions produced more severe acid episodes than events following drier conditions. Biron et al. (1999)studied solute concentrations during a sequence of fall storms for 2 years with contrasting moisture regimesand found that concentrations during the drier year were higher than those during the wetter year.
Information on temporal patterns within storms is needed not only in developing models of dischargeversus solute concentrations for computing solute flux budgets (Swistock et al., 1997), but will also provideinsights into the hydrologic flowpaths responsible for solute export. NO3
� (Creed and Band, 1998a) and DOC(Boyer et al., 1997) concentrations were observed to increase with increasing discharge and were attributedto the ‘flushing’ of the solutes from near-surface layers by the rising water table. Inamdar et al. (2004) wereable to identify a clear separation in NO3
� and DOC concentration trajectories for a large summer eventthat suggested NO3
� and DOC were exported via different hydrologic flow paths. Mitchell et al. (2006)studied a sequence of four summer–fall storms after an extended dry period and found that there was a clearchange in surface water chemistry. Differences in solute concentrations among events suggested that wetlandscontributed more to solute export as the catchment moisture regimes increased.
We explored the role of storm events in influencing the surface water chemistry of a 696 ha glaciated,forested, watershed in western New York State through an intense high-frequency sampling campaignconducted over 1 year. A total of 32 rainfall events and a large snowmelt event were sampled. Samplingfor rain events was conducted at frequencies as low as 15 min, whereas the snowmelt event was sampled ona daily basis. Concentrations of cations (total Al, Ca2C, Mg2C, KC, NaC), anions (SO4
2�, NO3�), DOC, and
DON were determined. Using Mg2C, Si, and DOC in an end-member mixing analysis (EMMA), Inamdar andMitchell (2006) identified throughfall, shallow groundwater (SGW) and valley-bottom riparian water (VBRW)as the three controlling end-members for stream chemistry during rainfall events. Throughfall contributionswere high on the rising limb, whereas VBRW contributions were found to dominate the receding limb of thestreamflow hydrograph (Inamdar and Mitchell, 2006). Our interest in this study was to investigate the impactof storm events and these runoff components on the temporal pattern and amounts of solutes exported fromthe watershed. Specific questions that were addressed in our study were:
1. How do solute concentrations vary temporally within storm events and how are they influenced by sourcesof runoff in the watershed? Do event solute patterns vary with seasons and event size?
2. What is the impact of storm events on annual and seasonal solute export budgets?3. How do solute concentrations and loads vary for storms as a function of storm size, antecedent moisture
and season?
METHODS
Site description
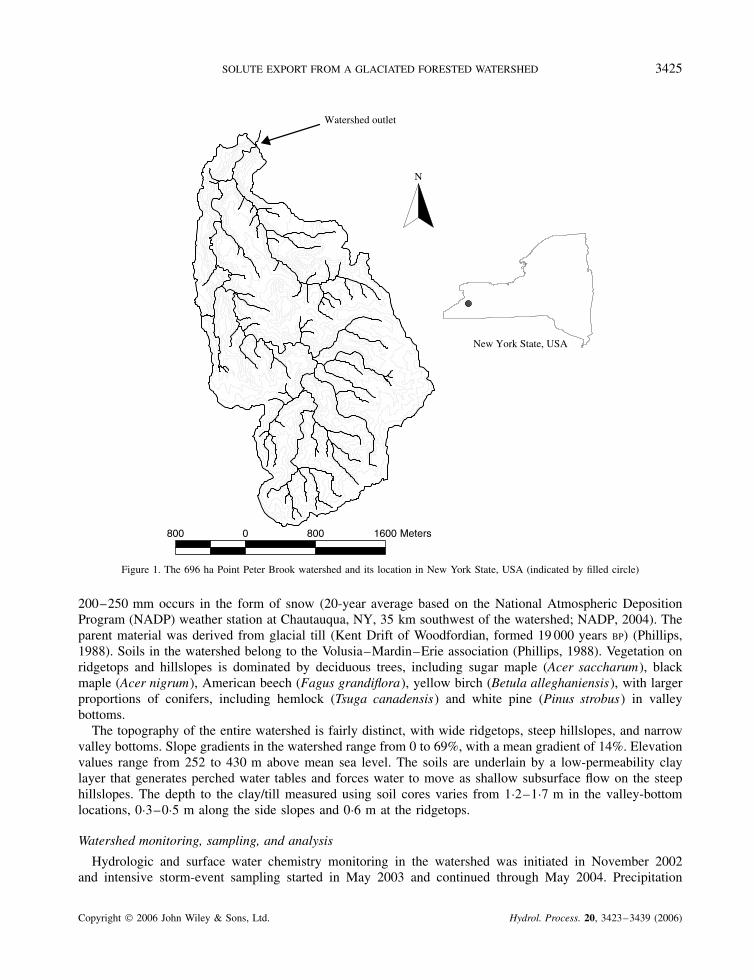
This study was conducted in the 696 ha Point Peter Brook watershed (Figure 1), located in CattaraugusCounty and 55 km southeast of Buffalo, NY (42°2603000N; 78°5503000W). Mean annual winter temperatureis �3 °C and the mean summer temperature is 21 °C. Annual precipitation averages 1006 mm, of which
Copyright 2006 John Wiley & Sons, Ltd. Hydrol. Process. 20, 3423–3439 (2006)
SOLUTE EXPORT FROM A GLACIATED FORESTED WATERSHED 3425
New York State, USA
800 0 800 1600 Meters
N
Watershed outlet
Figure 1. The 696 ha Point Peter Brook watershed and its location in New York State, USA (indicated by filled circle)
200–250 mm occurs in the form of snow (20-year average based on the National Atmospheric DepositionProgram (NADP) weather station at Chautauqua, NY, 35 km southwest of the watershed; NADP, 2004). Theparent material was derived from glacial till (Kent Drift of Woodfordian, formed 19 000 years BP) (Phillips,1988). Soils in the watershed belong to the Volusia–Mardin–Erie association (Phillips, 1988). Vegetation onridgetops and hillslopes is dominated by deciduous trees, including sugar maple (Acer saccharum), blackmaple (Acer nigrum), American beech (Fagus grandiflora), yellow birch (Betula alleghaniensis), with largerproportions of conifers, including hemlock (Tsuga canadensis) and white pine (Pinus strobus) in valleybottoms.
The topography of the entire watershed is fairly distinct, with wide ridgetops, steep hillslopes, and narrowvalley bottoms. Slope gradients in the watershed range from 0 to 69%, with a mean gradient of 14%. Elevationvalues range from 252 to 430 m above mean sea level. The soils are underlain by a low-permeability claylayer that generates perched water tables and forces water to move as shallow subsurface flow on the steephillslopes. The depth to the clay/till measured using soil cores varies from 1Ð2–1Ð7 m in the valley-bottomlocations, 0Ð3–0Ð5 m along the side slopes and 0Ð6 m at the ridgetops.
Watershed monitoring, sampling, and analysis
Hydrologic and surface water chemistry monitoring in the watershed was initiated in November 2002and intensive storm-event sampling started in May 2003 and continued through May 2004. Precipitation
Copyright 2006 John Wiley & Sons, Ltd. Hydrol. Process. 20, 3423–3439 (2006)

3426 S. P. INAMDAR ET AL.
was recorded using a tipping-bucket rain gauge located near the watershed outlet. Stream flow stage at thewatershed outlet was recorded every 15 min using a pressure transducer (Global Water Inc., WL15 waterlevel logger). A stage–discharge relationship was developed for the 3 m wide stream channel. Groundwaterelevations were recorded using pressure transducers (Global Water Inc.) nested within logging wells that wereconstructed of 5 cm (ID) PVC tubing. The logging wells were cored to the depth at which an impeding clayor gravel layer was intersected (between 1Ð5 and 3 m). Three logging wells were located in the valley-bottompositions and two wells were located on hillslope benches.
Grab sampling was performed on a biweekly basis to characterize the spatial water chemistry in thewatershed and included valley-bottom riparian wells, hillslope seeps, zero-tension lysimeters located in valley-bottom and hillslope-bench saturated areas and streams. Riparian sampling wells were constructed of 5 cm (ID)PVC tubing and were cored to the depth at which an impeding clay or gravel layer was intersected (between1Ð5 and 3 m). The wells were screened from 30 cm below the soil surface to the bottom. Groundwater seepswere observed to discharge water on hillslopes where the glacial till was exposed. These seeps were typicallylocated halfway up the valley and were assumed to discharge SGW. Zero-tension lysimeters were constructedof 5 cm (ID) PVC tubing and were inserted at a 45° angle to a depth of 30 cm from the soil surface. Thelysimeters were screened such that they collected soil waters from the O (forest floor) and A horizons.Lysimeters were installed in valley-bottom riparian and wetland areas and hillslope-bench saturated areas.
Storm-event sampling was conducted using an ISCO sampler, which was triggered for event sampling whenthe rainfall amount exceeded a threshold of 2Ð8 mm. The sampler was programmed on the ‘variable time’mode so as to sample more frequently on the hydrograph rising limb than on the recession limb. Compositeprecipitation samples were collected in a collector placed in the open; throughfall samples were collected fromtwo collectors, one placed under a coniferous canopy and one placed under a deciduous canopy. Precipitationand throughfall collectors were 3Ð8 l plastic containers connected to funnels that had a plastic mesh on themouth to prevent entry of debris. The plastic containers were cleaned frequently to prevent debris build-upand contamination. All samples were collected in 250 ml Nalgene bottles within 24 h of an event.
Water samples were analysed for DOC on a Tekmar–Dohrmann Phoenix 8000 TOC analyser, and cations(total Al, Ca2C, Mg2C, KC, Si, NaC) were analysed on a Perkin–Elmer ICP-AEC Div 3300 instrument.Total dissolved nitrogen (TDN) was determined using persulphate oxidation (Ameel et al., 1993) followedby colorimetric analysis on an autoanalyser. Ammonia was also determined on an autoanalyser using theBerthelot reaction followed by colorimetric analysis. Anion concentrations (SO4
2�, NO3�) were determined
on a Dionex IC. Concentration of DON was estimated by subtracting NH4C and NO3
� from TDN. Thelaboratory is a participant in the United States Geological Survey performance evaluation programme, whichensures data quality. A system of calibration quality control, detection quality control, analytical blanks andreplicates is used with every set of samples (Mitchell et al., 2001).
Data selection and analysis
Hydrological and chemistry data are provided from November 2002 to April 2004, with more detailedanalyses for storms events being obtained from May to April 2004. The calendar year was divided intofour seasons: spring (March, April and May); summer (June, July, and August); fall (September, October andNovember); and winter (December, January and February). Mean concentrations in discharge and precipitationwere volume weighted. Sample concentrations were linearly interpolated for sampling intervals within eventsto calculate solute fluxes.
A total of 32 rainfall events were monitored for stream chemistry, with 9, 15, and 8 events being sampledin spring, summer, and fall respectively. A large snowmelt event (1–6 March) was sampled during the firstweek of spring (Figure 2). Most of the winter snowpack melted during this event. No events were sampledduring the winter period. Six of the largest rainfall events (24 and 27 July, 15 October, 19 and 28 November2003, 12 April 2004) and the snowmelt event were further evaluated to investigate the impact of storm-eventsizes and antecedent conditions on solute flux and on solute chemistry (Figure 2). Water and solute budgets,
Copyright 2006 John Wiley & Sons, Ltd. Hydrol. Process. 20, 3423–3439 (2006)

SOLUTE EXPORT FROM A GLACIATED FORESTED WATERSHED 3427
0
2
4
6
8
10
12
14
16
18
20
May Jun Jul Aug Sep Oct Nov Dec Jan Feb Mar Aprtime (2003-2004)
prec
ipita
tion
(mm
)
0
0.5
1
1.5
2
2.5
3
disc
harg
e (m
m/h
r)
discharge
5/11
6/8
7/247/27
10/1511/19
11/283/1-3/6
4/12
Figure 2. Precipitation and streamflow discharge for the study period of May 2003 to April 2004. A total of 32 storm events and a snowmeltevent were sampled and analysed. Filled circles indicate the seven large events for which detailed analyses were performed, and events for
which EMMA separations were performed are indicated by arrows
flow-weighted concentrations, and the maximum percentage change in concentrations during the events (frompre-storm values) were computed for these events. In addition to 7-day antecedent precipitation index (API7),an antecedent wetness index (AWI) was also developed. The AWI was a 7-day running average of groundwaterelevations measured from the soil surface for a groundwater logging well located on a hillslope bench.
End-member mixing analysis and hydrograph separations
End-member mixing analysis (EMMA) (Burns et al., 2001; Christopherson et al., 1990; McHale et al.,2002) for this watershed was performed by Inamdar and Mitchell (2006). A complete description of themethods and the resulting model is provided in Inamdar and Mitchell (2006). Three solutes, namely Mg2C,Si, and DOC, were selected to characterize the storm-event mixing regime. Streamflow concentrations forthe selected solutes were then standardized and a correlation matrix was developed. Eigenvectors for thecorrelation matrix were computed using Mathematica (Wolfram, Inc.). The first two components, U1 andU2, of the eigenvector matrix were then used to project the stream and all potential end-members into theU-space. Selection of the two principal components implied a three-component mixing model. For the U-space mixing diagrams for individual events, stream concentrations for the event were used, and the potentialend-members were represented by an average of baseflow solute concentrations recorded before and afterthe event. Throughfall, SGW discharged at seeps, and VBRW bounded the streamwater concentrations acrossmost events. For the snowmelt event of 1–6 March, snowpack replaced throughfall as the constraining end-member. Three-component hydrograph separations were performed to identify the contributions of the selectedend-members to streamflow discharge. Hydrograph separations indicated that SGW amounts were high at thestart of the event, followed by high throughfall values on the hydrograph rising limb, whereas the recedinglimb was dominated by throughfall and VBRW (Inamdar and Mitchell, 2006). The contribution of VBRWon the receding limb was independently confirmed by groundwater elevations (Inamdar and Mitchell, 2006).Groundwater elevations in valley-bottom riparian wells reached a peak (closest to the surface) at or after thedischarge peak and remained elevated through streamflow recession.
To allow comparisons of solute concentrations with end-member contributions for this study, we performedEMMA separations for four events: 27 July, 11 May, 8 June (all in 2003) and 1–6 March 2004 (indicated byarrows on Figure 2). These four events were selected to characterize end-member and solute responses across
Copyright 2006 John Wiley & Sons, Ltd. Hydrol. Process. 20, 3423–3439 (2006)

3428 S. P. INAMDAR ET AL.
varying event conditions. The event of 1–6 March was a large snowmelt episode (total discharge 33Ð7 mm).The event of 27 July produced the highest peak discharge during the study period (total rainfall of 24 mm,event discharge of 6Ð6 mm, peak discharge of 1Ð54 mm h�1); the event of 11 May was a medium-sized event(total rainfall of 14 mm, event discharge of 3Ð3 mm, peak discharge of 0Ð52 mm h�1); and the event of 8 Junewas a small event (total rainfall of 12 mm, event discharge of 2Ð8 mm, peak discharge of 0Ð23 mm h�1).
RESULTS
Solute concentrations in various watershed compartments
Concentrations of solutes varied widely between the different watershed compartments (Table I). The highestconcentrations for NH4
C were recorded in throughfall, followed by rainfall and near-surface waters measuredby lysimeters. NH4
C concentrations were lowest in SGW discharged at seeps. Base cations (NaC, Mg2C, andCa2C) were highest in VBRWs and near-surface waters measured in lysimeters. High concentrations for totalAl and KC concentrations were recorded in throughfall. However, total Al concentrations measured in streambaseflow exceeded those measured in any of the watershed compartments.
The highest NO3� concentrations were recorded in SGW discharged at seeps, followed by conifer
throughfall. High NO3� concentrations in groundwater seeps have also been previously reported in the
Catskills (Burns et al., 1998) and Adirondack Mountains (McHale et al., 2002) of New York State. Thelowest NO3
� concentrations were observed in near-surface waters. SO42� concentrations were most elevated
in VBRWs and near-surface waters, i.e. locations of high moisture in the catchment. Mitchell et al. (2006)also observed high SO4
2� concentrations in riparian wetlands and attributed this to reoxidation of accumulatedsulphide, which had previously been reduced from SO4
2� under more saturated soil conditions. The distributionof DON concentrations in watershed compartments was similar to NH4
C, with elevated concentrations insurficial waters like throughfall, snowpack, rainfall, and near-surface soil waters. DOC concentrations werehighest in throughfall, followed by near-surface waters and VBRWs.
Although NH4C was higher below the deciduous canopy, KC, DON and DOC were higher below the
coniferous canopy. Conifer throughfall was especially high in DOC, with values an order of magnitudegreater than those measured under the deciduous canopy. Similar observations of high solute concentrationsfor conifer canopies have been made by Mitchell et al. (2006) and Mollitor and Raynal (1982) for stands inthe Adirondack region of New York State.
Table I. Mean concentrations (standard deviations in parentheses) of solutes in various watershed compartments in the PointPeter Brook watershed
Solute Rainfall Snowpack Throughfall VBRW SGW from Near-surface Stream(wells) seeps waters
Deciduous Conifer (lysimeters)
n 37 10 35 38 62 41 28 221NH4
C (µmolc l�1) 17 (24) 14 (14) 30 (46) 17 (21) 11 (10) 2 (2) 15 (28) 5 (7)NaC (µmolc l�1) 5 (7) 16 (10) 4 (6) 9 (14) 389 (284) 133 (44) 101 (33) 317 (88)Mg2C (µmolc l�1) 14 (12) 17 (15) 19 (9) 41 (29) 1210 (132) 987 (122) 1080 (250) 978 (208)KC (µmolc l�1) 2 (2) 51 (124) 31 (20) 82 (44) 29 (7) 41 (27) 30 (15) 41 (14)Ca2C (µmolc l�1) 39 (36) 91 (134) 57 (27) 105 (88) 2570 (450) 2190 (349) 2790 (642) 1930 (402)Total Al (µmol l�1) 0Ð4 (0Ð4) 0Ð5 (0Ð2) 1 (1Ð5) 3 (4) 1 (8) 0Ð1 (0Ð4) 0Ð4 (1Ð6) 9 (30)NO3
� (µmolc l�1) 25 (23) 42 (42) 37 (25) 46 (73) 4 (6) 58 (30) 1 (3) 26 (9)SO4
2� (µmolc l�1) 61 (28) 26 (18) 73 (32) 131 (75) 910 (309) 442 (70) 664 (320) 795 (134)DON (µmol l�1) 10 (12) 24 (21) 19 (13) 33 (17) 13 (13) 7 (7) 16 (22) 14 (20)DOC (µmol l�1) 207 (78) 242 (395) 366 (200) 1200 (612) 275 (147) 44 (19) 682 (941) 322 (122)
Copyright 2006 John Wiley & Sons, Ltd. Hydrol. Process. 20, 3423–3439 (2006)
SOLUTE EXPORT FROM A GLACIATED FORESTED WATERSHED 3429
0
0.2
0.4
0.6
0.8
1
1.2
1.4
1.6
1.8
7/27 10:00 7/27 14:48 7/27 19:36 7/28 0:24
disc
harg
e (m
m/h
r)
0
5
10
15
20
prec
ip (
mm
)
0
0.2
0.4
0.6
0.8
1
7/27 10:00 7/27 14:48 7/27 19:36 7/28 0:24
frac
tion
thf SGW VBRW
0
20
40
60
80
100
120
140
7/27 10:00 7/27 14:48 7/27 19:36 7/28 0:24
Al,
NH
4, N
O3,
DO
N
0
100
200
300
400
500
600
700
800
DO
C
0
200
400
600
800
1000
7/27 10:00 7/27 14:48 7/27 19:36 7/28 0:24
SO
4
0
500
1000
1500
2000
2500
3000
3500
4000
base
cat
ions
0
0.2
0.4
0.6
0.8
1
5/11 7:00 5/11 11:48 5/11 16:36 5/11 21:24
disc
harg
e (m
m/h
r)
0
2
4
6
8
10
prec
ip (
mm
)
0
0.2
0.4
0.6
0.8
1
5/11 7:00 5/11 11:48 5/11 16:36 5/11 21:24
frac
tion
thf SGW VBRW
0
10
20
30
40
50
60
70
5/11 7:00 5/11 11:48 5/11 16:36 5/11 21:24
Al,
NH
4, N
O3,
DO
N
0
100
200
300
400
500
600
700
800
DO
C
0
200
400
600
800
1000
5/11 7:00 5/11 11:48 5/11 16:36 5/11 21:24
SO
4
0
500
1000
1500
2000
2500
3000
3500
4000
4500ba
se c
atio
ns
Total Al NH4+ DON NO3
- DOC Base cations SO42-X
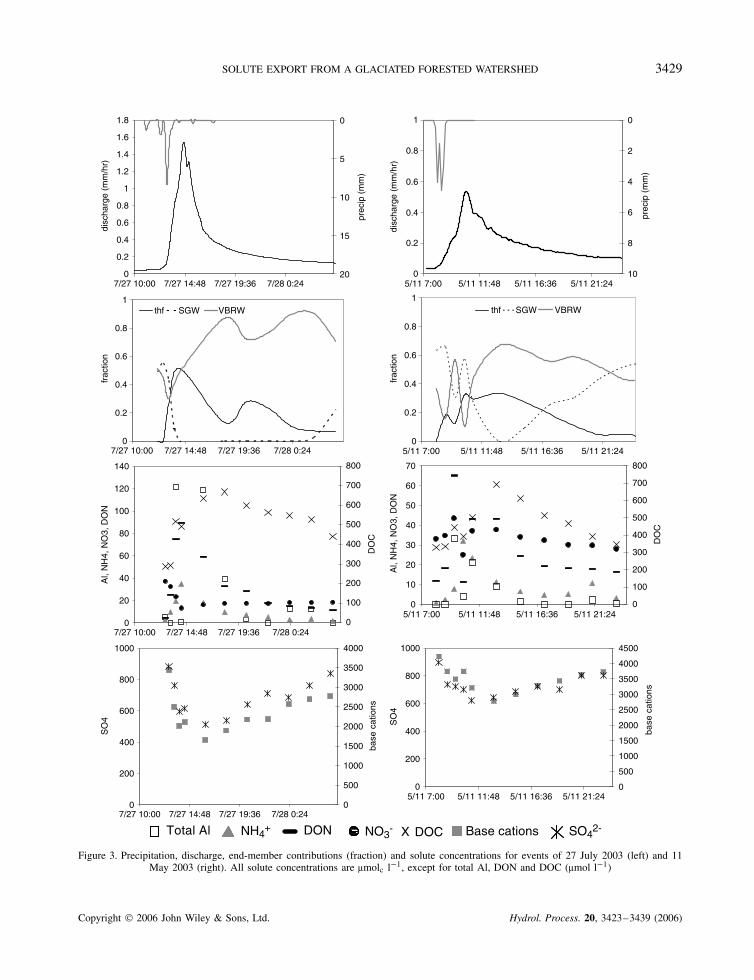
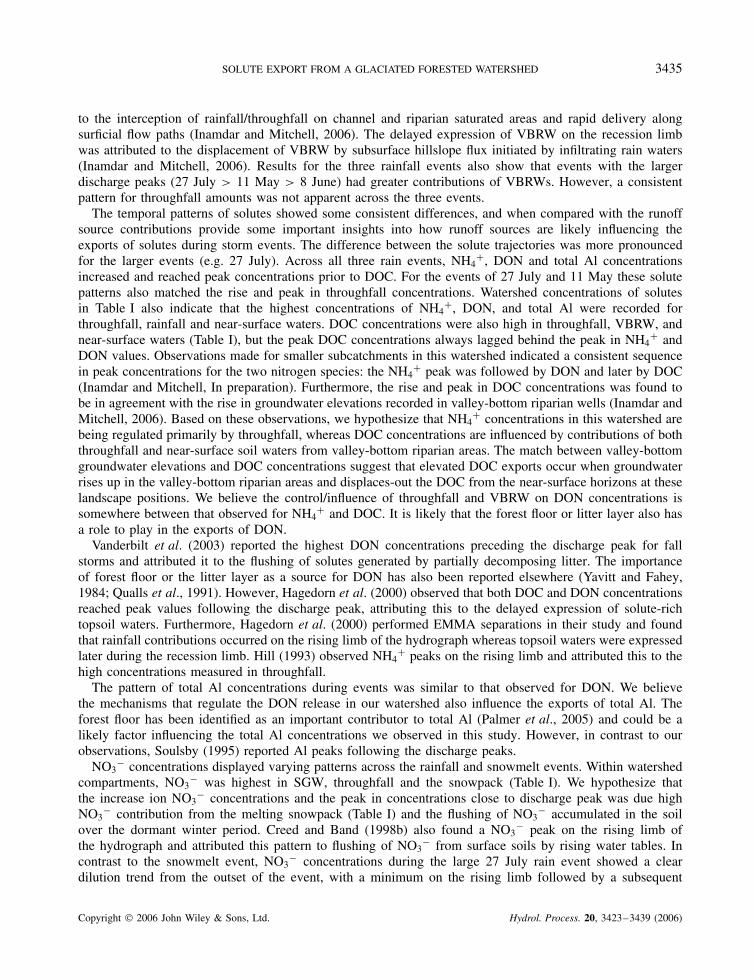
Figure 3. Precipitation, discharge, end-member contributions (fraction) and solute concentrations for events of 27 July 2003 (left) and 11May 2003 (right). All solute concentrations are µmolc l�1, except for total Al, DON and DOC (µmol l�1)
Copyright 2006 John Wiley & Sons, Ltd. Hydrol. Process. 20, 3423–3439 (2006)
3430 S. P. INAMDAR ET AL.
Within-event patterns of end-member contributionsAt the start of the 27 July event (Figure 3), streamflow discharge was primarily composed of SGW (49%)
and VBRW (51%). SGW contributions declined rapidly as the event proceeded, reaching negligible valuesaround peak discharge. Throughfall contributions increased through the rising limb, reaching a peak justbefore peak in discharge. VBRW amounts showed an initial drop, then steadily increased with a peakfollowing the peak in discharge, and remained high during hydrograph recession. The first third of therising limb was primarily composed of SGW and VBRW, the contributions from all three end-memberswere comparable during the second third, and throughfall fractions exceeded VBRW values during the lastthird of the hydrograph rising limb. VBRW dominated hydrograph recession, with a simultaneous decline inthroughfall amounts during this period. Over the full duration of the event, throughfall, SGW, and VBRWcontributions to streamflow amounted to 31%, 4%, and 65% respectively.
For the 11 May event (Figure 3), streamflow at the start of the event was again composed of SGW andVBRW. SGW and VBRW amounts fluctuated at the start of the event, but they stabilized as the eventproceeded. Throughfall contribution reached a peak at discharge peak, and remained high through the earlypart of the recession curve. VBRW amounts reached a maximum after the throughfall peak. Total throughfall,SGW, and VBRW contributions to streamflow for the event were 22%, 29% and 49% respectively.
For the 8 June event (Figure 4), throughfall and VBRW amounts both reached peak values after dischargepeak and during the recession period. The first-half of the recession limb was dominated by SGW, with aboutequal contributions of the three end-members during the second-half of the rising limb. Similar to the events of27 July and 11 May, the major portion of the hydrograph recession was composed of VBRW and throughfall.Total event contributions for throughfall, SGW, and VBRW were 33%, 23%, and 45% respectively.
For the snowmelt event (Figure 4), SGW contributions were again highest at the start of the event anddeclined and reached a minimum during the peak discharge. In contrast, snowpack and VBRW amountsincreased and peaked with the first discharge peak. Both snowpack and VBRW amounts then simultaneouslydeclined and reached steady values through event recession. The 6-day snowmelt event displayed multipledischarge peaks. It is likely we could also have observed multiple peaks in snowpack and VBRW contributionsif sampling had been performed at a higher frequency than the daily rate for the event. Over the duration ofthe event, the snowpack, SGW, and VBRW contributions to streamflow amounted to 31%, 38%, and 31%respectively.
Within-event patterns of solutes
Solute patterns for NH4C, DON, and total Al were similar across the events of 27 July and 11 May. For
both events (Figure 3), NH4C and DON values quickly increased and reached peak concentrations on the
rising limb prior to the peak in discharge. The peak in NH4C and DON concentrations matched the peak
in throughfall contributions. Concentrations of total Al also peaked on the rising limb and when throughfallcontributions were high. For the 27 July event, NO3
� concentrations declined at the outset of the event, reacheda minimum close to the time when throughfall contributions were highest, and then steadily recovered throughrecession. NO3
� concentrations for the 11 May event displayed a different pattern, with an increase in NO3�
at the outset of the event, followed by drop in concentrations and a subsequent recovery. DOC concentrationpatterns for 27 July and 11 May were similar, with a steady increase through the rising limb and a delayedpeak in values during hydrograph recession. The peak in DOC concentrations occurred between the peaksin contributions of throughfall and VBRW. Since DOC was one of the solutes used in EMMA, and sinceDOC was high in throughfall and VBRW, the close correspondence between DOC and throughfall/VBRWwas expected. Both SO4
2� and the sum of base cations (NaC, Ca2C, Mg2C, KC) followed a dilution trajectoryfor the 27 July and 11 May events, with a minimum concentration around the time when DOC concentrationswere at their maximum.
Solute patterns for the small 8 June event (Figure 4) were not as pronounced as they were for the larger27 July and 11 May events. Similar to the 27 July and 11 May events, the NH4
C, DON, and total Al concen-trations were at their maximum on the hydrograph rising limb; but, unlike those two events, the maximum
Copyright 2006 John Wiley & Sons, Ltd. Hydrol. Process. 20, 3423–3439 (2006)

SOLUTE EXPORT FROM A GLACIATED FORESTED WATERSHED 3431
0
0.05
0.1
0.15
0.2
0.25
6/8 19:00 6/8 23:48 6/9 4:36 6/9 9:24
6/8 19:00 6/8 23:48 6/9 4:36 6/9 9:24
6/8 19:00 6/8 23:48 6/9 4:36 6/9 9:24
disc
harg
e (m
m/h
r)0
2.5
5
7.5
10
prec
ip (
mm
)
0
0.2
0.4
0.6
0.8
1
frac
tion
0
0.2
0.4
0.6
0.8
1
frac
tion
thf SGW VBRW snowpack SGW VBRW
0
5
10
15
20
25
30
35
Al,
NH
4, N
O3,
DO
N
0
50
100
150
200
250
300
350
400
450
500
DO
C
0
200
400
600
800
1000
1200
6/819:00
6/821:24
6/823:48
6/92:12
6/94:36
6/97:00
6/99:24
6/911:48
SO
4
0
200
400
600
800
1000
1200
SO
4
0
500
1000
1500
2000
2500
3000
3500
4000
4500
base
cat
ions
0
500
1000
1500
2000
2500
3000
3500
4000
base
cat
ions
0
0.1
0.2
0.3
0.4
0.5
0.6
3/1 3/2 3/3 3/4 3/5 3/6 3/7
3/1 3/2 3/3 3/4 3/5 3/6 3/7
3/1 3/2 3/3 3/4 3/5 3/6 3/7
3/1 3/2 3/3 3/4 3/5 3/6 3/7
disc
harg
e (m
m/h
r)
0
5
10
15
20
25
30
35
40
45
50
Al,
NH
4, N
O3,
DO
N
0
50
100
150
200
250
300
350
DO
C
Total Al NH4+ DON NO3
- X DOC Base cations SO42-
Figure 4. Precipitation, discharge, end-member contributions and solute concentrations for events of 8 June 2003 (left) and 1–6 March 2004(right). All solute concentrations are in µmolc l�1, except for total Al, DON and DOC (µmol l�1)
concentrations for these solutes peaked before the peak in throughfall contributions. Similarly, NO3� con-
centrations followed a dilution trajectory, but the minimum concentrations occurred before the throughfallmaxima. The patterns in DOC, SO4
2�, and base cations for the 8 June event were similar to those observedfor the 27 July and 11 May events.
Copyright 2006 John Wiley & Sons, Ltd. Hydrol. Process. 20, 3423–3439 (2006)
3432 S. P. INAMDAR ET AL.
The major difference in solute patterns between the rainfall and snowmelt events was for NO3�. NO3
�concentrations (1–6 March, Figure 4) increased through the rising limb and peaked with the first peak indischarge and then decreased through the recession period. Concentrations of NH4
C, DON, and Al followedthe temporal pattern of NO3
� concentrations and the peak values of all these solutes coincided with maximumcontributions from the melting snowpack and VBRW. Concentrations for base cations and SO4
2� followedthe same temporal pattern as those observed for the rainfall events.
Annual and seasonal mass balances for water and solutes
We measured 895 mm of precipitation at Point Peter Brook from 1 May 2003 to 30 April 2004. Totalprecipitation measured at the nearest NADP weather station at Chautauqua, NY, for the same period was872 mm. Seasonal precipitation totals for spring, summer, fall, and winter were 262 mm, 244 mm, 274 mm,and 115 mm respectively. This indicates that about 13% of the total precipitation for the study period was inthe form of snow (115 mm). The average rainfall amounts for the sampled events during spring, summer, andfall were 13 mm, 11 mm and 18 mm respectively. The greatest 10 min rainfall intensities for these eventsaveraged 2Ð1 mm, 3Ð0 mm and 2Ð0 mm for spring, summer and fall respectively. Storm events in spring andfall were larger than in summer, but summer events were more intense.
Total stream discharge measured at the watershed outlet during the 12 month period was 609 mm, of which24% (146 mm) occurred during the 32 rain events (112 mm) and the large snowmelt event (34 mm). Thesampled storm events contributed to 32%, 41%, and 32% of the discharge during spring, summer and fall,respectively. Although highest hourly streamflow discharge peaks were observed in summer, daily dischargetotals were higher in spring (Figure 2).
Ca2C had the greatest export of any solute from the Point Peter Brook watershed, followed in order ofimportance by Mg2C, SO4
2�, NaC, and DOC (Table II). Seasonal patterns of export were closely linked withdischarge, with generally the highest export in the spring and the lowest exports in the summer. Storm eventsclearly had a major impact on solute budgets for total Al, DON, NH4
C, DOC, and KC, with contributions tothe annual budget being 81%, 49%, 48%, 36%, and 28% respectively (Table III). Seasonally, summer storm-event contributions were the highest for solutes, except for NH4
C (higher in fall) and NO3� (higher in spring)
(Table III). After summer, storm-event percentages for some solutes were higher in spring (DON), whereasfor others the contributions were higher in the fall (KC, Al, and DOC). Storm events did not contribute muchto the annual and seasonal budgets of NaC, Mg2C, Ca2C, and SO4
2�. Spring events clearly had a greater
Table II. Variation in stream solute fluxes and discharge during (S) and between storms (NS) in the Point Peter Brookwatershed during the study period of May 1, 2003 through April 30, 2004. Includes all 32 rain events and the large snowmelt
event
Spring Summer Fall Winter total Full period
S NS Total S NS Total S NS Total S NS Total
Discharge (mm) 76 163 239 33 46 79 37 78 115 176 146 463 609NH4
C (molc ha�1) 4 5 9 3 1 4 3 1 4 5 10 12 21NaC (molc ha�1) 169 514 683 85 186 271 95 329 424 573 349 1600 1950Mg2C (molc ha�1) 547 1650 2190 273 533 806 319 1000 1330 1790 1140 4980 6120KC (molc ha�1) 24 46 71 15 16 31 21 32 53 60 61 155 216Ca2C (molc ha�1) 1270 3400 4670 548 937 1480 663 1700 2360 3290 2480 9330 11 800Total Al (mol ha�1) 7 2 9 10 0 10 3 0 3 3 21 5 26NO3
� (molc ha�1) 21 39 60 7 16 23 5 17 23 43 34 115 149SO4
2� (molc ha�1) 513 1380 1890 225 401 626 271 750 1020 1590 1010 4120 5130DON (mol ha�1) 14 8 23 9 2 11 8 8 16 12 30 31 61DOC (mol ha�1) 200 308 507 136 88 224 161 153 314 317 497 866 1360DON (%) 36 15 25 47 11 29 50 31 37 20 41 20 26
Copyright 2006 John Wiley & Sons, Ltd. Hydrol. Process. 20, 3423–3439 (2006)

SOLUTE EXPORT FROM A GLACIATED FORESTED WATERSHED 3433
Table III. Percent contributions of storms events (32 rain events and onesnowmelt event) to solute budgets during spring, summer, fall, and the full
period from May 2003 to April 2004
Parameter Contribution (%)
Spring Summer Fall Full period
Discharge 32 42 32 24NH4
C 41 74 78 48NaC 25 31 22 18Mg2C 25 34 24 18KC 34 48 40 28Ca2C 27 37 28 21Total Al 82 100 100 81NO3
� 36 31 23 23SO4
2� 27 36 27 20DON 62 79 49 49DOC 39 61 51 36
impact on NO3� than events during other seasons. The percentage of nitrogen exported in DON form was
higher during storms than non-storm periods, and especially during the fall season (Table II).
Impact of selected large events on water and solute flux
Hydrologic data and solute data are presented in Tables IV and V respectively for six rain events and the6-day snowmelt event. These storm events produced a total of 89 mm of streamflow, which amounted to15% of the discharge measured during the study period. The largest event discharge (33Ð7 mm) was generatedduring the long snowmelt event. Water yields associated with the rain events ranged from a low of 19%after a dry period (AWI D 29Ð7 cm) in early fall (15 October) to a high of 52% (19 November) duringwet (AWI D 4Ð5 cm) fall conditions. The highest streamflow discharge totals associated with rain events weregenerated during the spring and late-fall events of 12 April 2004 (16 mm) and 28 November 2003 (11Ð9 mm).And the two consecutive summer events of 24 and 27 July 2003 produced the highest hourly discharge peaks(1Ð49 mm h�1 and 1Ð54 mm h�1 respectively).
Budgets for selected solutes (NH4C, KC, NO3
�, DON and DOC) were computed for the storm events.Although the events made up only 15% of the total streamflow discharge, their contributions to solute budgetswere substantial. Combined, these seven events contributed to 64% of the annual total Al, 39% of the DON,34% of the NH4
C, 24% of the DOC, and 19% of the KC. However, contribution of NO3� load during the
seven events was just 13%, i.e. lower than the discharge contribution.The 6-day snowmelt produced the largest event export of NH4
C, KC, NO3� and DOC of any event
(1Ð4 molc ha�1, 11Ð3 molc ha�1, 11Ð4 molc ha�1 and 77 mol ha�1 respectively). NO3� export, especially,
Table IV. Selected large storm events and their hydrologic parameters
Season Date Rain(mm)
API7(mm)
AWI(cm)
Discharge(mm)
Wateryield (%)
Peak discharge(mm h�1)
Spring 1–6 March 2004 — 0 8Ð0 33Ð7 — 0Ð5712 April 2004 39Ð6 0Ð25 2Ð1 16 40 0Ð67
Summer 24 July 2003 17Ð5 39Ð1 31Ð2 7Ð4 42 1Ð4927 July 2003 21Ð1 47Ð5 12Ð6 6Ð6 31 1Ð54
Fall 15 October 2003 32Ð1 0 29Ð7 6Ð1 19 0Ð619 November 2003 15Ð0 27Ð1 4Ð5 7Ð7 52 0Ð5328 November 2003 33Ð3 15Ð2 10Ð5 11Ð9 36 1Ð02
Copyright 2006 John Wiley & Sons, Ltd. Hydrol. Process. 20, 3423–3439 (2006)

3434 S. P. INAMDAR ET AL.
Table V. Solute loads and concentrations for the selected storm events
1–6Mar 04
12Apr 04
24Jul 03
27July 03
15Oct 03
19Nov 03
28Nov 03
Total % ofannual
Discharge (mm) 33Ð7 16 7Ð4 6Ð6 6Ð1 7Ð7 11Ð9 89Ð4 15NH4
C (molc ha�1) 1Ð4 1 1Ð2 1 0Ð5 0Ð4 1Ð4 6Ð9 34KC (molc ha�1) 11Ð3 5Ð8 4Ð2 3Ð5 4Ð9 4Ð3 6Ð4 40Ð4 19Total Al (mol ha�1) 2 4Ð2 4Ð9 2Ð6 0 0Ð8 2Ð1 16Ð6 64NO3
� (molc ha�1) 11Ð4 3Ð3 1Ð6 1Ð2 0Ð4 1 1Ð8 20Ð7 13DON (mol ha�1) 4Ð2 6Ð4 4Ð1 3Ð1 2Ð1 1Ð5 2Ð5 23Ð9 39DOC (mol ha�1) 77 51 40 36 35 30 52 321 24Flow-weighted concentrationsNH4
C (µmolc l�1) 4 7 17 16 9 5 12KC (µmolc l�1) 33 36 56 53 81 56 54Total Al (µmol l�1) 6 26 67 39 0 11 18NO3
� (µmolc l�1) 34 21 21 18 6 13 15DON (µmol l�1) 13 40 55 47 36 19 21DOC (µmol l�1) 229 319 547 540 584 392 439Maximum changea from pre-storm valuesNH4
C (%) 240 260 3200 2100 1600 1200 1900KC (%) 29 52 250 100 120 90 81Total Al (%) 36 000 170 000 1 000 000 330 000 n.a. 92 000 130 000NO3
� (%) 61 �16 �86 �71 �92 �57 �34DON (%) 1200 30 000 6300 2200 1700 1200 760DOC (%) 120 170 370 350 210 170 170
a Change (%) D (peak event value � pre-storm value) ð 100/pre-storm value; n.a.: not available/measured.
during this snowmelt event was considerably more (8% of annual total) than for the other events. Thesnowmelt event also contributed the largest combined flux of nitrogen species (Table V). Excluding the eventof 12 April, exports of total Al and DON were largest from the intense summer events. The highest exportsof NH4
C, KC, and DOC for rainfall events were associated with the fall event of 28 November 2003.The largest percentage difference between pre-storm and peak event solute concentrations were observed
for total Al and DON (Table V). Total Al values before storms were always below non-detect levels (set atnon-detect levels for these computations), resulting in the high percentages in Table V. The largest increasefor NH4
C, total Al, and DOC was seen for the summer events. A dramatic increase in DON concentrationswas seen for the 12 April event, with high percentage increases for the summer events. Summer and theearly-fall (15 October) event registered the largest drop in concentrations for NO3
�.
DISCUSSION
How do solute patterns vary within storm events and what are the likely sources and mechanisms responsiblefor solute export? Do event solute patterns vary with seasons and event size?
The EMMA results showed that streamflow was composed of three sources of runoff, each of whichcontributed at specific periods during the storm event. Prior to an event, streamwater was a mixture of SGWand VBRW; throughfall contributions were elevated on the latter half of the rising limb, whereas VBRWamounts dominated the receding limb. This conceptual model was confirmed by Inamdar and Mitchell (2006)by comparing the timing of VBRW contributions against groundwater elevations measured in valley-bottomriparian areas. Groundwater elevations reached a peak (closest to the surface) after the discharge peak andwere sustained at elevated levels through the hydrograph recession, supporting our EMMA observations ofdelayed VBRW contributions. The quick expression of throughfall water on the rising limb was attributed
Copyright 2006 John Wiley & Sons, Ltd. Hydrol. Process. 20, 3423–3439 (2006)
SOLUTE EXPORT FROM A GLACIATED FORESTED WATERSHED 3435
to the interception of rainfall/throughfall on channel and riparian saturated areas and rapid delivery alongsurficial flow paths (Inamdar and Mitchell, 2006). The delayed expression of VBRW on the recession limbwas attributed to the displacement of VBRW by subsurface hillslope flux initiated by infiltrating rain waters(Inamdar and Mitchell, 2006). Results for the three rainfall events also show that events with the largerdischarge peaks (27 July > 11 May > 8 June) had greater contributions of VBRWs. However, a consistentpattern for throughfall amounts was not apparent across the three events.
The temporal patterns of solutes showed some consistent differences, and when compared with the runoffsource contributions provide some important insights into how runoff sources are likely influencing theexports of solutes during storm events. The difference between the solute trajectories was more pronouncedfor the larger events (e.g. 27 July). Across all three rain events, NH4
C, DON and total Al concentrationsincreased and reached peak concentrations prior to DOC. For the events of 27 July and 11 May these solutepatterns also matched the rise and peak in throughfall concentrations. Watershed concentrations of solutesin Table I also indicate that the highest concentrations of NH4
C, DON, and total Al were recorded forthroughfall, rainfall and near-surface waters. DOC concentrations were also high in throughfall, VBRW, andnear-surface waters (Table I), but the peak DOC concentrations always lagged behind the peak in NH4
C andDON values. Observations made for smaller subcatchments in this watershed indicated a consistent sequencein peak concentrations for the two nitrogen species: the NH4
C peak was followed by DON and later by DOC(Inamdar and Mitchell, In preparation). Furthermore, the rise and peak in DOC concentrations was found tobe in agreement with the rise in groundwater elevations recorded in valley-bottom riparian wells (Inamdar andMitchell, 2006). Based on these observations, we hypothesize that NH4
C concentrations in this watershed arebeing regulated primarily by throughfall, whereas DOC concentrations are influenced by contributions of boththroughfall and near-surface soil waters from valley-bottom riparian areas. The match between valley-bottomgroundwater elevations and DOC concentrations suggest that elevated DOC exports occur when groundwaterrises up in the valley-bottom riparian areas and displaces-out the DOC from the near-surface horizons at theselandscape positions. We believe the control/influence of throughfall and VBRW on DON concentrations issomewhere between that observed for NH4
C and DOC. It is likely that the forest floor or litter layer also hasa role to play in the exports of DON.
Vanderbilt et al. (2003) reported the highest DON concentrations preceding the discharge peak for fallstorms and attributed it to the flushing of solutes generated by partially decomposing litter. The importanceof forest floor or the litter layer as a source for DON has also been reported elsewhere (Yavitt and Fahey,1984; Qualls et al., 1991). However, Hagedorn et al. (2000) observed that both DOC and DON concentrationsreached peak values following the discharge peak, attributing this to the delayed expression of solute-richtopsoil waters. Furthermore, Hagedorn et al. (2000) performed EMMA separations in their study and foundthat rainfall contributions occurred on the rising limb of the hydrograph whereas topsoil waters were expressedlater during the recession limb. Hill (1993) observed NH4
C peaks on the rising limb and attributed this to thehigh concentrations measured in throughfall.
The pattern of total Al concentrations during events was similar to that observed for DON. We believethe mechanisms that regulate the DON release in our watershed also influence the exports of total Al. Theforest floor has been identified as an important contributor to total Al (Palmer et al., 2005) and could be alikely factor influencing the total Al concentrations we observed in this study. However, in contrast to ourobservations, Soulsby (1995) reported Al peaks following the discharge peaks.
NO3� concentrations displayed varying patterns across the rainfall and snowmelt events. Within watershed
compartments, NO3� was highest in SGW, throughfall and the snowpack (Table I). We hypothesize that
the increase ion NO3� concentrations and the peak in concentrations close to discharge peak was due high
NO3� contribution from the melting snowpack (Table I) and the flushing of NO3
� accumulated in the soilover the dormant winter period. Creed and Band (1998b) also found a NO3
� peak on the rising limb ofthe hydrograph and attributed this pattern to flushing of NO3
� from surface soils by rising water tables. Incontrast to the snowmelt event, NO3
� concentrations during the large 27 July rain event showed a cleardilution trend from the outset of the event, with a minimum on the rising limb followed by a subsequent
Copyright 2006 John Wiley & Sons, Ltd. Hydrol. Process. 20, 3423–3439 (2006)

3436 S. P. INAMDAR ET AL.
recovery in concentrations. The dilution trend in NO3� was not that apparent for the smaller two rain events.
Rather, both events showed slight increases in NO3� concentrations at the outset of the event. We attribute
this behaviour to the relative trends and mixing of throughfall and SGW amounts. SGW had the highestNO3
� concentrations across all watershed compartments, followed by throughfall (Table I). When the relativecontributions of SGW to streamflow were high and when there was a slight increase in SGW amounts atthe start of the event, a slight rise in NO3
� concentrations was observed. In contrast, for large events (like27 July), where SGW amounts dropped rapidly and large contributions of VBRW occurred (low in NO3
�),the streamflow NO3
� concentrations followed a distinct dilution curve. Inamdar et al. (2004), working ona watershed in the Adirondack Mountains of New York State, also observed an NO3
� peak early on therising limb and attributed the peak to the displacement of NO3
�-rich till waters by infiltrating precipitation.Increases in NO3
� concentrations at the outset of the event were also observed by Hill (1993), who attributedthis to the mixing of NO3
�-rich throughfall and local groundwaters.The sum of base cations and SO4
2� showed consistent and similar dilution trends across all events.Concentrations for these solutes were lowest in throughfall and highest in VBRW and SGW. Hence, therelative proportions of these end-members dictated the event concentrations, with values reaching a minimumwhen throughfall amounts were at their maximum.
What is the impact of storm events on annual and seasonal solute exports? Which solutes are impacted themost?
Storm events clearly had a large impact on the exports of some solutes. Storm-event concentrations ofNHC
4 , KC, total Al, DON and DOC, were always greater than the corresponding baseflow values, resultingin high exports of these solutes during the year’s largest storms. On an annual basis, large proportions ofthe total Al (81%), DON (49%), NH4
C (48%), DOC (36%), and KC (28%) were exported during storms.Furthermore, the seven largest storm events combined for only 15% of the year’s discharge, but produced64% of the year’s exports of total Al, 39% of the annual DON, 34% of the year’s exports of NH4
C andone-fourth of the year’s exports of DOC.
Summer storms contributed more to the seasonal budget than storms in any other season. However,spring snowmelt also produced very high solute loads, mostly due to the elevated discharges associated withsnowmelt. Similar to Lawrence (2002), our observations highlight the importance of storm-event sampling,particularly during large events, in developing solute mass balance studies. Hinton et al. (1997) also foundstorms to be very important contributors to export budgets, even though their durations were short. In theirstudy, large proportions of DOC export occurred during high discharge conditions, and the contribution ofDOC export by stormflow sometimes exceeded that exported during baseflow. The impact of storm events onDOC has been noted in several studies: Butturini and Sabater (2000) observed that storm events contributedto only 39% of the annual water export, but generated 52% of the DOC export; Buffam et al. (2001) reportedthat storms contributing to 36% of the discharge were responsible for greater than 50% of the DOC budget;Hinton et al. (1997) found that 10% of the stream discharges were responsible for 41 to 57% of the totalautumn DOC export. Our result of 24% of the storm-event discharge generating 36% of the annual DOCis further support of the importance of storms in the export of DOC. In terms of total seasonal flux, DOCcontributions during spring were highest of all seasons.
Storm events had a greater impact on DON than on DOC export. Storms had a major impact on the exportof DON (26% of total nitrogen budget; Table III), with 40% and 20% (Table III) being exported during stormand non-storm periods respectively. For Gleysol-dominated catchments in Switzerland, Hagedorn et al. (2000)found that DON contributed to 60% of the total nitrogen export, and the contribution of DON increased whenstorm events were included in the analysis. McHale et al. (2000), monitoring a forested catchment (135 ha) inthe Adirondack Mountains of New York State, found that DON contributed to 36% of the annual nitrogen flux.However, they found that the DON budget was reduced by 18 mol ha�1 year�1 when budgets were computedusing event-based sampling versus using only biweekly sampling. These results vary from the current study,which clearly showed that DON contributions are higher during storm events.
Copyright 2006 John Wiley & Sons, Ltd. Hydrol. Process. 20, 3423–3439 (2006)

SOLUTE EXPORT FROM A GLACIATED FORESTED WATERSHED 3437
How do solute patterns vary across storms occurring in different seasons and with varying magnitude andantecedent conditions?
Spring (including snowmelt) and late-fall events with wet antecedent conditions generated the highestdischarge volumes, whereas the high-intensity summer events produced the highest hourly discharge values.Although the spring and fall events were responsible for a larger proportion of annual solute exports, highsolute concentrations, especially for DON, DOC, Al, KC, and NH4
C, were associated with intense summerand early-fall events.
The snowmelt event, which produced the highest NH4C, KC, NO3
� and DOC loads for the study period,underscores the need for monitoring such melt events closely. The elevated exports of NO3
� and DOCduring spring snowmelt events resulted from two key conditions: the elevated wetness conditions and theavailability of NO3
� and DOC in the snowpack and surficial soil layers following the dormant winter period.However, the spring snowmelt did not yield the highest total Al and DON loads, both of which were generatedduring high-discharge summer and fall events. The high concentrations of DON, DOC, Al, KC, and NH4
Cwith summer/early-fall events can be attributed to two factors. First, the high intensity of the summer/fallevents resulted in greater surface runoff (as seen in the high proportions of VBRW for these events) and,therefore, more leaching of forest-floor humic material and a greater delivery of sediment and forest-floorhumic materials to streamflow. Second, there were larger fluctuations in groundwater elevations, and thereforeantecedent conditions, during summer and early-fall periods. Thus, during the summer and fall, soils weresubjected to more cycles of ‘accelerated drying and wetting’ (quicker drying of soils by high evapotranspirationand quicker rewetting because of rain intensity). These rapid changes in soil moisture status would enhancemineralization rates, e.g. the event of 15 October, which with the driest antecedent conditions producedthe highest concentrations of DOC. A similar pattern of higher solute concentrations after dry antecedentconditions has been reported by Biron et al. (1999).
The response of solutes to antecedent conditions may differ across solutes. The intense sequential summerevents of 24 and 27 July produced high concentrations of DOC (547 µmol l�1 and 540 µmol l�1 respectively;Table V), but lower than those for the storms of 15 October. Despite the high discharge peaks that occurredwithin 3 days of each other, DOC concentrations were similar, suggesting that the watershed had a fairlylarge reservoir of DOC. In comparison, some depletion was observed in DON for the two storms (55 to47 µmol l�1), suggesting that DON storage in the watershed was lower than DOC or that the flowpathsdiffered between these two solutes.
The most intense events with high peak discharges yielded the highest solute concentrations, although theactual patterns differed among solutes. For example, DON concentrations showed a much sharper rise withincreasing peak discharge than DOC. Ito et al. (2005) have also found different relationships for DOC andDON, suggesting that different flowpaths may be affecting how these solutes enter surface waters (Ito et al.,2005).
CONCLUSIONS
The results from this study show that within-event temporal patterns of solute concentrations vary betweensolutes. Moreover, the same solute (e.g. NO3
�) can produce very different patterns for events occurring indifferent seasons. These observations have important implications for solute exports from watersheds andneed to be accounted for when developing discharge–concentration regression relationships (Arheimer et al.,1996) or equations used for budget computations (Swistock et al., 1997).
Storm events had a greater impact on the exports and budgets of some solutes (NH4C, KC, total Al, DON
and DOC). Concentrations for all of these solutes were high in surficial watershed compartments (throughfall,near-surface and riparian water), indicating that solutes from these sources are more vulnerable and arepreferentially exported during storm events. Even within this group, storm events had a disproportionatelygreater impact on the exports and concentrations of total Al and DON.
Copyright 2006 John Wiley & Sons, Ltd. Hydrol. Process. 20, 3423–3439 (2006)

3438 S. P. INAMDAR ET AL.
The response of solutes to storm intensity and antecedent conditions observed in this study has importantimplications for the long-term exports of these solutes from watersheds, especially under future climate-changescenarios. More intense and infrequent rain events, especially during the summer and fall seasons (associatedwith Atlantic and Gulf Coast hurricanes and tropical depressions), have been predicted as a part of the futureclimate-change scenarios (USGCRP, 2000). Considering our results, such climate-change-induced shifts instorm events will likely increase the exports of solutes like DOC, DON, NH4
C, Al and KC from watersheds.
ACKNOWLEDGEMENTS
This research was sponsored by the USDA–NRI Watershed Processes Section through an award to S. Inamdar.We greatly appreciate the support of Julia Graham with sample collection and data analysis. We would alsolike to thank Pat McHale and David Lyons for their assistance with laboratory sample analyses. Special thanksare due to the Town of Gowanda and the Gowanda Water Department employees who allowed us access tothe Point Peter Brook watershed.
REFERENCES
Ameel JJ, Axler RP, Owen CJ. 1993. Persulfate digestion for determination of total nitrogen and phosphorus in low-nutrient waters. AmericanEnvironmental Laboratory 10: 1–111.
Arheimer B, Andersson L, Lepisto A. 1996. Variation of nitrogen concentration in forest streams—influences of flow, seasonality andcatchment characteristics. Journal of Hydrology 179: 281–304.
Biron PM, Roy AG, Courschesne F, Hendershot, WH, Cote B, Fyles J. 1999. The effects of antecedent moisture conditions on therelationship of hydrology to hydrochemistry in a small forested watershed. Hydrological Processes 13: 1541–1555.
Boyer EW, Hornberger GM, Bencala KE, McKnight DM. 1997. Response characteristics of DOC flushing in an alpine catchment.Hydrological Processes 11: 1635–1647.
Buffam I, Galloway JN, Blum LK, McGlathery KJ. 2001. A stormflow/baseflow comparison of dissolved organic matter concentrations andbioavailability in an Appalachian stream. Biogeochemistry 53(3): 269–306.
Burns DA, Murdoch PS, Lawrence GB, Michel RL. 1998. Effect of groundwater springs on NO3� concentrations during summer in Catskills
Mountains streams. Water Resources Research 34: 1987–1996.Burns DA, McDonnell, JJ, Hooper, RP, Peters, NE, Freer JE, Kendall C, Beven K. 2001. Quantifying contributions to storm runoff through
end-member mixing analysis and hydrologic measurements at the Panola Mountain Research Watershed (Georgia, USA). HydrologicalProcesses 15: 1903–1924.
Butturini A, Sabater F. 2000. Seasonal variability of dissolved organic carbon in a Mediterranean stream. Biogeochemistry 51(3): 303–321.Christopherson N, Hooper RP. 1992. Multivariate analysis of stream water chemical data: the use of principal component analysis for
end-member mixing problem. Water Resources Research 28: 99–107.Creed IF, Band LE. 1998a. Exploring similarity in the export behavior of nitrate-N from forested catchments: a mechanistic modelling
approach. Water Resources Research 34: 3079–3093.Creed IF, Band LE. 1998b. Export of nitrogen from catchments within a temperate forest: evidence for a unifying mechanism regulated by
variable source area dynamics. Water Resources Research 34(11): 3105–3120.Hagedorn F, Schleppi P, Waldner P, Fluhler, H. 2000. Export of dissolved organic carbon and nitrogen from Gleysol dominated
catchments—the significance of water flow paths. Biogeochemistry 50: 137–161.Hill AR. 1993. Nitrogen dynamics of storm runoff in the riparian zone of a forested watershed. Biogeochemistry: 20: 19–44.Hinton MJ, Schiff SL, English MC. 1997. The significance of storms for the concentration and export of dissolved organic carbon from two
Precambrian Shield catchments. Biogeochemistry 36: 67–88.Inamdar SP, Mitchell, MJ. 2006. Hydrologic and topographic controls on storm-event exports of dissolved organic carbon and nitrate across
catchment scales. Water Resources Research in press.Inamdar SP, Christopher S, Mitchell MJ. 2004. Export mechanisms for dissolved organic carbon and nitrate during summer storm events in
a glaciated forested catchment in New York, USA. Hydrological Processes 18: 2651–2661.Ito M, Mitchell MJ, Driscoll CT, Roy KM. 2005. Nitrogen input–output budgets for lake-watersheds in the Adirondack region of New
York. Biogeochemistry 72: 283–314.Kirchner JW, Feng X, Neal C, Robson AJ. 2004. The fine structure of water-quality dynamics: the (high-frequency) wave of the future.
Hydrological Processes 18: 1353–1359.Lawrence GB. 2002. Persistent episodic acidification of streams linked to acid rain effects on soil. Atmospheric Environment 36: 1589–1598.McClain ME, Boyer EW, Dent CL, Gergel SE, Grimm NB, Groffman PM, Hart SC, Harvey JW, Johnston CA, Mayorga E, McDowell WH,
Pinay G. 2004. Biogeochemical hot spots and hot moments at the interface of terrestrial and aquatic ecosystems. Ecosystems 6: 301–312.McHale MR, Mitchell MJ, McDonnell JJ, Cirmo CP. 2000. Nitrogen solutes in an Adirondack forested watershed: importance of dissolved
organic nitrogen. Biogeochemistry 48: 165–184.
Copyright 2006 John Wiley & Sons, Ltd. Hydrol. Process. 20, 3423–3439 (2006)

SOLUTE EXPORT FROM A GLACIATED FORESTED WATERSHED 3439
McHale MR, McDonnell JJ, Mitchell MJ, Cirmo CP. 2002. A field-based study of soil water and groundwater nitrate release in an Adirondackforested watershed. Water Resources Research 38(4): 2-1–2-16.
Mitchell MJ, McGee G, McHale P, Weathers KC. 2001. Experimental design and instrumentation for analyzing solute concentrations andfluxes for quantifying biogeochemical processes in watersheds. In Methodology Paper Series of the 4th International Conference on ILTERin East Asia and Pacific Region, ILTER Network: Ulaanbaatar-Hatgal, Mongolia; 15–21.
Mitchell MJ, Piatek KB, Christopher S, Mayer B, Kendall C, McHale P. 2006. Solute sources in stream water during consecutive fall stormsin a northern hardwood forest watershed: a combined hydrological, chemical and isotopic approach. Biogeochemistry in press.
Mollitor AV, Raynal DJ. 1982. Atmospheric deposition and ionic movements in Adirondack forest soils. Soil Science Society of AmericaJournal 46: 1032–1036.
NADP. 2004. NADP weather site. http://nadp.sws.uiuc.edu/sites/siteinfo.asp?netDNTN&idDNY10 [accessed February 2006].Palmer SM, Wellington BI, Johnson CE, Driscoll CT. 2005. Landscape influences on aluminium and dissolved organic carbon streams
draining the Hubbard Brook valley, New Hampshire, USA. Hydrological Processes 19: 1751–1769.Phillips RA. 1988. Relationship between glacial geology and streamwater chemistry in an area receiving acid deposition. Journal of Hydrology
101: 267–273.Qualls RG, Haines BL, Swank WT. 1991. Fluxes of dissolved organic nutrients and humic substances in a deciduous forest. Ecology 72:
254–266.Soulsby C. 1995. Contrast in storm event hydrochemistry in an acidic afforested catchment in upland Wales. Journal of Hydrology 170:
159–179.Swistock BR, Edwards PJ, Wood F, Dewalle DR. 1997. Comparison of methods for calculating annual solute exports from six forested
Applachian watersheds. Hydological Processes 11: 655–669.USGCRP. 2000. Climate change impacts on the United States: the potential consequences of climate variability and change. US Global
Change Research Program, Washington, DC. http://www.usgcrp.gov/usgcrp/Library/nationalassessment/overview.htm [accessed February2006].
Vanderbilt KL, Lajtha K, Swanson FJ. 2003. Biogeochemistry of unpolluted forested watersheds in the Oregon Cascades: temporal patternsof precipitation and stream nitrogen fluxes. Biogeochemistry 62(1): 87–117.
Wellington BI, Driscoll CT. 2004. The episodic acidification of a stream with elevated concentrations of dissolved organic carbon.Hydrological Processes 18: 2663–2680.
Wigington Jr PJ, Davis TD, Tranter M, Eshleman KN. 1990. Episodic acidification of surface waters due to acidic deposition, NAPAPReport 12. In Acidic deposition: state of science and technology. National Acidic Precipitation Assessment Program, Washington, DC.
Yavitt JB, Fahey TJ. 1984. An experimental analysis of soil solution chemistry in a lodgepole pine forest floor. Oikos 43: 222–234.
Copyright 2006 John Wiley & Sons, Ltd. Hydrol. Process. 20, 3423–3439 (2006)