the impact of technology accumulation on technical ... · use of cad at the design stage 15 the...
TRANSCRIPT

1
The Impact of Technology Accumulation on Technical Efficiency: an Analysis of the Sri Lankan Clothing and Agricultural Machinery Industries. SONALI DERANIYAGALA1 ABSTRACT This paper examines the effects of technology accumulation on firm-level technical efficiency in the Sri Lankan clothing and agricultural machinery industries, using cross-section survey data. Econometric analysis of the economic effects of technology development in developing countries is limited and this paper seeks to address this gap in the literature. The analysis shows simple adaptive technical change to have a significant and positive effect on efficiency in both industries. In addition, variables relating to technological skills and training also emerge as significant determinants of firm-level efficiency.
1. Introduction
In recent years there has been increased interest in the issue of technology accumulation in
developing countries. Empirical research has drawn attention to two aspects of technology
accumulation; technical change and the acquisition of technological capabilities (Lall, 1993;
Evenson and Westphal, 1995). The fact that technology accumulation by developing country
firms who do not innovate at the global technology frontier is largely incremental and
adaptive has been emphasised (Bell and Pavitt, 1993).
This recent literature has implications for analysing the economic performance of firms in
developing countries. Recent theoretical models, in particular those in the evolutionary
tradition, have demonstrated that incremental technology accumulation can have a positive
impact on firm-level efficiency and productivity. Empirical research on this issue, however,
is limited. While micro-econometric research on industrialised countries has shown
technology accumulation involving formal Research and Development (R&D) to promote
efficiency at the firm level (Hanusch and Hierl, 1992; Caves and Barton, 1990), these
methodologies have rarely been used to investigate the economic impact of informal
technology accumulation in developing countries. Some qualitative case studies of individual
1 Sonali Deraniyagala, Department of Economics, SOAS, Thornhaugh Street, Russell Square, London WC1H OXG, UK. The author wishes to thank Frances Stewart, Sanjaya Lall and Martin Bell for comments on earlier versions of the paper.

2
firms in developing countries have shown technology accumulation to be positively related to
firm performance (Katz, 1987; Dahlman and Fonseca 1987), but wider generalization from
these studies is limited.
This paper addresses this gap in the literature by investigating the effects of technology
accumulation on technical efficiency among clothing and agricultural machinery producers in
Sri Lanka. Cross-section survey data is used to test the hypothesis that the two aspects of
technology accumulation – technical change and technological capability acquisition – have a
positive impact on technical efficiency. The clothing and agricultural machinery industries
were chosen for two reasons. Firstly, given that clothing is an important entry level export
industry for most developing countries, and light engineering sectors such as agricultural
machinery produce generic skills and other externalities, testing the technology-efficiency link
in these industries can have wider general implications. Secondly, both industries use
relatively simple technologies and the proposed analysis provides a useful counterpoint to
earlier qualitative research which focused on technologically advanced industries such as
precision engineering, steel and cement.
The paper is organised as follows. Section 2 deals with data and definitions. Section 3
estimates firm-specific technical efficiency using a stochastic frontier model. Section 4 sets
out the hypotheses relating to the determinants of technical efficiency and undertakes the
econometric analysis of these hypotheses. Section 5 provides conclusions.
2. Data and Definitions
We focus on two aspects of technology accumulation: incremental technical change and
technological capability acquisition. Incremental technical change is defined as minor change
undertaken to adapt and improve a given ‘core’ technology- i.e. the technology used in the
main stage of a firm’s production process. It includes the adoption of equipment which
enhances the performance of core technologies, minor adaptive changes to core
technologies, technology upgrading in peripheral stages of production (such as design), as
well as improvements in inventory control, quality control and production planning.

3
Technological capabilities are defined as the skills and knowledge related to such technical
change.
The analysis in this paper is based on data for a cross-section of Sri Lankan firms in the
clothing and light engineering industries, gathered from a field survey undertaken in 1993.
The sample includes 40 firms in the clothing industry and 35 firms in light engineering. The
measure of technical efficiency used assumes that firms produce homogeneous products (see
Section 3). To be consistent with this assumption each industry sample contains firms
making broadly similar product lines.
The dataset contains detailed technology-related information as well as production and
financial details required to estimate technical efficiency. The capital, labour and output
information relating to technical efficiency is for a single period, the year 1992. The
information about various types of incremental change and technical and technological
capability relate to the 5 years prior to 1992, the period 1987-1992. The technical change
information is described in more detail below.
2.1 A Profile of Incremental Technical Change
The dataset contains information on the types of incremental technical change undertaken
by firms during the five year period 1987-1992. The patterns of incremental change
observed in each industry are summarised in Table 1. They are classified into two categories
- ‘simple’ and ‘complex’ - according to the degree of technological complexity involved.1

4
Table 1 : A Profile of Technical Change The Clothing Industry Type of Technical Change % of firms undertaking change Simple Change Use of specialised machines 66 Use of equipment to improve fabric handling 30 Upgrading quality control 45 Upgrading inventory control 55 Computerised production planning 12 Complex Change Use of CAD at the design stage 15 The Agricultural Machinery Industry Type of Technical Change % of firms undertaking change Simple Change Substitution of raw materials 44 Improving components 35 Modifying specifications of core machines- 53 Changing plant layout 53 Complex Change Use of CAD at the design stage 7
The clothing industry is ‘supplier dominated’ and technical change mainly involves the
adoption and assimilation of new equipment (Hoffman and Rush, 1987). Light casual wear is
the main product. ‘Simple’ change included the addition of equipment with potential to
enhance the productivity of the core technology (in this case, industrial sewing machines).
For instance, equipment to fold fabric and to reduce handling was introduced by around a
third of the sample. A high proportion of firms also introduced simple specialised machines
which can increase productivity in small tasks such as button-hole and collar stitching.
Upgrading quality control and inventory control systems and the introduction of
computerised production planning were other types of ‘simple’ change observed.
5
A small proportion of firms in the sample introduced computerised equipment for grading
fabric and for making guides for cutting. This type of technology is fairly sophisticated and its
adoption is classified as ‘complex’ technical change.
For agricultural machinery the types of technical change observed are summarised in
Table 1, where the level of technological complexity is also indicated. Most firms in this
industry made such products as small hand tools, pumps, power tillers, sprayers, threshers
and shellers. They undertook basic cutting, bending, forging and welding operations using
general purpose tools and simple, powered equipment. In this industry, simple change to
alter and modify the core production technology was fairly common. Around 40 per cent of
firms undertook in-house efforts to improve the quality and performance of inputs and
components. This was accompanied by efforts to alter production processes to cope with
new materials and inputs. Efforts to extend and ‘stretch’ the life of capital equipment were
also noted. Other types of simple change included changing plant layout to reduce time and
effort spent on moving materials
In addition, a minority of firms introduced computer-aided technology at the design stage.
This was the only form of ‘complex’ incremental change undertaken in this industry.
2.2 The Model of Technical Efficiency
Prior to investigating the impact of technology accumulation on technical efficiency, this
section sets out the model to be used for this purpose and derives a firm-specific efficiency
measure.
Technically efficient production is defined as achieving the maximum attainable quantity of
output from given inputs. The microeconomic concept of technical efficiency is based on the
frontier production function which defines the maximum potential output which can be
achieved by firms, given a specified mix of inputs and technology (Aigner, Lovell and
Schmidt, 1977; Meeusen and van den Broeck, 1977). Deviations from this maximum

6
output are ascribed to technical efficiency. Firm-level technical efficiency in a given industry
is measured relative to the best performing firms in that industry.
Estimating technical efficiency first involves estimating a frontier production function. This
can be done using two alternative methodologies; deterministic and stochastic models. The
deterministic model envelops the data from above by drawing a convex hull around all the
observed production points. This has the drawback of assuming that all deviations from the
maximum are due to technical inefficiency. Therefore, errors in data measurement and other
random disturbances in the dependent variable are interpreted as indicating technical
inefficiency.
The stochastic model overcomes these problems. It is based on the assumption that the
frontier production function depends on production and technology-related parameters as
well as random disturbances. Therefore measurement error and noise in the data are taken
into account. A stochastic frontier model is used here to derive firm-specific technical
efficiency.
The model assumes a function relating the maximum possible output to certain inputs,
such that, for a given firm i.
yi = f (x i,β ) +ε i (1) where i= 1....n ; yi is output for observation i, xi is a vector of inputs for observation i;β is a
vector of parameters and ε i is a statistical random disturbance term for observation i.
Consider now a situation where the ith firm does not produce on its frontier, but
somewhere below it, thereby obtaining an output less than its maximum potential. This
‘slackness in production’ is seen to be caused by various factors which are not included in
Eq 1, and is represented by the disturbance term ε. The stochastic model postulates that this
disturbance term is made up of two independent components
ε i = v i - ui (2)

7
where v i ~N(0, σ2v ) is a two sided error term representing the statistical noise found in any
regression equation and ui.≥ 0 is the one-sided error component representing technical
inefficiency.
The one-sided error term, u, in Eq (2) is defined in such a way that it takes the value zero
or less than zero. If u takes the value zero, this means that there is no inefficiency in
production and the ith firm is technically efficient and produces its maximum potential output.
On the other hand, when u takes the value less than zero, this implies that there is
inefficiency in the ith firms production and it produces less than its maximum possible output.
The magnitude of the value of u specifies the ‘efficiency gap’; that is, how far a given firm’s
output is from its potential output. Thus for a given firm,
Technical Efficiency (TE) = actual output
potential output
In order to compute technical efficiency it is, therefore, necessary to estimate potential
output, which can be done by the econometric estimation of the stochastic frontier
production function. From this production function, firm-specific measures of technical
efficiency (u) are derived. The formal method of doing this is well explained in Jondrow et al
(1982) and is briefly shown in the Appendix. TE derived in this way, therefore, indicates the
ratio of observed output to frontier output for individual firms. It can also be interpreted as
the conventional measure of total factor productivity at the firm-level.
3. Empirical Estimation of Efficiency
We estimate firm-specific technical efficiency using the stochastic frontier production
function methodology. The frontier production function adopted in this paper is :
LnQ= + LnK + LnL + VINT+v +u
The Cobb-Douglas representation was adopted as the functional form.2 The dependent
variable, LnQ, is the natural logarithm of value added, with LnK and LnL as the natural

8
logarithms of the capital and labour measures respectively. Capital is measured in terms of
historic costs3. The capital stock measure was turned into a flow of capital services using the
annuity formula assuming a discount rate of 10%. Labour was measured in terms of
'unskilled equivalent person days' which combines skilled and unskilled labour. The ratio of
skilled to unskilled wages was used for the conversion. VINT is a capital vintage variable
and is defined as the average age of the ‘core’ machinery used by a firm in the main stage of
production. The variable is commonly used when estimating frontier production functions in
order to control for the ‘level of technology’. All variables are for a single year, 1992.
The stochastic frontier model assumes a single ‘level of technology’. To make this
empirically operational only firms using ‘core technologies’ of the same level of complexity
were included in each industry sample. ‘Core technologies’ are defined as technologies used
in the main stage of production. Thus, in the clothing industry all firms used conventional
industrial sewing machines. In the agricultural machinery sector, all firms used general
purpose machine tools.4
The results of the estimation of the stochastic frontiers for the two industries are given in
Table 2. The method of estimation was maximum likelihood, using the
David-Fletcher-Powell algorithm. Starting values for the maximum likelihood estimates were
obtained from an initial Ordinary Least Squares (OLS) regression. Similar estimates are also
used to obtain starting values for the variance parameters of the model. The parameter
estimates for labour and capital have the expected signs and significance levels. The vintage
variable is not significant. This is likely to be a reflection of the fact that our study has already
controlled for the level of technology by restricting the samples to firms using similar
technologies. Particularly relevant for our analysis are the variance ratios, σ2u/σ2 . They are
0.83 and 0.79 and significant at the 1 per cent level in the clothing and agricultural
machinery industries respectively. This is interpreted as indicating that firm-specific technical
efficiency, rather than random factors, is responsible for the difference between the firm’s
potential and actual outputs. This implication depends on the statistical validity of both the
parameterisation of y in Equation 1 and the modelling of the firm-specific efficiency related
parameter u .
9
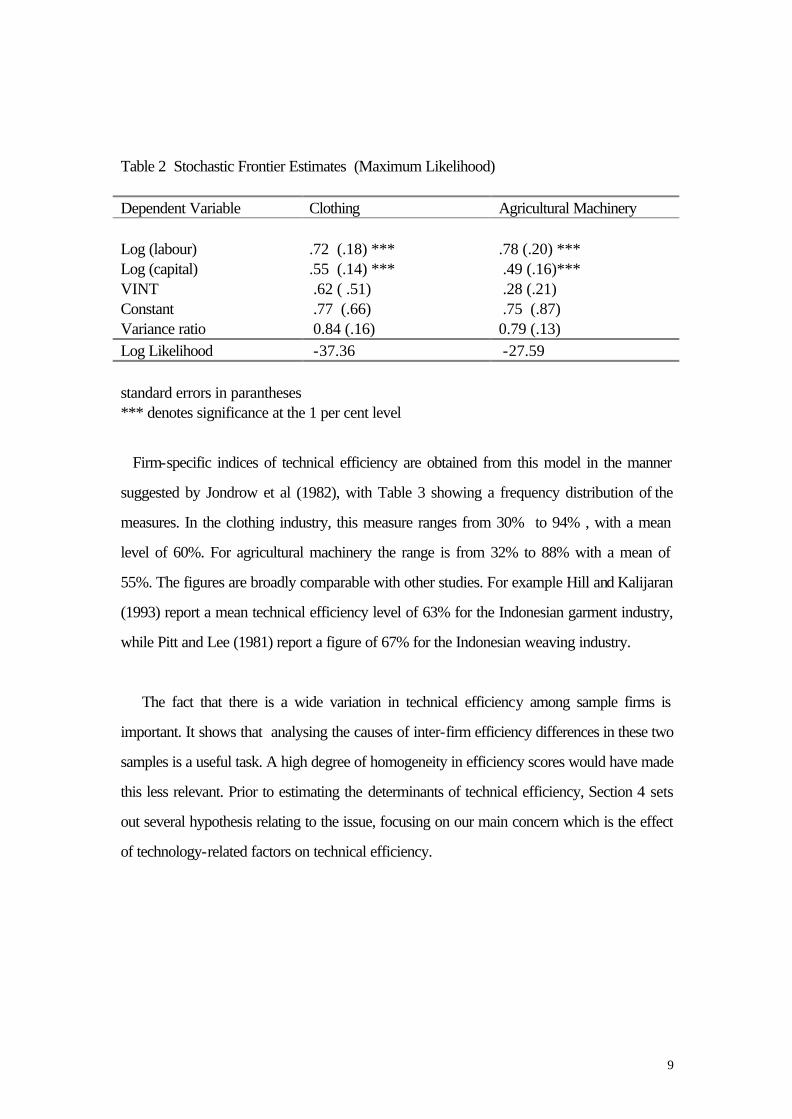
Table 2 Stochastic Frontier Estimates (Maximum Likelihood) Dependent Variable Clothing Agricultural Machinery Log (labour) .72 (.18) *** .78 (.20) *** Log (capital) .55 (.14) *** .49 (.16)*** VINT .62 ( .51) .28 (.21) Constant .77 (.66) .75 (.87) Variance ratio 0.84 (.16) 0.79 (.13) Log Likelihood -37.36 -27.59 standard errors in parantheses *** denotes significance at the 1 per cent level
Firm-specific indices of technical efficiency are obtained from this model in the manner
suggested by Jondrow et al (1982), with Table 3 showing a frequency distribution of the
measures. In the clothing industry, this measure ranges from 30% to 94% , with a mean
level of 60%. For agricultural machinery the range is from 32% to 88% with a mean of
55%. The figures are broadly comparable with other studies. For example Hill and Kalijaran
(1993) report a mean technical efficiency level of 63% for the Indonesian garment industry,
while Pitt and Lee (1981) report a figure of 67% for the Indonesian weaving industry.
The fact that there is a wide variation in technical efficiency among sample firms is
important. It shows that analysing the causes of inter-firm efficiency differences in these two
samples is a useful task. A high degree of homogeneity in efficiency scores would have made
this less relevant. Prior to estimating the determinants of technical efficiency, Section 4 sets
out several hypothesis relating to the issue, focusing on our main concern which is the effect
of technology-related factors on technical efficiency.

10
Table 3 Frequency Distribution of Technical Efficiency Scores TE Score % of firms clothing % of firms : Agric.
Machinery 30-40 15 23.3 41-50 17.5 26.6 51-60 27.5 20 61-70 20 13.3 71-80 10 10 81-95 10 6.6 Mean TE 60.3% 55%
4. The Impact of Technology Accumulation on Technical Efficiency
The initial focus is on two aspects of technology accumulation, technical change and the
acquisition of technological skills and capabilities.
4.1 Technical Change
Adaptive technical change is hypothesised to have a positive impact on firm-level technical
efficiency. Recent theoretical models postulate a positive link between adaptive technical
change and efficiency at the firm-level. In particular, evolutionary models of firm behaviour
show that firms using similar technologies can achieve varying levels of productivity because
technologies need to be operationalised and assimilated into firm-specific contexts (Nelson
and Winter 1982: Dosi 1997). This process involves adaptive technical change and it is
predicted that efficiency levels among firms using similar core technologies will be positively
related to the extent of adaptive technical change undertaken.

11
Two variables are used to capture adaptive technical change. The variable, MINOR,
captures simple adaptive change and is a dummy relating to whether a firm undertook at
least one of the ‘simple’ changes shown in Table 1 . The variable, COMPLEX, captures
more advanced types of adaptive change and is again a dummy relating to whether a firm
undertook any of the complex changes listed in the table. Both variables relate to efforts
undertaken over the period 1987-1992. As efficiency is estimated for the year 1992, we are
able to test the causality between technical change and efficiency in a fairly straightforward
manner.
4.2 Capabilities
The importance of technological capabilities in promoting manufacturing performance has
been emphasised by several analysts (Bell and Pavitt, 1993; Lall and Teubal, 1998). In
particular, the fact that even the simple types of manufacturing undertaken in developing
countries require industry-specific technological skills has been noted. It is also hypothesised
that technological capabilities have a positive impact on technical efficiency. Technological
capabilities are measured in terms of formal technical education and training using the
variable TECHED. In the clothing industry, this is defined as the proportion of a firm’s
workforce with formal qualifications in clothing technology. In the agricultural machinery
sector it refers to the proportion of the total workforce who are graduate engineers. Both
variables are averages for the period 1987-1992. This again allows us to test the direct
causal effects on efficiency in 1992.5
A high proportion of the firms in both industries were owner managed with decision making
power being highly centralised Therefore, we also hypothesise that the technological skills of
managers positively influence efficiency independently of workforce capabilities. The
variable TECHMAN captures the education and training of senior managers. In the clothing
industry, it is a dummy variable relating to whether any senior managers have a formal
qualification in clothing technology. In the agricultural machinery industry, it is a dummy
variable relating to whether any senior managers were graduate level engineers.

12
4.3 Other Determinants of Efficiency
In order to isolate the effects of technology accumulation on efficiency, we also examine the
effects of several other determinants conventionally used in studies of the sources of
technical efficiency.
Age of the Firm. The effects of firm age on efficiency are ambiguous. On the one hand, a
positive relationship can be expected due to learning-by-doing which occurs with cumulative
production experience. On the other hand, older firms may have older capital equipment and
may have developed inefficient production routines and practices, leading to a negative
impact of age on efficiency. The variable AGE is defined as the number of years since the
inception of the firm.
Exporting. It is hypothesised that exporting has a positive effect on technical efficiency as it
exposes firms to international competition and allows them to benefit from scale
economies. Previous studies have found export-orientation to improve efficiency at the firm
level (Caves and Barton, 1990; Chen and Tang, 1987). The variable EXPORT is the
proportion of firm’s total sales exported. Given that the causality between exports and
efficiency can take the reverse direction, we take the average level of exports for the five
years prior to the year for which efficiency is estimated. This variable is only included for the
clothing industry as all the agricultural machinery firms produced entirely for the domestic
market.
Foreign Ownership. Firms which are partly or wholly foreign-owned may have higher levels
of efficiency than those domestically-owned if they have better access to financial resources
as well as ‘intangible assets’ such as technological knowledge, skills and superior
management practices (Pitt and Lee, 1981). The variable FOREIGN is the percentage of
foreign equity in a firm .
Firm Size. The effects of firm size on efficiency are ambiguous. A positive effect can be
predicted on the grounds of scale economies and the availability of financial resources to

13
invest in skills and technologies. Firm size may be negatively linked to efficiency if large
firms experience diseconomies in production due to problems of management and
supervision. The existing evidence from developing countries does not suggest a strong link
between efficiency and firm size in either direction (Little et al, 1987; Cortes et al, 1987).
To test the effects the variable SIZE is simply the total number of employees in a firm.
Again to minimise problems of causality, we take the average number of employees for the
five years prior to the year in which efficiency is estimated.
Capacity Utilisation. We also include the variable CU, which is the capacity utilisation rate in
1992. This variable is conventionally included as a control variable when estimating the
sources of firm-level technical efficiency.
4.4. Estimating the Sources of Efficiency
The following single equation relating to the sources of technical efficiency is estimated
separately for each industry using OLS regression. The dependent variable TE is the natural
logarithm of the firm-specific technical efficiency measure derived in Section 2.2
TE = α0 + β0MINOR + β1COMPLEX + β2TECHED + β3TECHMAN + β4AGE +
β5EXPORT +β6FOREIGN + β7SIZE + β8CU
Table 4.1 The Sources of Technical Efficiency: the Clothing Industry Eqn 3.1 Eqn 3.2 MINOR .12 (2.21)** COMPLEX .15 (2.7)** TECHED .10 (2.2) ** TECHMAN .09 (2.3)** AGE -.01 (-0.6) .001 (0.58) EXPORT .07 (2.14)** .01 (2.2)** FOREIGN .005 (1.06) .002 (1.6) SIZE .009 (0.06) -.006 (-.18) CU .01 (1.8)* .12 (2.3) ***

14
TA .29 (3.11)*** Constant .16 (2.1) .56 (3.07)*** R .58 , F= (8.1)** N 40 40 t-values in parentheses * denotes significance at 10 per cent level ** denotes significance at 5 per cent level *** denotes significance at 1 per cent level Table 4.2 The Sources of Efficiency : The Agricultural Machinery Industry Dependent Variable Equation 3.3 Equation 3.4 MINOR .16 (2.4)** COMPLEX .008 (0.94) TECHED .09 (2.5)** TECHMAN .12 (2.2)** AGE .001 (1.13) .008 ( .25 ) CU .005 ( 1.9) * .05 (3.1) ** FOREIGN .0 2 ( .26) .001 (1.09) SIZE -.33 (-.23) -0.19 ( -.38) TA .26 (2.3)** Constant .23 (2.2)** .60 (4.0) *** R .36 , F= 2.5 ** .39 F= 3.2** N 35 35
The results of the estimations are given in Tables 4.1 and 4.2 . Several diagnostic tests were
carried out to check the reliability of the estimations. The modified Glesjer test confirmed the
assumption of homoskedasticity in both cases. The RESET test and tests for normality of
errors indicated that the assumptions of linearity and normality were maintained.6
Several variables relating to technology accumulation are significant in the estimation. The
dummy variable MINOR, is positive and significant at the 5 per cent level in both industries,
indicating that minor technical changes promotes technical efficiency. Given that the
dependent variable is expressed in natural logarithms, the antilog of the parameter estimate
15
of MINOR shows the magnitude of the efficiency gains from this type of technical change. In
the clothing industry, it improved efficiency by 13%, with the corresponding figure for the
agricultural machinery sector being 17 %.
This finding indicates that even firms using similar technologies can achieve efficiency levels
that vary partly according to the extent of minor technical change undertaken. It is consistent
with theoretical claims about the need to adapt technologies to suit firm-specific conditions,
with technologies rarely having pre-determined levels of efficiency which are easily achieved.
Further, the few existing studies which have attempted to quantify the economic effects of
adaptive technical change have focused on high technology industries (Katz, 1987; Aw and
Batra, 1998). Our findings show that this type of technical change promotes efficiency even
in technologically simple industries such as clothing and agricultural machinery.
The dummy variable COMPLEX, relating to more sophisticated forms of technical change
(in this case, the introduction of computer-aided design technology), is significant at the 5
per cent level in the clothing industry. The parameter estimate indicates that the magnitude is
considerable, with this type of technical change increasing efficiency by 16 percent. This is
likely to reflect the greater accuracy and speed of computer-aided design systems in the
clothing industry, compared with manual design making. The survey also indicated that the
greater accuracy of CAD systems at the design stage meant fewer production problems at
the sewing stage (for instance, production was less likely to be stopped for design mistakes
to be corrected ) . In addition, firms using CAD systems claimed to be more efficient in
fabric use, although the lack of detailed data means that this cannot be investigated further.
In contrast, the variable COMPLEX is not significant in for the agricultural machinery
industry. Complex technical change, which again involved the introduction of computer-
aided design technologies, does not appear to improve efficiency in this industry. Several
reasons for this can be suggested. Firstly, CAD technology may be the wrong choice for
firms who manufacture simple products for the domestic market. They can probably be just
as easily be designed by manual methods. Secondly, firms using CAD technology may not

16
have the requisite skills and expertise to manage it efficiently and maximise its potential. The
field survey pointed to the lack of skilled operators which meant that, in many firms, the new
CAD systems were not used frequently.7
The two variables relating to technological skills TECHED and TECHMAN, were both
positive and significant at the 5 per cent level in both industries, the results indicating that
formal, industry-specific training and knowledge promote technical efficiency. The field
survey indicated that firms with high proportions of clothing technologists and graduate
engineers (i.e those with high values for the TECHED variable) had fewer production
problems than those with less technically qualified employees. For instance, machine down-
time and teething problems following the installation of new technology was considerably
less in the former than the latter. Further, the magnitudes of the efficiency gains arising from
this type of capability acquisition are also considerable. For instance, the owner/senior
manager having formal, industry-specific qualifications increased efficiency by 9% in the
clothing industry and 13% for agricultural machinery. The significance of the capability
variables also indicates that specialised knowledge can boost efficiency even in low
technology sectors. Previous research which found formal training and skills to have a
positive effect on efficiency focused mainly on high technology industries (Aw and Batra,
1998).
The EXPORT variable (included only for the clothing industry) is significant indicating that
exporters have higher efficiency levels than non-exporters. This accords with the findings of
several previous studies ( Aw and Batra, 1998; Rodrik, 1995). This result can partly be
explained by the fact that exporting captures aspects of efficiency enhancing technological
skills and knowledge not reflected by the capability variables TECHED and TECHMAN. It
has been noted that exporters benefit from international flows of knowledge from foreign
buyers and traders (Keesing and Lall, 1992; Pack, 1992). This may enhance their
productive efficiency vis-à-vis firms producing solely for the domestic market.
The AGE variable is not significant in either estimation. This could be due to the positive
effects of experience-related learning being outweighed by the negative effects of factors

17
such as inefficient production methods which become established in firms over time. The
variable relating to foreign equity, FOREIGN, was also not significant in either estimation.
This contrasts with some previous studies which have found foreign ownership to have a
positive influence on efficiency, after controlling for other factors such as firm size (Pitt and
Lee, 1981). However, given that most of these studies did not control for the effects of
technology accumulation, the significance of the foreign ownership variables may have partly
been the result of their correlation with unobserved technology-related factors.
The variable, SIZE, is also not significant for either industry. This result accords with
previous research which does not point to a particularly strong relationship between size and
efficiency (Little, Page and Mazumdar, 1987; Cortes, 1987). We also investigated whether
SIZE influenced technical efficiency jointly with the other independent variables by carrying
out alternative estimations using interaction terms. However, none of the interaction variables
were significant, indicating that such joint effects were not important in these industries. The
capacity utilisation variable CU is significant at the 10 per cent level.
The analysis so far has focused on the effects of individual aspects of technical change and
technological skills on efficiency. It is also interesting to examine whether the overall extent
of technology accumulation in a firm has a significant positive influence on efficiency.
Research has indicated that technology accumulation generally has a cumulative and
combined effect on firm performance (Dosi 1997). To test this hypothesis we derived a
single variable, TA, by aggregating several individual technical change and capability
variables. This variable captures the total extent of technology accumulation undertaken by a
firm and was derived as follows.
Firstly, a set of binary variables (taking the values 0 or 1) relating to technology
accumulation was derived. This included variables relating to each of the individual aspects
of technical change shown in Table 1. The binary variables related to whether or not a firm
undertook each specified type of technical change listed in this table. In addition, the two
capability variables, TECHMAN and TECHED were also included. TECHED which was
a continuous variable in the earlier estimation was redefined as a binary variable taking the
18
value 1 if a firm employed any formally qualified clothing technologists or engineers, 0
otherwise. The complete set of binary variables was then aggregated and standardised
(divided by the number of variables) to obtain a firm-specific score.
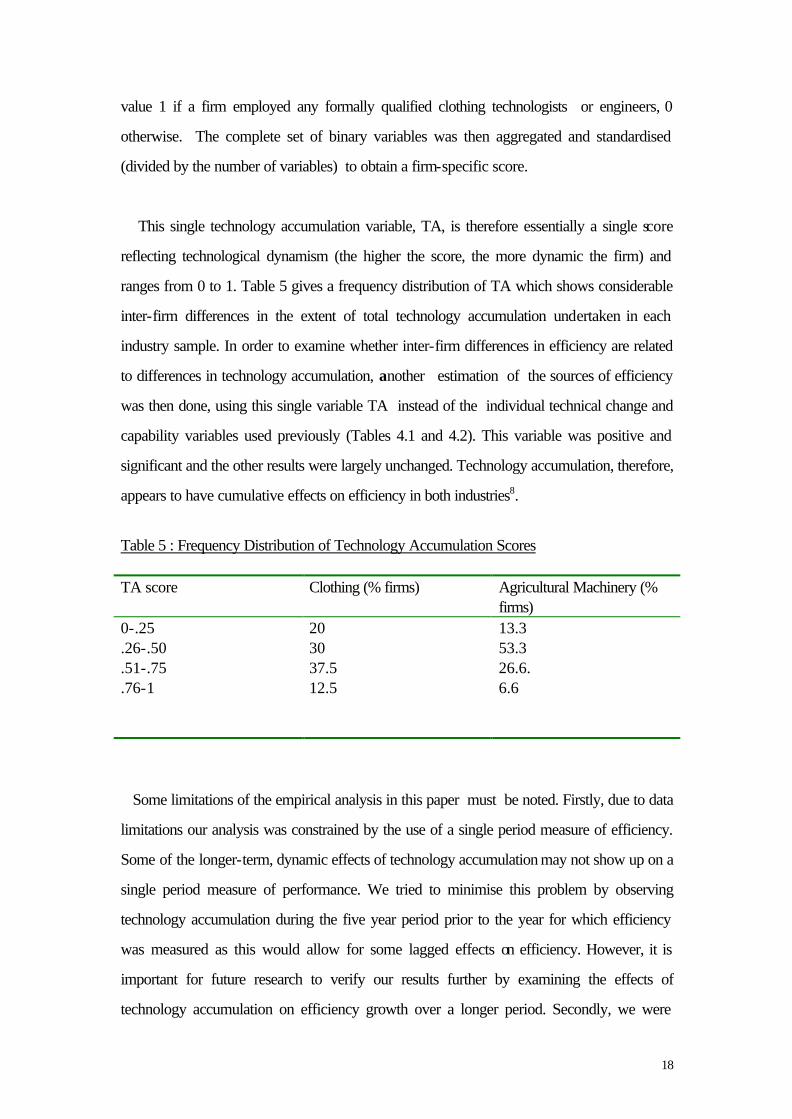
This single technology accumulation variable, TA, is therefore essentially a single score
reflecting technological dynamism (the higher the score, the more dynamic the firm) and
ranges from 0 to 1. Table 5 gives a frequency distribution of TA which shows considerable
inter-firm differences in the extent of total technology accumulation undertaken in each
industry sample. In order to examine whether inter-firm differences in efficiency are related
to differences in technology accumulation, another estimation of the sources of efficiency
was then done, using this single variable TA instead of the individual technical change and
capability variables used previously (Tables 4.1 and 4.2). This variable was positive and
significant and the other results were largely unchanged. Technology accumulation, therefore,
appears to have cumulative effects on efficiency in both industries8.
Table 5 : Frequency Distribution of Technology Accumulation Scores TA score Clothing (% firms) Agricultural Machinery (%
firms) 0-.25 20 13.3 .26-.50 30 53.3 .51-.75 37.5 26.6. .76-1 12.5 6.6
Some limitations of the empirical analysis in this paper must be noted. Firstly, due to data
limitations our analysis was constrained by the use of a single period measure of efficiency.
Some of the longer-term, dynamic effects of technology accumulation may not show up on a
single period measure of performance. We tried to minimise this problem by observing
technology accumulation during the five year period prior to the year for which efficiency
was measured as this would allow for some lagged effects on efficiency. However, it is
important for future research to verify our results further by examining the effects of
technology accumulation on efficiency growth over a longer period. Secondly, we were
19
unable to test the joint effects of the independent variables on technical efficiency. For
instance, our analysis sheds little light on whether firms who are both technologically dynamic
and exporters have higher levels of efficiency than those which display only one
characteristic. Some preliminary regressions using interaction variables indicated that such
joint effects were not important. However, these results were not seen as reliable as adding
interaction variables led to reduced the degrees of freedom, given our relatively small sample
sizes. Again, it is important for future research to investigate these issues further using larger
samples of heterogeneous firms.
5. Conclusions
This paper has shown technology accumulation to have a significant and positive effect on
firm-level technical efficiency in the clothing and agricultural machinery industries in Sri
Lanka. In both cases the two aspects of technology accumulation considered – technical
change and the accumulation of technological capabilities – could promote efficiency. The
analysis showed that firms using broadly similar technologies can achieve varying levels of
efficiency depending on the extent of incremental, minor technical change undertaken for
adaptation and assimilation. Technological capabilities, as proxied by the formal technical
qualifications of the workforce and of senior managers, also had a positive and significant
effect on efficiency.
This study enhances existing research in several ways. Firstly, our findings provide micro-
level support for arguments relating to the importance of technology development in
developing countries. Few studies examine the economic effects of the informal types of
technology accumulation typically undertaken by firms in developing countries using
econometric analysis on samples of heterogeneous firms. Our analysis, therefore, fills this
gap in the literature. Secondly, given that we isolated the effects of technology accumulation
on efficiency, by controlling for other potential determinants, we also added a new
dimension to the literature on efficiency determination in developing countries which has
focused on factors such as firm size, export-orientation and foreign ownership, largely
overlooking issues relating to technology. Finally, by analysing the economic effects of

20
technology accumulation in low technology industries, this study provides a useful
counterpoint to much previous research which has focused on heavy industries and high
technology sectors. The clothing and agricultural machinery sectors are usually the ‘first-
rung’ industries in the path of industrialisation in most developing countries. Understanding
the economic effects of technology accumulation in these industries, therefore, has important
wider implications.
Appendix : Deriving Firm-Specific Measure of Technical Efficiency
This follows from the discussion of the model of technical efficiency in Section 2.2. In order
to obtain firm specific technical efficiency scores it is necessary to make specific assumptions
about the distribution of the error term u in Eq (2) (Section 2.1). In this paper, we assume
that the one-sided error term u follows an exponential distribution, satisfying the condition u
> 0 for a firm whose output lies below the frontier. Then, firm-specific efficiency for each
observation in the sample is given by the mean of the efficiency error (u) conditioned on the
total error (v-u). Thus,
Ε(uε) = µ* + σ* [ f(-µ*/σ*)/ 1 -F(-µ*/σ*)] (3) where f and F represent the standard normal density and cumulative density functions,
respectively and -µ*/σ* =ελσ where λ=σu /σv. .
This yields the point estimate of ui, which is then used to obtain firm-specific technical
efficiency (Tei) as given by
TEi = exp (-µI). (4) References Aigner, C. Lovell and P Schmidt (1977) ‘Formulation and estimation of

21
Stochastic Frontier Production Function Models’, Journal of Econometrics (6), pp 21-37. Aw, B and G. Batra (1998) ‘Technological Capability and Firm Efficiency in Taiwan’, World Bank Economic Review, Vol. 12 No 1, pp 59-79 . Bell, M and K. Pavit (1993) ‘Accumulating Technological Capability in Developing Countries’ Proceedings of the World Bank Annual Conference on Development Economics 1992, pp 257-81. Caves, R and D. Barton (1990) Technical Efficiency in US Manufacturing Industries, (Cambridge:MIT Press). Chen, J and D. Tang (1987) ‘Comparing Technical Efficiency Between Import- Substituting and Export Oriented Firms in a Developing Country’, Journal of Development Economics 26, (August), pp 277-89. Cortes, M, A. Berry and A. Ishaq (1987) Success in Small and Medium Scale Enterprises: Evidence from Colombia, (Oxford:OUP). Dahlman, C. and F. Fonseca (1987) ‘From Technological Dependence to Technological Development; the case of the USIMINAS steel plant in Brazil’ in J. Katz (ed) Technology Generation in Latin American Manufacturing Industries , (Basingstoke: Macmillan). Dosi , G (1997) ‘Opportunities, Incentives and Collective Patterns of Technological Change’, The Economic Journal , 107, September, pp 1530-1547. Evenson, R and L. Westphal (1995) ‘ Technological Change and Technology Strategy’, in J. Behrman and T.Srinivasan (ed) Handbook of Development Economics Vol. 3A ( Amsterdam: North -Holland). Hanusch, H. and Hierl, M (1992) ‘Productivity, Profitability and Innovative Behaviour in West German Industries’, in F. Scherer and M. Perlman (eds) Entrepreneurship, Innovation and Economic Growth , (Ann Arbour: University of Michgan Press). Hill, H and P. Kalijaran (1993) ‘Small enterprise and firm level technical efficiency in the Indonesian garment industry’, Applied Economics, Vol. 25, pp 1137-1144. Hoffman, K and H. Rush (1987) ‘Microelectronics and Clothing’, (New York; Praeger). Jondrow, J,. K. Lovell. I. Materov and P. Schmidt (1982) ‘ On the estimtation of Technical Inefficiency in the Stochastic Frontier production Model’, Journal of Econometrics , Vol. 19, No. 2/3, pp 233-238.

22
Katz, J (1987) ‘Domestic Technology Generation in LDCs: a Review of Research Findings’ in J. Katz (ed) Technology Generation in Latin American Manufacturing Industries (Basingstoke: Macmillan). Keesing, D. and S. Lall (1992) Marketing Manufactured Exports from Developing Countries’, in G. Helleiner (ed) Trade Policy, Industrialisation and Development, (Oxford: Clarendon Press). Lall, S and M. Teubal (1998) ‘ Market stimulating Technology Policies in Developing Countries: a Framework with examples from East Asia’, World Development, Vol 26, No 8 pp 1369-1385. Lall, S (1993) ‘Understanding Technology Development’, Development and Change, Vol. 24, No. 4, pp 719-53. Little, I., D. Mazumdar and J. Page (1987) Small Manufacturing Entreprises: A comparative Analysis of India and Other Economies, (Oxford:OUP). Meeussen, W and J. van den Broeck (1977) ‘Efficiency Estimations from Cobb- Douglas Production Functions with Composed Error Terms’, International Economic Review Vol. 18, (June), pp 435-44. Nelson, R. and S. Winter (1982) An Evolutionary Theory of Economic Change (Cambridge, Mass: Belknap Press of Harvard University). Pack, H. (1992) ‘ Learning and Productivity Change in Developing Countries’, in G. Helleiner (ed) Trade Policy, Industrialisation and Development (Oxford: Clarendon). Pitt, M. and L Lee (1981) ‘The Measurement and Sources of Technical Inefficiency in the Indonesian Weaving Industry’, Journal of Development Economics, Vol. 9 (August), 43-54 . Rodrik, D. (1995) ‘ Trade and Industrial Policy Reform. in J. Behrman and T. Srinivasan (eds) Handbook of Development Economics Vol 3B (Amsterdam:North -Holland). Notes 1 This classification was done in consultation with technical experts from the industry. 2 Whilst alternative functional forms such as the translog are more flexible, they consume more degrees of freedom and reduce the precision with parameters are estimated. Trial estimations of the translog functions showed them to suffer from problems relating to degrees of freedom. 3 The dataset contained information on the acquisition costs of capital and on the dates of acquisition. These were deflated using 1982 prices and aggregated. The capital stock measure was turned into a flow of capital services

23
using the annuity formula and assuming a discount rate of 10 per cent. A similar measure of capital is used by Little et al (1987). 4 Both samples therefore excluded firms which used numerically controlled machinery in the main assembly stage of production. 5 It is important to be careful about the direction of causality because causality can take the reverse direction, with more efficient firms earning higher profits and investing more in technology accumulation. Both the technical change and capability variables relate to the period prior to the year for which efficiency is estimated for this reason. 6 The correlations between the independent variables was and the correlation matrix indicated that strong correlations between these variables did not exist. 7 Data to test this econometrically was not available. 8 This result can also be taken as indicating the robustness of our estimation to alternative specifications.