the impact of the discrepancies between student and parent
TRANSCRIPT
Southern Methodist University Southern Methodist University
SMU Scholar SMU Scholar
Department of Teaching and Learning Theses and Dissertations Department of Teaching and Learning
Spring 5-18-2019
The Impact of the Discrepancies Between Student and Parent The Impact of the Discrepancies Between Student and Parent
Expectations on Academic Achievement: An Ecological Approach Expectations on Academic Achievement: An Ecological Approach
Thom Suhy Southern Methodist University, [email protected]
Follow this and additional works at: https://scholar.smu.edu/simmons_dtl_etds
Part of the Educational Psychology Commons
Recommended Citation Recommended Citation Suhy, Thom, "The Impact of the Discrepancies Between Student and Parent Expectations on Academic Achievement: An Ecological Approach" (2019). Department of Teaching and Learning Theses and Dissertations. 4. https://scholar.smu.edu/simmons_dtl_etds/4
This Dissertation is brought to you for free and open access by the Department of Teaching and Learning at SMU Scholar. It has been accepted for inclusion in Department of Teaching and Learning Theses and Dissertations by an authorized administrator of SMU Scholar. For more information, please visit http://digitalrepository.smu.edu.
Running Head: THE IMPACT OF THE DISCREPANCIES BETWEEN STUDENT AND
1
The Impact of the Discrepancies Between Student and Parent Expectations on Academic
Achievement: An Ecological Approach
Thom M. Suhy
Southern Methodist University
April 24, 2019

THE IMPACT OF THE DISCREPANCIES BETWEEN STUDENT AND PARENT 2
Table of Contents
Dedication ....................................................................................................................................... 9
Acknowledgements ....................................................................................................................... 10
Chapter 1: Introduction ................................................................................................................. 11
Chapter 2: Literature Review ........................................................................................................ 14
Bronfenbrenner’s Theory of Ecological Systems ..................................................................... 14
Figure 1. Bronfenbrenner’s theory of ecological development ................................................ 15
Early Research on Parent Involvement in Schools ................................................................... 19
Parent Involvement and Preschool and Elementary School Students ...................................... 19
Parent Involvement and Middle School Students ..................................................................... 22
Parent Involvement and High School Students ........................................................................ 25
Early Theories on Parent Involvement ..................................................................................... 27
Figure 2. A representation of Epstein’s six types of parental involvement .............................. 28
Making Sense of the Discord .................................................................................................... 30
Parent Expectations Driving Academic Outcomes ................................................................... 31
The Impact of Parent Expectations on Urban Students’ Academic Achievement ................... 37
The effect of parent expectations on elementary students. ................................................... 41
The effect of parent expectations on secondary students. ..................................................... 44
Expectations and the Ecological Systems Theory .................................................................... 48
The Impact of Parent Expectations on Students’ Academic Outcomes ................................... 49
Positive Effect of Parent Expectations on Students’ Academic Success .................................. 50
THE IMPACT OF THE DISCREPANCIES BETWEEN STUDENT AND PARENT 3
Variables Impacting the Relationship Between Parent Expectations and Students’ Academic
Success ...................................................................................................................................... 53
The Argument for Understanding Parent Expectations through Qualitative Research ............ 56
Rationale for Present Study .......................................................................................................... 58
Summary of the Literature Review ............................................................................................... 62
Chapter 3: Research Methods ....................................................................................................... 64
Research Questions ................................................................................................................... 64
Hypotheses ................................................................................................................................ 66
Participants and Variables ......................................................................................................... 69
Data Set. ................................................................................................................................ 69
Population. ............................................................................................................................ 70
Test Scores. ........................................................................................................................... 70
Future Expectations of Academic Achievement. .................................................................. 70
Predictor Variables .................................................................................................................... 70
Student expectations of academic attainment. ...................................................................... 71
Student’s perceived parent expectations of student’s academic attainment. ........................ 71
Parent’s actual expectations of her student’s academic attainment. ..................................... 72
Discrepancy of parent and student expectations of a student’s academic attainment - actual.
............................................................................................................................................... 72
Discrepancy of parent and student expectations of a student’s academic attainment -
perceived. .............................................................................................................................. 72

THE IMPACT OF THE DISCREPANCIES BETWEEN STUDENT AND PARENT 4
The interaction of student expectations of academic attainment and discrepancy of parent
and student expectations of a student’s academic attainment - actual. ................................. 73
The interaction of student expectations of academic attainment and discrepancy of parent
and student expectations of a student’s academic attainment - perceived. ........................... 73
Moderating Variable ................................................................................................................. 73
School poverty level. ............................................................................................................ 74
Outcome Variables .................................................................................................................... 74
Test Scores. ........................................................................................................................... 74
Student’s future expectations of academic achievement. ..................................................... 75
Statistical Models ...................................................................................................................... 75
Full hierarchical linear model: .............................................................................................. 75
Formulas and notation for each specified hierarchical linear model (DIS_ACTEX): .......... 76
Formulas and notation for each specified hierarchical linear model (DIS_PEREX): .......... 78
Statistical Software ................................................................................................................... 80
Validity and Reliability ............................................................................................................. 81
Institutional Review Board Approval Process .............................................................................. 82
Summary of the Research Methods .............................................................................................. 83
Chapter 4: Analysis and Findings ................................................................................................. 85
Preparing the Data ......................................................................................................................... 85
Procedures for preparing data to evaluate perceived discrepancies impacting academic
outcomes: .................................................................................................................................. 86

THE IMPACT OF THE DISCREPANCIES BETWEEN STUDENT AND PARENT 5
Procedures for preparing data to evaluate actual discrepancies impacting academic outcomes:
................................................................................................................................................... 93
Estimation of the Models .............................................................................................................. 95
Table 1 .................................................................................................................................. 96
Definition of variables .......................................................................................................... 96
Descriptive statistics for initial NELS:88 data set .................................................................... 97
Descriptive statistics for total score .......................................................................................... 97
Table 2 .................................................................................................................................. 98
Descriptive Statistics for All Data Sets ................................................................................. 98
Note: For gender M = male and F = female, for minority W = White and M = Non-white, for
school poverty N = non-impoverished and I = impoverished. ................................................. 98
Actual discrepancies. ............................................................................................................ 98
Perceived discrepancies. ....................................................................................................... 99
Descriptive statistics for future expectations of academic attainment ...................................... 99
Actual discrepancies. ............................................................................................................ 99
Perceived discrepancies. ..................................................................................................... 100
HLM analysis for total scores ................................................................................................. 100
Actual discrepancies. .......................................................................................................... 100
Table 3 ................................................................................................................................ 101
HLM Results for Actual Discrepancies Predicting Total Scores – Fixed Effects and Random
Effects .................................................................................................................................. 101

THE IMPACT OF THE DISCREPANCIES BETWEEN STUDENT AND PARENT 6
Perceived discrepancies. ..................................................................................................... 104
Table 4 ................................................................................................................................ 106
HLM Results for Perceived Discrepancies Predicting Total Scores – Fixed Effects and
Random Effects ................................................................................................................... 106
HLM analysis for future expectations of academic attainment .............................................. 108
Actual discrepancies. .......................................................................................................... 108
Table 5 ................................................................................................................................ 109
HLM Results for Actual Discrepancies Predicting Future Expectations – Fixed Effects and
Random Effects ................................................................................................................... 109
Perceived discrepancies. ..................................................................................................... 112
Table 6 ................................................................................................................................ 113
HLM Results for Perceived Discrepancies Predicting Future Expectations – Fixed Effects
and Random Effects ............................................................................................................ 113
Summary ..................................................................................................................................... 116
Table 7 ................................................................................................................................ 116
Summary of All Hierarchical Linear Models ...................................................................... 116
Chapter 5: Discussion ................................................................................................................. 118
Review of Research Questions and Hypotheses ......................................................................... 118
Implications of the Findings ....................................................................................................... 122
Limitations .................................................................................................................................. 126
Extending the Research ............................................................................................................... 128

THE IMPACT OF THE DISCREPANCIES BETWEEN STUDENT AND PARENT 7
Summary ..................................................................................................................................... 130
References ................................................................................................................................... 131
Appendix A ................................................................................................................................. 140
IRB Exempt Status Determination Application ...................................................................... 140
Appendix B ................................................................................................................................. 142
IRB Review Acceptance Letter .............................................................................................. 142
Appendix C ................................................................................................................................. 143
Principal Investigator’s Assurance ......................................................................................... 143
Appendix D ................................................................................................................................. 144
Proof of CITI Course Completion .......................................................................................... 144
Appendix E ................................................................................................................................. 145
IRB Approval Letter ............................................................................................................... 145
Appendix F .................................................................................................................................. 146
R Code Used for Analyses ...................................................................................................... 146
Appendix G ................................................................................................................................. 148
R Code Output ........................................................................................................................ 148

THE IMPACT OF THE DISCREPANCIES BETWEEN STUDENT AND PARENT 8
“Witness the American ideal: The Self-Made Man. But there is no such person. If we can stand
on our own two feet, it is because others have raised us up. If, as adults, we can lay claim to
competence and compassion, it only means that other human beings have been willing and
enabled to commit their competence and compassion to us--through infancy, childhood,
and adolescence, right up to this very moment." - Urie Bronfenbrenner 1977

THE IMPACT OF THE DISCREPANCIES BETWEEN STUDENT AND PARENT 9
Dedication
This dissertation – almost 7 years of blood, sweat, and tears – is dedicated to my family
that has stuck by me throughout the entire process and my late friend Bob. We miss you Bobby!
Mom, you have been behind me from day one. Your unconditional love and ability to
provide Nun-like guilt on demand has pushed me through some of the toughest times. Thank
you for being there, no-matter what.
Dylan and Camden, a lot has transpired through the writing of this paper, but a few things
have not changed. One, I love you unconditionally, and you mean more to me than anything.
Two, I have always been proud of your accomplishments and grow prouder every day. Three, I
continue to be amazed at the men you are becoming.
Lisa, the love of my life, I would not be here if it weren’t for you. Unlike my mom, you
did not use guilt, but actual tough love to get me through. I appreciate your undying love for me,
your consistent support, and the fact that you did not let me give up, on anything. I love you.

THE IMPACT OF THE DISCREPANCIES BETWEEN STUDENT AND PARENT 10
Acknowledgements
I would like to thank the members of my cohort for their support and love during this
long process. In particular, Dr. Elizabeth Howell has been a lighthouse in the storm. My Ignite
family has been so supportive over the last 3 years. Thank you to Julie Hamrick and Barbie Boe
for putting up with me during this time, I will be forever grateful. Dr. Paige Ware was one of the
first people to introduce me to Bronfenbrenner. Without her direction, this paper would not have
been possible. Dr. Paul Yovanoff has been an amazing supporter through the entire process.
Always being honest, but with a kind touch. Dr. Aki Kamata was always there to direct me and
my statistical model, at time showing amazing patience. Finally, Dr. Ken Springer has been a
tremendous adviser, mentor, and friend throughout. Thank you for your “tough love”.
THE IMPACT OF THE DISCREPANCIES BETWEEN STUDENT AND PARENT 11
Chapter 1: Introduction
For decades, parents, teachers, administrators, and policy-makers have struggled to find
effective ways to bridge the achievement gap that exists between students in America’s inner-
city schools and those in schools that serve mostly middle- and upper-class students. While
multiple roadblocks and barriers must be navigated when attempting to address this issue, time
and money appear to be the biggest obstacles to reducing the growing gap of achievement levels
between these two very diverse populations. The barrier of time is created not by the lack of
time per se, but by the impatience of parents and educators who call for immediate results.
Parents press schools for better academic results for their children, but do not want their children
to be participants in an experiment, testing out cutting edge programs that have not yet been fully
researched. At the same time, teachers and school administrators are pressed by district and state
accountability standards to find immediate solutions to reduce the number of unacceptable test
scores. Seemingly, the end result is the adoption of programs that appear to be effective in
certain environments, but these programs may not mirror the campus environment where the new
implementation takes place.
Similarly, district funds are not always available in low-income schools to implement a
successful program to its fullest capacity. Areas such as teacher training and classroom materials
may be foregone so that campuses may implement as much of the new program, to as many
students within the district, as possible. As this constant circle of ineffectiveness continues to
haunt the low-income, mostly minority students of inner-city schools, many are searching for a
way to close the achievement gap in the absence of time or money, or both. Perhaps one viable
solution to this apparently never-ending issue is the implementation of effective parent
engagement practices within these struggling campuses.

THE IMPACT OF THE DISCREPANCIES BETWEEN STUDENT AND PARENT 12
Parent engagement (also known as parent involvement) appears to be a simple solution to
addressing the achievement gap problem, but it is far from simple. Previous researchers, such as
Epstein, Jeynes, and Fan and Chen, have defined parent engagement as the involvement of
parents in the academic life of their children – both at home (i.e. setting up a specific time for
homework, parents reading to kids, parents assisting with homework) and at school (i.e.
attending parent teacher conferences, parents assisting teachers in their classrooms, parents
working fundraisers for the school) (Epstein, 1988a, 1988b; Fan & Chen, 2001; Jeynes, 2003,
2005, 2007). For years, researchers have evaluated some form of the characterizations above in
order to appraise the power of such participation on the educational attainment of students. It is
the variation in the definitions of parent engagement, though, that has led to conflicting findings
on the impact of parent involvement on academic achievement. Experts such as Epstein (1988a,
1988b), Fan and Chen (2001), and Jeynes (2003, 2005, 2007) have attempted to give a stronger
construct to the definition of parent involvement with some success. Today, nevertheless,
studies continue to be implemented that loosely define parent engagement, making it difficult to
interpret and replicate results.
The following review of literature investigates the history of research on parent
involvement in relation to students’ academic achievement. In addition, this review examines
Bronfenbrenner’s theory of ecological systems (1979, 1986, 1992, 2005) as the conceptual
framework through which the success of parent engagement practices can be evaluated. While
this review intends to give a historical perspective of studies on parent engagement, it is by no
means a comprehensive review of all parent engagement research. Care was taken to examine
the most cited, or widely accepted, studies on parent engagement within each section of this
paper. These sections were carefully chosen to represent research on parent engagement prior to
the work of Fan and Chen (2001), the time between 2001 and 2007 when Fan and Chen (2001)

THE IMPACT OF THE DISCREPANCIES BETWEEN STUDENT AND PARENT 13
and Jeynes (2003,2005, 2007) published meta-analyses on parent engagement, and studies
publish in the era immediately following the publication of Fan and Chen’s meta-analysis.
As touched on previously, the remainder of this paper will chronicle the history of
research on parent engagement in relation to student attainment through the separation of
information into four sections. The first section reviews Bronfenbrenner’s theory of ecological
systems (1979, 1986, 1992, 2005), and why this theory serves as the foundational framework
when evaluating effectiveness of parent involvement programs. The second section examines
parent involvement research conducted during an era stretching from the early 1980s to 2000
(e.g., Epstein, 1988a, 1988b; Griffith, 1996, 1997, 1998; Marcon, 1993a, 1993b) in an effort to
illustrate the discourse within the field and the confusion these results initiated, and to identify
the potential cause of the conflicting outcomes. The third section considers in depth the meta-
analyses of Fan and Chen (2001) and Jeynes (2003, 2005, 2007) and the importance that all four
of these studies have within the field of parent engagement research, in particular the clarity
provided in defining impactful parent involvement practices and the variables these practices
transform. The last section of this review of literature examines research conducted from 2002
through 2015 that specifically addresses the impact of parent expectations on student academic
outcomes. This specific area of concentration was chosen in part because of the findings of Fan
and Chen (2001) and Jeynes (2003, 2005, 2007), which will be discussed within this review.

THE IMPACT OF THE DISCREPANCIES BETWEEN STUDENT AND PARENT 14
Chapter 2: Literature Review
Bronfenbrenner’s Theory of Ecological Systems
Parent engagement, whether through direct interactions with a child, or indirectly through
parent interfaces with the child’s school and community, should be considered a series of critical
relationships impacting student academic achievement. It is, therefore, remiss to report on the
success and failures of parent involvement practices without understanding the social context in
which the children, and their parents, have been raised, and where these practices take place.
Bronfenbrenner (1979, 1986, 1992, 2005) examined the differing systems in which humans –
more precisely children, their parents, their teachers, and their administrators – develop in order
to gain a greater understanding of the social contexts and connections that are critical to human
development. This theory of ecological systems established by Bronfenbrenner – sometimes
referred to as the bioecological systems theory – will provide the conceptual framework in which
this review of literature on parent involvement practices is grounded. As such, the remainder of
this section will examine the five ecological systems of human development presented by
Bronfenbrenner – the microsystem, the exosystem, the mesosystem, the macrosystem, and the
chronosystem – and show how social contexts within each system contribute to both the
participation in and the effectiveness of the varying dimensions of parent engagement.
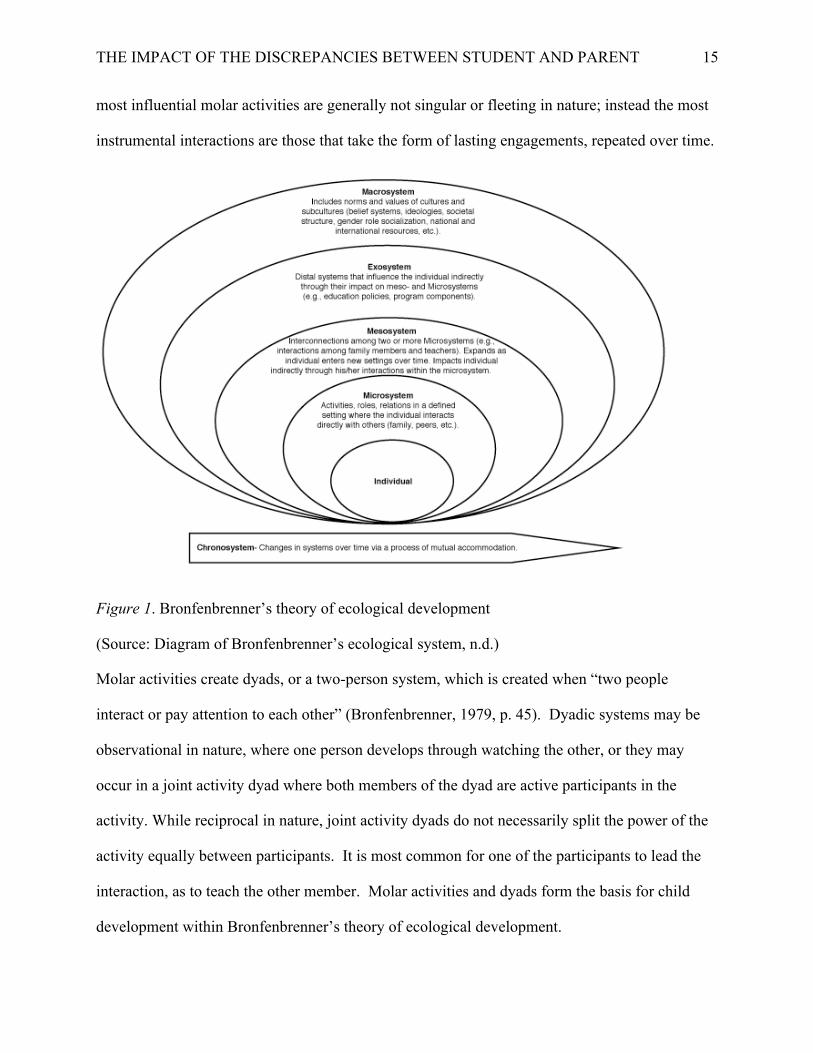
The ecological system, as mentioned previously, consists of five systems (see figure 1) –
the microsystem, the exosystem, the mesosystem, the macrosystem, and the chronosystem – of
interrelations that influence, both directly and indirectly, the unique development of each
individual person (Bronfenbrenner, 1979, 1986, 1992, 2005). Bronfenbrenner defined these
interrelations, or molar activities, as “an ongoing behavior possessing a momentum of its own
and perceived as having meaning or intent by the participants in the setting” (1979, p. 45). The
THE IMPACT OF THE DISCREPANCIES BETWEEN STUDENT AND PARENT 15
most influential molar activities are generally not singular or fleeting in nature; instead the most
instrumental interactions are those that take the form of lasting engagements, repeated over time.
Figure 1. Bronfenbrenner’s theory of ecological development
(Source: Diagram of Bronfenbrenner’s ecological system, n.d.)
Molar activities create dyads, or a two-person system, which is created when “two people
interact or pay attention to each other” (Bronfenbrenner, 1979, p. 45). Dyadic systems may be
observational in nature, where one person develops through watching the other, or they may
occur in a joint activity dyad where both members of the dyad are active participants in the
activity. While reciprocal in nature, joint activity dyads do not necessarily split the power of the
activity equally between participants. It is most common for one of the participants to lead the
interaction, as to teach the other member. Molar activities and dyads form the basis for child
development within Bronfenbrenner’s theory of ecological development.

THE IMPACT OF THE DISCREPANCIES BETWEEN STUDENT AND PARENT 16
In this complex theory of ecological systems, the most immediate system is what
Bronfenbrenner (1979, 1986, 1992, 2005) refers to as the microsystem, and consists of a
“complex of interrelations within the immediate setting” (Bronfenbrenner, 2005, p. 54). These
connections are the most personal and immediate due to their direct relationship with the subject
and are denoted as proximal processes. These proximal processes are the most persuasive
interrelations that initiate and promote human development. Listening to a mother read a bedtime
story, actively participating as a teacher leads a show-and-tell session and paying attention as a
pastor is delivering a sermon are common examples of proximal processes a child may encounter
within the microsystem.
Interactions between persons within a child’s microsystem, but absent of the child, make
up the second layer of the ecological system, the mesosystem (Bronfenbrenner, 1979, 1986,
1992, 2005). Parent-teacher conferences, increased school communication between principal and
parent, and a parent serving on a church committee are all examples of events that occur within a
child’s microsystem. The most common forms for parent involvement initiated within the
public-school systems of the United States are focused on building relationships that occur
within the mesosystem. This fact will be illustrated in future sections. These practices, however,
rarely consider the context of the interactions – i.e. parent education level, number of jobs a
parent holds, family structure, previous school experience – when attempting to enhance the
direct connection between home and school. The interactions that do address deeper contexts
often do so at a superficial level.
The exosystem – the third layer of the ecological system – is closely related to the
microsystem and includes what Bronfenbrenner calls structures within the microsystem (1979,
1986, 1992, 2005). These structures are events that do not directly interact with the child but
occur around the persons and events within the child’s microsystem. Examples of such

THE IMPACT OF THE DISCREPANCIES BETWEEN STUDENT AND PARENT 17
structures would be the job loss of a parent, the financial difficulties that result from the loss of a
job or moving from one home to another. Incidents such as these impact the child’s
development by transforming the intensity, content, and frequency of interrelations between the
child and the affected member of the child’s microsystem.
The fourth level of Bronfenbrenner’s (1979, 1986, 1992, 2005) ecological system is the
macrosystem; this level was also the last addressed within the original theory. Bronfenbrenner
defined the macrosystem as the “consistency observed within a given culture or subculture in the
form and context of its constituent micro-, meso-, and exosystems, as well as belief systems or
ideology underlying such consistencies” (1979, p. 258). The development induced through the
macrosystem, like the other systems within the ecological theory, varies from individual to
individual. Molar activities such as religious and ethnic practices within an individual’s
subculture have unique impacts on the development of the individual or individuals within a
certain sub-group. Still, many of the activities within the greater scope of an individual’s culture
are impactful across subcultures. These influential activities could be new laws banning the use
of cellphones, conflicts among countries, and the fluctuation of oil prices impacting the cost of a
gallon of gas. These interactions within the macrosystem may impact a wide range of
individuals in varying cultures; nonetheless, the level and effect of the interactions are heavily
related to the beliefs and practices within each individual subculture. A direct example of the
impact of the macrosystem on parent involvement practices and participation would be new
attendance boundaries drawn by the local school board.
The final level of Bronfenbrenner’s ecological systems theory (1986, 1992, 2005), a level
that was not included in the original model, is the chronosystem, which is described as the
impact time has on events and interactions that occur within the other ecological systems. The
addition of the chronosystem has led many, including Bronfenbrenner, to refer to the overall

THE IMPACT OF THE DISCREPANCIES BETWEEN STUDENT AND PARENT 18
theory as the bioecological systems theory (1992, 2005). As discussed earlier, a job loss has an
immediate impact within the exosystem. However, as time goes on, the bearing of this major life
event continues to affect the development of the individual. One could argue that the
consequences directly related to the job loss and a subsequent new job could continue to
influence the development of the child without end. In the realm of time impacting educational
development, a job change by a parent that creates less time at home can be immediately
impactful on the child emotionally, but over the course of a few years, the loss of time for direct
interaction between parent and child could have devastating consequences on cognitive
development.
Overall Bronfenbrenner’s theory of human development considers the interrelationships
of process, person, context, and time (1979, 1986, 1992, 2005). Earlier within this section, three
of the four – process, context, and time – have been discussed, but Bronfenbrenner elicits that the
individual person is paramount to his or her overall development. This is not to say that
meaningful connections must always occur for proper human development; instead, human
development also is dependent on characteristics attributed to demographics such as age and
gender. The dyads and molar activities within each of the systems are influenced by how old the
developing human is, and at times, the gender. More specifically, the power player in the dyad,
such as a parent, teacher or pastor, may, and most likely will, react differently to a boy versus a
girl, or an infant versus a teen. For instance, in a school context, it has been stated that girls
develop faster than boys, or that boys are more hyperactive than girls. These preconceived
notions could impact how teachers, administrators, and parents interact with these children.
Bronfenbrenner pointed out that acknowledging these traits is critical to the understanding of
how, and more importantly why, children develop as they do.
THE IMPACT OF THE DISCREPANCIES BETWEEN STUDENT AND PARENT 19
Throughout this paper the work of Bronfenbrenner will continue to be examined as the
theory relates to both successful and unsuccessful dimensions of parent engagement. The model
discussed throughout this section will serve as a starting point for those conversations. The next
section will examine the discord created through the various parent involvement studies from
1980 to 2000, and how Bronfenbrenner’s theory informs the assorted parent involvement
programs and their outcomes.
Early Research on Parent Involvement in Schools
As mentioned in the introduction of this paper, this review of literature is not meant to be
a complete synthesis of all parent involvement research; instead each section of this paper has a
specific purpose in building an understanding of the most impactful parent involvement
practices. The purpose of this section is to investigate the landscape of parent involvement
research from 1980 through 2000 in order to illustrate the commonalities that exist in published
research, as well as the frequency of conflicting findings in this time period. Because the work of
Fan and Chen (2001) is the focal point of the section to follow, the decision was made to analyze
most of the studies included in the Fan and Chen meta-analysis (2001) to provide the foundation
to this discussion on early parent engagement research. In addition to some of the reports
examined by Fan and Chen, other highly popularized studies – defined by frequency of citation –
were used to complete this synthesis of early literature.
Parent Involvement and Preschool and Elementary School Students
Many of the initial studies examining parent involvement were focused on the early
academic careers of students – preschool through elementary school. Hypothetically, this
phenomenon was attributed to the greater impact parent involvement interventions, such as
homework help, setting expectations, communication between home and school, and parental
presence on the school campus, could have on student outcomes if implemented at a much
THE IMPACT OF THE DISCREPANCIES BETWEEN STUDENT AND PARENT 20
younger age (Cotton & Wikelund, 1989; Stevenson & Baker, 1987). Early research found that
measures of parent involvement practices had positive effects on grades (Griffith, 1998; Hess,
Holloway, Dickson, & Price, 1984; Marcon, 1993b), tests scores (Griffith, 1996, 1997; Marcon,
1993b), retention prevention (Marcon, 1993a, 1993b), and overall academic achievement of
elementary school children (Hess, Holloway, Dickson, & Price, 1984; Marcon, 1993b; Reynolds,
1992). Studies also found that socio-economic status (SES) (Griffith, 1996), ethnicity (Griffith,
1996), age (Griffith, 1998; Hess, Holloway, Dickson, & Price, 1984; Marcon, 1993a, 1993b),
and parent empowerment (Griffith, 1997) impacted the strength of this assortment of
relationships between parent involvement and student outcomes.
Research on parent involvement practices during this period showed that academic
success in early education could be predicted specifically by a mother’s involvement (Hess,
Holloway, Dickson, & Price, 1984; Marcon, 1993a, 1993b). When investigating the bearing of
parent involvement practices on preschool-aged students, Hess, Holloway, Dickson, and Price
(1984) found that parent expectations, especially those of the mother, was the dimension of
parent involvement that best predicted school readiness and achievement. Within this
longitudinal study, Hess, Holloway, Dickson and Price also found that the impact of a mother’s
expectations was more influential on students’ grades when the expectations were expressed
during a child’s early years – preschool age – as opposed to during sixth grade. Marcon (1993a,
1993b) conducted a five-year longitudinal study of inner-city African-American students that
began with a cohort of preschool-aged children and established that a mother’s general
involvement in the early education of her child reduced the possibility of third grade retention.
Marcon discovered that the effect was less dramatic, yet still significant, if the mother waited
until first grade to become engaged. Additionally, Marcon found that if the mother was involved

THE IMPACT OF THE DISCREPANCIES BETWEEN STUDENT AND PARENT 21
during the first two years of the child’s education, there was a positive relationship with students’
grades and standardized test scores.
The level of a mother’s education was shown to predict student success in a 1987 study
conducted by Stevenson and Baker. They concluded that the higher the level of education, the
more the overall general involvement of the mother, and the greater the student’s achievement,
as defined by GPA. As the student progressed from kinder through 6th grade, however,
Stevenson and Baker discovered that the impact of a mother’s educational level on student GPA
was significantly diminished.
Another study found that impact of parent involvement on student success was best
predicted by the student’s teacher’s perception of the level of parent engagement (Reynolds,
1992). Within a longitudinal study of students beginning in Kindergarten, Reynolds found that
teacher’s perceived level of parent involvement had a greater impact on students’ academic
success, as defined by overall academic success such as GPA and test grades, than parents’ and
students’ perceptions of parent engagement. In fact, students’ perception of parent involvement
showed a negative effect on students’ academic success. Parent and student reports of
involvement at home had no effect on academic outcomes.
Through a series of studies, Griffith (1996, 1997, 1998) discovered that parent
involvement predicted students’ success on standardized testing and that ethnicity and class
moderated this relationship. Griffith (1996) surveyed parents in more than 120 elementary
schools within a suburban school district. Results showed that schools where parents reported a
high level of parent involvement, based on parents’ responses to questions associated with
participation in parent-teacher conferences, school functions, and volunteer opportunities at
school, had higher state criterion-referenced test (CRT) scores than did the schools where parents
did not report high levels of engagement. Griffith (1997) re-investigated the survey data from the

THE IMPACT OF THE DISCREPANCIES BETWEEN STUDENT AND PARENT 22
1996 study and established a strong correlation between parent-school interaction, or
engagement, and parents feeling both informed by the school and empowered by the school.
Still investigating data from the 1996 sample of 122 elementary schools, Griffith (1998)
discovered that White parents reported higher school participation than did African-American,
Asian, and Latino parents. The reported level of SES, as defined by participation in the federal
free and reduced lunch program, predicted levels of parent involvement regardless of race.
Griffith also uncovered that parents of younger students, or with more than one child in school,
were more likely to be engaged in school activities.
Bronfenbrenner’s (1979, 1986, 1992, 2005) theory suggests that the proximal processes
located within the microsystem are the most influential on the development of a child.
Additionally, the chronosystem is responsible for deepening the impact of these proximal
processes over time. The research examined within this section supports Bronfenbrenner’s
theory by exhibiting the importance of the relationship between parent and child (Griffith, 1996,
1997, 1998; Hess, Holloway, Dickson, & Price, 1984; Marcon, 1993a, 1993b; Reynolds, 1992),
and shows that this interaction could be considered to be most critical at an early age (Cotton &
Wikelund, 1989; Stevenson & Baker, 1987).
Parent Involvement and Middle School Students
While some argue that the impact of parent involvement is most influential during the
preschool and elementary years (Cotton & Wikelund, 1989; Stevenson & Baker, 1987), other
research has shown that parent engagement during middle school can also have a lasting effect
on student success (Desimone, 1999; Keith, Keith, Troutman, & Bickley, 1993; Keith &
Lichtman, 1994; Peng & Wright, 1994; Uguroglu & Walberg, 1986; Yap & Enoki, 1994). Peng
and Wright (1994) established that the impact of parent expectations significantly predicted
academic outcomes on standardized test scores for a cohort of eight grade students.

THE IMPACT OF THE DISCREPANCIES BETWEEN STUDENT AND PARENT 23
Additionally, even though parents were involved in the academics of their children, and high
expectations were set, Peng and Wright’s research showed that very few Asian parents helped
with their child’s homework. These parents did, however, enact rules, study times, and help with
setting study habits for their eighth-grade students. Yap and Enoki (1994), examining a sample
of middle class, mostly Asian and Pacific Islander students, found that home-based practices,
such as visits to the library, setting up specific times to study, and providing reading materials at
home, predicted improved student attitudes toward school, higher GPAs, and higher scores on
standardized tests. Uguroglu and Walberg (1986) found similar results while examining a very
different sample of students, a group of suburban middle school students in the Chicago area.
Examining a diverse sample made up mostly of White (50%) and African-American (33%)
students living in low to middle-class homes, Uguroglu and Walberg found that the home
environment, rules, study space, and support from parents, was the best predictor of school
success compared to other parent involvement practices such as volunteering at school or
communication with a teacher.
Desimone (1999) discovered that parent involvement was a significant predictor of
students’ math and reading grades in middle school, but that impact, through differing
dimensions of parent engagement, fluctuated by ethnicity and race. Employing data from the
National Education Longitudinal Study of 1988 (NELS: 88) (Ingels, S. J., Scott, L. A., Taylor, J.
R., Owings, J., & Quinn, P., 1998), Desimone investigated the effect of parent involvement
practices on academic success for a sample of 24,000 middle school students. Desimone
established that general parent involvement practices were a better predictor of grades and test
scores in reading and math for White, Asian, and middle-income level students compared to
Latino, African-American and low-income students. Desimone also found that the impact of
parent involvement practices was more predictive of overall grades than it was for standardized
THE IMPACT OF THE DISCREPANCIES BETWEEN STUDENT AND PARENT 24
test scores. Contrary to the findings of Reynolds (1992), Desimone (1999) discovered that
student perceptions, compared to teacher perceptions, of parent involvement had the strongest
association with student achievement – measured by both grades and tests – and that this held
across all ethnicity and income levels. The most interesting discovery may have been that while
parent involvement practices were the strongest predictors of academic outcomes for all
ethnicities, the strength of the effect of individual dimensions of parent involvement on academic
outcomes varied across ethnicities. For example, Desimone found that the parent involvement
dimension of volunteering at school best predicted the academic success of White students, while
having their parents attending PTO meetings was the best predictor of academic success for
African-American students. These conclusions from Desimone would support Bronfenbrenner’s
(1979, 1986, 1992, 2005) ecological theory as a foundation of impactful parent involvement
practices. The differences unearthed within Desimone’s research point to the impact human
development has on the influence of educational practices on academic success, and that culture
and SES are critical variables in the development of these relationships.
McNeal (1999) also investigated data from NELS: 88 to examine the relationship
between parents, students, and students’ behaviors and academic accomplishments. McNeal’s
research was one of the first to popularize the theory that student outcomes were not the results
of single encounters, but a result of the numerous experiences of the child influenced by the
social capital (the combined benefit of belonging to a specific group or groups) of the student’s
family. McNeal found that the influence of social capital on student outcomes was greater for
characteristics associated with behaviors then those associated with academics. He also found
that this relationship was most influential on those groups that have historically been considered
privileged (white middle- and upper-class students). While McNeal did not initially place the
moniker of ecological theory on this approach, he did cite Bronfenbrenner in later work, and he
THE IMPACT OF THE DISCREPANCIES BETWEEN STUDENT AND PARENT 25
referred to his future work through a lens of an “ecological context of parent involvement”
(McNeal, 2014, p.2).
Much of the research in this section established that parent involvement has a significant
impact on student outcomes in middle school. However, other researchers such as Grolnick and
Slowiaczek (1994) discovered that student ability and perception of ability predicted parent
involvement, rather than the other way around. Stevenson and Baker (1987) also noted that the
impact of parent involvement, while still significant, decreases as the child progresses through
middle and high school.
The research findings discussed within this section, specifically those of Desimone
(1999) and McNeal (1999), highlighted the critical need to evaluate the impact of parent
involvement by first understanding the stakeholders being measured. Both Desimone and
McNeal discovered that ethnicity and SES played a major role in the strength of impact that
parent involvement practices have on students’ academic outcomes. These findings support
Bronfenbrenner’s (1979, 1986, 1992, 2005) theory of ecological development as the lens through
which parent involvement practices should be viewed.
Parent Involvement and High School Students
The impact of involvement on students’ academic outcomes is not limited to elementary
and middle school students. High school students’ perception of parent involvement has been
shown to predict overall academic achievement (Brown & Madhere, 1996; Eagle, 1989; Taylor,
1996; Fehrmann, Keith, & Reimers, 1987; Paulson, 1994b). Fehrmann, Keith, and Reimers
(1987) analyzed data from the National Center for Education Statistics’ High School and Beyond
National Study (HSB) and found that student perceptions of general parent involvement had a
significantly positive impact on overall grades, but the study was inconclusive on which was
more impactful, student perception of parent involvement or actual parent involvement.

THE IMPACT OF THE DISCREPANCIES BETWEEN STUDENT AND PARENT 26
Similarly, Eagle (1989) found that parent involvement during high school, as gauged by
students’ self-report, had a significant impact on high school students’ academic attainment
(measured by attainment of a high school diploma or a college degree). Eagle also found that
SES and parental education attainment, regardless of the influence of parent involvement,
significantly predicted students’ academic attainment.
The findings are mixed with regards to the impact parenting style has on academic
achievement on high school students. In a study of 6400 adolescent students (ages 14 to 18) with
diverse ethnicities and SES, Steinberg, Lamborn, Dornbusch, and Darling (1992) found that
general parent involvement significantly influenced student achievement, but that the
relationship was stronger if the student resided in an authoritative household. All variables were
self-reported by students via a survey, and the school achievement variable consisted of four
questions related to GPA, effort in class, time spent on homework, and time spent daydreaming
in class. Conversely, Taylor, Hinton, and Wilson (1995) found that an authoritative parenting
style had a negative relationship with perceived parent involvement and in turn, produced lower
academic achievement in low-SES African-American students across all age groups.
Paulson (1994b), while investigating the impact of students’ perception of parent
involvement on academic achievement, found that students’ self-report of parent involvement
predicted academic achievement. While parents’ and students’ self-reported measures on parent
engagement were slightly correlated, parent perceptions did not significantly predict student
outcomes, but student perceptions did. Further, students’ perception of paternal interest had a
slightly higher effect than that of maternal interest. Additionally, the earlier parents expressed an
interest or expectation of school outcomes, the greater the impact on students’ expectations to
attend college. In a similar environment, Paulson (1994a) investigated the role gender had in
moderating the impact of the perception of parent involvement on student achievement. In a

THE IMPACT OF THE DISCREPANCIES BETWEEN STUDENT AND PARENT 27
study of ninth grade students, Paulson discovered that the more boys perceived that their parents
were demanding and valued academics, the higher the academic achievement. Conversely, the
more boys perceived that their parents were involved in their education, the lower the GPA of
the student. Paulson discovered no significant effect either way when investigating the same
relationships for girls.
The research considered within this section continued establishing the positive impacts of
parent involvement, this time on high school students. However, it was made apparent that
within high school students, perceptions of parent involvement (Fehrmann, Keith, & Reimers,
1987; Paulson, 1994a, 1994b) and parenting styles (Steinberg, Lamborn, Dornbusch, & Darling,
1992; Taylor, Hinton, & Wilson, 1995) were key contributors to the effects on students’
academic outcomes. The research evaluated within this section confirmed the importance of
consideration of demographics such as ethnicity (Eagle, 1989; Paulson, 1994a, 1994b), SES
(Eagle, 1989; Taylor, Hinton, & Wilson, 1995), and gender (Paulson, 1994a, 1994b) when
evaluating the impact of parent involvement, as Bronfenbrenner’s (1979, 1986, 1992, 2005)
theory would suggest.
Early Theories on Parent Involvement
As research on the topic of parent involvement progressed toward the new millennium,
two theories arose as the most frequently retained when providing a framework for the
discussion. Epstein’s six types of parental involvement (1988, 1989) and the Hoover-Dempsey
and Sandler Model of Parent Involvement (1995, 1997) became popularized in the late 1990s as
two models that experts would employ when establishing a theoretical framework for their
research. Epstein’s (1988, 1989) model of six types of parent involvement (see figure 2) explores
the relationship between parent and student through multiple layers of interactions, both directly
and indirectly. This model employed by Epstein could very easily be examined through the

THE IMPACT OF THE DISCREPANCIES BETWEEN STUDENT AND PARENT 28
Figure 2. A representation of Epstein’s six types of parental involvement
(Source: Hamilton-Wentworth District School Board, n.d.)
theoretical scope of Bronfenbrenner’s theory of ecological systems (1979, 1986, 1992, 2005) in
order to determine which relationships within Bronfenbrenner’s theory are most common and
most influential within Epstein’s model.
Epstein defined six types of parent involvement that she surmised would increase school
effectiveness (1988, 1989). All six specified areas – parenting support, facilitating
communication, encouraging volunteerism, fostering home learning, including parents in school
decisions, and community activities –address the improvement of parenting skills that impact
direct relationships between the parent and the student – the microsystem – or relationships
between the parent and teachers or school administration – the mesosystem. Variations of parent
support activities such as helping a parent to attain a GED and assisting in a job search go

THE IMPACT OF THE DISCREPANCIES BETWEEN STUDENT AND PARENT 29
beyond microsystem interactions. A majority of the events that make up community activities
can be viewed as relationships within the other five systems as these activities are impacted by
direct relationships (microsystem), interactions between relationships (mesosystem), education,
local, and state policies (exosystem), and local custom and culture (macrosystem).
Hoover-Dempsey and Sandler posit a five-level theory of parent involvement – the
decision to become involved, the parent’s choice of the type of involvement, the different
mechanisms in which parent involvement impacts student outcomes, mediating variables of the
effect of parent involvement on student outcomes, and student outcomes – that suggests the
impact of parent involvement is an evolutionary process (1995,1997). This proposed evolution
of the parent involvement process, in theory, relates directly to Bronfenbrenner’s ecological
systems theory (1979, 1986, 1992, 2005) by evaluating constructs and relationships that promote
parent involvement, and how those constructs directly and indirectly impact the student
outcomes, or more precisely, the development of the child.
The first level of parent involvement in the Hoover-Dempsey & Sandler (1995, 1997)
Model of Parent Involvement, the parent’s decision to become involved in the education of his or
her child, theorizes on the impact that previous parent experiences have had on the parent’s
decision to participate in the education of the child. The constructs that led to the parent’s
decision of becoming involved have been influenced by the parent’s cultural belief system
(macrosystem), his or her experiences with educational and civil policies (exosystem),
relationships between parent and teacher (mesosystem), direct interaction with the child
(microsystem) and have been built over time (chronosystem) (Bronfenbrenner, 1979, 1986,
1992, 2005). The second level, the parent’s decision on which type of parent involvement to
participate in, is influenced by similar factors. Relationships within the final three stages of the
THE IMPACT OF THE DISCREPANCIES BETWEEN STUDENT AND PARENT 30
Hoover-Dempsey and Sandler model exist mainly within relationships that mirror
Bronfenbrenner’s (1979,1985, 1992, 2005) microsystem, mesosystem, and exosystem.
This section set out to investigate early research on parent engagement and why findings
were often conflicting with one another. Through this investigation, it has also become apparent
that as the decade of the 1990s approached an end, researchers began viewing parent
involvement as more than just a direct relationship between child and parent, or parent and
school, instead considering age (Cotton & Wikelund, 1989; Griffith, 1998; Hess, Holloway,
Dickson, & Price, 1984; Marcon, 1993a, 1993b; Stevenson & Baker, 1987), gender (Paulson,
1994a), SES (Desimone, 1999; McNeal, 1999), ethnicity (Eagle, 1989; Paulson, 1994a, 1994b),
parent education (Stevenson & Baker, 1987) and social capital (McNeal, 1999) as variables
impacting the desire to participate as well as the effectiveness of parent involvement practices
(Fehrmann, Keith, & Reimers, 1987; Paulsen, 1994b; McNeal, 1999). Models established by
Epstein (1988, 1989) and Hoover-Dempsey and Sandler (1995, 1997) helped to spur on the
evaluation of parent involvement practices employing these variables, enabling the inspection of
a much wider range of relationships. The next section of this paper will continue to examine the
multiple relationships impacting parent involvement practices to determine which dimensions
have the greatest bearing on student outcomes, as well as discovering which relationships
possess the highest likelihood for change.
Making Sense of the Discord
Noting that most of the research on parent involvement was not experimental, and that
the sparse research that was empirical reported conflicting findings, Fan and Chen (2001) sought
to clarify the dissonance within parent involvement research by performing a meta-analysis. Fan
and Chen’s meta-analysis began to give meaning to parent involvement by defining the practices
and analyzing the effects parent involvement had on students’ academic achievement. Fan and
THE IMPACT OF THE DISCREPANCIES BETWEEN STUDENT AND PARENT 31
Chen’s work also spurred additional studies that would seek to further define the impact of
parent involvement within specific groups (e.g., ethnicity, gender, age, SES). Expanding on the
findings of Fan and Chen, Jeynes (2003), also using a meta-analysis, investigated the relationship
between parent involvement and minority students’ academic achievement. A few years later
Jeynes (2005) examined parent involvement research by examining the impact of parent
involvement on the academic performance of elementary-aged children attending urban schools.
A follow-up meta-analysis of studies investigated the influence of parent involvement on the
academic success in secondary urban school children (Jeynes, 2007).
Rothman and colleagues describe a meta-analysis as a statistical method used to analyze
results from multiple studies (Rothman, Greenland, & Lash, 2008). The comparison of results
from multiple studies is utilized to make conclusions about the existence of relationships. In the
early 2000s, Fan and Chen (2001), and Jeynes (2003, 2005, 2007) used meta-analyses to attempt
to explain the relationship between parent involvement and student academic outcomes. This
section will examine in detail these studies and assess the contributions that these studies have
had on developing greater lucidity within the field of parent involvement research.
Parent Expectations Driving Academic Outcomes
Whether it was through the ability to anticipate the coming importance placed on parent
involvement practices by the federal government, or it was completely coincidental, the research
of Fan and Chen (2001) came at a critical time in the history of parent involvement. As the 20th
century ended, and the debate on the impact of parent involvement on student academic
outcomes continued, No Child Left Behind (No Child Left Behind [NCLB], 2002) and the federal
dollars accompanying its programs fueled the flames of discord. NCLB required Title I schools
to employ parent involvement programs to address the educational gap that continued to exist
within most inner-city schools in hopes of increasing academic performance. Realizing that

THE IMPACT OF THE DISCREPANCIES BETWEEN STUDENT AND PARENT 32
educators, lawmakers, and parents were becoming increasingly enamored with the possibility of
parent involvement having positive effects on student success, and that most of the current
research on the topic produced contradictory results, Fan and Chen’s (2001) meta-analysis
sought to add clarity to the topic. Fan and Chen argued that much of the conflict surrounding the
impact of parent involvement had to do with the wide variety of definitions used in empirical
studies, as well as in common discussions of parent involvement practices. Employing a meta-
analysis, Fan and Chen assessed the relationship between parent involvement indicators and
students’ academic outcomes. They acknowledged the breadth of qualitative work published
with regards to parent involvement, but by definition a meta-analysis is a statistical approach to
summarizing quantitative research on a specific topic. They argued that examining the
relationship between parent involvement indicators and academic outcomes is more impactful
through the study of empirical research. Still, the quantitative studies were conflicting in findings
due to “vast inconsistencies” (Fan & Chen, 2001, p. 1) in defining parent involvement and
measurable outcomes.
Fan and Chen (2001) established three major parameters when developing the
requirements of their meta-analysis on parent involvement. The considerations set forth were
that the studies had reported their own empirical findings, had taken place between 1980 and
2000, and had reported significant Pearson correlations between the parent involvement
indicators and the various academic outcomes. The first consideration enacted by Fan and Chen
was logical because empirical results must be reported to evaluate a study through the use of a
meta-analysis. Including the requirement that the authors of each study must report their own
findings prevents the duplicate correlations being used in the calculation of the meta-analysis
results. To assure that only the most recent results were included in their meta-analysis, Fan and
Chen’s second condition limited the studies reviewed to only those performed between 1980 and
THE IMPACT OF THE DISCREPANCIES BETWEEN STUDENT AND PARENT 33
2000. Ultimately, only three of the twenty-five studies incorporated in the meta-analysis were
performed prior to 1992, allowing Fan and Chen to accomplish the goal of using only the latest
findings. Fan and Chen suggested that results provided using regression and path analysis
models were often confounded by other variables in the analysis. They decided that these
statistical methods were not amicable modes of analysis when performing a meta-analysis; hence
the requirement that bivariate relationships obtained from the Pearson correlations must be
present to represent the relationship between study variables. Twenty-five studies met the
criteria Fan and Chen set forth for final inclusion in the meta-analysis, producing 92 unique
Pearson correlations between parent involvement practices and academic outcomes.
In the examination of the twenty-five studies that met their strict parameters, Fan and
Chen (2001) found many differences in the operational definition of both parent involvement and
the associated outcome variables related to academic achievement. Because of the
generalization of parent involvement activities (Barnard, 2004; Davis-Kean, 2005; Fan & Chen,
2001; Jacobs & Harvey, 2005), the ability to accurately measure the impact of parent
involvement on students’ academic outcomes relies greatly on the ability to clearly define
specific types of parent involvement practices, as well as specific forms of academic
achievement. In order to explain what action was having an impact on specific academic
outcomes, Fan and Chen (2001) divided parent involvement indicators from the 25 studies into
five distinct categories: parent expectations of and aspirations for their children, communication
with children on school-related topics, parent participation in school-related events, home
structure and parental supervision of children with regards to school matters, and general parent
involvement practices not included in the other four indicators. Fan and Chen also segmented
varying forms of academic achievement within their study. Student achievement was defined by
two factors, measurement and area of academic achievement. Fan and Chen defined the

THE IMPACT OF THE DISCREPANCIES BETWEEN STUDENT AND PARENT 34
different measures of academic achievement as school GPA, test scores, and other. The category
of other included variables such as retention, graduation, and teacher’s perceptions. Academic
achievement categories included math, reading, sciences, social studies, other, and a general
category. The category defined as other consisted of overall aptitude measures as well as
subjects that were defined, but not related to the four subjects mentioned previously. General
was the category used to explain those subjects that were not clearly identified or left unspecified
in their previous study.
The first analysis undertaken by Fan and Chen (2001) was to test for moderating factors
of the relationship between parent involvement and academic achievement using general linear
modeling (GLM). The moderating variables included in the inquiry were age, ethnicity, measure
of academic achievement, area of academic achievement, and parent involvement dimensions.
During the initial evaluation, Fan and Chen did not scrutinize specific types of academic
measure, area of academics, or parent involvement dimensions. The results using the
transformed Fisher’s z’s indicated that age (z =5.09), ethnicity (z =5.68), area of academic
achievement (z =27.89), and parental involvement dimensions (z =26.60) all had statistically
significant moderating effects on the dependent variable, students’ academic achievement.
Measure of academic achievement (z =1.13) was shown to have no moderating effect. Fan and
Chen noted that the results suggested, “the relationship between parental involvement and
students’ academic achievement should not be generalized across different operational
definitions of parental involvement, nor should it be generalized across different areas of
academic achievement” (2001, p.11). Because age and ethnicity had a significant, but small
moderating effect, Fan and Chen chose to omit these two variables from future analysis.
In order to investigate the impact of specific components within the area of academic
achievement and dimensions of parent involvement, Fan and Chen (2001) used correlation

THE IMPACT OF THE DISCREPANCIES BETWEEN STUDENT AND PARENT 35
coefficients to identify the strengths of relationships among effect sizes. Fan and Chen first
calculated an overall effect size by averaging all the studies (r = .25). This result would indicate
a medium effect size using Cohen’s suggestion that within the social sciences a medium effect
size should be considered when r = .30 (Cohen, 1988). Fan and Chen then calculated the effect
sizes with specific groupings of studies investigating individual variables within the area of
academic achievement – math (r = .18), reading (r = .18), science (r = .15), social studies (r =
.18), other (r = .34), and general (r = .33) – and parent involvement dimensions – aspirations /
expectations (r = .40), communication (r = .19), supervision (r = .09), participation (r = .32), and
other (r = .29). The results suggest that individual subjects may not be the best way to examine
the overall impact of parent involvement on students’ achievement. Instead, the strongest
correlations between parent involvement and academic achievement appear to occur when a
students’ overall performance is considered. Fan and Chen noted that this made sense because
parent involvement practices are not normally focused on a singular subject, but on the student,
or students, as a whole.
The parent involvement dimension that had the strongest correlation to students’
academic achievement, according to Fan and Chen’s (2001) meta-analysis, was parent
expectations / aspirations. Parent participation and the category capturing all other forms of
parent involvement, as previously defined by Fan and Chen, were also strongly related to
students’ academic outcomes. Expectations and aspirations could not be separated in the
analysis because there were too few studies included in the meta-analysis (25). However, while
these terms are related, they are uniquely different. Jacobs and Harvey (2005) operationally
defined expectations and aspirations in their research. Their use of expected results to define
expectations and desired results to define aspirations clearly delineated a difference between the
two terms and supported the theory that the two parent involvement indicators should be
THE IMPACT OF THE DISCREPANCIES BETWEEN STUDENT AND PARENT 36
investigated individually. These findings were important to the field of parent involvement as
they began to give a sense of the impact of parent involvement practices using focused
definitions of both the practices and the outcomes.
Unlike the impact of parent expectations, parent supervision had the weakest relationship
to students’ achievement (Fan & Chen, 2001). Although Fan and Chen found that parental
supervision had the weakest relationship to predicting academic outcomes of those variables they
observed, it is essential to note that the results regarding this weak association may be skewed by
the fact that parents may involve themselves more frequently in student supervision if the child is
already struggling academically (Carpenter, 2008; Fan & Chen, 2001). For example, when a
student is failing a class at the first reporting mark, parents may become more engaged in the
home supervision. The timing of the participation may mitigate the impact of the association on
the current year’s academic achievement. However, Fan and Chen warn against discounting the
impact of parent supervision based on their results, noting the possible confounding variables, as
well as the limited number of studies used in the meta-analysis.
Fan and Chen’s (2001) work was a critical contribution to the emerging topic of parent
involvement research. Through the 1980s and 1990s, research on the topic of parent
involvement ostensibly contradicted itself. Fan and Chen added some clarity through their
findings by defining parent involvement indicators and academic outcomes and assessing the
strength of those relationships. While the work was essential to spurring new focused research,
such as that of Jeynes, it was not without limitations. Fan and Chen themselves noted that their
study was limited by the lack of empirical research that met their established criteria – only 25
studies were reviewed. It could also be argued that it was a misstep by Fan and Chen to omit age
and ethnicity from their final analysis due to the relatively small practical significance age and
ethnicity had on students’ academic achievement, as previous studies found that both age (Eccles
THE IMPACT OF THE DISCREPANCIES BETWEEN STUDENT AND PARENT 37
& Harold, 1993; Hoover-Dempsey, Bassier, & Brissie, 1987) and ethnicity (Desimone, 1999;
Hao & Bonstead-Bruns, 1998; McNeal, 1999) moderated the relationship between parent
involvement and student outcomes. Finally, the lack of analysis of the socio-economic status
(SES) variable is glaring. Earlier studies found that there is a direct relationship between a
child’s SES and the impact of parent involvement on a student’s academic success (Desimone,
1999; Hoover-Dempsey, Bassier, & Brissie, 1987; McNeal, 1999; Sui-Chu & Willms, 1996).
The second and third limitations are addressed in the works of Jeynes, and many of the
individual studies that will be examined in the final section of this paper.
The Impact of Parent Expectations on Urban Students’ Academic Achievement
Shortly following the work of Fan and Chen (2001), Jeynes (2003, 2005, 2007) embarked
on a series of three meta-analysis studies that confirmed some of the findings of his predecessors
and expanded the research to include SES, age (Jeynes, 2005, 2007), and ethnicity (Jeynes, 2003,
2005, 2007). The addition of SES, age, and ethnicity as variables moderating the impact of
parent involvement on students’ academic achievement corroborated findings from earlier
research that included age (Eccles & Harold, 1993; Hoover-Dempsey, Bassier, & Brissie, 1987),
SES (Desimone, 1999; Hoover-Dempsey, Bassier, & Brissie, 1987; McNeal, 1999; Sui-Chu &
Willms, 1996), and race (Desimone, 1999; Hao & Bonstead-Bruns, 1998; McNeal, 1999) as
factors, in addition to supporting Bronfenbrenner’s ecological systems theory (1979, 1986, 1992,
2005). In 2003, Jeynes addressed socio-economic status (SES) and ethnicity while analyzing the
impact of parent involvement on minority students’ academic achievement. The impact of age
as a moderating factor between parent involvement and students’ academic achievement was
investigated by Jeynes in 2005 – impact of parent involvement on the academic achievement of
urban elementary students – and in 2007 – impact of parent involvement on the academic
achievement of urban secondary students. The addition of these three variables echoes the idea

THE IMPACT OF THE DISCREPANCIES BETWEEN STUDENT AND PARENT 38
that parent involvement is not just a simple relationship – or limited to the micro-system – as
SES, age, and ethnicity can impact human development across all systems in Bronfenbrenner’s
theory (1979, 1986, 1992, 2005).
Within all three meta-analyses conducted by Jeynes (2003, 2005, 2007), the quality of the
study was investigated as a predictor of the relationship between parent involvement and student
academic outcomes. None of the meta-analyses conducted found any relationship between the
quality of study and the impact of parent involvement on academic outcomes. Hence, this
variable is not addressed within any of the three sub-sections that follow.
Jeynes (2003), through a meta-analysis, investigated the impact of parent involvement on
the academic performance of urban students. Although specific study criteria were not
mentioned, requirements of urban students included in the study, specific parent involvement
measures, and statistical information that would allow for the calculation of effect sizes seemed
to be underlying necessities. Following the lead of Fan and Chen (2001), Jeynes divided the
dimensions of parent involvement from the 21 studies he investigated into groupings so that he
could study the impact of parent involvement on student success and determine if any of the
indicators had differing effects compared to the others considered (Jeynes, 2003). Jeynes’ study
employed some categories similar to those employed by Fan and Chen – parent attendance at
school functions, parent communication with the school, parent expectations of students, and
parents assisting student with homework – and other categories of parent involvement that were
newly created – parents implementing rules related to school at home, parenting styles, and
parents reading to their children. Jeynes grouped students’ academic achievement into four
different outcome variables – overall academic performance, grades, standardized testing, and
general academic measures. The category of general academic measures was a catchall category
that consisted of measures such as teacher ratings. Jeynes’ 2003 research expanded upon Fan

THE IMPACT OF THE DISCREPANCIES BETWEEN STUDENT AND PARENT 39
and Chen’s work by adding ethnicity and gender variables to the meta-analysis. The ethnicity
categories used in the analysis were as follows: mostly African-American, all African-American,
mostly Asian-American, all Asian-American, mostly Latino and Asian-American, and all Latino
and Asian-American.
In the analysis, Jeynes evaluated effect sizes of combined parent involvement studies that
studied similar variables using Hedges g (2003), noting that Hedges g was a more conservative
estimate of effect size than Cohen’s d (Hedges, 1981; Jeynes 2003). Hedges stated, “unlike
statistical significance, effect sizes represent strength of relationships without regard to sample
size” (Hedges, 2008, p.167). Because the sample sizes within the studies used in most meta-
analyses differ, the use of effect sizes (as opposed to p-values) yields a more accurate picture of
the practical significance of the results. For the social sciences, effect sizes are considered small
at .10, medium at .30, and large at .50 (Cohen, 1988, 1992).
The results from Jeynes’ (2003) analysis showed that the statistically significant
relationship between general parent involvement and overall academic performance was
strongest for those studies that consisted of mostly African-Americans (g = .44), all African-
Americans (g = .48), mostly Latino and Asian-Americans (g = .43), and all Latino and Asian-
Americans (g = .48), all possessing large effect sizes. The relationship was weakest for studies
consisting of mostly or all Asian-American students (g = .22). The only other academic category
that had all ethnic groups represented in at least one study was standardized testing. Results
were similar, and also statistically significant, for studies containing mostly Latino and Asian-
Americans (g = .43), all Latino and Asian-Americans (g = .48), and mostly or all Asian-
American students (g = .22). However, compared to overall academic performance, the
relationship between general parent involvement and student performance showed medium effect
sizes for studies investigating mostly African-American students (g = .32) or all African-
THE IMPACT OF THE DISCREPANCIES BETWEEN STUDENT AND PARENT 40
American students (g = .33). These findings would suggest that general parent involvement
practices have a strong positive relationship with student overall academic performance and
standardized test scores in African-American and Latino students, although the strength of the
relationship between general parent involvement and standardized test scores is slightly weaker
for African-American students than the relationship between general parent involvement
practices and overall academic outcomes.
Since overall parent involvement practices had the strongest relationship with overall
academic achievement, Jeynes (2003) investigated this relationship further by studying the effect
sizes between individual parent involvement indicators and overall academic outcomes. Four
indicators – parenting style, parental attendance, reading at home, and rules set at home – were
represented in studies included in the meta-analysis that investigated each ethnic group analyzed
by Jeynes. Parenting style had a statistically significant relationship with overall academic
outcomes in studies with mostly or all African-American students (g = .44), but virtually no
relationship with any other of the ethnic groups evaluated in this study. Similarly, parent
attendance had the strongest relationship (also statistically significant) on overall academic
achievement in studies with mostly African American students (g = .51). However, in studies
with either Asian-American students or Latino and Asian-American students, the non-
statistically significant relationship was negative (g = -.29). These findings would indicate that
the impact of parenting style and parent attendance at school functions has a stronger impact on
the overall academic performance of African-American students than it has on Latino and Asian-
American students. Setting rules at home did not have a statistically significant relationship with
overall academic outcomes for any of the individual ethnic groups, denoting that the impact of
this form of parent involvement may not differ between African-American, Asian-American, and
Latino students. However, the relationship between reading at home and overall academic

THE IMPACT OF THE DISCREPANCIES BETWEEN STUDENT AND PARENT 41
performance was statistically significant in studies consisting of Latino and Asian-Americans (g
= .21), and only Asian-American students (g = .21).
There were two areas of parent involvement studied by Jeynes (2003) in which only
studies containing African-American students were included in the meta-analysis – parent
expectations and homework assistance. Supporting the findings of Fan and Chen (2001), Jeynes
(2003) found that the relationship between parent expectations and overall academic
achievement was statistically significant for African-American students (g = .57). Contrary to
the findings of Fan and Chen (2001), Jeynes (2003) found that a positive relationship between
parent homework assistance and overall academic outcomes existed for African-American
students (g = .57). The latter findings would indicate a need for further research on the
relationship between parent homework help and student academic success, because as with Fan
and Chen (2001), Jeynes’ (2003) research is limited by the number of studies included within the
analysis.
Overall, Jeynes (2003) found that ethnicity did moderate the relationship between parent
involvement and student academic outcomes, and that some parent involvement indicators had a
greater impact on some ethnic groups than on others. Jeynes also investigated whether gender
moderated the relationship between parent involvement and student academic outcomes and
found no evidence of a difference. While Jeynes’ 2003 work illuminated the fact that different
parent involvement practices are more impactful to some ethnic groups than to others, the study
was limited by the overall number of empirical studies available, as well as the lack of diversity
in ethnic groups of the studies investigating the different dimensions of parent involvement.
The effect of parent expectations on elementary students. Following up his work
from 2003, Jeynes embarked on a second meta-analysis. This time Jeynes investigated the
impact that parent involvement practices had on urban elementary school students. Jeynes was

THE IMPACT OF THE DISCREPANCIES BETWEEN STUDENT AND PARENT 42
able to examine 41 studies that met the following criteria: (a) being published or unpublished, (b)
the presence of a measurable parent involvement variable, (c) enough statistical data to calculate
an effect size, (d) the presence of a true control group (if a control group was used), and (e) an
urban elementary environment for the study. As in 2003, Jeynes used the more conservative
Hedges g (Hedges, 1981) to calculate effect sizes due to its use of a pooled standard deviation in
the denominator. The variables assessed in the 2005 meta-analysis mirrored those Jeynes
employed in 2003. Parent involvement practices were divided into seven categories – parent
attendance at school functions, parent communication with the school, parent expectations of
students, parents assisting student with homework, parent implementing school-related rules at
home, parenting styles, and parents reading to their children – and students’ academic
achievement into four – overall academic performance, grades, standardized testing, and general
academic measures (Jeynes 2003, 2005).
Aside from examining only elementary school students, there were two other major
differences in Jeynes’ 2005 meta-analysis compared to the one developed in 2003. The first was
to determine if there was a difference between the studies with sophisticated controls and those
without. Sophisticated controls described those studies that reported on age, ethnicity, SES, and
previous achievement. The second major difference was the evaluation of parent involvement
programs, as well as parent involvement practices. In the previous study, Jeynes only looked at
those practices directly attributed to parents. By adding parent involvement programs, he
extended the analysis to include school attributes.
Jeynes (2005) found that general parent involvement practices yielded strong effect sizes
when analyzing the impact of these practices on overall academic performance (g = .75, p < .01),
grades (g = .85, p < .0001), and standardized tests (g = .40, p < .01) in studies without
sophisticated controls, and very similar results in studies that did included sophisticated controls

THE IMPACT OF THE DISCREPANCIES BETWEEN STUDENT AND PARENT 43
- overall academic performance (g = .73, p < .01), grades (g = .86, p < .0001), and standardized
tests (g = .21, p < .01). These results would point to no real differences between the two types of
studies on the impact of general parent involvement practices on these three academic outcomes.
When analyzing the same outcome variables in relation to parent involvement programs, studies
without sophisticated controls reported significant results for overall academic performance (g =
.31, p < .05), other (g = .30, p < .05), and standardized tests (g = .40, p < .01). Only one
category, overall academic performance, had multiple studies that used sophisticated controls for
use in this meta-analysis. The findings were statistically significant at g = .19, p < .05. Of
importance is the finding that when considering studies specifically on parent involvement
programs, those with sophisticated controls were deemed by Jeynes to be homogenous, while
those without sophisticated controls were considered heterogeneous. Even more important to the
field of parent involvement was that Jeynes’ findings conflict with those of Mattingly and
associates who found no impact from parent involvement programs on students’ academic
success (Mattingly, et al., 2002).
When analyzing the impact of individual dimensions of parent involvement practices,
Jeynes’ 2005 findings confirmed those of Fan and Chens’ 2001 meta-analysis – parental
expectations produced the largest effect size of all the parent involvement dimensions. An effect
size of g = .58 (p < .05) was calculated for overall achievement when combining studies
including a parent expectations variable. Also corroborating the findings of Fan and Chen
(2001), parent’s assistance in homework produced the lowest effect size (g = -.08) and was not
statistically significant (Jeynes, 2005).
Finally, results from the meta-analysis showed that the impact of parent involvement
practices was reflected across race and gender (Jeynes, 2005). Effect sizes were considered
large (Cohen, 1988, 1992) for general parent involvement on overall academic achievement in

THE IMPACT OF THE DISCREPANCIES BETWEEN STUDENT AND PARENT 44
studies without sophisticated controls, and were similar for boys (g = .52, p < .001) and girls (g =
.62, p < .01) with no statistically significant difference between genders. Of the studies in the
meta-analysis that used sophisticated controls, none divided participants by gender. The impact
of general parent involvement practices on academic outcomes also held across ethnicities.
Effect sizes were considered large for studies using sophisticated controls (g = .84, p < .0001)
and for those without sophisticated controls (g = 1.06, p < .0001). These results were not
statistically significantly different than the effect sizes seen in studies with all or mostly white
students.
The number of studies analyzed in Jeynes’ 2005 meta-analysis was more than double the
number used previously by Fan and Chen (2001) (21 studies) and Jeynes (2003) (20 studies).
However, because Jeynes chose to evaluate so many different independent and dependent
variables, the number of studies was still a limitation. There were many groups who were not
represented in certain evaluations, due to no studies pertaining to that specific group. This is an
inherent problem with meta-analysis studies and will always be a challenge to those studies that
seek to use variables such as race and age to summarize research in a given field. Additionally,
while Jeynes claims his 2005 study also examined race, this claim could be better characterized
as a study that examined the impact of parent involvement practices on the academic outcomes
of minority students, as the variables used to define race were studies that contain all white
students, all minority students, or mostly minority students (Jeynes, 2005).
The effect of parent expectations on secondary students. The final meta-analyses, of
the three conducted by Jeynes, that focused on the impact of parent involvement on student
academic success was published in 2007 and investigated studies that reported on the
relationship of parent involvement and academic outcomes for urban secondary students (2007).
This 2007 report was very similar to the 2005 meta-analysis published by Jeynes, differing only
THE IMPACT OF THE DISCREPANCIES BETWEEN STUDENT AND PARENT 45
by the age of students investigated. Fifty-two studies were used in Jeynes’ 2007 meta-analysis,
all meeting the following requirements: (a) the variable of parent involvement had to be
measurable as an individual variable, (b) statistical information in the study must be present in
order to calculate effect sizes, (c) if a control group was used, it must be a true control group, and
(d) the study had to take place in an urban secondary school. For purposes of this meta-analysis,
Jeynes did not eliminate a study if it was not published.
Jeynes used the same categorical groups for independent and dependent variables as in
his 2003 and 2005 studies. The independent variables, or the differing dimensions of parent
involvement, were divided into seven categories – parent attendance at school functions, parent
communication with the school, parent expectations of students, parents assisting student with
homework, parent implementing rules related to school at home, parenting styles, and parents
reading to their children (Jeynes, 2003, 2005, 2007). The outcome variables were associated
with students’ academic achievement and were divided into four separate and distinct categories
– overall academic performance, grades, standardized testing, and general academic measures.
Similar to the 2005 study that claimed to examine race, the race variable was divided into studies
that examined (a) all white students, (b) all minority students, and (c) mostly minority students
(Jeynes, 2005, 2007). For the purpose of his 2007 meta-analysis, Jeynes defined secondary
school as grades 6th through 12th (Jeynes, 2007).
As in his previous two meta-analyses, Jeynes used Hedges g to calculate effect sizes
(Jeynes, 2003, 2005, 2007). Hedges g is considered to be a more conservative approach
compared to Cohen’s d due to its use of a pooled standard deviation in the denominator (Hedges,
1981). Additionally, Jeynes addressed studies that had small samples sizes by employing
“conversion formulas used by Glass, McGaw, and Smith” (Jeynes, 2007, p. 88). Jeynes also
evaluated studies, as in 2005, by defining them as using sophisticated controls (evaluating age,

THE IMPACT OF THE DISCREPANCIES BETWEEN STUDENT AND PARENT 46
race, and SES within the study) or not reporting the use of sophisticated controls.
When examining effect sizes for general parent involvement in relation to academic
outcomes, all reported effect sizes were considered to be medium to large (Cohen, 1988, 1992)
and significant for studies with and without the use of sophisticated controls (Jeynes, 2007). The
effect size for general parent involvement and overall academic performance without controls
was at g = .53, p < .0001. For similar studies with controls, a smaller effect size was produced at
g = .38, p < .05. Standardized testing and general overall parent involvement produced the
largest effect size at g = .55, p < .0001 for studies not using sophisticated controls, and a g = .37
effect size (p < .05) for those studies that employed sophisticated controls. These findings
confirm the previous finding of Jeynes (2003, 2005) and Fan and Chen (2001), that overall
parent involvement has a significant and positive impact on the academic outcomes of students.
Additionally, parent involvement in relation to overall academic success and standardized testing
continues to produce larger effect sizes than with other academic outcomes (Jeynes, 2007).
While none of the studies included in the 2007 meta-analysis investigated parent
involvement programs using sophisticated controls, there were significant findings (Jeynes,
2007). The examination of parent involvement practices and overall academic achievement (g =
.35, p < .05), grades (g = .25, p < .001), and other academic measures (g = .25, p < .001) all
produced medium effect sizes (Cohen, 1988, 1992). While the relationship for standardized
testing and programs of parental involvement produced a medium effect size (g = .36), the
results were not statistically significant. Jeynes’ findings support his early results that parent
involvement programs have a positive effect on students’ academic outcomes (Jeynes, 2005,
2007), and contradict Mattingly and associates’ 2002 conclusions (Mattingly, et al., 2002). The
urban setting of these studies makes the finding even more important as many of the Title I
schools served through NCLB are in urban areas (NCLB, 2001). The positive results would

THE IMPACT OF THE DISCREPANCIES BETWEEN STUDENT AND PARENT 47
endorse one of the primary focuses of NCLB, which is to direct the involvement of parents in the
education of their children, both at home and in the school.
When Jeynes examined the impact of each individual dimension of parent involvement
on specific academic outcomes, the findings continued to support parent expectations as the most
influential dimension of parent involvement (Jeynes, 2007). Effect sizes were large (Cohen,
1988, 1992) for parent expectations and overall student achievement (g = .88, p < .0001), grades
(g = .85, p < .0001), and other forms of academic measurements (g = 1.09, p < .0001) for studies
without sophisticated controls (Jeynes, 2007). No studies that employed sophisticated controls
reported individual parent involvement practices. Additionally, there were no results for parent
expectations and standardized tests, because reports that contained these variables were not
employed within the meta-analysis.
The final investigation by Jeynes in his 2007 meta-analysis was to evaluate the impact
of general parent involvement practices on the academic outcomes of minority students (2007).
For this analysis, Jeynes divided the studies into two groupings, the first in which the studies
contained mostly minority students in the sample, and the second in which the studies contained
all minority students. As mentioned previously in this section, Jeynes labeled this an
examination by race, but it may be more appropriate to call this an evaluation of the impact of
parent involvement on minority students. The results of the analysis show that the impact of
general parent involvement practices holds for studies in which the participants are mostly
minorities (g = .53, p < .05) or all minorities (g = .46, p < .001), when evaluating the impact of
such practices on overall academic measures. In studies with all minority students in the sample,
medium to large effect sizes (Cohen, 1988, 1992) were produced for general parent involvement
practices and grades (g = .42, p < .0001) and standardized testing (g = .49, p < .001). These
findings, that the impact of parent involvement holds for minority students, is important to

THE IMPACT OF THE DISCREPANCIES BETWEEN STUDENT AND PARENT 48
educational research and practice as schools and communities continue to seek methods to close
the educational gap in our mostly minority inner-city schools.
Jeynes’ work through the decade of the 2000s brought further clarity to the field of parent
involvement research (Jeynes, 2003, 2005, 2007). Not only did Jeynes’ work confirm Fan and
Chen’s finding (2001) that parent involvement has the greatest impact on overall academic
achievement in students, but Jeynes found that this impact held in urban and minority
communities. Further, the results discounted the findings of Mattingly and associates (2002), by
presenting that within urban schools, parent involvement programs can indeed impact student
learning and achievement.
Expectations and the Ecological Systems Theory
The stated focus of Fan and Chen’s meta-analysis was to make sense of the impact of
parent involvement on student outcomes through empirical studies. However, they noted that
typologies and theories developed to support the need for parent involvement were not to be
ignored within the parent involvement discussion (2001). In particular, Fan and Chen pointed
toward the works of Epstein (1988a, 1988b) and Hoover-Dempsey and Sandler (1995), as
foundational theories supporting high quality parent engagement. By establishing the
importance of the theories and foundations above, Fan and Chen indirectly brought attention to
the importance of Bronfenbrenner’s theory of ecological systems (1979, 1986, 1992, 2005) when
developing and analyzing dimensions of parent involvement.
The research of Fan and Chen (2001) and Jeynes (2003, 2005, 2007) suggests that parent
expectations have the greatest impact on overall student outcomes. The ecological systems
theory suggests that proximal processes advance human development (Bronfenbrenner, 1979,
1986, 1992, 2005) and that the interaction of these systems determine how a child or parent may
develop. When examining how a parent’s expectations are developed, it is difficult to do so

THE IMPACT OF THE DISCREPANCIES BETWEEN STUDENT AND PARENT 49
without considering the impact that all the interactions, experiences, and relationships a parent
has experienced within his or her lifetime have had on building overall expectations for the child,
and how those expectations are communicated.
Previous research has discovered many different variables that influence the development
of the processes that could impact the way a parent sets expectations for their children: parent
education levels (Davis-Kean, 2005; Eccles & Davis-Kean, 2005; Eccles, Jacobs, & Harold,
1990), race (Carpenter, 2008; Davis-Kean, 2005; Seyfried & Chung, 2002), SES (Davis-Kean,
2005; Seyfried & Chung, 2002), teacher expectations (Benner & Mistry, 2007), student
expectations and low student achievement (Zhang, Haddad, Torres, & Chen, 2011). Viewing
these variables (such as race, education level, and SES) through the lens of ecological systems
theory (Bronfenbrenner, 1979, 1986, 1992, 2005), it could be conjectured that their interactions
greatly influence the level of expectations parents possess for their child’s education. These
variables work together to build social capital, which is critical for high-level interactions
between the systems of development. For example, Eccles, Jacobs, and Harold (1990)
contended that parent education levels had the greatest impact on parent expectations of their
students’ academic achievement, and Eccles and Davis-Kean pointed out that education levels of
the parent could impact “parents’ skills, values, and knowledge of the educational system, which,
in turn should influence the educational practices at home” (p. 191, 2005). However, it can be
argued through Bronfenbrenner’s (1979, 1986, 1992, 2005) ecological systems theory, that all of
the variables discussed in this review– parent education levels, race, SES, teacher expectations,
student expectations and student achievement – play an important role in influencing, both good
and bad, the level of expectations a parent holds for their children’s academic achievement.
The Impact of Parent Expectations on Students’ Academic Outcomes

THE IMPACT OF THE DISCREPANCIES BETWEEN STUDENT AND PARENT 50
The research of Fan and Chen (2001) and Jeynes (2003, 2005, 2007) confirmed what
some have been arguing for decades; the effect of parent expectations on child development has
been linked to positive outcomes (Entwisle & Baker, 1983; Entwisle & Hayduk, 1981). As
parent involvement has received greater attention as a way to influence students’
accomplishments in the classroom, a specific focus within the realm of parent involvement
should be placed on the power of parent expectations. This greater focus on parent expectations
should not be attributed only to previous research results such as those of Fan and Chen (2001),
Jeynes (2003, 2005, 2007), Entwisle and Baker (1983), but also because parent expectations are
a malleable variable that can be influenced throughout the academic lifetime of a student.
Because parent expectations have great influence over student academic outcomes, and because
the expectations parents hold are one of the dimensions of parent involvement that are malleable,
the remainder of this paper will examine studies that follow the publication of Fan and Chen’s
meta-analysis in 2001, those that explore the relationship between parent expectations and
students’ academic outcomes. It is important to note that the focus on parent expectations in no
way diminishes the importance of or impact on academic outcomes of the other indicators.
Positive Effect of Parent Expectations on Students’ Academic Success
Many studies since Fan and Chen (2001) have found a positive relationship between
parent expectations and academic outcomes (Davis-Kean, 2005; Froiland, Peterson, & Davidson,
2012; Hill & Tyson, 2009; Jacobs & Harvey, 2005; Phillipson & Phillipson, 2007; Seyfried &
Chung, 2002; Zhang, Haddad, Torres, & Chen, 2011). Seyfried and Chung (2002) were
interested in finding how parent expectations and teacher expectations interacted to predict
student outcomes. In examining 567 African American and European American urban students,
Seyfried and Chung distributed, collected, and analyzed parent and teacher surveys and inspected

THE IMPACT OF THE DISCREPANCIES BETWEEN STUDENT AND PARENT 51
grade-point-averages, and discovered that parent expectations were a strong predictor of
academic outcomes.
Like Seyfried and Chung (2002), Jacobs and Harvey (2005) examined the impact of
parent expectations on predicting student success. Jacobs and Harvey found that there was a
positive and significant correlation between parent expectations and success on the ENTER test,
and that the length of time the parents had held those expectations mediated the association with
the outcome of the test. The latter finding highlighted the importance of parents setting
expectations for their children at an early age. However, Jacobs and Harvey also found –
through the examination of a one-way ANOVA - that the higher-achieving schools had
statistically significantly higher parent expectations and parents at the higher achieving schools
placed a greater value on education than those at the medium and low performing schools. It is
important to note that parents at the higher achieving schools had a significantly higher level of
education than those at the medium and low performing schools. These findings appear to agree
with Eccles and Davis-Kean’s (2005) assertion that parent education levels are key in predicting
parent expectations and student academic outcomes.
Expanding on the research of Jacobs and Harvey (2005), Froiland, Peterson, and
Davidson (2012) investigated the long-term impact of parent expectations on student academic
outcomes. By using the National Center for Educational Statistics Early Child Longitudinal
Study-Kindergarten Cohort (West, Denton, & Germino-Hausken, 2000), they examined the
impact of parent expectations in kindergarten on their students’ academic outcomes in eighth
grade. Froiland and associates found that parent expectations during a child’s early years of
development, namely in kindergarten, showed a significantly stronger correlation with longer
lasting effect on the students’ academic performance in eighth grade than did students’
achievement in kindergarten (r = 0.30 correlation vs. r = 0.15).

THE IMPACT OF THE DISCREPANCIES BETWEEN STUDENT AND PARENT 52
Davis-Kean (2005), like Jacobs and Harvey (2005), examined education levels, socio-
economic status (SES), and ethnicity of parents and how these variables impacted the association
between parent expectations and student academic outcomes. Davis-Kean found that the “paths
linking these variables (education, SES, and ethnicity) to children’s academic achievement
differed by racial group” (2005, p.302). These findings suggested that while parent expectations
correlate strongly to student academic outcomes (r = 0.32 correlation) – regardless of race, SES
and education levels – the route in which parents of differing races develop and set those
expectations moderate the former relationship. This is an important fact for future researchers to
take into consideration, as the study suggested that generalizations with regards to how parents
formulate their expectations couldn’t be applied generically across all races.
Further expanding the research on parent expectations, Benner and Mistry (2007)
examined how parent and teacher expectations worked together to influence the academic
outcomes of low-SES, urban students ages nine to sixteen. They found that independently,
teachers’ and parents’ expectations had a significant association with students’ academic
outcomes. The study found that high mother expectations could combat the low expectations of
teachers. This finding is critical for inner-city youth, as Benner and Mistry discovered that a
high percentage of teachers in their study possessed low expectations for their students.
While the previously examined studies indicated how parent characteristics – race,
ethnicity, income and education – could mediate or moderate the level of expectations parents
hold for their students’ academic outcomes, others sought to explore how student academic
outcomes and student expectations mediate parent expectations. Zhang, Haddad, Torres, and
Chen (2011), using data from the National Educational Longitudinal Study of 1988 (NELS: 88)
(Ingles, Scott, Taylor, Owings, & Quinn, 1998), discovered that there was a reciprocal effect, or
mediation, between parent expectations and student expectations – meaning the higher the parent

THE IMPACT OF THE DISCREPANCIES BETWEEN STUDENT AND PARENT 53
expectation, the higher the student expectation, and vice versa. Additionally, Zhang and
associates established that there was also a mutual influence between parent and student
expectations and students’ academic outcomes. This finding supports previous literature that
suggests that parent expectations impact student outcomes, but also suggests that parents and
student expectations will be higher if the student is performing well in school. While this finding
is positive for those students who are excelling in school, this reciprocal relationship could be a
challenge to parent expectations, and in turn student academic improvement, for those students
who are struggling in the classroom. Within their study, Froiland, Peterson, and Davidson
(2012) built upon the findings for Zhang and colleagues (2011) by again demonstrating the
reciprocal nature of student and parent expectations, and that student expectations can also be
used to predict academic success.
This section has analyzed quantitative studies that examined the impact of parent
expectations on students’ academic outcomes. The findings show that parent expectations can
have a direct relationship to academic outcomes (Davis-Kean, 2005; Froiland, Peterson, &
Davidson, 2012; Jacobs & Harvey, 2005; Seyfried & Chung, 2002; Zhang, Haddad, Torres, &
Chen, 2011), can be mediated by income levels, education levels, (Davis-Kean, 2005) and
participation in other parent involvement practices, and can be moderated through race and
ethnicity (Davis-Kean, 2005; Seyfried & Chung, 2002; Zhang, Haddad, Torres, & Chen, 2011).
Additionally, it was discovered that parent expectations could be predicted through student
expectations, and vice versa (Froiland, Peterson, and Davidson, 2012; Zhang, Haddad, Torres, &
Chen, 2011).
Variables Impacting the Relationship Between Parent Expectations and Students’
Academic Success
THE IMPACT OF THE DISCREPANCIES BETWEEN STUDENT AND PARENT 54
While the research studies previously examined in this paper have found a positive
relationship between parent expectations and student outcomes, other research has shown a much
smaller or no statistically significant effect of expectations on academic outcomes. These
conflicting results seemingly are a product of differing methodologies. Within this section those
differences, such as income level, race, and ethnicity, are examined to determine the influence
these variables have on the overall bearing of parent expectations on students’ academic
achievement. These divergent results, due to the variables stated above, would lend credence to
the importance of the considerations of Bronfenbrenner’s theory when gauging the impact of
parent involvement on student outcomes.
Citing that previous studies failed to investigate the impact expectations had on Latino
students of immigrant parents, the fastest growing population in American schools, Carpenter
(2008) chose to investigate how immigrant parents’ expectations predicted the academic
outcomes of their children. He found that there were no statistically significant effects of parent
expectations on student outcomes for students who had at least one immigrant parent. His
findings did indicate that previous academic success and hours spent on homework did predict
math scores. The importance of his findings may indicate that students of immigrant parents rely
less on parent expectations and motivation, and more on their own drive and academic ability
than their counterparts.
Some studies that showed positive relationships between parent expectations and
academic outcomes also had findings that showed limited impact of parent expectations when
mediated or moderated by education level (Benner & Mistry, 2007; Englund, Luckner, Whaley,
& Egeland, 2004), socio-economic status (SES), or ethnicity (Davis-Kean, 2005; Seyfried &
Chung, 2002; Yan & Lin, 2005; Zhang, Haddad, Torres, & Chen, 2011). In a longitudinal
study, Englund, Luckner, Whaley, and Egeland (2004) found that the level of education attained
THE IMPACT OF THE DISCREPANCIES BETWEEN STUDENT AND PARENT 55
by the mother strongly predicted her expectations level for her child when entering first grade.
Benner and Mistry (2007) established that a mother’s expectations of achievement for her 5th
grade student did impact academic outcomes. However, they found that the lower the education
level of the mother, the less influence the mother’s expectations had on student achievement.
Through an examination of urban 8th graders, Seyfried and Chung (2002) found that
higher parent expectations predicted higher grade point averages in students, but the effect was
much greater for European American students than it was for African-American students. In a
similar study, but one that investigated how student academic expectations correlated strongly to
parent expectations, Zhang, Haddad, Torres, and Chen (2011) found that the relationship
between students’ academic expectations and parent expectations was weakest for African
American students. Wood, Kaplan, and McLoyd (2007) also found that within low-income
schools the expectations of students, teachers, and parents of students’ academic achievement
were lower for African-American students than for any other ethnicity. Additionally, they
discovered that the level of expectations a teacher had for her students could impact the student’s
own expectations in African-American students. Davis-Kean (2005) established that the strength
of association between parent expectations and reading achievement diminished the lower the
education level of the parent. Additionally, she found that ethnicity and income levels impacted
the strength of relationship between expectations and academic outcomes. Contrary to the
finding of Davis-Kean, Seyfried and Chung, and Wood, Kaplan, and McLoyd, Yan and Lin
(2005) discovered that parent expectations were the greatest predictor of math achievement for
seniors in high school. The data examined by Yan and Lin was from the National Education
Longitudinal Study: 1988 (NELS:88) dataset. These results illustrate that the effect of parent
education level, SES, and ethnicity varies when investigating the relationship between parent

THE IMPACT OF THE DISCREPANCIES BETWEEN STUDENT AND PARENT 56
expectations and academic outcomes of students. The findings indicate that parent education
level, SES, and ethnicity need to be considered more deeply in future studies.
The Argument for Understanding Parent Expectations through Qualitative Research
Some of the research previously explored in this paper found that parental expectations
have less impact in low SES or ethnic minority communities (Davis-Kean, 2005; Seyfried &
Chung, 2002; Zhang, Haddad, Torres, & Chen, 2011). To explore this phenomenon further,
recent qualitative work within low SES, ethnically diverse communities was investigated. For
example, in contrast to a qualitative study by Carpenter (2008) that found no significant
association between the expectations of parents and their child’s academic outcome, Lopez,
Scribner, and Mahitivanichcha (2001) investigated a single Latino migrant family to determine
how parent involvement impacted their children’s learning and academic accomplishments.
They found that outside of the normally accepted parent involvement practices that encourage
parents to be present on campus, study participants influenced their children’s learning through
expectations. What is seemingly different in the approach of Lopez and colleagues, compared to
Carpenter, is that other than the qualitative nature of the study, the participants of the study
turned their academic expectations for their children into a choice that their children could make
– do well in school and go to college or be subjected to a life of hard labor, such as the parents
were currently living. The parents instilled the value of education, and a strong work ethic, by
making all the children labor in the fields with the parents for a couple of weeks each summer.
Lopez’s team surmises that the participants’ children performed well in high school – all five
graduated in the top ten percent of their class – because the parents not only set an expectation of
graduating high school and going to college but provided the children with a glimpse of what
could happen should the children not be successful in the classroom.

THE IMPACT OF THE DISCREPANCIES BETWEEN STUDENT AND PARENT 57
Other researchers found that parents of ethnic minorities, and Latinos in particular, felt as
though their influence on their child’s education was discounted or ignored altogether by
teachers and administrators (Carreón, Drake, & Barton, 2005; Perreira, Chapman, & Stein, 2006;
Ramirez, 2003; Smith, Stern, & Shatrova, 2008; Souto-Manning & Swick, 2006). This practice
by teachers and administrators, while at times unintentional, shuts down school-to-home
partnerships, limiting the visible parent involvement practices that are considered by many to be
the norm (Smith, Stern, & Shatrova, 2008). However, this does not mean that parent
involvement practices cease to exist in these families, and that parents begin to care less about
learning. Smith, Stern, and Shatrova (2008) established that parents who feel that they are
disregarded by school personnel retreat from the school campus but still maintain the
expectations that were set prior to interactions with the school. These parents maintain that it is
their role to continue to instill respect for teachers, assist and monitor homework, and get their
children prepared for school. While expectations, in these cases, are not always verbally
communicated, value in education is communicated through the parents’ (normally the mothers’)
constant involvement in school matters at home.
These studies reveal that expectations are present whether they are clearly communicated
to school personnel. Carreón, Drake, and Barton (2005) noted that even though the parents in
their study felt disrespected by schools due to their limited English proficiency and lack of
education, the parents did not let that affect the high expectations the parents possessed for their
children’s academic success. While this study and the others discussed in the qualitative section
of this paper cannot be generalized, the information is beneficial in helping to understand
perceptions and practices of minority families and how this information can guide future
research and interactions with school personnel.

THE IMPACT OF THE DISCREPANCIES BETWEEN STUDENT AND PARENT 58
Rationale for Present Study
Researchers such as Fan and Chen (1999) have investigated the impact of parent
expectations and the effect they have on students’ academic success. Fan and Chen’s meta-
analysis revealed that of all forms of parent involvement, parent expectations of student
academic performance had the greatest impact on a student’s overall academic success. Recent
studies by Wang and Benner (2014) and McNeal (2014) built upon this discovery by examining
the phenomenon of parent expectations through an ecological lens – areas of the student’s
environment - as defined by the work of Bronfenbrenner (1979, 1986, 1992, 2005). The
ecological system consists of five interconnected layers– the microsystem, the exosystem, the
mesosystem, the macrosystem, and the chronosystem. The microsystem is the child’s most
immediate setting and consists of direct interactions between the child and others, such as
parents and siblings. The next level, the mesosystem is defined by interactions between persons
within the child’s microsystem when the child is not present (i.e., parent and teacher
conferences). The exosystem consists of events within the microsystem such as a parent losing a
job or moving from one city to another. The macrosystem is the layer of the ecosystem where
religion and culture reside. The macrosystem is made up of all regularly observed practices,
cultures, sub-cultures, ideologies and belief systems that reside in any of the previously
mentioned layers. The impact that time has on the overall ecological system of a child is called
the chronosystem – such as the increasing financial burdens of a job loss and how those burdens
and affects are impacting over time. Although Wang and Benner (2014) and McNeal (2014)
employed differing methodologies of incorporating a student’s ecosystem into the evaluation of
the impact of parent expectations (an environmental variable within a student’s microsystem),
both studies recognized the critical nature of a student’s surroundings and how those contexts
may influence the impact of parent expectations on academic achievement.
THE IMPACT OF THE DISCREPANCIES BETWEEN STUDENT AND PARENT 59
Using the National Education Longitudinal Study of 1988 (NELS:88) data set, Wang and
Benner (2014) treated the impact of parent expectations in a more sophisticated way than
previous researchers by examining how the discrepancy between adolescent (Grade 8) and parent
expectations of academic success, both actual and perceived, influenced academic achievement –
GPA, standardized test scores, and a student’s expectations of future educational attainment.
Other environmental factors including the role that gender and race played in moderating the
relationship between expectations and academic success were also assessed, but there were no
statistically significant differences found between genders or between races within their study.
Wang and Benner (2014) found that as a parent’s actual (i.e., self-reported) expectations
exceed her student’s expectations, the student’s academic achievement, in the form of
standardized test scores would rise. Additionally, Wang and Benner found that as a student’s
perceived parental expectations of academic success exceeded the student’s own expectations,
academic performance would fall. The first result could be understandable, when parents have a
higher expectation for their child’s academic success then the child does, it is easy to imagine
that those parents are highly involved in the student’s academic life in ways such as setting
academic goals, checking in on the student’s progress, assisting with homework, and setting
designated study times and locations (Davis-Kean, 2005).
Not as simple to unravel is why a student’s academic performance would suffer if her
expectations of academic success were lower than how she perceives her parents’ expectations.
It could be that even though the student perceives parent expectations to be high, the support
from the parents is not present, therefore parental impact is limited. Conversely, a student
perceiving that her parent has higher expectations than she possesses could cause her undue
stress (Agliata & Renk, 2008; Wang & Benner, 2014). Trying to please her parents, while not
believing she has the ability to achieve her parent’s lofty goals could have damaging effects.

THE IMPACT OF THE DISCREPANCIES BETWEEN STUDENT AND PARENT 60
Wang & Benner (2014) touched the surface of a student’s ecological system, more
specifically the mesosystem (Bronfenbrenner; 1979, 1986, 1992, 2005), by evaluating the
relationship of differences in student and parent expectations and how those differences impacted
overall academic achievement. McNeal (2014), however, took a more demographically nuanced
looked into a student’s environment by reviewing how, nested within schools, a student’s
parent’s background (socioeconomic status as defined by both parent’s occupations, education,
and overall family income), a parent’s interaction with her student (such as a child’s frequency
of discussing high-school programs, class content, and school activities with both parents), and a
parent’s involvement in PTO impacted academic achievement - results on standardized test
scores. By addressing these variables, McNeal’s study considered systems not only within the
microsystem, but the mesosystem and exosystem (Bronfenbrenner; 1979, 1986, 1992, 2005) of
the child. Each child’s school environment was specifically defined by two variables; the level
of poverty of the school, defined by percentage of students on free and reduced lunch, and
instability within a school which was defined by percentage of students that started and finished
the school year.
McNeal (2014) found that parent-child discussion significantly positively impacted
mathematics, science, and reading achievement. It was also discovered that parent-child
discussion, as well as parent involvement in PTO significantly increased a student’s own
expectations of academic attainment – how far they will go in school. Social context – SES –
was found to moderate the individual level effects of parent-child discussion and parent
involvement in PTO on a student’s own expectations of academic attainment. Additionally,
school effects such as concentration of poverty and school stability were also found to
significantly moderate the impact parent-child discussion and parent involvement in PTO had on

THE IMPACT OF THE DISCREPANCIES BETWEEN STUDENT AND PARENT 61
a student’s own expectations of academic attainment and achievement in mathematics, science
and reading.
An increase in academic achievement – science, reading, and math – due to an increase in
parent-child discussion can be explained through the understanding that the more a parent is
directly involved in academic discussions with her child, the more likely it is for the student to be
engaged in her school work, and more likely to get the most out of her academic potential.
Similarly, as a parent is more involved in both direct discussion with her child and more
involved in the school through PTO, a student is more likely to have higher expectations of not
only doing well in school, but a greater expectation to go on to college from high school. The
moderating effects of SES, defined by parent education and employment, could be viewed as the
more experience a parent has with higher education, the more likely her involvement with the
child's schoolwork and school activities will be related to the child's academic expectations.
Similarly, the better the job, the more resources a parent would have (such as sending a student
to private tutors and SAT preparation courses), therefore, the more likely parent involvement
will impact the child's expectations.
McNeal (2014) expanded upon the work of Wang and Benner (2014) by taking a deeper
look into the impact of a student’ environment on a student’s academic success and a student’s
own expectations of academic achievement by incorporating a multilevel model that among
other things, considered school-level variables such as a school’s poverty concentration. While
the findings from this study were significant, and important to the overall portfolio of research on
the impact of parent involvement, McNeal used parent activities with students and within the
student’s school but omitted the use of parent expectations – found by Fan and Chen (1999) to be
the most influential form of parent involvement – from his work. Therefore, for the current
study, I choose to build upon the efforts of Wang and Benner’s (2014) study by continuing the
THE IMPACT OF THE DISCREPANCIES BETWEEN STUDENT AND PARENT 62
examination of the impact of discrepancies between student and parent expectations in the
presence of individual student expectation on the academic achievement and future expectations
of academic achievement of students while incorporating a multilevel model similar to that used
by McNeal (2014).
This study proposes to expand upon the work of Wang and Benner (2014) by closely
replicating the nesting modeled by McNeal (2014) to investigate the phenomenon of parent
expectations through the lens of Bronfenbrenner’s (1979, 1986, 1992, 2005) theory of
bioecological systems. Using a multilevel model to examine the relationship between both
student expectations and parent and student discrepancies in expectations and academic
outcomes (test scores and a student’s future expectations of academic attainment) nested within
schools, this study will examine how the school-level variable of school poverty moderates the
aforementioned relationships. Additionally, the interactions of student expectations and
discrepancies in parent and student expectations will be investigated.
Summary of the Literature Review
Parent involvement has been at the forefront of school revitalizations for the last few
decades. As budgets continue to shrink, cost-effective ways to increase student achievement will
continue to grow, particularly in urban, low-income schools. Fan and Chen (2001) examined the
bearing that five differing parent involvement indicators had on the academic outcomes of
students. Through the work of Fan and Chen and the other literature reviewed in this paper, one
clearly sees that parent expectations are a large part of the parent involvement equation. As one
dimension of the complex area of parent involvement, parent expectations have been shown to
strongly predict student’s academic outcomes (Davis-Kean, 2005; Fan & Chen, 2001; Froiland,
Peterson, & Davidson, 2012; Hill & Tyson, 2009; Jeynes, 2003, 2005, 2007; Seyfried & Chung,
2002; Wang & Benner, 2014; Zhang, Haddad, Torres, & Chen, 2011). However, these

THE IMPACT OF THE DISCREPANCIES BETWEEN STUDENT AND PARENT 63
expectations are impacted by each parent’s interaction with many social systems, both present
and past (Bronfenbrenner, 1979, 1986, 1992, 2005). Grounded in Bronfenbrenner’s ecological
systems theory, it is not difficult to understand why parent expectations are stimulated by the
many social interactions affecting each student, such as teacher expectations (Benner & Mistry,
2007), parent education levels (Eccles, Jacobs, & Harold, 1990; Englund, Luckner, Whaley, &
Egeland, 2004; Davis-Kean, 2005; Eccles & Davis-Kean, 2005), race (Carpenter, 2008; Davis-
Kean, 2005; Seyfried & Chung, 2002), SES (Davis-Kean, 2005; Seyfried & Chung, 2002), and
student achievement (Zhang, Haddad, Torres, & Chen, 2011). It is recommended that future
research examine both the individual and combined influence of parent, teacher, and students’
expectations on academic achievement, how those variables are mediated by income levels and
parents’ education achievement, and how levels of expectation are moderated by race and
ethnicity.
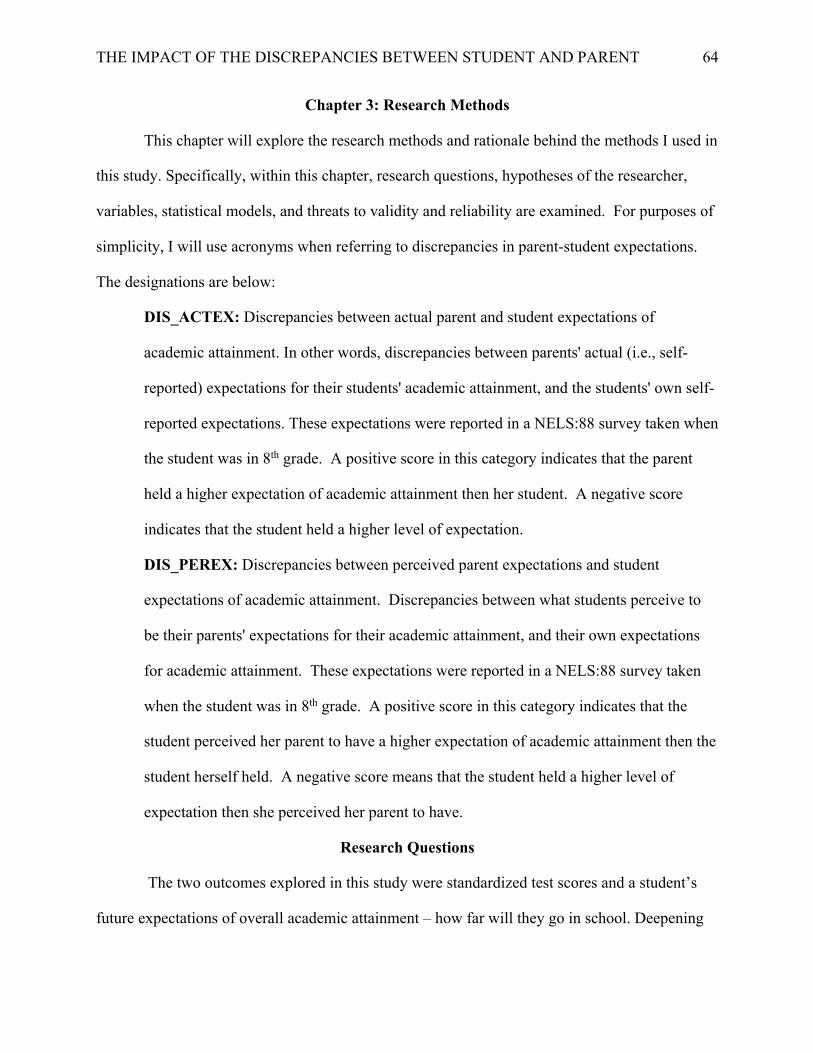
THE IMPACT OF THE DISCREPANCIES BETWEEN STUDENT AND PARENT 64
Chapter 3: Research Methods
This chapter will explore the research methods and rationale behind the methods I used in
this study. Specifically, within this chapter, research questions, hypotheses of the researcher,
variables, statistical models, and threats to validity and reliability are examined. For purposes of
simplicity, I will use acronyms when referring to discrepancies in parent-student expectations.
The designations are below:
DIS_ACTEX: Discrepancies between actual parent and student expectations of
academic attainment. In other words, discrepancies between parents' actual (i.e., self-
reported) expectations for their students' academic attainment, and the students' own self-
reported expectations. These expectations were reported in a NELS:88 survey taken when
the student was in 8th grade. A positive score in this category indicates that the parent
held a higher expectation of academic attainment then her student. A negative score
indicates that the student held a higher level of expectation.
DIS_PEREX: Discrepancies between perceived parent expectations and student
expectations of academic attainment. Discrepancies between what students perceive to
be their parents' expectations for their academic attainment, and their own expectations
for academic attainment. These expectations were reported in a NELS:88 survey taken
when the student was in 8th grade. A positive score in this category indicates that the
student perceived her parent to have a higher expectation of academic attainment then the
student herself held. A negative score means that the student held a higher level of
expectation then she perceived her parent to have.
Research Questions
The two outcomes explored in this study were standardized test scores and a student’s
future expectations of overall academic attainment – how far will they go in school. Deepening

THE IMPACT OF THE DISCREPANCIES BETWEEN STUDENT AND PARENT 65
the research of Wang and Benner (2014), this researcher sought to examine the discrepancies in
expectations through the lens of Bronfenbrenner’s ecological systems theory (1979, 1986, 1992,
2005) by using a multi-level model to consider how a student’s school environment impacted the
relationship between discrepancies in the academic expectations of parents and adolescents and
academic outcomes such as standardized test scores and a student’s future expectations of overall
academic attainment. Statistical modeling similar to McNeal’s (2014) research, which employed
a multi-level model to investigate how parent-child interactions and parent PTO impact academic
outcomes, will be evaluated by adding the predictor variables of discrepancies in parent-student
expectations, as defined by Wang and Benner in their 2014 study, and the outcome variable of a
students’ expectation of academic attainment. This study will utilize McNeal's model with a
selection of variables close to that employed by Wang and Benner (2014). However, unlike
either McNeal or Wang and Benner, the interaction of student expectation and discrepancies in
parent and student expectations will be evaluated in the full statistical model.
Using ordinary least squares regression, Wang and Benner (2014) found that
discrepancies between parent – perceived and actual – and student expectations of academic
achievement had an impact on standardized test scores. However, the study failed to account for
possible variance between schools, and the possibility of how differences in schools could affect
the impact of their results. This research expands upon the work of Wang and Benner (2014)
and McNeal (2014) by using a multilevel model to investigate the impact of discrepancies in
parent and student expectations on standardized test scores and a student’s long-term
expectations of academic achievement while incorporating school-level variables such as school
poverty levels.
The constructed variables of parent participation in PTO and parent-child discussion
employed by McNeal (2014) were considered for the present research. However, the current

THE IMPACT OF THE DISCREPANCIES BETWEEN STUDENT AND PARENT 66
study wanted to incorporate school level variables to determine what impact, if any, levels within
Bronfenbrenner’s (1979, 1986, 1992, 2005) ecological systems theory the mesosystem
(connection between home and school) and exosystem (external influences on schools) had on
the relationship between differences in expectations and academic outcomes. The research
questions for the current study were:
Q1. Do student expectations predict academic outcomes such as results on standardized
tests and expectations of future academic attainment?
Q2. Is there a relationship between DIS_ACTEX and student performance on
standardized tests?
Q3. Is there a relationship between DIS_PEREX and student performance on
standardized tests?
Q4. Is the relationship between DIS_ACTEX and student’s score on standardized tests
moderated by a school’s poverty level?
Q5. Is the relationship between DIS_PEREX and student’s score on standardized tests
moderated by a school’s poverty level?
Q6. Is the relationship between DIS_ACTEX and student’s long-term expectations of
academic attainment moderated by a school’s poverty level?
Q7. Is the relationship between DIS_PEREX and student’s long-term expectations of
academic attainment moderated by a school’s poverty level?
Q8. Does the impact of discrepancies in expectations (actual and perceived) vary by
school?
Hypotheses
As mentioned previously, Wang and Benner (2014) found that as a parent’s actual
expectations exceed her student’s expectations, the student’s academic achievement would rise.
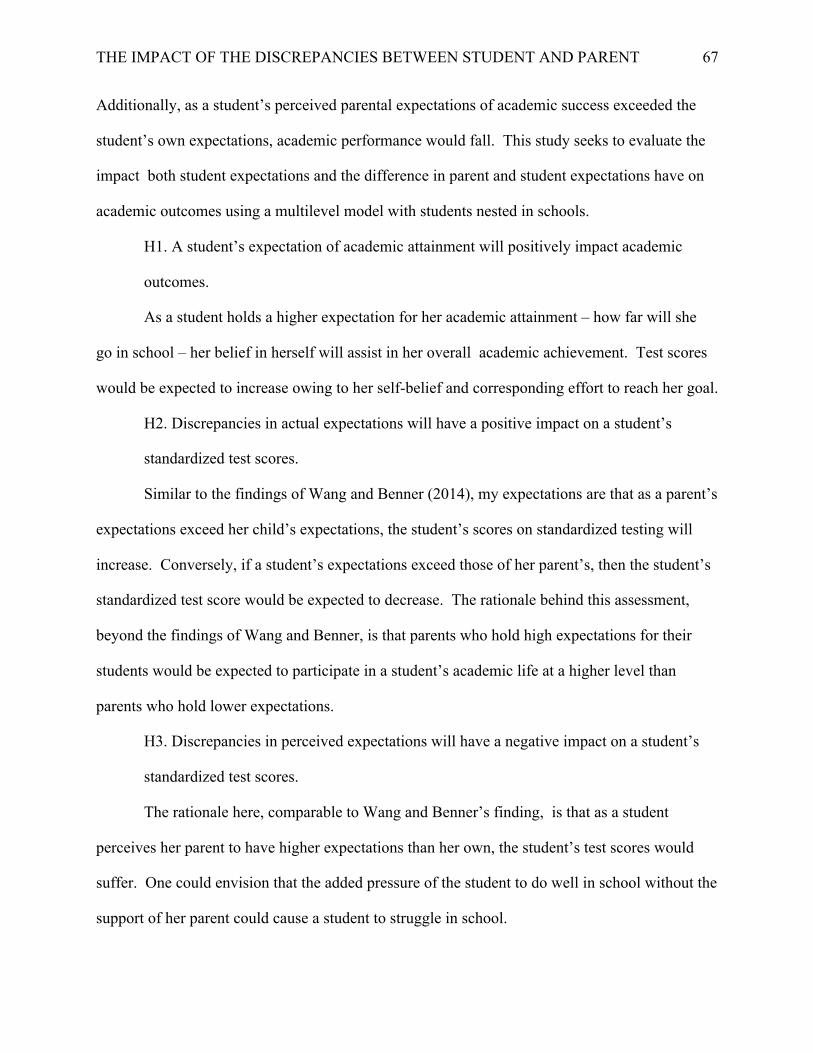
THE IMPACT OF THE DISCREPANCIES BETWEEN STUDENT AND PARENT 67
Additionally, as a student’s perceived parental expectations of academic success exceeded the
student’s own expectations, academic performance would fall. This study seeks to evaluate the
impact both student expectations and the difference in parent and student expectations have on
academic outcomes using a multilevel model with students nested in schools.
H1. A student’s expectation of academic attainment will positively impact academic
outcomes.
As a student holds a higher expectation for her academic attainment – how far will she
go in school – her belief in herself will assist in her overall academic achievement. Test scores
would be expected to increase owing to her self-belief and corresponding effort to reach her goal.
H2. Discrepancies in actual expectations will have a positive impact on a student’s
standardized test scores.
Similar to the findings of Wang and Benner (2014), my expectations are that as a parent’s
expectations exceed her child’s expectations, the student’s scores on standardized testing will
increase. Conversely, if a student’s expectations exceed those of her parent’s, then the student’s
standardized test score would be expected to decrease. The rationale behind this assessment,
beyond the findings of Wang and Benner, is that parents who hold high expectations for their
students would be expected to participate in a student’s academic life at a higher level than
parents who hold lower expectations.
H3. Discrepancies in perceived expectations will have a negative impact on a student’s
standardized test scores.
The rationale here, comparable to Wang and Benner’s finding, is that as a student
perceives her parent to have higher expectations than her own, the student’s test scores would
suffer. One could envision that the added pressure of the student to do well in school without the
support of her parent could cause a student to struggle in school.

THE IMPACT OF THE DISCREPANCIES BETWEEN STUDENT AND PARENT 68
H4. School poverty will moderate the relationship between DIS_ACTEX and
standardized test scores in all subjects.
Hypothesis four implies that if a school has a high concentration of students on reduced
and free lunches (greater than 50%) the relationship between DIS_ACTEX and test scores will
be greater than that for students attending schools that do not have a high concentration of
students on free and reduced lunches. For example, if a student has much higher expectations
than her parents’ actual expectations an impoverished school will not have the academic support
resources necessary to support the student’s ambitions in the same way a school that is not
impoverished would be able to offer academic support to the same student. It is hypothesized
that in this scenario the student’s test scores would suffer more than a student who attends a
school that is not considered high-poverty.
H5. School poverty will moderate the relationship between DIS_PEREX and
standardized test scores in all subjects.
Like the previous hypothesis, if a student possesses a perception that her mom has higher
expectations than her own expectations, the student could suffer from both a lack of emotional
and academic support from her mother. If the student attends a high-poverty school, the
discrepancy might exacerbate the lack of support compared to a student attending a school that
was not considered high-poverty. A school with limited resources may not be able support the
student's progress to the same extent as a more affluent school, thus the relationship between
DIS_PEREX and standardized test scores will be stronger in poorer schools.
H6. School poverty will moderate the relationship between DIS_ACTEX and a student’s
future expectations of academic achievement.
H7. School poverty will moderate the relationship between DIS_PEREX and a student’s
future expectations of academic achievement.
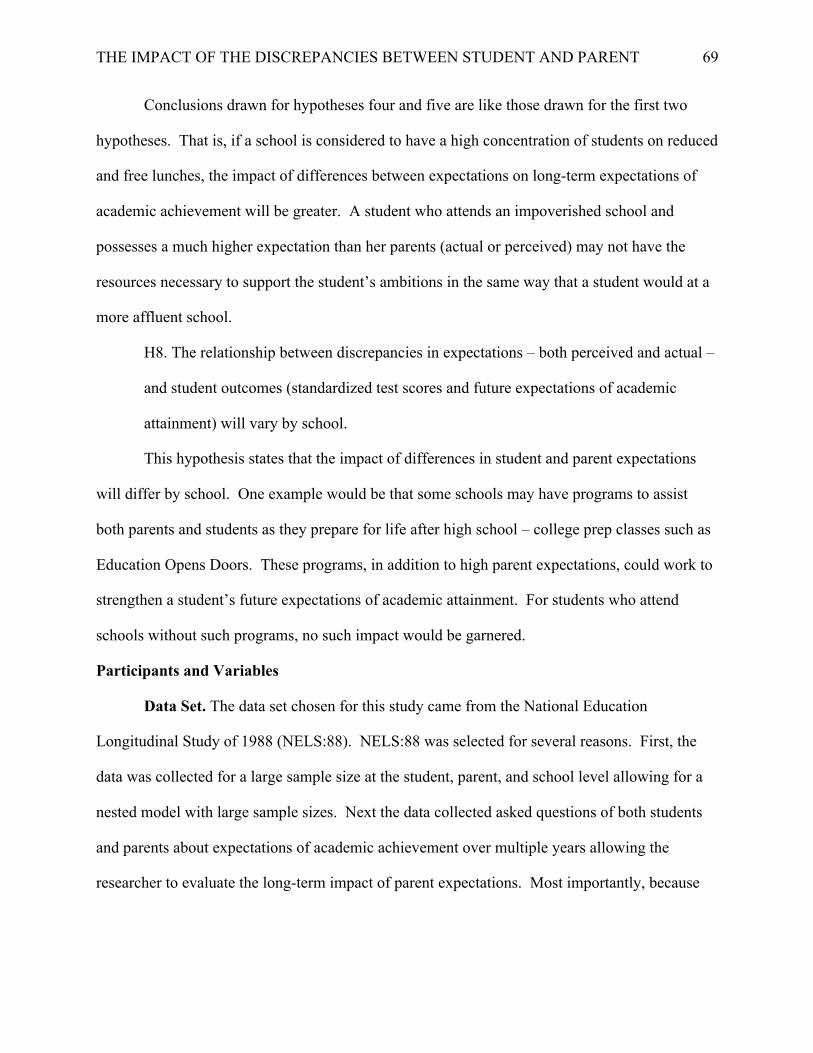
THE IMPACT OF THE DISCREPANCIES BETWEEN STUDENT AND PARENT 69
Conclusions drawn for hypotheses four and five are like those drawn for the first two
hypotheses. That is, if a school is considered to have a high concentration of students on reduced
and free lunches, the impact of differences between expectations on long-term expectations of
academic achievement will be greater. A student who attends an impoverished school and
possesses a much higher expectation than her parents (actual or perceived) may not have the
resources necessary to support the student’s ambitions in the same way that a student would at a
more affluent school.
H8. The relationship between discrepancies in expectations – both perceived and actual –
and student outcomes (standardized test scores and future expectations of academic
attainment) will vary by school.
This hypothesis states that the impact of differences in student and parent expectations
will differ by school. One example would be that some schools may have programs to assist
both parents and students as they prepare for life after high school – college prep classes such as
Education Opens Doors. These programs, in addition to high parent expectations, could work to
strengthen a student’s future expectations of academic attainment. For students who attend
schools without such programs, no such impact would be garnered.
Participants and Variables
Data Set. The data set chosen for this study came from the National Education
Longitudinal Study of 1988 (NELS:88). NELS:88 was selected for several reasons. First, the
data was collected for a large sample size at the student, parent, and school level allowing for a
nested model with large sample sizes. Next the data collected asked questions of both students
and parents about expectations of academic achievement over multiple years allowing the
researcher to evaluate the long-term impact of parent expectations. Most importantly, because

THE IMPACT OF THE DISCREPANCIES BETWEEN STUDENT AND PARENT 70
my study is expanding upon the work of Wang and Benner (2014) using a nested model like
McNeal (2014), it was important to me to use the data set from the same study in my research.
Population. The participants for the present study included students who were in Grade 8
and participated in the first four years of the NELS:88, through Grade 12. A total of four
different subsets of the NELS:88 data sets were used within this study. Each outcome variable
had two separate data sets, one to evaluate the impact of DIS_ACTEX and another to evaluate
the impact of DIS_PEREX. To be included in a specific data set a student must have (1) had a
score for the specific outcome variable designated in the data set, (2) an answer to item BYS45
on the base-year student survey, and (3) either have a parent complete a base-year parent survey
answering item BYP76 (participation in the DIS_ACTEX evaluation) or the student had
answered item BYS48A or BYS48B (participation in the DIS_PEREX evaluation) on the base-
year student survey. For each specific measurement the participant breakdown was as follows:
Test Scores. There were 10,643 participants nested in 944 schools when examining the
impact of perceived discrepancies on results of a Grade 12 standardized science test. The
sample size was 11,710 students nested in 945 schools when examining the impact of
actual discrepancies.
Future Expectations of Academic Achievement. There were 11,859 participants
nested in 955 schools when examining the impact of perceived discrepancies on a
student’s future expectations of academic achievement. The sample size was 12,954
students nested in 959 schools when examining the impact of actual discrepancies.
Predictor Variables
The first set of predictor variables examined in this study were discrepancies in parent-
and student expectations of academic attainment calculated using responses gathered from
students’ and parents’ self-reported answers on the NELS:88 Base Year Student Survey and

THE IMPACT OF THE DISCREPANCIES BETWEEN STUDENT AND PARENT 71
mirror the variables used by Wang and Benner (2014). The variables used were student
expectations, student’s perception of parent expectations, actual (i.e., self-reported) parent
expectations, discrepancy between actual parent expectations and student expectations,
discrepancy between perception of parent expectations and student expectations, the interaction
of student expectations and discrepancy between actual parent expectations and student
expectations, and the interaction of student expectations and discrepancy between perception of
parent expectations and student expectations. The section below details how each these variables
are defined and how differences were calculated within this study.
Student expectations of academic attainment. Students’ expectations, a level-one
variable, was operationally defined using an item from the NELS:88 Base-Year Student Surveys.
The student question was, “as things stand now, how far in school do you think you will get?”
An ordinal scale, ranging from 0 – “less than high school” to 4 – “beyond bachelors”, was used
to evaluate responses of the students. The original scale of the NELS:88 was 1 to 6 but modified
to a scale of 0 to 4 to mirror the methods used by Wang and Benner (2014). Like Wang and
Benner, attendance in a vocational or 2-year school and some college were combined into one
level – attend some school after high school - in order to achieve the same scale of 0 to 4.
Student’s perceived parent expectations of student’s academic attainment. Like
student expectations, the level-one variable of student’s perception of parent expectations was
operationally defined using an item from the NELS:88 Base-Year Student Surveys - items
BYS48A and BYS49B. The student question was, “how far in school do you think your parents
think you will get?” An ordinal scale, ranging from 0 – “less than high school” to 4 – “beyond
bachelors”, was used to evaluate responses of the students. The original scale of the NELS:88
was 1 to 6 but was modified to a scale of 0 to 4 to mirror the methods used by Wang and Benner

THE IMPACT OF THE DISCREPANCIES BETWEEN STUDENT AND PARENT 72
(2014). Like Wang and Benner, attendance in a vocational or 2-year school and some college
were combined into one level in order to achieve the scale of 0 to 4.
Parent’s actual expectations of her student’s academic attainment. Mimicking the
question posed to the students - item BYP76 on the NELS:88- the parent survey item asked
participants, “how far in school do you want your student to go?” The same ordinal scale used by
the students was employed on the parent survey. A scale ranging from 0 – “less than high
school” to 4 – “beyond bachelors”, was used to evaluate parent responses. The original scale of
the NELS:88 was 1 to 10 but was modified to a scale of 0 to 4 by collapsing answers into similar
categories, to mirror the methods used by Wang and Benner (2014).
Discrepancy of parent and student expectations of a student’s academic attainment -
actual. The level-one variable of discrepancy between student’s expectation of academic
attainment and her parent’s actual expectations of the student’s academic attainment –
DIS_ACTEX – was operationally defined as a calculated result of subtracting a student’s
expectations (BYS45) from the parent’s actual expectations (BYP76). Since the scales were
identical for parent and student, a positive number would indicate that the parent had reported a
higher expectation than the student. If the number was negative, the student's expectation of
academic attainment would be higher than that of the parent. Scores of zero meant that student's
view and her parent had reported identical expectations for the student’s academic attainment.
Discrepancy of parent and student expectations of a student’s academic attainment -
perceived. Another level-one variable, the discrepancy between student’s expectation of
academic attainment and her perception of her parent’s expectations of her academic attainment -
DIS_PEREX - was operationally defined as a calculated result of subtracting her perceived view
of her parent’s expectations (BYS48A and BYS48B) from the student’s own expectations
(BYS45). Since the scales were identical for perceived expectations and student expectations, a

THE IMPACT OF THE DISCREPANCIES BETWEEN STUDENT AND PARENT 73
positive number would indicate that the assumed parent expectation was higher than the
student’s expectation of academic attainment. If the number was negative, the student’s
expectation of academic attainment was higher than her perceived parental expectations. Scores
of zero meant that student and her perceived view of her parent’s expectations were identical.
The interaction of student expectations of academic attainment and discrepancy of
parent and student expectations of a student’s academic attainment - actual. A level-one
variable, the interaction between student expectations and discrepancy in actual expectations,
was created using the previously defined variables of student expectations of academic
achievement and discrepancies of parent and student expectations of a student’s academic
achievement - actual.
The interaction of student expectations of academic attainment and discrepancy of
parent and student expectations of a student’s academic attainment - perceived. A level-
one variable, the interaction between student expectations and discrepancy in perceived
expectations, was created using the previously defined variables of student expectations of
academic achievement and discrepancies of parent and student expectations of a student’s
academic achievement - perceived.
Moderating Variable
To better understand how multiple levels of societal layers impact a student’s academic
outcomes, this study focused on a multilevel model of students nested within schools. While
mirroring the use of school poverty levels by McNeal (2014), the current study examined the
moderating effect of poverty on the relationship between both DIS_ACTEX and DIS_PEREX
and academic outcomes – standardized test scores and a student’s future expectations of
academic achievement. School poverty levels are defined below.

THE IMPACT OF THE DISCREPANCIES BETWEEN STUDENT AND PARENT 74
School poverty level. School poverty was defined as a dichotomous variable calculated
by taking the school level variable G8LUNCH from NELS:88 Base-Year School Survey. If a
school had more than 50% its students receiving reduced or free lunches, then it was determined
to be a poverty concentrated school (McNeal; 2014) and was noted by a 1. All other schools
were deemed to be not poverty concentrated schools and were coded with a 0.
Outcome Variables
The outcome variables that were used in this study were like those studied by Wang and
Benner (2014) and McNeal (2014). The operational definition of achievement tests differs from
Wang and Benner (2014), but mirrored McNeal (2014) as the present study did not solely
evaluate student outcomes based on an average of math and reading achievement test scores.
Instead this study used a combination of all four individual test scores – science, math, history,
and reading – to evaluate over all academic success. The achievement score definition is
described in the section below.
Test Scores. Testing used in the NELS:88 study was developed by Education Testing
Service (ETS). During Grade 12 tests were administered to each student. The present study
evaluated students' outcomes of the number of correct responses on the ETS math, reading,
science, and history tests and additively combined all four into one variable, test scores. To be
included in the study, a student must have completed and have a score reported for a test in each
of the four subjects. Due to each standardized test having a different number of total items for
students to answer, actual ranges for each individual test varied – history (20.72 to 45.38 correct
responses), math (16.77 to 78.10 correct responses), reading (10.41 to 50.89 correct responses),
and science (10.03 to 35.96 correct responses). The implications of adding scores on differently-
scaled tests to create a single composite score are addressed in the Discussion section.

THE IMPACT OF THE DISCREPANCIES BETWEEN STUDENT AND PARENT 75
Student’s future expectations of academic achievement. A student’s self-reported
answer on the NELS:88 Fourth-Year Follow-Up Student Survey to the question “what are your
educational aspirations by the age of 30” was used to determine long-term expectations of
academic achievement. Student responses ranged from (1) “earn a GED or high school
certificate” to (10) “MD, LLB, JD, DDS or equivalent”.
Statistical Models
The current study investigated how student expectations and discrepancies between
parent and student expectations impacted standardized test scores and a student’s future
expectations of academic attainment, and how these relationships were moderated by a school’s
level of poverty concentration. These relationships were evaluated using four multilevel models
to examine both outcome variables – test scores and a student’s future expectations of academic
attainment – predicted by both actual and perceived discrepancies in expectations of academic
attainment. The full models, the formulas for each of the statistical analyses, and description of
notations are detailed in the information below.
Full hierarchical linear model:
Level 1
𝑦"# = 𝛽&# + 𝛽(#𝑥("# + 𝛽*#𝑥*"# + 𝛽(#(𝑥(𝑥*)"# + 𝜖"#
Level 2
𝛽&# = 𝛾&& + 𝛾&(𝑤(# + 𝑢&#
𝛽(# = 𝛾(& + 𝛾((𝑤(# + 𝑢(#
𝛽*# = 𝛾*& + 𝛾*(𝑤(#
𝛽1# = 𝛾1& + 𝛾1(𝑤(#
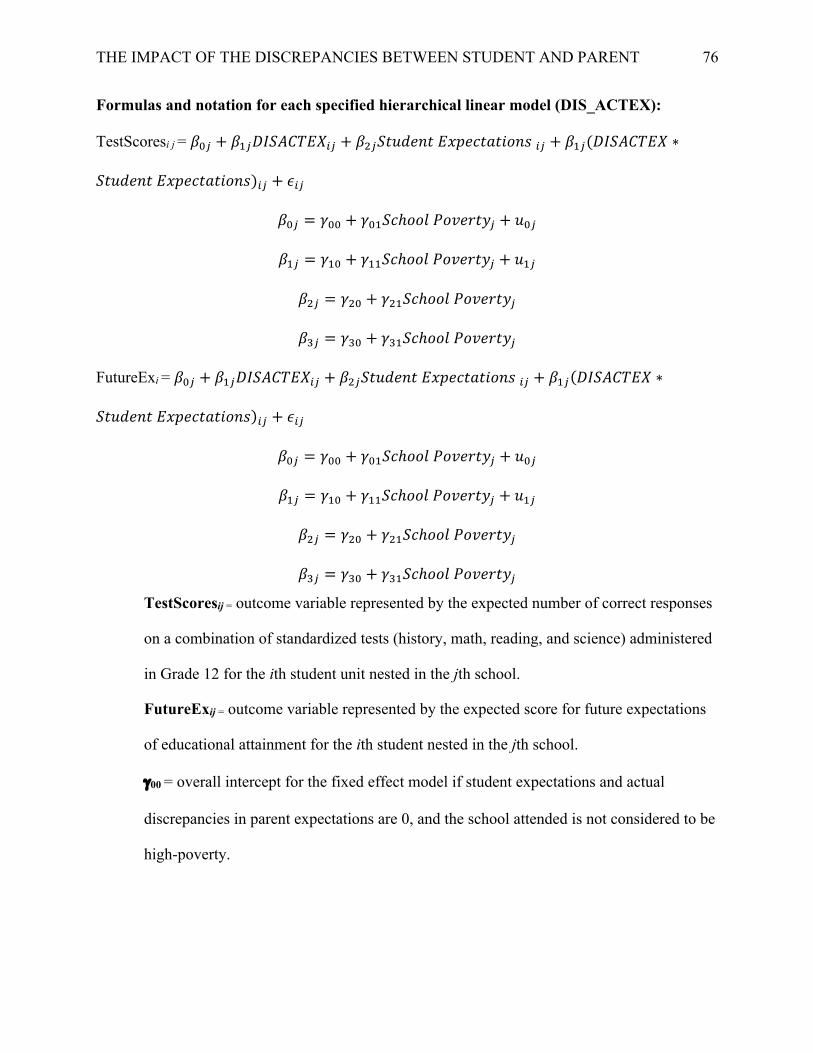
THE IMPACT OF THE DISCREPANCIES BETWEEN STUDENT AND PARENT 76
Formulas and notation for each specified hierarchical linear model (DIS_ACTEX):
TestScoresi j = 𝛽&# + 𝛽(#𝐷𝐼𝑆𝐴𝐶𝑇𝐸𝑋"# + 𝛽*#𝑆𝑡𝑢𝑑𝑒𝑛𝑡𝐸𝑥𝑝𝑒𝑐𝑡𝑎𝑡𝑖𝑜𝑛𝑠"# + 𝛽(#(𝐷𝐼𝑆𝐴𝐶𝑇𝐸𝑋 ∗
𝑆𝑡𝑢𝑑𝑒𝑛𝑡𝐸𝑥𝑝𝑒𝑐𝑡𝑎𝑡𝑖𝑜𝑛𝑠)"# + 𝜖"#
𝛽&# = 𝛾&& + 𝛾&(𝑆𝑐ℎ𝑜𝑜𝑙𝑃𝑜𝑣𝑒𝑟𝑡𝑦# + 𝑢&#
𝛽(# = 𝛾(& + 𝛾((𝑆𝑐ℎ𝑜𝑜𝑙𝑃𝑜𝑣𝑒𝑟𝑡𝑦# + 𝑢(#
𝛽*# = 𝛾*& + 𝛾*(𝑆𝑐ℎ𝑜𝑜𝑙𝑃𝑜𝑣𝑒𝑟𝑡𝑦#
𝛽1# = 𝛾1& + 𝛾1(𝑆𝑐ℎ𝑜𝑜𝑙𝑃𝑜𝑣𝑒𝑟𝑡𝑦#
FutureExi = 𝛽&# + 𝛽(#𝐷𝐼𝑆𝐴𝐶𝑇𝐸𝑋"# + 𝛽*#𝑆𝑡𝑢𝑑𝑒𝑛𝑡𝐸𝑥𝑝𝑒𝑐𝑡𝑎𝑡𝑖𝑜𝑛𝑠"# + 𝛽(#(𝐷𝐼𝑆𝐴𝐶𝑇𝐸𝑋 ∗
𝑆𝑡𝑢𝑑𝑒𝑛𝑡𝐸𝑥𝑝𝑒𝑐𝑡𝑎𝑡𝑖𝑜𝑛𝑠)"# + 𝜖"#
𝛽&# = 𝛾&& + 𝛾&(𝑆𝑐ℎ𝑜𝑜𝑙𝑃𝑜𝑣𝑒𝑟𝑡𝑦# + 𝑢&#
𝛽(# = 𝛾(& + 𝛾((𝑆𝑐ℎ𝑜𝑜𝑙𝑃𝑜𝑣𝑒𝑟𝑡𝑦# + 𝑢(#
𝛽*# = 𝛾*& + 𝛾*(𝑆𝑐ℎ𝑜𝑜𝑙𝑃𝑜𝑣𝑒𝑟𝑡𝑦#
𝛽1# = 𝛾1& + 𝛾1(𝑆𝑐ℎ𝑜𝑜𝑙𝑃𝑜𝑣𝑒𝑟𝑡𝑦#
TestScoresij = outcome variable represented by the expected number of correct responses
on a combination of standardized tests (history, math, reading, and science) administered
in Grade 12 for the ith student unit nested in the jth school.
FutureExij = outcome variable represented by the expected score for future expectations
of educational attainment for the ith student nested in the jth school.
g00 = overall intercept for the fixed effect model if student expectations and actual
discrepancies in parent expectations are 0, and the school attended is not considered to be
high-poverty.

THE IMPACT OF THE DISCREPANCIES BETWEEN STUDENT AND PARENT 77
g01 = overall mean level-2 intercept or the expected change in the dependent variable (test
scores and future expectations) for students attending the jth school if the student attends
a high-poverty school.
g10 = overall level-2 slope or the expected change in the dependent variable (test scores
and future expectations) for every 1 unit of change in actual discrepancies (centered on
the mean) for the ith student attending the jth school.
g11 = overall mean level-2 slope or the expected change in the dependent variable (test
scores and future expectations) for every 1 unit of change from the interaction between
school poverty and actual discrepancies (centered on the mean) for the ith student
attending the jth school.
g20 = overall level-2 slope or the expected change in the dependent variable (test scores
and future expectations) for every 1 unit of change in student expectations (centered on
the mean) for the ith student attending the jth school.
g21 = overall mean level-2 slope or the expected change in the dependent variable (test
scores and future expectations) for every 1 unit of change from the interaction between
school poverty and student expectations (centered on the mean) for the ith student
attending the jth school.
g30 = overall level-2 slope or the expected change in the dependent variable (test scores
and future expectations) for every 1 unit of change of the interaction between student
expectations (centered on the mean) and actual discrepancies (centered on the mean) for
the ith student attending the jth school.
g31 = overall mean level-2 slope or the expected change in the dependent variable (test
scores and future expectations) for every 1 unit of change from the interaction between
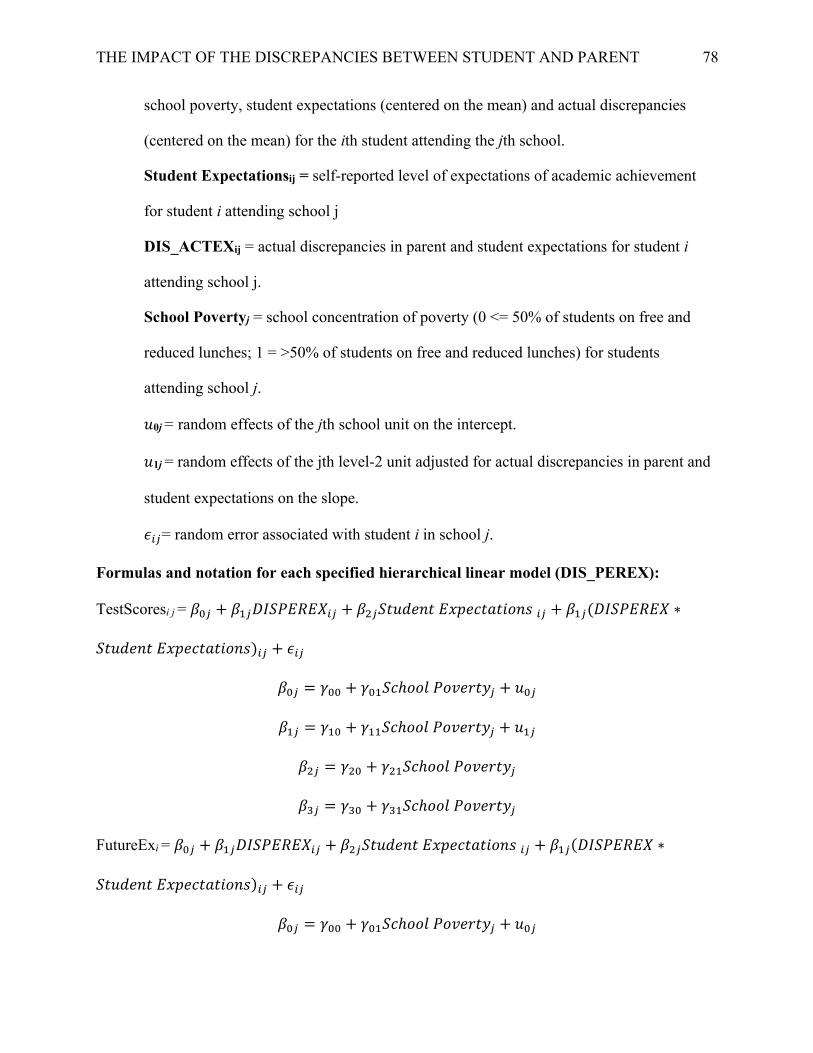
THE IMPACT OF THE DISCREPANCIES BETWEEN STUDENT AND PARENT 78
school poverty, student expectations (centered on the mean) and actual discrepancies
(centered on the mean) for the ith student attending the jth school.
Student Expectationsij = self-reported level of expectations of academic achievement
for student i attending school j
DIS_ACTEXij = actual discrepancies in parent and student expectations for student i
attending school j.
School Povertyj = school concentration of poverty (0 <= 50% of students on free and
reduced lunches; 1 = >50% of students on free and reduced lunches) for students
attending school j.
𝑢0j = random effects of the jth school unit on the intercept.
𝑢1j = random effects of the jth level-2 unit adjusted for actual discrepancies in parent and
student expectations on the slope.
𝜖"#= random error associated with student i in school j.
Formulas and notation for each specified hierarchical linear model (DIS_PEREX):
TestScoresi j = 𝛽&# + 𝛽(#𝐷𝐼𝑆𝑃𝐸𝑅𝐸𝑋"# + 𝛽*#𝑆𝑡𝑢𝑑𝑒𝑛𝑡𝐸𝑥𝑝𝑒𝑐𝑡𝑎𝑡𝑖𝑜𝑛𝑠"# + 𝛽(#(𝐷𝐼𝑆𝑃𝐸𝑅𝐸𝑋 ∗
𝑆𝑡𝑢𝑑𝑒𝑛𝑡𝐸𝑥𝑝𝑒𝑐𝑡𝑎𝑡𝑖𝑜𝑛𝑠)"# + 𝜖"#
𝛽&# = 𝛾&& + 𝛾&(𝑆𝑐ℎ𝑜𝑜𝑙𝑃𝑜𝑣𝑒𝑟𝑡𝑦# + 𝑢&#
𝛽(# = 𝛾(& + 𝛾((𝑆𝑐ℎ𝑜𝑜𝑙𝑃𝑜𝑣𝑒𝑟𝑡𝑦# + 𝑢(#
𝛽*# = 𝛾*& + 𝛾*(𝑆𝑐ℎ𝑜𝑜𝑙𝑃𝑜𝑣𝑒𝑟𝑡𝑦#
𝛽1# = 𝛾1& + 𝛾1(𝑆𝑐ℎ𝑜𝑜𝑙𝑃𝑜𝑣𝑒𝑟𝑡𝑦#
FutureExi = 𝛽&# + 𝛽(#𝐷𝐼𝑆𝑃𝐸𝑅𝐸𝑋"# + 𝛽*#𝑆𝑡𝑢𝑑𝑒𝑛𝑡𝐸𝑥𝑝𝑒𝑐𝑡𝑎𝑡𝑖𝑜𝑛𝑠"# + 𝛽(#(𝐷𝐼𝑆𝑃𝐸𝑅𝐸𝑋 ∗
𝑆𝑡𝑢𝑑𝑒𝑛𝑡𝐸𝑥𝑝𝑒𝑐𝑡𝑎𝑡𝑖𝑜𝑛𝑠)"# + 𝜖"#
𝛽&# = 𝛾&& + 𝛾&(𝑆𝑐ℎ𝑜𝑜𝑙𝑃𝑜𝑣𝑒𝑟𝑡𝑦# + 𝑢&#

THE IMPACT OF THE DISCREPANCIES BETWEEN STUDENT AND PARENT 79
𝛽(# = 𝛾(& + 𝛾((𝑆𝑐ℎ𝑜𝑜𝑙𝑃𝑜𝑣𝑒𝑟𝑡𝑦# + 𝑢(#
𝛽*# = 𝛾*& + 𝛾*(𝑆𝑐ℎ𝑜𝑜𝑙𝑃𝑜𝑣𝑒𝑟𝑡𝑦#
𝛽1# = 𝛾1& + 𝛾1(𝑆𝑐ℎ𝑜𝑜𝑙𝑃𝑜𝑣𝑒𝑟𝑡𝑦#
TestScoresij = outcome variable represented by the expected number of correct responses
on a combination of standardized tests (history, math, reading, and science) administered
in Grade 12 for the ith student unit nested in the jth school.
FutureExij = outcome variable represented by the expected score for future expectations
of educational attainment for the ith student nested in the jth school.
g00 = overall intercept for the fixed effect model if student expectations and discrepancies
in perceived parent expectations are 0, and the school attended is not considered to be
high-poverty.
g01 = overall mean level-2 intercept or the expected change in the dependent variable (test
scores and future expectations) for students attending the jth school if the student attends
a high-poverty school.
g10 = overall level-2 slope or the expected change in the dependent variable (test scores
and future expectations) for every 1 unit of change in perceived discrepancies (centered
on the mean) for the ith student attending the jth school.
g11 = overall mean level-2 slope or the expected change in the dependent variable (test
scores and future expectations) for every 1 unit of change from the interaction between
school poverty and perceived discrepancies (centered on the mean) for the ith student
attending the jth school.
g20 = overall level-2 slope or the expected change in the dependent variable (test scores
and future expectations) for every 1 unit of change in student expectations (centered on
the mean) for the ith student attending the jth school.

THE IMPACT OF THE DISCREPANCIES BETWEEN STUDENT AND PARENT 80
g21 = overall mean level-2 slope or the expected change in the dependent variable (test
scores and future expectations) for every 1 unit of change from the interaction between
school poverty and student expectations (centered on the mean) for the ith student
attending the jth school.
g30 = overall level-2 slope or the expected change in the dependent variable (test scores
and future expectations) for every 1 unit of change of the interaction between student
expectations (centered on the mean) and perceived discrepancies (centered on the mean)
for the ith student attending the jth school.
g31 = overall mean level-2 slope or the expected change in the dependent variable (test
scores and future expectations) for every 1 unit of change from the interaction between
school poverty, student expectations (centered on the mean) and perceived discrepancies
(centered on the mean) for the ith student attending the jth school.
Student Expectationsij = self-reported level of expectations of academic achievement
(centered on the mean) for student i attending school j
DIS_PEREXij = perceived discrepancies in parent and student expectations (centered on
the mean) for student i attending school j.
School Povertyj = school concentration of poverty (0 <= 50% of students on free and
reduced lunches; 1 = >50% of students on free and reduced lunches) for students
attending school j.
𝑢0j = random effects of the jth school unit on the intercept.
𝑢1j = random effects of the jth level-2 unit adjusted for perceived discrepancies in parent
and student expectations on the slope.
𝜖"#= random error associated with student i in school j.
Statistical Software
THE IMPACT OF THE DISCREPANCIES BETWEEN STUDENT AND PARENT 81
The statistical models outlined in the previous section will be evaluated using the open
source software R and R Studio. The program R and R Studio were selected due to my
familiarity with the software and the ability of R Studio to robustly handle multilevel models
such as those used in this study.
Validity and Reliability
The current study attempts to understand the relationship between student expectations,
parent expectations, school level poverty, and student academic outcomes – both immediate and
long-term – by furthering the work of both Wang and Benner (2014) and McNeal (2014) while
using the NELS:88 data. Both studies pointed out two common limitations of their work, and
thus limitations of the present study – the age of the data source (now 30 years old) and the
exclusive reliance of the data on high school aged students. The remainder of this section will
discuss how those limitations could impact the findings of this study and why I believe the
results of this study should not be discounted by either limitation.
A three-decade old data set may seem limiting the application of the findings, but as
McNeal (2014) suggests in his research, regardless of the age of the data, the impact of parent
involvement on student outcomes has not diminished. Wang & Benner (2014), McNeal (2014)
and others do not present evidence of time-related changes in the relationships among key
variables in their studies. Moreover, as was stated earlier in this paper, federal dollars for
schools continues to be tied to the successful implementation and participation of parents in
parent involvement programs. While parent involvement programs continue to evolve, and
certainly differ between schools, the multi-level nature of this model should provide valuable
data for school and parent leaders to assist and inform these leaders during the development
process.

THE IMPACT OF THE DISCREPANCIES BETWEEN STUDENT AND PARENT 82
While the data used in this study is limited to high school students, the findings should
not be considered limited in implications to only this age group. First, the finding of impactful
programs that can enhance a student’s academic success and expectations at such a late point in a
student’s academic life could have an invaluable impact on helping to prepare students for future
success – regardless of the path chosen. While impossible to quantify the impact of similar
programs on younger students, it could be surmised that these programs could have, at a very
minimum, some positive effect on a younger student’s academic performance. Parent
expectations communicated at an early age have been found to positively impact students'
academic success (Jeynes; 2003, 2005) and so the findings from the current research should
inform future programs about helping parents develop and communicate their own expectations
to their children.
Institutional Review Board Approval Process
Prior to any analyses, an application for Institutional Review Board (IRB) approval was
submitted. Because this study employed a public data set from the NELS:88 national study, a
request for exempt status was submitted on January 3rd, 2019 to the Southern Methodist University
(SMU) IRB Approval Committee (Appendix A). An evaluation of my exempt status was
accepted by the SMU IRB committee on January the 4th and the unique ID of H19-033-SUHT
(Appendix B) was assigned to my study. A request to complete the Principal Investigator’s
Assurance form and proof of completion of the Collaborative Institutional Training Initiative
(CITI) Human Subjects Training was requested by the SMU IRB committee. Both requests were
completed by me on January 4th and proof of such was returned to the SMU IRB Committee
(Appendix C and Appendix D). On January 8th my study was approved to commence by the SMU
IRB committee. A copy of the approval letter is included in this dissertation under Appendix E.

THE IMPACT OF THE DISCREPANCIES BETWEEN STUDENT AND PARENT 83
Summary of the Research Methods
Urie Bronfenbrenner (1979, 1986, 1992, 2005) theorized that connections within a child’s
life immensely impacted how that child would develop. This theory not only considered those
direct relationships with the child, but relationships and actions outside of the child’s immediate
circle of relationships. Parent involvement and student outcome at times, have been researched
as a single dyad in the ecological development of a child, not considering other environmental
factors that could impact the strength of the relationship between parent involvement and student
academic success. While the impact of parent involvement on a student’s success in school is a
widely researched topic, Fan and Chen (2001), while examining a multitude of parent
involvement studies in their meta-analysis, found that of all parent involvement activities and
practices, parent expectations had the greatest impact on a student’s academic success. Recent
studies by Wang and Benner (2014) and McNeal (2014) advance the work of Fan and Chen by
inspecting the impact of parent expectations while taking into consideration environmental
connections within a student’s ecological system.
This study proposed to expand upon the work of Wang and Benner (2014) by closely
replicating the nesting modeled by McNeal (2014) to investigate the phenomenon of parent
expectations through the lens of Bronfenbrenner’s (1979, 1986, 1992, 2005) theory of
bioecological systems. I choose a multilevel model to examine the relationship between student
expectations, discrepancies between parent and student expectations, and academic outcomes
(test scores and a student’s future expectations of academic attainment). Furthermore, this
research expanded the scope of the aforementioned relationship by investigating how these
relationships are moderated by the school-level variable ‘school poverty’. This chapter reviewed
the research methods used in this study and in detail, the rationale behind the methods I used.

THE IMPACT OF THE DISCREPANCIES BETWEEN STUDENT AND PARENT 84
Additionally, this chapter described the participants, data set, research questions, hypotheses,
variables, statistical models, limitations, and software used within this study.

THE IMPACT OF THE DISCREPANCIES BETWEEN STUDENT AND PARENT 85
Chapter 4: Analysis and Findings
Grounded in the ecological systems theory of Bronfenbrenner (1979, 1986, 1992, 2005)
and motivated by the findings of Fan and Chen (2001) that of all forms of parent involvement,
parent expectations are the greatest predictor of academic achievement, this study sought to
understand the how the relationship between a student’s own expectations and the discrepancy
between the student’s expectations and her parent’s expectations of academic achievement (both
actual and perceived) influenced academic outcomes. Employing a subset of the NELS:88 data
set, this study used a multilevel model of students nested in schools to examine how the
relationship predicted a student’s results on standardized tests and a student’s future expectations
of academic attainment. This chapter will detail how the NELS:88 data set was cleaned to create
four subsets of participants (one for each of the two outcome variables for both actual and
perceived expectations of the parents), how each multilevel model was specified and estimated
using R software.
Preparing the Data
Subsets of the NELS:88 data set were created for use in this study. Careful consideration
was taken to determine which students of the original 22,511 participants of the NELS:88 study
would be included in my study. There were two data sets prepared for each variable related to
discrepancies in expectations of academic attainment – DIS_ACTEX (actual discrepancies) and
DIS_PEREX (perceived discrepancies) – to allow for evaluation of each outcome variable
independently, meaning that a total of four data sets were created for use within this analysis.
To be included in a data set each participant had to have been a participant in the initial year of
the study (1988), answered questions on the base-year student survey related to her own
expectations and what she perceived her parents expectations to be, completed the year-four
student survey (1992), had at least one parent complete a base-year parent survey and answer

THE IMPACT OF THE DISCREPANCIES BETWEEN STUDENT AND PARENT 86
question related to the parent’s expectations of her student’s academic attainment, and the
student had to have completed the all four standardized tests being evaluated for each specific
data set or answered the year-four survey question related to expectations of future academic
attainment.. A detailed explanation of how each data set was created is listed below:
Procedures for preparing data to evaluate perceived discrepancies impacting academic
outcomes:
1. I cleaned NELS:88 data set to contain only those variables that were used in my analysis.
The variables included in my study were:
a. STU_ID – a unique identifier for each individual student
b. SCH_ID – a unique identifier for each individual school
c. BYS45 – a student’s expectation of academic achievement taken from the base-
year student survey. So that this study would closely resemble the methodologies
used by Wang and Benner (2014), the scale for this variable was condensed from
its previous scale of 1 through 6, to 0 through 4. The scales for the NELS:88 data
set, and the subset of data used within this study are detailed below.
Scale used in the original NELS:88 data set:
1 – Won’t finish high school
2 – Will finish high school
3 – Vocational, trade, or business school after high school
4 – Will attend college
5 – Will finish college
6 – Higher school after college
Scale employed within this study:

THE IMPACT OF THE DISCREPANCIES BETWEEN STUDENT AND PARENT 87
0 – Does not expect to complete high school (Response 1 from original
NELS:88 scale)
1 – Graduate high school or receive a GED (Response 2 from original
NELS:88 scale)
2 – Some post high school education (Response 3 and 4 from original
NELS:88 scale)
3 – Receive a bachelor’s degree (Response 5 from original NELS:88
scale)
4 – Complete education beyond a bachelor’s degree (Response 6 from
original NELS:88 scale)
d. BYS48A – a student’s father’s expectations of academic achievement as
perceived by the student, taken from the base-year student survey. So that this
study would closely resemble the methodologies used by Wang and Benner
(2014), the scale for this variable was condensed from 1 through 6 used in the
original NEL:88 data set, to 0 through 4. The two scales are defined below.
Scale used in the original NELS:88 data set:
1 – Won’t finish high school
2 – Will finish high school
3 – Vocational, trade, or business school after high school
4 – Will attend college
5 – Will finish college
6 – Higher school after college
Scale employed within this study:

THE IMPACT OF THE DISCREPANCIES BETWEEN STUDENT AND PARENT 88
0 – Does not expect to complete high school (Response 1 from original
NELS:88 scale)
1 – Graduate high school or receive a GED (Response 2 from original
NELS:88 scale)
2 – Some post high school education (Responses 3 and 4 from original
NELS:88 scale)
3 – Receive a bachelor’s degree (Response 5 from original NELS:88
scale)
4 – Complete education beyond a bachelor’s degree (Response 6 from
original NELS:88 scale)
e. BYS48B – a student’s mother’s expectations of academic achievement as
perceived by the student, taken from the base-year student survey. So that this
study would closely resemble the methodologies used by Wang and Benner
(2014), the scale for this variable was condensed from 1 through 6 used in the
original NEL:88 data set, to 0 through 4. The two scales are defined below.
Scale used in the original NELS:88 data set:
1 – Won’t finish high school
2 – Will finish high school
3 – Vocational, trade, or business school after high school
4 – Will attend college
5 – Will finish college
6 – Higher school after college
Scale employed within this study:

THE IMPACT OF THE DISCREPANCIES BETWEEN STUDENT AND PARENT 89
0 – Does not expect to complete high school (Response 1 from original
NELS:88 scale)
1 – Graduate high school or receive a GED (Response 2 from original
NELS:88 scale)
2 – Some post high school education (Responses 3 and 4 from original
NELS:88 scale)
3 – Receive a bachelor’s degree (Response 5 from original NELS:88
scale)
4 – Complete education beyond a bachelor’s degree (Response 6 from
original NELS:88 scale)
f. G8LUNCH – a school’s level of poverty measured by the percentage of student’s
on free and reduced lunch program for each individual school. This is a school
level variable conceptualized to represent community SES, or the macrosystem
(societal structure), of Bronfenbrenner’s (1979, 1986, 1992, 2005) ecological
systems theory.
g. SEX – a student’s gender based on a self-reported item on the base-year student
survey.
0 – Male
1 – Female
h. RACE – For purposes of this study, like McNeal (2014), the race variable was
condensed into a variable indicating whether a student was a minority or not (not
white). The original scale of 1 to 5 used for the NELS:88 data set, was combined
to a scale of 0 or 1 for this study. It was possible for the student to select more

THE IMPACT OF THE DISCREPANCIES BETWEEN STUDENT AND PARENT 90
than one answer on the original base-year survey, in which case they would be
classified as a minority (1) within this study. The two scales are defined below.
The scales used in the original NELS:88 data set:
1 - Asian / Pacific Islander
2 - Hispanic
3 - Black not Hispanic
4 - White not Hispanic
5 – Native American / Alaskan Native
Scale used within this study:
0 – Not Minority (Response 4 within the original NELS:88 data set)
1 – Minority (Reponses 1, 2, 3, and 5 or any combination of answers
from the original NELS:88 data set)
i. TestScore – a student’s combined score (all four test scores added together) of
four standardized (history, math, reading, and science) tests that were
administered in 12th grade. The scores associated with the TestScore variable are
the result of the addition of F22XHIRR, F22XMIRR, F22XRIRR, and F22XSIRR
variables.
j. F22XRIRR – a student’s standardized number of correct responses on a
standardized math test that was administered in 12th grade
k. F22XMIRR – a student’s standardized number of correct responses on a
standardized math test that was administered in 12th grade
l. F22XSIRR – a student’s standardized number of correct responses on a
standardized science test that was administered in 12th grade

THE IMPACT OF THE DISCREPANCIES BETWEEN STUDENT AND PARENT 91
m. F22XHIRR – a student’s standardized number of correct responses on a
standardized history test that was administered in 12th grade
n. F2S43 – a student’s future expectation of academic achievement based on a self-
reported item on the fourth-year follow-up student survey. So that this study
would closely resemble the methodologies used by Wang and Benner (2014), the
scale for this variable was condensed from the original scale of 1 through 10, to 0
through 4. The two scales are defined below.
Scale used in the original NELS:88 data set:
1 – Less than high school
2 – High school only
3 – Less than 2 years of school after high school
4 – More than 2 years of school after high school
5 – Trade school degree
6 – Less than 2 years of college
7 – More than 2 years of college
8 – Graduate college
9 – Master’s or equivalent
10 – PhD, M.D., or other
Scale employed within this study:
0 – Does not expect to complete high school (Response 1 from original
NELS:88 scale)
1 – Graduate high school or receive a GED (Response 2 from original
NELS:88 scale)

THE IMPACT OF THE DISCREPANCIES BETWEEN STUDENT AND PARENT 92
2 – Some post high school education (Responses 3, 4, 5, 6, and 7 from
original NELS:88 scale)
3 – Receive a bachelor’s degree (Response 8 from original NELS:88
scale)
4 – Complete education beyond a bachelor’s degree (Responses 9 and 10
from original NELS:88 scale)
2. I eliminated students who were not associated with a school (SCH_ID was missing).
Since my research evaluated students nested in schools, having a school identification
number was critical.
3. Since my study examined the impact perceived discrepancies in expectations between
students and parents had on academic outcomes, I eliminated students from the data set
who did not answer item BYS_45, a student’s own expectation of academic attainment,
on the base-year student survey.
4. Of equal importance to a student’s own expectations of academic achievement was how
she perceived the expectation of her academic achievement by parents. If a student did
not answer either of item BYS48A (a father’s expectation as perceived by the student) or
BYS48B (a mother’s expectation as perceived by the student), she was removed from the
data set used for my analysis.
5. I removed any student from the file that went to a school where the level of poverty could
not be determined (missing answer to G8LUNCH). This is critical because this study
will evaluate the moderating effects of poverty using G8LUNCH as the moderating
variable. For this variable 0 represents a school that has 50% or less of its students on
free or reduced lunches, while 1 represents a school that has 51% or more of its students
on free or reduced lunches.

THE IMPACT OF THE DISCREPANCIES BETWEEN STUDENT AND PARENT 93
6. PER_PAREX was created to represent perceived parent expectations. The variable was
calculated by averaging a student’s answers on BYS48A and BYS48B. If either
BYS48A or BYS48B were missing, PER_PAREX was derived by using only the variable
for which an answer was provided. If neither was answered, the student was removed
from the data set.
7. DIS_PEREX was created to represent the differences in a student’s expectations of
academic achievement and her parent’s expectations of her academic achievement as
perceived by the student. The variable BYS45 (student expectation) was subtracted from
PER_PAREX (perceived parent expectation) to determine DIS_PEREX (perceived
discrepancies in expectations). This meant that if the calculated number for DIS_PEREX
was positive, the perceived parent expectations were higher than the student’s own
expectations.
8. The next step was to create subsets of the perceived data set based on outcome variables.
These CSV files of these subsets were labeled in the analysis as testscores_per and
futureex_per. Students were only included in a data set if they had a score for all four
standardized tests or answered the fourth-year survey item f2S43. The breakdown for
each data set was as follows:
a. totalscore_per – students must have had a score for each of the variables
F22XHIRR, F22XMIRR, F22XRIRR, and F22SIRR. The number of students
included in this sample were 10,643 nested in 944 schools.
b. futureex_per – students must have had an answer for the variable F2S43. The
number of students included in this sample were 11,859 nested in 955 schools.
Procedures for preparing data to evaluate actual discrepancies impacting academic
outcomes:

THE IMPACT OF THE DISCREPANCIES BETWEEN STUDENT AND PARENT 94
The procedures used for preparing the actual discrepancy data sets were the exact procedures
used for perceived discrepancy data sets other than the treatment of the discrepancy variable.
Below are the steps of how actual discrepancies data sets were created that differed from the
creation of the perceived discrepancies data sets.
1. BYP76 (parent’s expectations)– a parent’s actual expectations of her student’s academic
achievement taken from the base-year parent survey. So that this study would closely
resemble the methodologies used by Wang and Benner (2014), the scale for this variable
was condensed from the 1 to 12 scale used in the original NELS:88 data set, to 0 through
4. The two scales are defined below.
Scale used in the original NELS:88 data set:
1 – Less than high school diploma
2 – GED
3 – High school graduation
4 – Vocational, trade, or business school < 1 year
5 – Vocational, trade, or business school 1 to 2 years
6 – Vocational, trade, or business school more than 2 years
7 – Less than 2 years of college
8 – More than 2 years of college
9 – Finish a 2-year program
10 – Finish a 4 / 5-year program
11 – Master’s degree
12 – PhD, M.D.
Scale employed within this study:

THE IMPACT OF THE DISCREPANCIES BETWEEN STUDENT AND PARENT 95
0 – Does not expect to complete high school (Response 1 from original
NELS:88 scale)
1 – Graduate high school or receive a GED (Responses 2 and 3 from
original NELS:88 scale)
2 – Some post high school education (Responses 4 through 9 from original
NELS:88 scale)
3 – Receive a bachelor’s degree (Response 10 from original NELS:88
scale)
4 – Complete education beyond a bachelor’s degree (Responses 11 and 12
from original NELS:88 scale)
2. The next step was to create subsets of the actual data set based on outcome variables.
These CSV file name for these subsets were totalscore_act and futureex_act. Students
were only included in a data set if they had a score on all four of the standardized tests
(history, math, reading, and science) or answered the fourth-year survey item f2S43. The
breakdown for each data set was as follows:
a. totalscore_per – students must have had a score for each of the variables
F22XHIRR, F22XMIRR, F22XRIRR, and F22SIRR. The number of students
included in this sample were 11,710 nested in 945 schools.
b. futureex_act - students must have had an answer for the variable F2S43. The
number of students included in this sample were 12,954 nested in 956 schools.
Estimation of the Models
A model was specified and estimated independently for each outcome variable; combined
results on history, math, reading, and science tests, as well as a student’s future expectations of
academic achievement. For each of these two outcome variables, two models were evaluated,
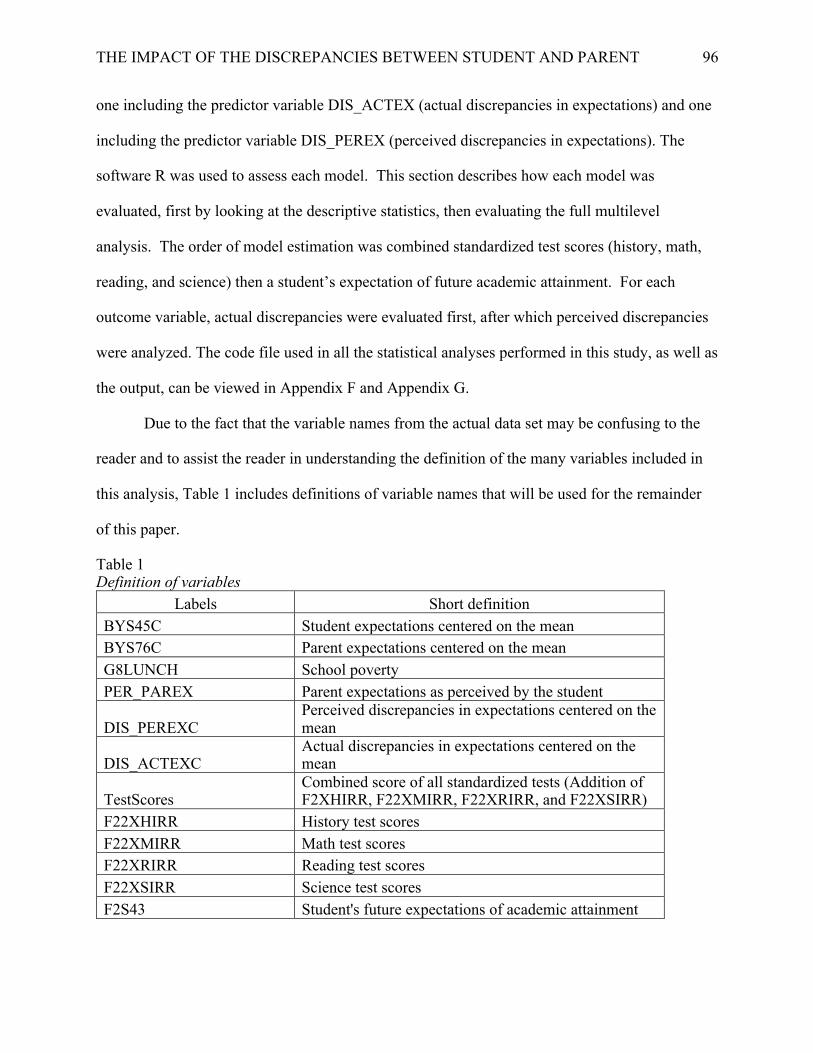
THE IMPACT OF THE DISCREPANCIES BETWEEN STUDENT AND PARENT 96
one including the predictor variable DIS_ACTEX (actual discrepancies in expectations) and one
including the predictor variable DIS_PEREX (perceived discrepancies in expectations). The
software R was used to assess each model. This section describes how each model was
evaluated, first by looking at the descriptive statistics, then evaluating the full multilevel
analysis. The order of model estimation was combined standardized test scores (history, math,
reading, and science) then a student’s expectation of future academic attainment. For each
outcome variable, actual discrepancies were evaluated first, after which perceived discrepancies
were analyzed. The code file used in all the statistical analyses performed in this study, as well as
the output, can be viewed in Appendix F and Appendix G.
Due to the fact that the variable names from the actual data set may be confusing to the
reader and to assist the reader in understanding the definition of the many variables included in
this analysis, Table 1 includes definitions of variable names that will be used for the remainder
of this paper.
Table 1 Definition of variables
Labels Short definition BYS45C Student expectations centered on the mean BYS76C Parent expectations centered on the mean G8LUNCH School poverty PER_PAREX Parent expectations as perceived by the student
DIS_PEREXC Perceived discrepancies in expectations centered on the mean
DIS_ACTEXC Actual discrepancies in expectations centered on the mean
TestScores Combined score of all standardized tests (Addition of F2XHIRR, F22XMIRR, F22XRIRR, and F22XSIRR)
F22XHIRR History test scores F22XMIRR Math test scores F22XRIRR Reading test scores F22XSIRR Science test scores F2S43 Student's future expectations of academic attainment

THE IMPACT OF THE DISCREPANCIES BETWEEN STUDENT AND PARENT 97
Descriptive statistics for initial NELS:88 data set
Descriptive statistics for the initial NELS:88 data set were examined to compare
participants from the initial data set to the subsets of data examined within this study. This was
to ensure that there were no major discrepancies between the samples employed within this study
and the original data set. Employing the ‘describe’ function in R, I produced a table of
descriptive statistics to evaluate each variable within the alldata.csv data set independently (see
Table 2). This data set included 22,511 participants nested in 975 schools, of which 11,209 were
male (50%) and 11,302 were female and 6,979 (31%) reported being a minority (not white).
The standardized mean score for the outcome variable of test scores – number of correct answers
on combined standardized tests taken in 12th grade – was 141.59 with a range of 61.73 to 209.24.
The standardized mean score for the outcome variable of future expectations of academic
attainment was 3.01 with a range of 0 to 4. With respect to the variable of school poverty, 3,060
(14%) of the participants attended a school where more than 50% of the students were received
free or reduced lunches.
Descriptive statistics for total score
The number of participants evaluated within this study (10,643 to 12,953) was much
smaller than the original data set from NELS:88 (22,511) (see Table 2). This reduction in
participants was due to students being eliminated from the data set if they did not answer certain
questions that were pertinent to the present study. As explained earlier in this section if students
did not answer questions about their current expectation of academic attainment, how they
perceived their parent’s expectations of their academic attainment to be, expectations of future
academic attainment, or register a score on all four standardized tests, students were removed
from the study. Additionally, if a student’s parent did not answer the expectation question on the
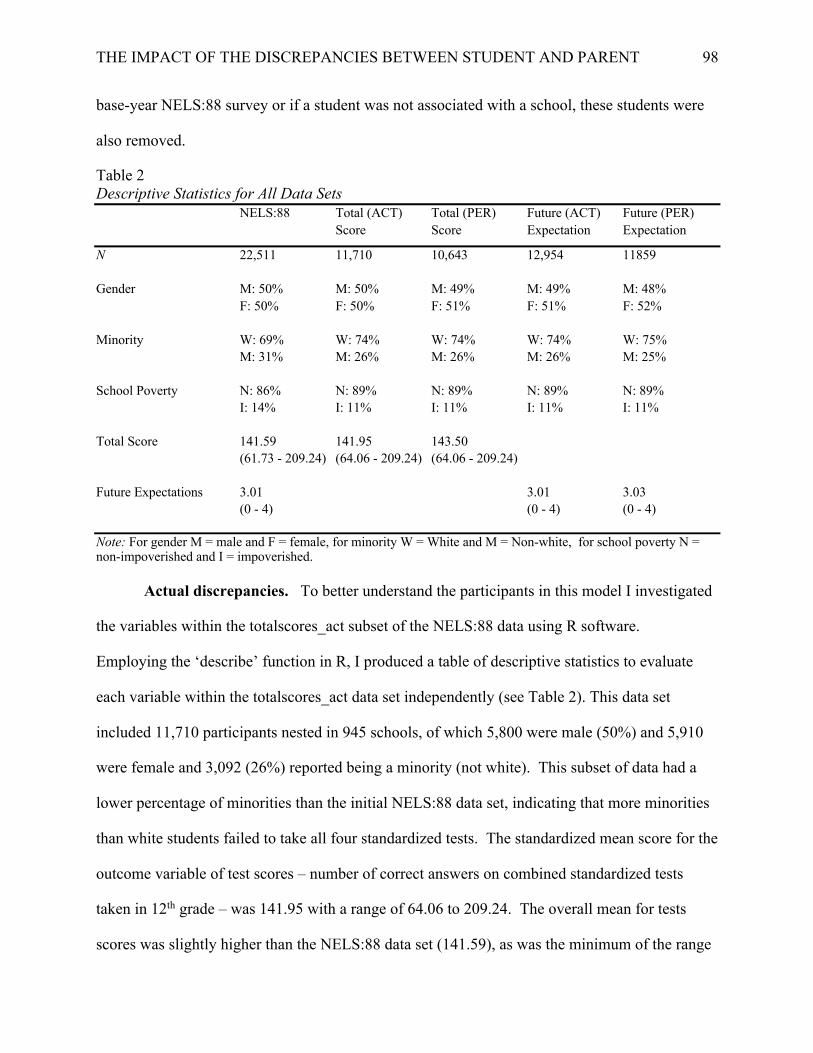
THE IMPACT OF THE DISCREPANCIES BETWEEN STUDENT AND PARENT 98
base-year NELS:88 survey or if a student was not associated with a school, these students were
also removed.
Table 2 Descriptive Statistics for All Data Sets
NELS:88 Total (ACT) Total (PER) Future (ACT) Future (PER) Score Score Expectation Expectation
N 22,511 11,710 10,643 12,954 11859 Gender M: 50% M: 50% M: 49% M: 49% M: 48% F: 50% F: 50% F: 51% F: 51% F: 52% Minority W: 69% W: 74% W: 74% W: 74% W: 75% M: 31% M: 26% M: 26% M: 26% M: 25% School Poverty N: 86% N: 89% N: 89% N: 89% N: 89% I: 14% I: 11% I: 11% I: 11% I: 11% Total Score 141.59 141.95 143.50 (61.73 - 209.24) (64.06 - 209.24) (64.06 - 209.24) Future Expectations 3.01 3.01 3.03 (0 - 4) (0 - 4) (0 - 4) Note: For gender M = male and F = female, for minority W = White and M = Non-white, for school poverty N = non-impoverished and I = impoverished.
Actual discrepancies. To better understand the participants in this model I investigated
the variables within the totalscores_act subset of the NELS:88 data using R software.
Employing the ‘describe’ function in R, I produced a table of descriptive statistics to evaluate
each variable within the totalscores_act data set independently (see Table 2). This data set
included 11,710 participants nested in 945 schools, of which 5,800 were male (50%) and 5,910
were female and 3,092 (26%) reported being a minority (not white). This subset of data had a
lower percentage of minorities than the initial NELS:88 data set, indicating that more minorities
than white students failed to take all four standardized tests. The standardized mean score for the
outcome variable of test scores – number of correct answers on combined standardized tests
taken in 12th grade – was 141.95 with a range of 64.06 to 209.24. The overall mean for tests
scores was slightly higher than the NELS:88 data set (141.59), as was the minimum of the range
THE IMPACT OF THE DISCREPANCIES BETWEEN STUDENT AND PARENT 99
(61.73 to 209.24 for entire NELS:88 data set). The predictor variables were centered on the
mean with ranges of -2.88 to 1.12 for student expectations, -2.77 to 1.23 for actual parent
expectations, and -3.89 to 4.11 for actual discrepancies in expectations. With respect to the
variable of school poverty, 1,314 (11%) of the participants attended a school where more than
50% of the students received free or reduced lunches, slightly lower than the NEL:88 data set.
Perceived discrepancies. There were 10,643 students nested within 944 schools
included in the history_per data set with 5,252 being male (49%) and 5,391 being female (See
Table 2). Twenty six percent (2,728) of the participants reported being minority and 11% (1141)
attended a school with more than 50% of students receiving free or reduced lunches. There were
slightly fewer males for this subset than the original NEL:88 data and the number of minority
students and students attending low-income schools were also lower than NELS:88 data. The
standardized mean score for the outcome variable of test scores – number of correct answers on
combined standardized tests taken in 12th grade – was 143.50 with a range of 64.06 to 209.24,
both the mean score and the minimum were higher than the respective statistics the NELS:88
data set overall (mean = 141.59 and range = 61.73 to 209.24). The predictor variables had a
range of -2.92 to 1.08 for student expectations, -3.03 to 0.97 for perceived parent expectations,
and -4.11 to 3.89 for perceived discrepancies in expectations. These three variables were all
centered on the mean.
Descriptive statistics for future expectations of academic attainment
Actual discrepancies. This data set included 12,954 participants nested in 945 schools,
of which 6,309 were male (49%) and 6,645 were female and 3,401 (26%) reported being a
minority (not white)(See Table 2). This subset of data had a lower percentage of males and
minorities than the initial NELS:88 data set, indicating that more males than females, and
minorities than white students failed to answer the fourth-year follow-up survey question related

THE IMPACT OF THE DISCREPANCIES BETWEEN STUDENT AND PARENT 100
to future expectations of academic attainment. The standardized mean score for the outcome
variable of future expectations of academic attainment was 3.01. The overall mean for future
expectations was equal to that of the NELS:88 data set. The predictor variables were centered on
the mean with ranges of -2.94 to 1.06 for student expectations, -2.83 to 1.17 for actual parent
expectations, and -3.89 to 4.11 for actual discrepancies in expectations. With respect to the
variable of school poverty, it indicated that 1,372 (11%) of the participants attended a school
where more than 50% of the students were received free or reduced lunches , slightly lower than
the NEL:88 data set.
Perceived discrepancies. There were 11,859 students nested within 944 schools
included in the futureex_per data set with 5,769 being male (48%) and 6,090 being female (See
Table 2). 25% (3023) of the participants reported being minority and 11% (1196) attended a
school with more than 50% of students receiving free or reduced lunches. Gender was slightly
lower for this subset than the original NEL:88 data and the number of minority students and
students attending low-income schools were lower than NELS:88 data. The standardized mean
score for the outcome variable of future expectations of academic attainment was 3.03, higher
than that of the NELS:88 data set. The predictor variables had a range of -2.92 to 1.08 for
student expectations, -3.03 to 0.97 for perceived parent expectations, and -4.11 to 3.89 for
perceived discrepancies in expectations. These three variables were all centered on the mean.
HLM analysis for total scores
Actual discrepancies. In order to answer the questions and test the hypotheses proposed
earlier in my study, a random effects multilevel analysis was run using the ‘lmer’ function within
the R package ‘lmerTest’ (see Table 3). Using the previously described data set totalscores_act,
students were nested in schools with the examined variables being RACE (minority or not), SEX
(gender), DIS_ACTEXC (discrepancies in actual expectations) and BYS45C (student

THE IMPACT OF THE DISCREPANCIES BETWEEN STUDENT AND PARENT 101
expectations) at the student level (level 1), G8LUNCH (school level poverty) at the school level
(level 2), the interaction of DIS_ACTEXC and BYS45C, the interaction of DIS_ACTEXC and
G8LUNCH, the interaction of BYS45C and G8LUNCH, and the 3-way interaction of
DIS_ACTEXC, BYS45C, and G8LUNCH. The random effects of DIS_ACTEXC was also
examined to investigate whether the impact of discrepancies in actual expectations on test scores
varied between schools.
Answering research question 1, related to the impact of student expectations on a
student’s performance on standardized test scores, the main effect of student expectations
indicated a significant positive relationship with test scores when controlling for the other
variables in the model (p < .001). The effect size for student expectations was 0.56, indicating a
strong relationship with test scores and that for every one standard deviation student expectations
increased, test scores would be expected to increase 0.56 of a standard deviation.
Table 3
HLM Results for Actual Discrepancies Predicting Total Scores – Fixed Effects and Random
Effects
Estimate Std. Error df t value Pr(>|t|) Fixed Effects Intercept 148.353*** 0.512 1655.9916 288.490 <2e-16 *** Minority -12.7526 0.6394 9852.9877 -19.946 < 2e-16 ***
Standardized -0.17 Gender -3.8153 0.4819 11501.6977 -7.918 2.64e-15 ***
Standardized -.06 Actual discrepancy 11.1337 0.3359 1045.1643 33.146 < 2e-16 ***
Standardized 0.30 Student expectation 20.2627 0.3446 11548.7064 58.793 < 2e-16 ***
Standardized 0.56 School poverty -10.8111 1.2740 1271.6458 -8.486 < 2e-16 ***
Standardized -0.10 Interactions

THE IMPACT OF THE DISCREPANCIES BETWEEN STUDENT AND PARENT 102
Actual discrepancy & 0.4273 0.2881 4576.4881 1.483 0.138 student expectation Actual discrepancy & -4.9949 0.8738 814.7867 -5.717 1.53e-08 *** school poverty Student expectation & -7.2282 0.9374 11655.8391 -7.711 1.35e-14 *** school poverty Actual discrepancy & 2.9897 0.6936 5742.0102 4.310 1.66e-05 *** student expectations & school poverty Random Effects Variance Std. Deviation Corr SCH_ID (Intercept) 83.5989 9.143 Discrepancies in exp. 0.9448 0.972 -0.44 Residual 630.2185 25.104 . p < .1 *p < .05; ** p < .01; *** p < .001
Addressing Research Question 2, investigating the impact of actual discrepancies on total
scores, the main effect of actual discrepancies indicated a significant positive relationship with
total scores when controlling for the other variables included in the model (p < .001). This
finding suggests that when all other variables are at 0, and there is an increase in actual
discrepancies (parent having a higher expectation than the student), test scores would be
expected to increase. The strength of the relationship between actual discrepancies and test
scores was strong as well, as the effect size of 0.30 indicated. This suggests that as actual
discrepancies increase one standard deviation, test scores would be expected to increase 0.30 of a
standard deviation.
Gender, minority, and school poverty had significant main effects on test scores (p <
.001). The main effect of gender suggests that females would be expected to score lower on test
scores compared to a male when controlling for all other variables in the model. The strength of
the relationship between gender and test scores was low as indicated by the -0.06 effect size.
The finding indicates that going from males to female, test scores would be expected to decrease

THE IMPACT OF THE DISCREPANCIES BETWEEN STUDENT AND PARENT 103
0.06 of a standard deviation. Similarly, minorities also would be expected to score lower on tests
than would white students, although the strength of the relationship of race and test scores was
stronger than gender, the effect size was still low at -0.17. The school level variable of school
poverty has a main effect on test scores, in that students who attend an impoverished school
(more than 50% of students receiving free or reduced lunches) would be predicted to have a
lower test score than those who did not, when controlling for all other variables (p < .001). The
effect size of -0.10 for school poverty indicates that the relationship between school poverty and
test scores is low. The finding indicates that going from non-impoverished to impoverished
schools, test scores would be expected to decrease 0.10 of a standard deviation.
Regarding Research Question 4, the interaction of actual discrepancies and school
poverty in their relationship to student achievement was significant (p < .001). For students
attending impoverished schools (greater than 50% on free or reduced lunches), as actual
discrepancies increased (parent held higher expectations than the student) her total test scores
would be expected to decrease. For students attending a non-impoverished school, expectations
were not related to test scores.
The interaction of student expectations and school poverty in their relationship to test
scores was also significant (p < .001). This result indicated that if a student attended an
impoverished school, as her own expectations increased, her total test score would be expected to
decrease. For a student attending a non-impoverished school, student expectations were not
related to test scores.
With respect to test scores, the three-way interaction between school poverty, actual
discrepancies and student expectations was significant (p < .001). For students attending an
impoverished school, there was a significant interaction between actual discrepancies and student
expectations in their relationship to test scores. That is, the relationship between student
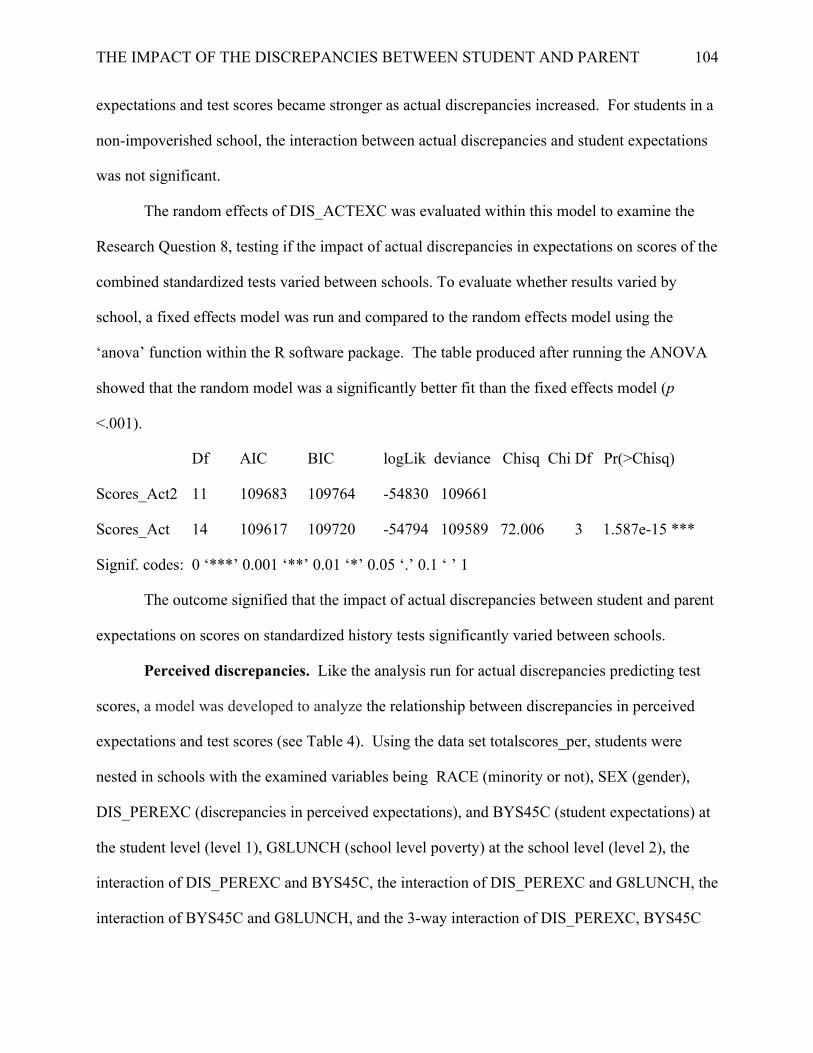
THE IMPACT OF THE DISCREPANCIES BETWEEN STUDENT AND PARENT 104
expectations and test scores became stronger as actual discrepancies increased. For students in a
non-impoverished school, the interaction between actual discrepancies and student expectations
was not significant.
The random effects of DIS_ACTEXC was evaluated within this model to examine the
Research Question 8, testing if the impact of actual discrepancies in expectations on scores of the
combined standardized tests varied between schools. To evaluate whether results varied by
school, a fixed effects model was run and compared to the random effects model using the
‘anova’ function within the R software package. The table produced after running the ANOVA
showed that the random model was a significantly better fit than the fixed effects model (p
<.001).
Df AIC BIC logLik deviance Chisq Chi Df Pr(>Chisq)
Scores_Act2 11 109683 109764 -54830 109661
Scores_Act 14 109617 109720 -54794 109589 72.006 3 1.587e-15 ***
Signif. codes: 0 ‘***’ 0.001 ‘**’ 0.01 ‘*’ 0.05 ‘.’ 0.1 ‘ ’ 1
The outcome signified that the impact of actual discrepancies between student and parent
expectations on scores on standardized history tests significantly varied between schools.
Perceived discrepancies. Like the analysis run for actual discrepancies predicting test
scores, a model was developed to analyze the relationship between discrepancies in perceived
expectations and test scores (see Table 4). Using the data set totalscores_per, students were
nested in schools with the examined variables being RACE (minority or not), SEX (gender),
DIS_PEREXC (discrepancies in perceived expectations), and BYS45C (student expectations) at
the student level (level 1), G8LUNCH (school level poverty) at the school level (level 2), the
interaction of DIS_PEREXC and BYS45C, the interaction of DIS_PEREXC and G8LUNCH, the
interaction of BYS45C and G8LUNCH, and the 3-way interaction of DIS_PEREXC, BYS45C

THE IMPACT OF THE DISCREPANCIES BETWEEN STUDENT AND PARENT 105
and G8LUNCH. The random effects of DIS_PEREXC (discrepancies in perceived expectations)
was also examined.
Regarding Research Question 1, when controlling for other variables in the model,
student expectations were positively related to test scores (p < .001). This suggests that as a
student’s expectation increases, her combined test score should increase. The effect size for
student expectations was 0.46, indicating a strong relationship with test scores and that for every
one standard deviation student expectations increased, test scores would be expected to increase
0.46 of a standard deviation.
Research Question 3 inquired about the relationship between perceived discrepancies and
total scores. The main effect of perceived discrepancies indicated a significant positive
relationship with total scores when controlling for the other variables included in the model (p <
.001). This finding suggests that when all other variables are at 0, as students believe that their
parents have higher expectations than they do, test scores would be expected to increase. The
strength of the relationship between perceived discrepancies and test scores was weak, as the
effect size of 0.11 indicated. This suggests that as perceived discrepancies increase one standard
deviation, test scores would be expected to increase 0.11 of a standard deviation.
Gender, minority, and school poverty showed significant main effects on test scores (p <
.001). The main effect of gender suggests that females would be expected to score lower on test
scores compared to males when controlling for all other variables in the model. The strength of
the relationship between gender and test scores was low as indicated by the effect size of -0.06.
The finding indicates that going from male to female, test scores would be expected to decrease
0.06 of a standard deviation. Similarly, minorities would be expected to score lower on tests than
would white students, although the strength of the relationship of race and test scores was
stronger than gender, the effect size was still low at -0.16.
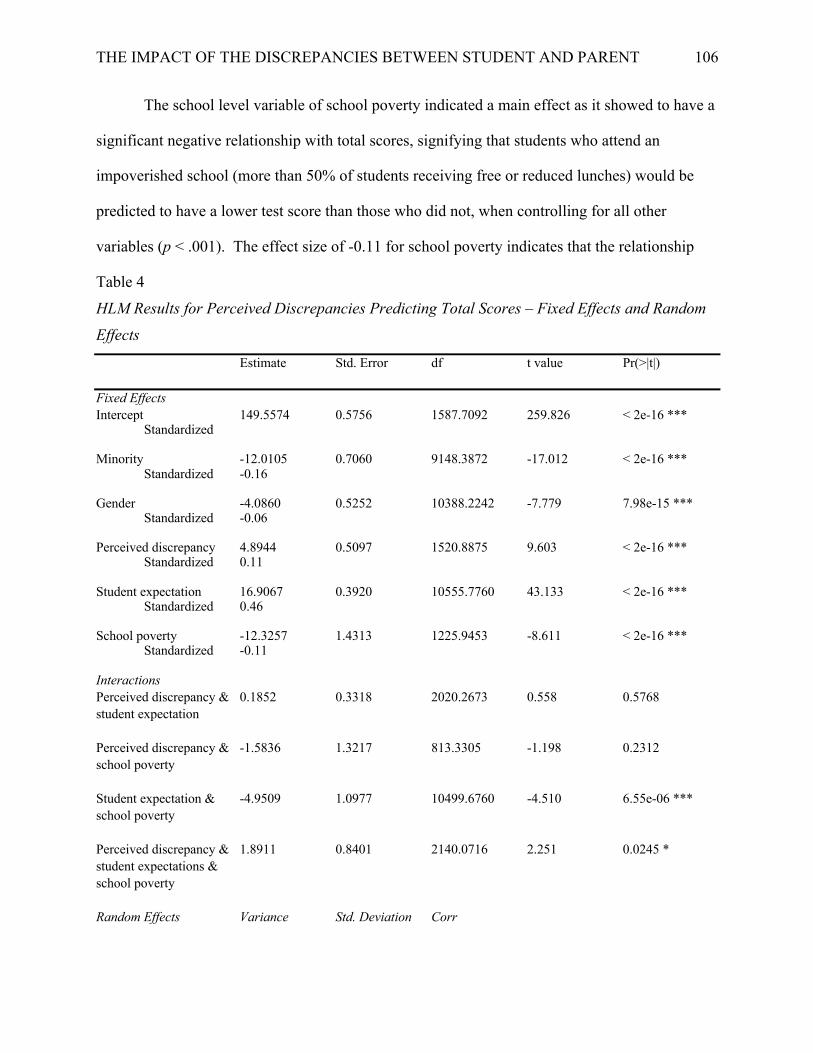
THE IMPACT OF THE DISCREPANCIES BETWEEN STUDENT AND PARENT 106
The school level variable of school poverty indicated a main effect as it showed to have a
significant negative relationship with total scores, signifying that students who attend an
impoverished school (more than 50% of students receiving free or reduced lunches) would be
predicted to have a lower test score than those who did not, when controlling for all other
variables (p < .001). The effect size of -0.11 for school poverty indicates that the relationship
Table 4
HLM Results for Perceived Discrepancies Predicting Total Scores – Fixed Effects and Random
Effects
Estimate Std. Error df t value Pr(>|t|) Fixed Effects Intercept 149.5574 0.5756 1587.7092 259.826 < 2e-16 ***
Standardized Minority -12.0105 0.7060 9148.3872 -17.012 < 2e-16 ***
Standardized -0.16 Gender -4.0860 0.5252 10388.2242 -7.779 7.98e-15 ***
Standardized -0.06
Perceived discrepancy 4.8944 0.5097 1520.8875 9.603 < 2e-16 *** Standardized 0.11
Student expectation 16.9067 0.3920 10555.7760 43.133 < 2e-16 ***
Standardized 0.46 School poverty -12.3257 1.4313 1225.9453 -8.611 < 2e-16 ***
Standardized -0.11 Interactions Perceived discrepancy & 0.1852 0.3318 2020.2673 0.558 0.5768 student expectation Perceived discrepancy & -1.5836 1.3217 813.3305 -1.198 0.2312 school poverty Student expectation & -4.9509 1.0977 10499.6760 -4.510 6.55e-06 *** school poverty Perceived discrepancy & 1.8911 0.8401 2140.0716 2.251 0.0245 * student expectations & school poverty Random Effects Variance Std. Deviation Corr

THE IMPACT OF THE DISCREPANCIES BETWEEN STUDENT AND PARENT 107
SCH_ID (Intercept) 116.545 10.796 Discrepancies in exp. 9.134 3.022 -0.56 Residual 671.480 25.913 . p < .1 *p < .05; ** p < .01; *** p < .001
between school poverty and test scores is low, and that going from a non-impoverished school to
an impoverished school, test scores would decrease 0.11 of a standard deviation.
Controlling for the other variables in the model and addressing Research Question 5, the
interaction of perceived discrepancies and school poverty showed no significant effect,
indicating no relationship to test scores. The interaction of student expectations and school
poverty, however, was significant (p < .001). This result indicated that if a student attended an
impoverished school – greater than 50% on free or reduced lunches – as her own expectations
increased, her total test score would be expected to decrease. For students attending a non-
impoverished school, expectations were not related to test scores.
With respect to test scores, the three-way interaction between school poverty, perceived
discrepancies and student expectations was significant (p < .05). For students attending an
impoverished school, there was a significant interaction between perceived discrepancies and
student expectations in their relationship to test scores. That is, the relationship between student
expectations and test scores became stronger as perceived discrepancies increased. For students
in a non-impoverished school, the interaction between perceived discrepancies and student
expectations was not significant.
To address Research Question 8, the random effects of DIS_PEREXC was evaluated
within this model to examine whether the impact of perceived discrepancies in expectations on
scores of the combined standardized tests varied between schools. To evaluate

THE IMPACT OF THE DISCREPANCIES BETWEEN STUDENT AND PARENT 108
whether results varied by school, a fixed effects model was run and compared to the random
effects model using the ‘anova’ function within the R software package. The table produced
after running the ANOVA showed that the random model was a significantly better fit than the
fixed effects model (p <.001).
Df AIC BIC logLik deviance Chisq Chi Df Pr(>Chisq)
Scores_Per2 12 100516 100603 -50246 100492
Scores_Per 14 100506 100607 -50239 100478 14.476 2 0.0007186 ***
Signif. codes: 0 ‘***’ 0.001 ‘**’ 0.01 ‘*’ 0.05 ‘.’ 0.1 ‘ ’ 1
The chi square was statistically significant indicating that the impact of actual
discrepancies between student and parent expectations on scores on standardized history tests
significantly varied between schools (p < .001).
HLM analysis for future expectations of academic attainment
Actual discrepancies. In order to answer the research questions and examine the
hypotheses proposed in my study, a random effects multilevel analysis was run using the ‘lmer’
function within the ‘lmerTest’ library in the R software package (see Table 5). Using the
previously mentioned data set futureex_act, students were nested in schools with the examined
variables being RACE (minority or not), SEX (gender), DIS_ACTEXC (actual discrepancies in
expectations) and BYS45C (student expectations) at the student level (level 1), G8LUNCH
(school level poverty) at the school level (level 2), the interaction of DIS_ACTEXC and
BYS45C, DIS_ACTEXC and G8LUNCH, the interaction of BYS45C and G8LUNCH, and the
3-way interaction of DIS_ACTEXC, BYS45C and G8LUNCH. The random effects of
DIS_ACTEXC was also examined.
Regarding Research Question 1, student expectations were positively related to future
expectations when controlling for the other variables in the model (p < .001). This implies that

THE IMPACT OF THE DISCREPANCIES BETWEEN STUDENT AND PARENT 109
as a student’s expectation increases, her expectation of future academic attainment – how far she
will go in school – should be expected to increase. The effect size for student expectations was
Table 5
HLM Results for Actual Discrepancies Predicting Future Expectations – Fixed Effects and
Random Effects
Estimate Std. Error df t value Pr(>|t|) Fixed Effects Intercept 2.956e+00 1.229e-02 2.062e+03 240.523 < 2e-16 *** Minority 5.123e-02 1.697e-02 8.276e+03 3.019 0.002544 **
Standardized 0.02
Gender 7.558e-02 1.339e-02 1.291e+04 5.644 1.69e-08 *** Standardized 0.04 Actual discrepancy 2.706e-01 1.012e-02 1.073e+03 26.739 < 2e-16 *** Standardized 0.27 Student expectation 6.095e-01 9.723e-03 1.160e+04 62.689 < 2e-16 *** Standardized 0.59 School poverty -8.829e-02 2.989e-02 1.536e+03 -2.954 0.003184 ** Standardized -0.03 Interactions Actual discrepancy & -9.676e-03 8.390e-03 6.238e+03 -1.153 0.248803 student expectation Actual discrepancy & -8.015e-02 2.732e-02 1.022e+03 -2.934 0.003422 ** school poverty Student expectation & -9.451e-02 2.769e-02 1.274e+04 -3.413 0.000645 *** school poverty Actual discrepancy & 1.608e-02 2.093e-02 6.784e+03 0.769 0.442197 student expectations & school poverty Random Effects Variance Std. Deviation Corr SCH_ID (Intercept) 0.02554 0.1598 Discrepancies in exp. 0.01076 0.1037 -0.09 Residual 0.54807 0.7403
THE IMPACT OF THE DISCREPANCIES BETWEEN STUDENT AND PARENT 110
. p < .1 *p < .05; ** p < .01; *** p < .001
0.59, indicating a strong relationship with expectations of future achievement and that for every
one standard deviation student expectations increased, expectations of future achievement would
be expected to increase 0.59 of a standard deviation. Similarly, the main effect of actual
discrepancies has a significant positive relationship with future expectations when controlling for
the other variables included in the model (p < .001). This finding suggests that when all other
variables are at 0, and there is an increase in actual discrepancies (parent having a higher
expectation than the student), a student’s expectation of future academic attainment would be
expected to increase. The strength of the relationship between actual discrepancies and test
scores was moderate, as the effect size of 0.27 indicates. This suggests that as actual
discrepancies increase one standard deviation, expectation of future achievement would be
expected to increase 0.27 of a standard deviation.
Gender had a significant main effect on the impact of future expectations (p < . 001).
The positive effect of gender suggests that females would be expected to have higher
expectations of academic attainment compared to a male when controlling for all other variables
in the model. The strength of the relationship between gender and test scores was low as the
0.04 effect size would indicate. The finding indicates that going from male to female, future
expectations would be expected to increase 0.04 of a standard deviation. In the same vein, the
significant main effect of minorities signified that minorities also would be expected to have
higher future expectations of academic achievement than would white children (p < .05). The
strength of the relationship of race and future expectations was also low with the effect size at
0.02.
The school level variable of school poverty indicated a main effect as it showed to have a
significant negative effect, signifying that students who attended an impoverished school (more
than 50% of students receiving free or reduced lunches) would be predicted to have a lower test

THE IMPACT OF THE DISCREPANCIES BETWEEN STUDENT AND PARENT 111
score than those who did not, when controlling for all other variables (p < .05). The effect size
of -0.03 for school poverty indicates that the relationship between school poverty and future
expectations is low, and that going from a non-impoverished school to an impoverished school,
future expectations would decrease 0.03 of a standard deviation.
Research Question 6 posed whether school poverty moderated the relationship between
actual discrepancies in expectations and a student’s future expectations of academic attainment.
The interaction of actual discrepancies and school poverty had a significant effect on a student’s
future expectations of academic achievement while controlling for the other variables in the
model (p < .05). For students attending an impoverished school, as actual discrepancies
increased, the student’s expectation of future academic attainment would be expected to
decrease. For students attending non-impoverished schools, discrepancies in expectations were
not related to future expectations.
The interaction of student expectations and school poverty was significant (p < .001).
For students attending an impoverished school, as her own expectations of academic attainment
increased, her future expectations of academic attainment would be expected to increase. For
students attending non-impoverished schools, expectations were not related to future
expectations.
The three-way interaction between actual discrepancies, student expectations, and school
poverty was not significant for future expectations. This finding suggests that the interaction of
student expectations and actual discrepancies with respect to a student's expectation of future
academic attainment was not influenced by school poverty. The two-way interaction effect was
the same for both impoverished and non-impoverished schools.
The random effects of DIS_ACTEXC was evaluated within this model to examine
whether the impact of actual discrepancies in expectations on future expectations varied between

THE IMPACT OF THE DISCREPANCIES BETWEEN STUDENT AND PARENT 112
schools (Research Question 8). To evaluate whether results varied by school a fixed effects
model was run and compared to the random effects model using the ‘anova’ function within the
R software package. The table produced after running the ANOVA showed that the random
model was a significantly better fit than the fixed effects model (p <.001).
Df AIC BIC logLik deviance Chisq Chi Df Pr(>Chisq)
futureexACT2 12 29632 29721 -14804 29608
futureexACT 14 29616 29721 -14794 29588 19.346 2 6.296e-05 ***
Signif. codes: 0 ‘***’ 0.001 ‘**’ 0.01 ‘*’ 0.05 ‘.’ 0.1 ‘ ’ 1
The outcome signified that the impact of actual discrepancies between student and parent
expectations on future expectations of academic attainment significantly varied between schools.
Perceived discrepancies. Like the process used in evaluating the relationship between
actual discrepancies and future expectations, I created a data set futureex_per, to analyze the
relationship between perceived discrepancies and future expectations of academic outcomes. I
examined the variables RACE (minority or not), SEX (gender), DIS_PEREXC (perceived
discrepancies in expectations) and BYS45C (student expectations) at the student level (level 1),
G8LUNCH (school poverty level) at the school level (level 2), the interaction of DIS_PEREXC
and BYS45C, the interaction of DIS_PERTEXC and G8LUNCH, the interaction of BYS45C and
G8LUNCH, and the 3-way interaction of DIS_PEREXC, BYS45C and G8LUNCH. The random
effects of DIS_PEREXC was also examined.
Investigating the main effects of this model and answering Research Question 1, student
expectations had a significant positive relationship with future expectations when controlling for
the other variables in the model (p < .001). This indicated that as a student’s expectation
increased, her future expectations of academic attainment would be expected to increase. The
effect size for student expectations was 0.50, indicating a strong relationship with future

THE IMPACT OF THE DISCREPANCIES BETWEEN STUDENT AND PARENT 113
expectations of academic achievement and that for every one standard deviation student
expectations increased, expectations of future achievement would be expected to increase 0.50 of
a standard deviation. Similarly, the main effect of perceived discrepancies has a significant
positive relationship with future expectations when controlling for the other variables included in
the model (p < .001). This finding suggests that when all other variables are at 0, and there is an
increase in actual discrepancies (parent having a higher expectation than the student), future
expectations would be expected to increase. The strength of the relationship between perceived
discrepancies and future expectation was low, indicated by the effect size of 0.11. This suggests
that as actual discrepancies increase one standard deviation, expectation of future achievement
would be expected to increase 0.11 of a standard deviation.
Gender, minority, and school poverty also had significant main effects on future
expectations (p < .001). The main effect of gender suggests that females would be expected to
have higher future expectations of academic attainment compared to males when controlling for
all other variables in the model. The strength of the relationship between gender and test scores
was low as the 0.04 effect size would indicate. The finding indicates that going from male to
female, future expectations would be expected to increase 0.04 of a standard deviation.
Comparably, minorities would be expected to have higher future expectations than would white
children. The strength of the relationship of race and future expectations was also low with the
effect size at 0.03.
Table 6
HLM Results for Perceived Discrepancies Predicting Future Expectations – Fixed Effects and
Random Effects
Estimate Std. Error df t value Pr(>|t|) Fixed Effects Intercept 2.980e+00 1.363e-02 1.976e+03 218.672 < 2e-16 ***
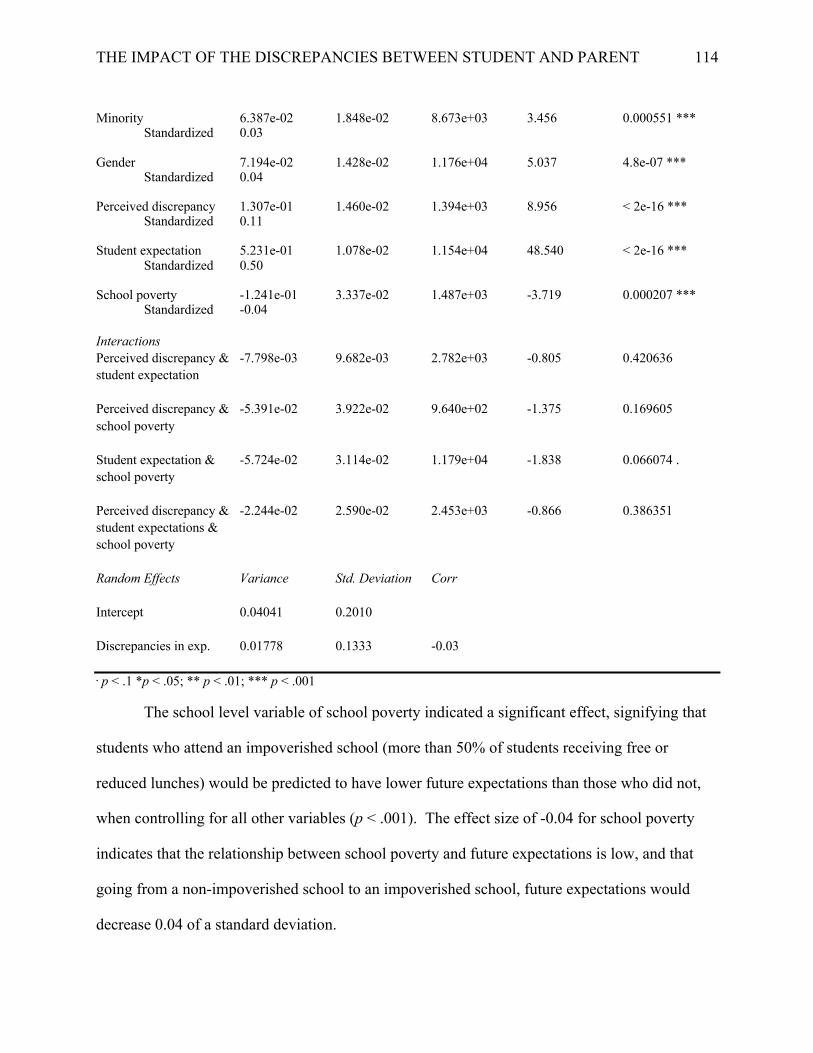
THE IMPACT OF THE DISCREPANCIES BETWEEN STUDENT AND PARENT 114
Minority 6.387e-02 1.848e-02 8.673e+03 3.456 0.000551 *** Standardized 0.03 Gender 7.194e-02 1.428e-02 1.176e+04 5.037 4.8e-07 *** Standardized 0.04 Perceived discrepancy 1.307e-01 1.460e-02 1.394e+03 8.956 < 2e-16 *** Standardized 0.11 Student expectation 5.231e-01 1.078e-02 1.154e+04 48.540 < 2e-16 *** Standardized 0.50 School poverty -1.241e-01 3.337e-02 1.487e+03 -3.719 0.000207 *** Standardized -0.04 Interactions Perceived discrepancy & -7.798e-03 9.682e-03 2.782e+03 -0.805 0.420636 student expectation Perceived discrepancy & -5.391e-02 3.922e-02 9.640e+02 -1.375 0.169605 school poverty Student expectation & -5.724e-02 3.114e-02 1.179e+04 -1.838 0.066074 . school poverty Perceived discrepancy & -2.244e-02 2.590e-02 2.453e+03 -0.866 0.386351 student expectations & school poverty Random Effects Variance Std. Deviation Corr Intercept 0.04041 0.2010 Discrepancies in exp. 0.01778 0.1333 -0.03 . p < .1 *p < .05; ** p < .01; *** p < .001
The school level variable of school poverty indicated a significant effect, signifying that
students who attend an impoverished school (more than 50% of students receiving free or
reduced lunches) would be predicted to have lower future expectations than those who did not,
when controlling for all other variables (p < .001). The effect size of -0.04 for school poverty
indicates that the relationship between school poverty and future expectations is low, and that
going from a non-impoverished school to an impoverished school, future expectations would
decrease 0.04 of a standard deviation.

THE IMPACT OF THE DISCREPANCIES BETWEEN STUDENT AND PARENT 115
Attempting to answer Research Question 7, the interaction of perceived discrepancies and
school poverty had no significant effect on future expectations while controlling for the other
variables in the model. Similarly, the three-way interaction between perceived discrepancies,
student expectations, and school poverty was not significant for future expectations. This finding
suggests that the interaction of student expectations and perceived discrepancies with respect to a
student's expectation of future academic attainment was not influenced by school poverty. The
two-way interaction effect was the same for both impoverished and non-impoverished schools.
The interaction of student expectations and school poverty was significant (p < .1). This
result indicated that if a student attended an impoverished school, as her own expectations
increased, her future expectations would be expected to decrease. For a student attending a non-
impoverished school, student expectations were not related to future expectations.
The random effects of DIS_PEREXC was evaluated within this model to examine
whether the impact of perceived discrepancies in expectations on future expectations of
academic attainment varied between schools (Research Question 8). To evaluate whether results
varied by school, a fixed effects model was run and compared to the random effects model using
the ‘anova’ function within the R software package. The table produced after running the
ANOVA showed that the random model was a significantly better fit than the fixed effects
model (p <.001).
Df AIC BIC logLik deviance Chisq Chi Df Pr(>Chisq)
futureexPER2 12 27652 27740 -13814 27628
futureexPER 14 27636 27739 -13804 27608 20.137 2 4.24e-05 ***
Signif. codes: 0 ‘***’ 0.001 ‘**’ 0.01 ‘*’ 0.05 ‘.’ 0.1 ‘ ’ 1
The outcome signified that the impact of actual discrepancies between student and parent
expectations on future expectations of academic attainment significantly varied between schools.
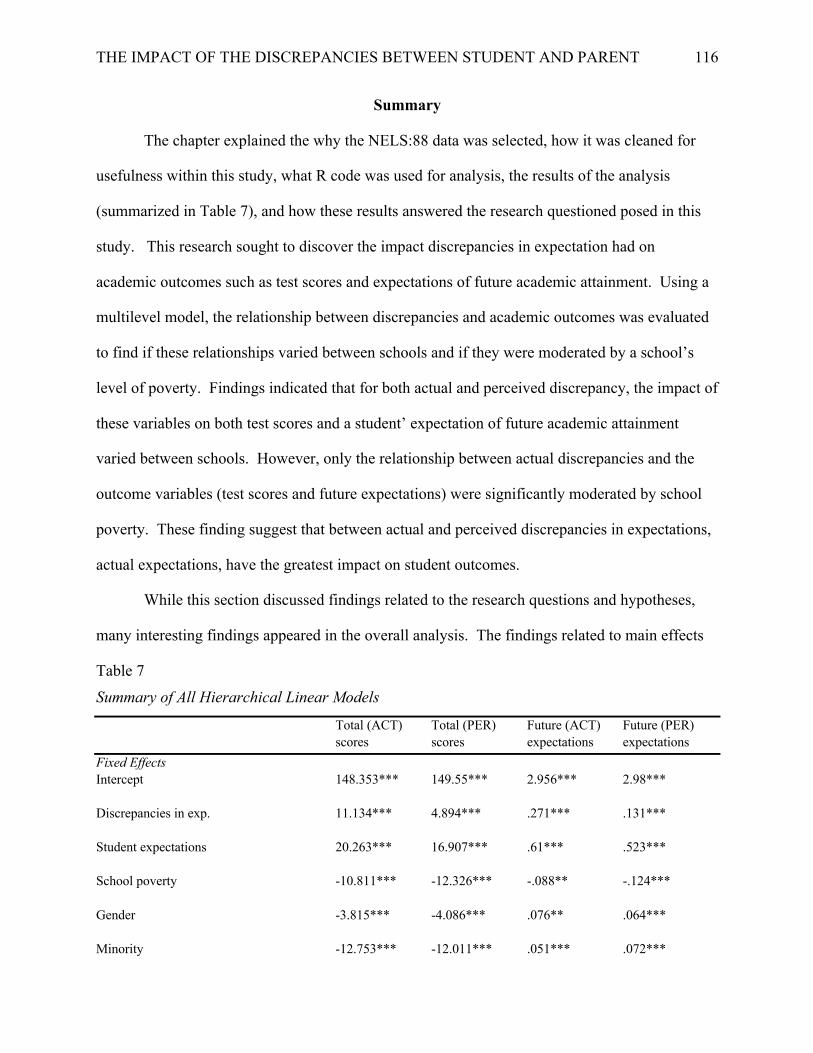
THE IMPACT OF THE DISCREPANCIES BETWEEN STUDENT AND PARENT 116
Summary
The chapter explained the why the NELS:88 data was selected, how it was cleaned for
usefulness within this study, what R code was used for analysis, the results of the analysis
(summarized in Table 7), and how these results answered the research questioned posed in this
study. This research sought to discover the impact discrepancies in expectation had on
academic outcomes such as test scores and expectations of future academic attainment. Using a
multilevel model, the relationship between discrepancies and academic outcomes was evaluated
to find if these relationships varied between schools and if they were moderated by a school’s
level of poverty. Findings indicated that for both actual and perceived discrepancy, the impact of
these variables on both test scores and a student’ expectation of future academic attainment
varied between schools. However, only the relationship between actual discrepancies and the
outcome variables (test scores and future expectations) were significantly moderated by school
poverty. These finding suggest that between actual and perceived discrepancies in expectations,
actual expectations, have the greatest impact on student outcomes.
While this section discussed findings related to the research questions and hypotheses,
many interesting findings appeared in the overall analysis. The findings related to main effects
Table 7
Summary of All Hierarchical Linear Models
Total (ACT) Total (PER) Future (ACT) Future (PER) scores scores expectations expectations Fixed Effects Intercept 148.353*** 149.55*** 2.956*** 2.98*** Discrepancies in exp. 11.134*** 4.894*** .271*** .131*** Student expectations 20.263*** 16.907*** .61*** .523*** School poverty -10.811*** -12.326*** -.088** -.124*** Gender -3.815*** -4.086*** .076** .064*** Minority -12.753*** -12.011*** .051*** .072***
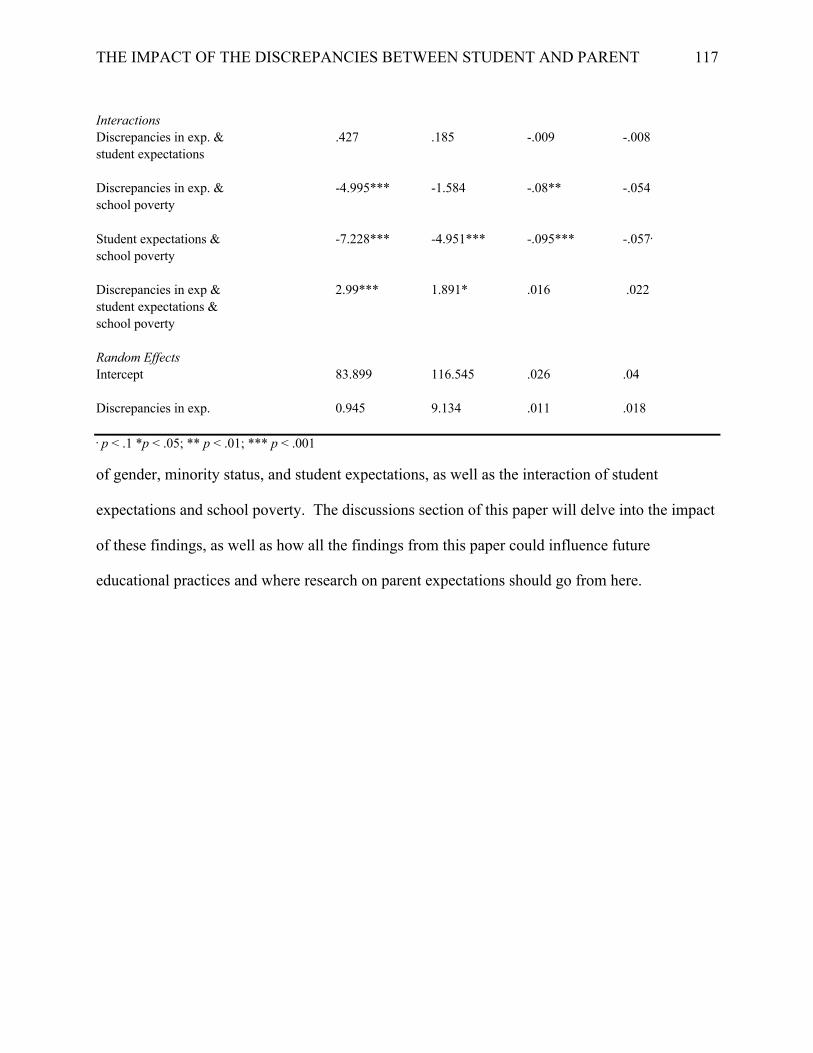
THE IMPACT OF THE DISCREPANCIES BETWEEN STUDENT AND PARENT 117
Interactions Discrepancies in exp. & .427 .185 -.009 -.008 student expectations Discrepancies in exp. & -4.995*** -1.584 -.08** -.054 school poverty Student expectations & -7.228*** -4.951*** -.095*** -.057. school poverty Discrepancies in exp & 2.99*** 1.891* .016 .022 student expectations & school poverty Random Effects Intercept 83.899 116.545 .026 .04 Discrepancies in exp. 0.945 9.134 .011 .018 . p < .1 *p < .05; ** p < .01; *** p < .001
of gender, minority status, and student expectations, as well as the interaction of student
expectations and school poverty. The discussions section of this paper will delve into the impact
of these findings, as well as how all the findings from this paper could influence future
educational practices and where research on parent expectations should go from here.
THE IMPACT OF THE DISCREPANCIES BETWEEN STUDENT AND PARENT 118
Chapter 5: Discussion
The intent of my research was to investigate whether discrepancies in parent expectations
(actual and perceived) and student expectations had an impact on student academic outcomes,
whether these relationships were impacted by a school’s level of poverty, and whether the impact
of discrepancies in expectations differed between schools. Grounded in the theory of ecological
systems (Bronfenbrenner 1979, 1986, 1992, 2005) the intent was to scrutinize how different
levels of a child’s ecosystem intertwined to impact future academic outcomes. Fan and Chen
(2001) found that parent expectations, of all forms of parent involvement, had the greatest impact
on academic outcomes of students. It is for this reason and my observation that expectations of
both parent and student develop across many levels of the ecological system that expectations
were primary to this research in predicting academic outcomes. Expanding upon the work of
Wang and Benner (2014) and McNeal (2014), I specifically examined whether the discrepancies
in expectations between students and parents impacted test scores and a student’s future
expectation of academic achievement.
Review of Research Questions and Hypotheses
Fan and Chen (2001) found that parent expectations are the type of parent involvement
that have the greatest impact on children’s academic outcomes. With their study as a catalyst of
my research and Bronfenbrenner’s theory of ecological systems as the conceptual foundation,
this study sought to build upon the work of Wang and Benner (2014) by investigating the impact
of discrepancies – both real and perceived – in expectations between parents and students.
Employing a multilevel model, like that examined by McNeal (2014), I sought to assess whether
the impact of parent expectations, and specifically the discrepancies between parent and student
expectations, varied between schools and whether this relationship was moderated by school

THE IMPACT OF THE DISCREPANCIES BETWEEN STUDENT AND PARENT 119
level poverty. This section reviews the questions I posed, the hypotheses that I suggested, and
the findings that were revealed by the analyses.
Research Question 1 is whether student expectations predict academic outcomes such as
results on standardized tests and future expectations of academic attainment? Within all four
models evaluated student expectations had a significant positive relationship with academic
outcomes – total test scores and future expectations (p < .001; see Table 7). In fact, of all
predictor variables, student expectations had the strongest relationship with the outcome
variables. These findings confirm my hypothesis that student expectations did in fact have a
significant positive relationship with test scores and future expectations.
Research Questions 2 and 3 examined if there was a relationship between discrepancies
in expectations – actual and perceived – and standardized test scores. These questions were
originally posed by Wang and Benner (2004) and included in my study. My hypotheses, drawn
from their findings, were that actual discrepancies would have a positive relationship with test
scores and perceived discrepancies would have a negative relationship with test scores. The
analysis I ran confirmed the first hypothesis regarding actual discrepancies having a positive
relationship with test scores (p < .001). However, opposite of Wang and Benner’s findings,
perceived discrepancies had a significant negative relationship with test scores, failing to confirm
my hypothesis (p < .001). Wang and Benner, though, only combined Math and Reading scores,
whereas I used history, math, reading, and science in my study. Additionally, Wang and Benner
used scores from Grade 8 tests, while the tests used in my study were taken in Grade 12. The
difference timing of the tests, as well as the specific subjects included, could explain the
difference between the two studies. Meaning, a more holistic view of a student’s academic
performance (all four tests) could have changed the direction of the impact of perceived

THE IMPACT OF THE DISCREPANCIES BETWEEN STUDENT AND PARENT 120
expectations on student performance. The impact of perceived expectations on test scores could
also have strengthened over time from Grade 8 to Grade 12.
Research Question 4 examined whether the relationship between discrepancies in actual
expectations and a student’s score on standardized tests moderated by a school’s poverty level.
My hypothesis for this question was that school poverty would moderate the relationship
between actual discrepancies in expectations and standardized test scores. Supporting my
hypothesis, findings indicated that for students that attended an impoverished school, actual
discrepancies in expectations significantly predicted test scores (p < .001; see Table 7). For
students in non-impoverished schools, actual discrepancies were not related to test scores.
My fifth question related to the relationship between a student’s performance on
standardized test scores and the perceived discrepancies in expectations. The question posed, is
the relationship between perceived discrepancies in expectations and student performance on
standardized tests moderated by a school’s poverty level? My hypothesis for this question was
that the relationship between perceived discrepancies and standardized test scores would be
moderated by whether or not a school was considered impoverished.
Findings indicated that school poverty had no interaction effect with perceived
discrepancies. This finding fails to support my hypothesis, indicating that there is no significant
impact of the interaction of school poverty and perceived expectations on a student’s
performance on standardized tests.
My sixth Research Question investigated was whether the relationship between actual
discrepancies in expectations and a student’s future expectations of academic attainment was
moderated by a school’s poverty level? Like the first question investigating actual discrepancies
and test scores, my prediction was that actual discrepancies and a student’s expectation of future
academic attainment would be moderated by poverty.

THE IMPACT OF THE DISCREPANCIES BETWEEN STUDENT AND PARENT 121
The interaction of school poverty and actual discrepancies was found to be significant,
confirming my hypothesis (p < .01). For a student who attended a school considered to be
impoverished, actual discrepancies had a significant relationship with the student’s future
expectations. For students in a non-impoverished school, actual discrepancies were not related
to future expectations.
The final question investigated within this study was, does the relationship between
perceived discrepancies in expectations of academic attainment and student’s long-term
expectations of academic attainment vary by school and is this relationship moderated by a
school’s poverty level? Like the second question investigating perceived discrepancies and test
scores, my prediction was that relationship between perceived discrepancies and a student’s
expectation of future academic attainment would be moderated by poverty and the relationship
of perceived discrepancies and academic outcomes would vary between schools.
My hypothesis was not supported, as the analyses revealed no significant interaction
between school poverty and perceived discrepancies with respect to expectations of academic
achievement. However, variability between schools in the of the impact of perceived
discrepancies on future expectations was found. In this analysis the random effects model, when
compared to a fixed effects model, was a significantly better fit (p < .001). This finding
indicated that the impact of perceived discrepancies on a student’s future expectations of
academic attainment varied between schools.
To answer Research Question 8, with regards to the impact of actual discrepancies on test
scores varying between schools, it was my hypothesis that the impact of actual discrepancies in
expectations on standardized test scores would vary by schools. This hypothesis was supported
by running an ANOVA comparing a fixed effects model to a random effects model. The
findings indicated that the random effects model was the better fit, indicating significant variance

THE IMPACT OF THE DISCREPANCIES BETWEEN STUDENT AND PARENT 122
between schools on the impact of actual discrepancies on test scores (p < .001; see Table 7).
Findings for the random effect of actual discrepancies on future expectations were also found to
be significant (p < .001). This indicated that the impact of the actual discrepancies between
students and parents on future expectations varied between schools. Continuing to investigate
Research Question 8, the impact of perceived discrepancies on test scores varied across schools.
In this analysis the random effects model, when compared to a fixed effects model, was a
significantly better fit (p < .001). This finding indicated that the impact of perceived
discrepancies on a student’s performance on standardized tests varied between schools.
Implications of the Findings
The discovery of academic benefits when parents' actual expectations exceed their
students' expectations, controlling for all other variables, agrees with Fan and Chen’s (2001)
finding that parent expectations positively impact student outcomes. It suggests that a student is
driven by the reality of her parents’ expectations and the parent’s involvement that results. For
example, if a parent has high expectations for her student the parent is more likely to be involved
in the academic life of the child. This involvement can take the form of participating in school
events, having one-on-one discussions about academic expectations with her child, checking in
with teachers to see how the student is progressing, and investigating future educational
opportunities for her child. These activities could serve as the catalyst to a student’s own
expectations of academic attainment and a student’s improved performance at school. On the
contrary, if the student holds a higher expectation, particularly with the parent having a relatively
low expectation, many of the activities performed by a parent with high expectations would be
missing. These omissions could withhold the much-needed incentive and motivation a student
needs to gain the confidence to perform well in school.

THE IMPACT OF THE DISCREPANCIES BETWEEN STUDENT AND PARENT 123
The finding is important for educators and policy makers as they continue to find ways to
level the playing field of education along all socio-economic levels. Parent expectations are
malleable. These expectations can be lifted through programs that promote academic success
such as PTO family nights, high school prep classes, and college and trade awareness classes.
One such program is Readers 2 Leaders in West Dallas. This program not only works with at-
risk students on developing reading skills, but also offers classes and workshops for parents to
understand why reading is important and the importance education has on the future successes of
a parent’s children.
Parents possessing high expectations is impactful, as this study has shown, but parent
expectations and a how a student perceives her parent’s expectations to be are not always
identical, indicating that not all students have an accurate view of the expectations their parents
have for them. In this study only 43% (n = 8727) of participants had the same perceived
expectation as her parent’s actual expectation. Of those students who did not have the same
perceived expectation as her parent’s expectations 18% (n = 4063) perceived her parents’
expectations to be lower than her parent’s actual expectations and 37% (n = 7370) perceived her
parents’ expectations to be higher than her parent’s actual expectations. For this reason, it is
important to note that this study also found that the strength of actual expectations has a stronger
relationship to the outcomes studied than do perceived discrepancies. This finding indicates that
regardless of what a student perceives her parent’s expectations to be, ultimately actual
expectations have a stronger impact on the student’s academic performance.
The finding that student expectations had a significant impact on academic outcomes, and
one that was much stronger than that of discrepancies in expectations, was noteworthy. Too
often educators rely on parents who may be working two or three jobs, have not progressed
beyond high school, or are just not present in her child’s life to be the catalyst for a student’s
THE IMPACT OF THE DISCREPANCIES BETWEEN STUDENT AND PARENT 124
academic performance. The finding that a student’s own expectations have a significant impact
on a student’s performance in school indicates that if school programs at impoverished schools
could help to strength a student’s own confidence within the classroom, student expectations
would rise, and academic performance would improve
On the contrary, it could be theorized that within low-income schools, where parents may
not have experienced college, the expectations from home may be quite different than those of
parents of children attending a high-income school. The culture expectations of the school
would be expected to follow. Even those low-income schools that supply college programs,
provide them in such a way to promote attendance and awareness – very different from high-
income schools. A program that goes beyond this cultural expectation is Education Opens Doors
in Dallas, Texas. The program provides awareness of the college process to middle school
students, their teachers, and their parents, effectively raising the expectation of academic
attainment of students within all three groups. The findings in this study that student
expectations have the strongest practical significance of all variables illuminates the impact that
EOD and other programs could have on student outcomes by continuing to raise student
expectations. Additionally, by also reaching out to parents, and in theory raising the
expectations of parents, the impact of these programs could have significantly positive outcomes.
The school level variable of poverty being a significant negative moderator of test scores
and student expectations should be no surprise, but important, nonetheless. Students who attend
school that are considered to be low-income or impoverished normally see less resources than
those schools in higher-income districts. Even when school funding is equal, a rare occurrence,
funds at impoverished schools are usually allocated to help a large number of students who are
below acceptable levels in reading and other subjects, leaving little for programs such as those
promoting high school and college. In the higher-income schools these monies are dis-

THE IMPACT OF THE DISCREPANCIES BETWEEN STUDENT AND PARENT 125
proportionately allocated to extra-curricular programs promoting academic attainment instead of
reaching acceptable testing levels. Not only are monies allocated and spent differently between
low- and high-income schools, as mentioned previously the cultures of expectations are vastly
different. The two phenomena working together could dramatically reduce a low-income
student’s self-efficacy compared to a similar student attending a high-income school.
While parents’ having higher actual expectations than their child was found to have
positive effects, the interaction of expectations and poverty had a negative impact on test scores
and future expectations, suppressing these effects. In other words, if a student is attending an
impoverished school, as discrepancies increase (with the parent having the higher expectation),
test scores and future expectations would be expected to decrease. This finding indicates that
higher (actual) parent expectations without proper support from the school, as noted earlier,
could place undue pressure on students to perform at a lower level than students who attend non-
impoverished schools that would be expected to have the necessary support structures in place.
Additionally, a student’s awareness of what may be available to them can be limited by cultural
expectations. For example, within a high-income school system, not only are parents’
expectations of academic attainment expected to be higher based on a parent’s own educational
experience, but the culture of the school system will also reflect this additional expectation. The
focus of these school systems is to assist students in attending the best possible college, with
programs specifically designed to increase a student’s chance at scholarships and acceptance.
The effect for the student at the impoverished school is a parent with high expectations, but no
resources or expectations of attainment are present at school, suppressing the positive effect of
parent expectations.
Finally, the discovery that the impact of discrepancies in expectations – actual and
perceived – varies between schools is not only significant but expands upon the work of Wang

THE IMPACT OF THE DISCREPANCIES BETWEEN STUDENT AND PARENT 126
and Benner (2014). By examining a multilevel model, unlike Wang and Benner, I found that not
only are discrepancies significant, but the impact of these discrepancies in expectations differs
between schools. This signifies that there are relevant school variables which have a significant
impact on expectations and the impact expectations have on student outcomes. These
differences could be after-school programs, teachers, school policies, PTO organizations, or
access to sports. Additionally, the impact could be related to a school’s culture of expectations,
as mentioned previously. Teachers and administrators in low-income schools may have a
perception of lack of motivation by parents and students, because the teacher’s idea of activities
related to parent involvement may be related to her middle- to upper-class upbringing.
Compounding the effect of low expectations from teachers is the culture of teaching to the
lowest denominator. This is where schools in low-income areas are serving students well below
grade level on reading and other subjects and schools focus resources on those students due to
state mandated goals on standardized testing. The goal of the school becomes to promote success
on standardized testing, not college awareness.
Limitations
As there are in any study, my research had its limitations. While the findings of this
study are strong and there are many useful applications of these findings, there are areas that
could be strengthened to either approach the “best practices” of research or make the application
of the findings relevant to a wider range of students. The age of the data, participants limited to
only Grade 8, and the lack of weighting of the test scores when combing history, math, reading
and science were the main limitations of the study. The remainder of this section will discuss
these limitations.
The first limitation of my study was the use of the NELS:88 data set which at the time of
completion of this study was over 30 years old. While possibly a concern, the age of the data

THE IMPACT OF THE DISCREPANCIES BETWEEN STUDENT AND PARENT 127
does not change the fact that the original NELS:88 data set provided a large sample of students
across the nation. Recent studies such as those of Wang and Benner (2014) and McNeal (2014)
employed the NELS:88 data set and had significant findings with regards to the impact of parent
involvement on student outcomes. Furthermore, over the last ten years, research focused on
parent expectations continue to show that the relationship between parent expectations and
academic outcomes remains positive (Jacobs & Harvey, 2005; Seyfried & Chung, 2002; Benner
& Mistry, 2007; Zhang, Haddad, Torres, & Chen, 2011; Froiland, Peterson, & Davidson, 2012).
Additionally, the availability of student, parent, and school level data allowed for an ecological
view of the impact of expectations on academic outcomes. Given the nature of this study to
investigate the impact of parent expectations, and differences in student and parent expectations,
the NELS:88 data set provides the richest set of participants, therefore making the data set
relevant.
Employing only students in Grade 8 could be perceived as limiting the application of
results from this study. A perfect sample, it could be conceived, would allow researchers to look
at the impact of expectations on various student outcomes across all ages ranging from pre-K
through high school. While data from the NELS:88 sample did not afford the desirable range of
participants, the findings uncovered through this study should be encouraging rather than viewed
as limited in application. Showing that at late as Grade 8 parent expectations still have an impact
on a student’s academic outcomes could be seen as a positive. It should be considered
encouraging that identifying that parent expectations have an impact on student outcomes of
eight graders as these findings could suggest that the earlier the expectations are communicated
the greater the impact (Jeynes; 2003, 2005; Froiland, Peterson, & Davidson, 2012; Jacobs &
Harvey, 2005).

THE IMPACT OF THE DISCREPANCIES BETWEEN STUDENT AND PARENT 128
Combining the test scores was done within my research to understand the impact
discrepancies in expectations had on the overall performance of students, and if there was a
difference of that effect between students in impoverished and non-impoverished schools. One
could argue that weighting of the individual tests would have been a best practice, given that the
tests were on slightly different scales. The weighting of each individual test equally would have
given equal consideration to a students’ ability in history, math, reading and science. By not
doing so, different subject areas might have had a different extent of influence on overall
achievement score. For example, a student who scores higher in math than in the other three
subjects might have the same overall achievement scores as a student who obtains the same
scores across all subjects. This leads one to believe that both students performed the same.
While it cannot be argued that the “best practices” of research would have been achieved if each
individual subject test was weighted, the findings of this research can still be considered valid.
First, the scales of the scores were not that different (history 0 to 47, math 0 to 81, reading 0 to
54, and science 0 to 38) as to diminish completely a student’s strength in one area or weakness in
another. If scales were significantly different, results could be impacted or misinterpreted if a
student was very strong in one area in weak in another. Because the scales were not extremely
different, this concern is minimized, but not fully alleviated. An important fact, however, is that
this research was aimed at investigating the impact of parent expectations on the overall
performance of students, not individual subjects. While the overall test score could be skewed
based on individual tests not being weighted, the findings are still valid as an overall
measurement of student success.
Extending the Research
While the findings within this study are significant and important to expanding our
knowledge on the impact of parent expectations, it is also important to note that this research had
THE IMPACT OF THE DISCREPANCIES BETWEEN STUDENT AND PARENT 129
opened the door to furthering our understanding of how the impact of parent expectations varies
in areas such as, among schools, socio-economic statuses, and age of students. The findings in
this research should encourage deeper research into uncovering the key variables that might lead
to variation in the impact of parent expectations on academic outcomes between schools. In
order to investigate the between school variance, future research could examine a multilevel
model that investigates discrepancies in expectations in the presence of teacher level variables
such as teacher experience, teachers’ level of education, number of classes a teacher is expected
to teach, and number of students in each class. Additional school level variables that could be
examined could be PTO programs offered and participation, stability of school administration,
number of extra-curricular programs offered, or average tenure of the professional staff.
A limitation of this study previously discussed was the focus of this study on middle-
school students, specifically grade 8. This focus was due in large part, to the fact that the
NELS:88 data set only included students who started the study while in eighth grade. While the
findings are still significant, future research could examine a similar model used with students of
varying ages in the sample. If could be hypothesized that the early expectations are set for
students, say kindergarten, the more impactful the influence of the expectations on academic
attainment. It could also be argued that the effect of expectations could wear off, a sort of
fatigue, if a student is pressed to early in her academic career. It is for this reason future studies
should examine the impact of discrepancies in expectations on students in kindergarten or at
primary school.
Finally, an area in which this research could be expanded is through a deeper
understanding of a student’s socio-economic status (SES) and the impact SES has on the
relationship between discrepancies in expectations and academic outcomes. My study
investigated the impact of poverty on the aforementioned relationship, but poverty was a school

THE IMPACT OF THE DISCREPANCIES BETWEEN STUDENT AND PARENT 130
level variable. Variables such as parents’ level of education, parent employment, and household
income could be employed as proxies of a student’s SES within a multilevel model.
Summary
My research sought to uncover the impact of parent expectations on a student’s academic
attainment – specifically discrepancies between parent and student expectations. Through the
employment of a multilevel model my research discovered that discrepancies in expectations
positively impacted test scores and a student’s expectations of academic achievement when a
parent’s expectations were higher than that of the student. Also discovered was that the school
level variable of poverty negatively moderated the impact of discrepancies on academic
outcomes. As research continues on how parent expectations impact a student’s success in
school, it is my hope that findings from this study will inform future educational policy and
programs.

THE IMPACT OF THE DISCREPANCIES BETWEEN STUDENT AND PARENT 131
References
Agliata, A. K., & Renk, K. (2008). College students’ adjustment: The role of parent–college
student expectation discrepancies and communication reciprocity. Journal of Youth and
Adolescence, 37(8), 967. doi: 10.1007/s10964-007-9200-8
Barnard, W. M. (2004). Parent involvement in elementary school and educational attainment.
Children and Youth Services Review, 26(1), 39-62. doi:10.1016/j.childyouth.2003.11.002
Benner, A. D., & Mistry, R. S. (2007). Congruence of mother and teacher educational
expectations and low-income youth's academic competence. Journal of Educational
Psychology, 99(1), 140-153. http://psycnet.apa.org/doi/10.1037/0022-0663.99.1.140
Bronfenbrenner, U. (1979). The ecology of human development: Experiments by nature and
design. Cambridge, MA: Harvard University Press.
http://dx.doi.org/10.1525/aa.1981.83.3.02a00220
Bronfenbrenner, U. (1986). Ecology of the family as a context for human development: Research
perspectives. Developmental Psychology, 22(6), 723. http://psycnet.apa.org /doi/10.1037
/0012-1649.22.6.723
Bronfenbrenner, U. (1992). Ecological systems theory. London, England: Jessica Kingsley
Publisher. http://dx.doi.org/10.1037/10518-046
Bronfenbrenner, U. (Ed.). (2005). Making human beings human: Bioecological perspectives on
human development. London, England: Sage.
Brown, J. D., & Madhere, S. (1996, April). Post-secondary achievement: How prepared are our
children? Paper presented at the National Black Family Summit, Hilton Head, SC.
Carpenter II, D. M. (2008). Expectations, aspirations, and achievement among Latino students of
immigrant families. Marriage & Family Review, 43(1-2), 164-185.
http://dx.doi.org/10.1080/01494920802013078

THE IMPACT OF THE DISCREPANCIES BETWEEN STUDENT AND PARENT 132
Carreón, G. P., Drake, C., & Barton, A. C. (2005). The importance of presence: Immigrant
parents’ school engagement experiences. American Educational Research Journal, 42(3),
465-498. http://dx.doi.org/10.3102/00028312042003465
Cohen, J. (1988). Statistical power analysis for the behavioral sciences. Hillsdale, NJ: Lawrence
Erlbaum Associates Publishing. http://dx.doi.org/10.4324/9780203771587
Cohen, J. (1992). A power primer. Psychological Bulletin, 112(1), 155-159.
http://dx.doi.org/10.1037//0033-2909.112.1.155
Cotton, K., & Wikelund, K. R. (1989). Parent involvement in education. School Improvement
Research Series, 6, 2-18.
Davis-Kean, P. E. (2005). The influence of parent education and family income on child
achievement: The indirect role of parental expectations and the home environment.
Journal of Family Psychology, 19(2), 294-304. doi: 10.1037/0893-3200.19.2.294
Desimone, L. (1999). Linking parent involvement with student achievement: Do race and
income matter? Journal of Educational Research, 93(1), 11-30.
Diagram of Bronfenbrenner’s environmental systems. (n.d). Retrieved March 15, 2015, from
http://digilence.org/functors-bronfenbrenners-ecological-theorysecret-life-of-bees/
Eagle, E. (1989, March). Socioeconomic status, family structure, and parental involvement: The
correlates of achievement. Paper presented at the annual meeting of the American
Educational Research Association, San Francisco, CA.
Eccles, J. S., & Davis-Kean, P. E. (2005). Influences of parents’ education on their children’s
educational attainments: The role of parent and child perceptions. London Review of
Education, 3(3), 191-204.
Eccles, J., & Harold, R. (1993). Parent-school involvement during the early adolescent years.
The Teachers College Record, 94(3), 568-587.
THE IMPACT OF THE DISCREPANCIES BETWEEN STUDENT AND PARENT 133
Eccles, J. S., Jacobs, J. E., & Harold, R. D. (1990). Gender role stereotypes, expectancy effects,
and parents' socialization of gender differences. Journal of Social Issues, 46(2), 183-201.
Englund, M. M., Luckner, A. E., Whaley, G. J., & Egeland, B. (2004). Children's achievement in
early elementary school: Longitudinal effects of parental involvement, expectations, and
quality of assistance. Journal of Educational Psychology, 96(4), 723-730.
Entwisle, D. R., & Baker, D. P. (1983). Gender and young children's expectations for
performance in arithmetic. Developmental Psychology, 19(2), 200-209.
Entwisle, D. R., & Hayduk, L. A. (1981). Academic expectations and the school attainment of
young children. Sociology of Education, 54(1), 34-50.
Epstein, J. L. (1988a). How do we improve programs for parent involvement? Educational
Horizons, 66(2), 58-59.
Epstein, J.L. (1988b). Parent involvement. Baltimore: Johns Hopkins University Center for
Research on Elementary and Middle Schools.
Fan, X., & Chen, M. (2001). Parental involvement and students' academic achievement: A meta-
analysis. Educational Psychology Review, 13(1), 1-22.
Fehrmann, P. G., Keith, T. Z., & Reimers, T. M. (1987). Home influence on school learning:
Direct and indirect effects of parental involvement on high school grades. Journal of
Educational Research, 80(6), 330-337.
Froiland, J. M., Peterson, A., & Davison, M. L. (2012). The long-term effects of early parent
involvement and parent expectation in the USA. School Psychology International, 34(1),
33-50.
Griffith, J. (1996). Relation of parental involvement, empowerment, and school traits to student
academic performance. The Journal of Educational Research, 90(1), 33-41.
THE IMPACT OF THE DISCREPANCIES BETWEEN STUDENT AND PARENT 134
Griffith, J. (1997). Linkages of school structural and socio-environmental characteristics to
parental satisfaction with public education and student academic achievement. Journal of
Applied Social Psychology, 27(2), 156-186.
Griffith, J. (1998). The relation of school structure and social environment to parent involvement
in elementary schools. The Elementary School Journal, 99(1), 53-80.
Grolnick, W. S., & Slowiaczek, M. L. (1994). Parents' involvement in children's schooling: A
multidimensional conceptualization and motivational model. Child Development, 65(1),
237-252.
Hamilton-Wentworth District School Board. (n.d.). Epstein’s six types of parental involvement.
Retrieved March 18, 2015, from http://www.hwdsb.on.ca/dundana/school-council/.
Hao, L., & Bonstead-Bruns, M. (1998). Parent-child differences in educational expectations and
the academic achievement of immigrant and native students. Sociology of Education,
71(2), 175-198.
Hedges, L. V. (1981). Distribution theory for Glass's estimator of effect size and related
estimators. Journal of Educational and Behavioral Statistics, 6(2), 107-128.
Hedges, L. V. (2008). What are effect sizes and why do we need them? Child Development
Perspectives, 2(3), 167-171.
Hess, R. D., Holloway, S. D., Dickson, W. P., & Price, G. G. (1984). Maternal variables as
predictors of children's school readiness and later achievement in vocabulary and
mathematics in sixth grade. Child Development, 55(5), 1902-1912.
Hill, N. E., & Tyson, D. F. (2009). Parental involvement in middle school: A meta-analytic
assessment of the strategies that promote achievement. Developmental Psychology, 45(3),
740-763.

THE IMPACT OF THE DISCREPANCIES BETWEEN STUDENT AND PARENT 135
Hoover-Dempsey, K. V., Bassler, O. C., & Brissie, J. S. (1987). Parent involvement:
Contributions of teacher efficacy, school socioeconomic status, and other school
characteristics. American Educational Research Journal, 24(3), 417-435.
Hoover-Dempsey, K.V., & Sandler, H.M. (1995). Parental involvement in children's education:
Why does it make a difference? Teachers College Record, 97, 310-331.
Hoover-Dempsey, K.V., & Sandler, H.M. (1997). Why do parents become involved in their
children's education? Review of Educational Research, 67, 3-42.
Ingels, S. J., Scott, L. A., Taylor, J. R., Owings, J., & Quinn, P. (1998). National education
longitudinal study of 1988 (NELS:88) base-year through second follow-up: Final
methodology report. Washington, DC: National Center for Education Statistics.
Jacobs, N., & Harvey, D. (2005). Do parents make a difference to children’s academic
achievement? Differences between parents of higher and lower achieving students.
Educational Studies, 31(4), 431-448.
Jeynes, W. H. (2003). A meta-analysis of the effects of parental involvement on minority
children’s academic achievement. Education and Urban Society, 35(2), 202-218.
Jeynes, W. H. (2005). A meta-analysis of the relation of parental involvement to urban
elementary school student academic achievement. Urban Education, 40(3), 237-269.
Jeynes, W. H. (2007). The relationship between parental involvement and urban secondary
school student academic achievement: A meta-analysis. Urban Education, 42(1), 82-110.
Keith, P. B., & Lichtman, M. V. (1994). Does parental involvement influence the academic
achievement of Mexican-American eighth graders? Results from the National Education
Longitudinal Study. School Psychology Quarterly, 9(4), 256-273.

THE IMPACT OF THE DISCREPANCIES BETWEEN STUDENT AND PARENT 136
Keith, T. Z., Keith, P. B., Troutman, G. C., & Bickley, P. G. (1993). Does parental involvement
affect eighth-grade student achievement? Structural analysis of national data. School
Psychology Review, 22(3), 474-495.
Keith, T. Z., Reimers, T. M., Fehrmann, P. G., Pottebaum, S. M., & Aubey, L. W. (1986).
Parental involvement, homework, and TV time: Direct and indirect effects on high school
achievement. Journal of Educational Psychology, 78(5), 373-380.
Lopez, G. R., Scribner, J. D., & Mahitivanichcha, K. (2001). Redefining parental involvement:
Lessons from high-performing migrant-impacted schools. American Educational
Research Journal, 38(2), 253-288.
Marcon, R. A. (1993a, March). At-risk preschoolers: Early predictors of future grade retention.
Paper presented at the annual meeting of the Southeastern Psychological Association,
Atlanta, GA.
Marcon, R. A. (1993b, March). Parental involvement and early school success: Following the
“Class of 2000” at year five. Paper presented at the biennial meeting of the Society for
Research in Child Development, New Orleans, LA.
Mattingly, D. J., Prislin, R., McKenzie, T. L., Rodriguez, J. L., & Kayzar, B. (2002). Evaluating
evaluations: The case of parent involvement programs. Review of Educational Research,
72(4), 549-576.
McNeal, R. B., Jr. (1999). Parental involvement as social capital: Differential effectiveness on
science achievement, truancy, and dropping out. Social Forces, 78(1), 117-144.
McNeal, R. B., Jr. (2014). Parent involvement and student performance: The influence of school
context. Educational Research for Policy and Practice, 1-15.
No Child Left Behind Act of 2001: Parent involvement, Part A, Subpart 1, U.S.C. § 1118 (2002).

THE IMPACT OF THE DISCREPANCIES BETWEEN STUDENT AND PARENT 137
Paulson, S. E. (1994a). Parenting style and parental involvement: Relations with adolescent
achievement. Mid-Western Educational Researcher, 7(1), 6-11.
Paulson, S. E. (1994b). Relations of parenting style and parental involvement with ninth-grade
students' achievement. The Journal of Early Adolescence, 14(2), 250-267.
Peng, S. S., & Wright, D. (1994). Explanation of academic achievement of Asian American
students. The Journal of Educational Research, 87(6), 346-352.
Perreira, K. M., Chapman, M. V., & Stein, G. L. (2006). Becoming an American parent
overcoming challenges and finding strength in a new immigrant Latino community.
Journal of Family Issues, 27(10), 1383-1414.
Phillipson, S., & Phillipson, S. N. (2007). Academic expectations, belief of ability, and
involvement by parents as predictors of child achievement: A cross-cultural comparison.
Educational Psychology, 27(3), 329-348.
Ramirez, A. F. (2003). Dismay and disappointment: Parental involvement of Latino immigrant
parents. The Urban Review, 35(2), 93-110.
Reynolds, A. J. (1992). Comparing measures of parental involvement and their effects on
academic achievement. Early Childhood Research Quarterly, 7(3), 441-462.
Rothman, K. J., Greenland, S., & Lash, T. L. (Eds.). (2008). Modern epidemiology. Philadelphia,
PA: Lippincott Williams & Wilkins.
Seyfried, S. F., & Chung, I. J. (2002). Parent involvement as parental monitoring of student
motivation and parent expectations predicting later achievement among African
American and European American middle school age students. Journal of Ethnic and
Cultural Diversity in Social Work, 11(1-2), 109-131.
Smith, J., Stern, K., & Shatrova, Z. (2008). Factors inhibiting Hispanic parents' school
involvement. Rural Educator, 29(2), 8-13.

THE IMPACT OF THE DISCREPANCIES BETWEEN STUDENT AND PARENT 138
Souto-Manning, M., & Swick, K. J. (2006). Teachers’ beliefs about parent and family
involvement: Rethinking our family involvement paradigm. Early Childhood Education
Journal, 34(2), 187-193.
Springer, K. (2009). Educational research: A contextual approach. Hoboken, NJ: John Wiley
and Sons.
Steinberg, L., Lamborn, S. D., Dornbusch, S. M., & Darling, N. (1992). Impact of parenting
practices on adolescent achievement: Authoritative parenting, school involvement, and
encouragement to succeed. Child Development, 63(5), 1266-1281.
Stevenson, D. L., & Baker, D. P. (1987). The family-school relation and the child's school
performance. Child Development, 58(5), 1348-1357.
Sui-Chu, E. H., & Willms, J. D. (1996). Effects of parental involvement on eighth-grade
achievement. Sociology of Education, 69(2), 126-141.
Taylor, R. D. (1996). Adolescents' perceptions of kinship support and family management
practices: Association with adolescent adjustment in African American families.
Developmental Psychology, 32(4), 687-695.
Taylor, L. C., Hinton, I. D., & Wilson, M. N. (1995). Parental influences on academic
performance in African-American students. Journal of Child and Family Studies, 4(3),
293-302.
Uguroglu, M. E., & Walberg, H. J. (1986). Predicting achievement and motivation. Journal of
Research & Development in Education, 19(3), 1-12.
Wang, Y., & Benner, A. D. (2014). Parent-Child Discrepancies in Educational Expectations:
Differential Effects of Actual versus Perceived Discrepancies. Child Development, 85(3),
891-900. doi: 10.1111/cdev.12171

THE IMPACT OF THE DISCREPANCIES BETWEEN STUDENT AND PARENT 139
West, J., Denton, K., & Germino-Hausken, E. (2000). America's kindergartners: Findings from
the early childhood longitudinal study, kindergarten class of 1998-99, Fall 1998.
Wood, D., Kaplan, R., & McLoyd, V. C. (2007). Gender differences in the educational
expectations of urban, low-income African American youth: The role of parents and the
school. Journal of Youth and Adolescence, 36(4), 417-427.
Yan, W., & Lin, Q. (2005). Parent involvement and mathematics achievement: Contrast across
racial and ethnic groups. The Journal of Educational Research, 99(2), 116-127.
Yap, K. O., & Enoki, D. Y. (1994, March). In search of the elusive magic bullet: Parent
involvement and student outcomes. Paper presented at the annual meeting of the
American Educational Research Association, New Orleans, LA.
Zhang, Y., Haddad, E., Torres, B., & Chen, C. (2011). The reciprocal relationships among
parents’ expectations, adolescents’ expectations, and adolescents’ achievement: A two-
wave longitudinal analysis of the NELS data. Journal of Youth and Adolescence, 40(4),
479-489.

THE IMPACT OF THE DISCREPANCIES BETWEEN STUDENT AND PARENT 140
Appendix A
IRB Exempt Status Determination Application

THE IMPACT OF THE DISCREPANCIES BETWEEN STUDENT AND PARENT 141

THE IMPACT OF THE DISCREPANCIES BETWEEN STUDENT AND PARENT 142
Appendix B
IRB Review Acceptance Letter
Office of Research and Graduate Studies
From: IRB Committee
To: Thomas Suhy
Date: January 4, 2019
Re: IRB New submission; Protocol #H19-003-SUHT - An Ecological Approach: The Impact of Parent
Expectations on Student Achievement
Dear Mr. Suhy,
Thank you for your submission to research compliance, your attachments will be reviewed. You can next expect to
receive a modifications letter with requested modifications (if warranted). Once the modifications, comments to
modifications and/or documents are provided, they will be reviewed by the IRB chair and an outcome letter will be
provided.
Your study has been assigned the unique ID of H19-003-SUHT. Please use this ID in the subject line of all future
correspondence.
Please note: Investigators and key personnel identified in the protocol must complete all required and elective
modules within the CITI “Social & Behavioral Research” course with an exam score of 80% or more. NIH training
certificates are acceptable as well. We cannot approve your study until all key research personnel have updated
training on file. See our instructional video for assistance with CITI registration.
Should you have any questions, please contact the Office of Research and Graduate
Studies at 214-768-2033 or at [email protected].
Thank You,
IRB Committee Administration
Office of Research and Graduate Studies Southern Methodist University PO Box 750302 Dallas TX 75275-0240 Office: 214-768-2033 Fax: 214-768-1079

THE IMPACT OF THE DISCREPANCIES BETWEEN STUDENT AND PARENT 143
Appendix C
Principal Investigator’s Assurance

THE IMPACT OF THE DISCREPANCIES BETWEEN STUDENT AND PARENT 144
Appendix D
Proof of CITI Course Completion

THE IMPACT OF THE DISCREPANCIES BETWEEN STUDENT AND PARENT 145
Appendix E
IRB Approval Letter
From: IRB Committee
To: Thomas Suhy
Date: January 8, 2019
Re: IRB New Exemption submission Approval; Protocol #H19-003-SUHT – An Ecological Approach:
The Impact of Parent Expectations on Student Achievement
Dear Mr. Suhy,
The IRB Committee, or designee, has completed review of your application and found that it qualified
for exemption under the federal guidelines for the protection of human subjects as referenced at Title
45 Part 46.101(b). You are therefore authorized to begin the research as of 01/07/2019.
Any proposed changes in the protocol should be submitted to the IRB as an amendment prior to
initiation (CFR 21 §56.108 (a)(3); §56.108 (a)(4)). Please be advised that as the principal investigator, you
are required to report unanticipated adverse events to the Office of Research Administration within 24
hours of the occurrence or upon acknowledgement of the occurrence (CFR 21 § 56.108 (b)(1)).
All investigators and key personnel identified in the protocol must have documented CITI IRB Training on
file with this office. Certificates are valid for 3 years from completion date.
Southern Methodist University Office of Research Administration appreciates your continued
commitment to the protection of human subjects in research. Should you have questions, or need to
report completion of study procedures, please contact Office of Research Administration at 214-768-
2033 or at [email protected].
Thank You,
Austin Baldwin IRB Chair
Office of Research and Graduate Studies Southern Methodist University PO Box 750302 Dallas TX 75275-0240 Office: 214-768-2033 Fax: 214-768-1079

THE IMPACT OF THE DISCREPANCIES BETWEEN STUDENT AND PARENT 146
Appendix F
R Code Used for Analyses
#################### Descriptive Stats NELS:** ################################## alldata<-read.csv("alldata.csv") describe(alldata) #################### Total Scores Actual Expectations ############################## ScoresAct<-read.csv("testscores_act.csv") ScoresAct$BYS45C<-ScoresAct$BYS45-mean(ScoresAct$BYS45) ScoresAct$BYP76C<-ScoresAct$BYP76-mean(ScoresAct$BYP76) ScoresAct$DIS_ACTEXC<-ScoresAct$DIS_ACTEX-mean(ScoresAct$DIS_ACTEX) ScoresAct[!complete.cases(ScoresAct),] describe(ScoresAct, fast=T) describe(ScoresAct) table(ScoresAct$RACE) table(ScoresAct$SEX) table(ScoresAct$G8LUNCH) Scores_Act<-lmer(TestScore ~ RACE + SEX + DIS_ACTEXC*BYS45C + DIS_ACTEXC*G8LUNCH + BYS45C*G8LUNCH + BYS45C:DIS_ACTEXC:G8LUNCH + (1 + DIS_ACTEXC |SCH_ID), data=ScoresAct) summary(Scores_Act) Scores_Act2<-lmer(TestScore ~ SEX + RACE + DIS_ACTEXC*BYS45C + DIS_ACTEXC:G8LUNCH + BYS45C:G8LUNCH + BYS45C:DIS_ACTEXC:G8LUNCH + (1|SCH_ID), data=ScoresAct) summary(Scores_Act2) anova(Scores_Act, Scores_Act2) #################### History Perceived Expectations ############################## ScoresPer<-read.csv("testscores_per.csv") ScoresPer$BYS45C<-ScoresPer$BYS45-mean(ScoresPer$BYS45) ScoresPer$PER_PAREXC<-ScoresPer$PER_PAREX-mean(ScoresPer$PER_PAREX) ScoresPer$DIS_PEREXC<-ScoresPer$DIS_PEREX-mean(ScoresPer$DIS_PEREX) ScoresPer[!complete.cases(ScoresPer),] describe(ScoresPer, fast=T) describe(ScoresPer) tablehist(ScoresPer$DIS_PEREXC) Scores_Per<-lmer(TestScore ~ RACE + SEX + DIS_PEREXC + BYS45C + DIS_PEREXC*BYS45C + G8LUNCH + DIS_PEREXC*G8LUNCH + BYS45C*G8LUNCH + BYS45C*DIS_PEREXC*G8LUNCH + (1 + DIS_PEREX|SCH_ID), data=ScoresPer) summary(Scores_Per)

THE IMPACT OF THE DISCREPANCIES BETWEEN STUDENT AND PARENT 147
Scores_Per2<-lmer(TestScore ~ SEX + RACE + DIS_PEREXC + BYS45C + DIS_PEREXC*BYS45C + G8LUNCH + DIS_PEREXC:G8LUNCH + BYS45C:G8LUNCH + BYS45C:DIS_PEREXC:G8LUNCH + (1 |SCH_ID), data=ScoresPer) summary(Scores_Per2) anova(Scores_Per, Scores_Per2) #################### Student Future Expectations Actual ########################### futureexact<-read.csv("future_act.csv") describe(futureexact) tabfutureexact futureexact$BYS45C<-futureexact$BYS45-mean(futureexact$BYS45) futureexact$BYP76C<-futureexact$BYP76-mean(futureexact$BYP76) futureexact$DIS_ACTEXC<-futureexact$DIS_ACTEX-mean(futureexact$DIS_ACTEX) futureexact[!complete.cases(futureexact),] describe(futureexact, fast=T) futureexACT<-lmer(F2S43 ~ RACE + SEX + DIS_ACTEXC + BYS45C + DIS_ACTEXC*BYS45C + G8LUNCH + DIS_ACTEXC:G8LUNCH + BYS45C:G8LUNCH + BYS45C:DIS_ACTEXC:G8LUNCH + (1 + DIS_ACTEXC|SCH_ID), data=futureexact) summary(futureexACT) futureexACT2<-lmer(F2S43 ~ RACE + SEX + DIS_ACTEXC + BYS45C + DIS_ACTEXC*BYS45C + G8LUNCH + DIS_ACTEXC:G8LUNCH + BYS45C:G8LUNCH + BYS45C:DIS_ACTEXC:G8LUNCH + (1|SCH_ID), data=futureexact) summary(futureexACT2) anova(futureexACT, futureexACT2) ####################Student's Future Expectations Perceived ######################## futureexper<-read.csv("future_per.csv") describe(futureexper) futureexper futureexper$BYS45C<-futureexper$BYS45-mean(futureexper$BYS45) futureexper$PER_PAREXC<-futureexper$PER_PAREX-mean(futureexper$PER_PAREX) futureexper$DIS_PEREXC<-futureexper$DIS_PEREX-mean(futureexper$DIS_PEREX) futureexper[!complete.cases(futureexper),] describe(futureexper, fast=T) futureexPER<-lmer(F2S43 ~ RACE + SEX + DIS_PEREXC + BYS45C + DIS_PEREXC*BYS45C + G8LUNCH + DIS_PEREXC:G8LUNCH + BYS45C:G8LUNCH + BYS45C:DIS_PEREXC:G8LUNCH + (1 + DIS_PEREXC|SCH_ID), data=futureexper) summary(futureexPER) futureexPER2<-lmer(F2S43 ~ SEX + RACE + DIS_PEREXC + BYS45C + DIS_PEREXC*BYS45C + G8LUNCH + DIS_PEREXC:G8LUNCH + BYS45C:G8LUNCH + BYS45C:DIS_PEREXC:G8LUNCH + (1|SCH_ID), data=futureexper) summary(futureexPER2) anova(futureexPER, futureexPER2)

THE IMPACT OF THE DISCREPANCIES BETWEEN STUDENT AND PARENT 148
Appendix G
R Code Output
SCH_ID (Intercept) 113.3 10.64 Residual 675.9 26.00 > library(lme4) Loading required package: Matrix Attaching package: ‘Matrix’ The following object is masked from ‘package:tidyr’: expand > library(lmerTest) Attaching package: ‘lmerTest’ The following object is masked from ‘package:lme4’: lmer The following object is masked from ‘package:stats’: step > #library(plyr) > #library(car) > #library(nlme) > #library(FSA) > > ### Thom's Mac > setwd("~/Dropbox/Dissertation 2019 - GHD/Final Dissertation Data Files") > > alldata<-read.csv("alldata.csv") > > describe(alldata) vars n mean sd median trimmed mad min max range skew kurtosis se STU_ID 1 22511 4610406.81 2619378.36 4590025.00 4680035.72 3388138.34 124902.00 9199197.00 9074295.00 -0.19 -1.44 17458.26 SCH_ID 2 22511 46103.57 26193.78 45900.00 46799.86 33880.38 1249.00 91991.00 90742.00 -0.19 -1.44 174.58 BYS45 3 22335 2.82 0.96 3.00 2.91 1.48 0.00 4.00 4.00 -0.61 -0.15 0.01 BYS48A 4 18890 3.00 0.87 3.00 3.09 1.48 0.00 4.00 4.00 -0.84 0.64 0.01 BYS48B 5 19700 3.01 0.86 3.00 3.10 1.48 0.00 4.00 4.00 -0.83 0.66 0.01 PER_PAREX 6 20174 3.00 0.84 3.00 3.08 0.74 0.00 4.00 4.00 -0.81 0.63 0.01 DIS_PEREX 7 20160 0.14 0.79 0.00 0.12 0.00 -4.00 4.00 8.00 0.56 3.67 0.01 BYP76 8 22511 2.71 0.97 3.00 2.77 1.48 0.00 4.00 4.00 -0.31 -0.73 0.01 DIS_ACTEX 9 22335 -0.10 0.95 0.00 -0.08 1.48 -4.00 4.00 8.00 -0.13 0.91 0.01 G8LUNCH 10 22105 0.14 0.35 0.00 0.05 0.00 0.00 1.00 1.00 2.09 2.38 0.00 SEX 11 22511 0.50 0.50 1.00 0.50 0.00 0.00 1.00 1.00 -0.01 -2.00 0.00 RACE 12 22275 0.31 0.46 0.00 0.27 0.00 0.00 1.00 1.00 0.80 -1.35 0.00 F22XRIRR 13 12250 33.50 10.22 34.80 33.91 11.98 10.41 50.89 40.48 -0.31 -0.97 0.09 F22XMIRR 14 12251 49.15 14.63 49.80 49.36 17.54 16.77 78.10 61.33 -0.11 -0.98 0.13 F22XSIRR 15 12172 23.71 6.28 23.84 23.79 7.64 10.03 35.96 25.93 -0.08 -1.01 0.06 F22XHIRR 16 12117 35.04 5.43 35.05 35.14 6.46 20.72 45.38 24.66 -0.12 -0.88 0.05 TESTSCORE 17 12071 141.59 33.16 142.78 142.24 39.35 61.73 209.24 147.51 -0.14 -0.95 0.30 F2S43 18 13340 3.01 0.91 3.00 3.08 1.48 0.00 4.00 4.00 -0.50 -0.59 0.01 > > #################### Total Scores Actual Expectations ######################################## > > ScoresAct<-read.csv("testscores_act.csv") > > ScoresAct$BYS45C<-ScoresAct$BYS45-mean(ScoresAct$BYS45) > ScoresAct$BYP76C<-ScoresAct$BYP76-mean(ScoresAct$BYP76) > ScoresAct$DIS_ACTEXC<-ScoresAct$DIS_ACTEX-mean(ScoresAct$DIS_ACTEX) > > ScoresAct[!complete.cases(ScoresAct),] [1] STU_ID SCH_ID BYS45 BYP76 DIS_ACTEX G8LUNCH SEX RACE F22XRIRR F22XMIRR F22XSIRR F22XHIRR TestScore BYS45C BYP76C DIS_ACTEXC <0 rows> (or 0-length row.names) > describe(ScoresAct, fast=T) vars n mean sd min max range se STU_ID 1 11710 4628399.85 2672260.11 124902.00 9199197.00 9074295.00 24694.50 SCH_ID 2 11710 46283.51 26722.60 1249.00 91991.00 90742.00 246.95 BYS45 3 11710 2.88 0.92 0.00 4.00 4.00 0.01 BYP76 4 11710 2.77 0.94 0.00 4.00 4.00 0.01 DIS_ACTEX 5 11710 -0.11 0.90 -4.00 4.00 8.00 0.01 G8LUNCH 6 11710 0.11 0.32 0.00 1.00 1.00 0.00 SEX 7 11710 0.50 0.50 0.00 1.00 1.00 0.00 RACE 8 11710 0.26 0.44 0.00 1.00 1.00 0.00 F22XRIRR 9 11710 33.67 10.16 10.41 50.89 40.48 0.09 F22XMIRR 10 11710 49.40 14.57 16.77 78.10 61.33 0.13 F22XSIRR 11 11710 23.79 6.27 10.03 35.96 25.93 0.06 F22XHIRR 12 11710 35.09 5.42 20.72 45.38 24.66 0.05 TestScore 13 11710 141.95 33.06 64.06 209.24 145.18 0.31 BYS45C 14 11710 0.00 0.92 -2.88 1.12 4.00 0.01 BYP76C 15 11710 0.00 0.94 -2.77 1.23 4.00 0.01 DIS_ACTEXC 16 11710 0.00 0.90 -3.89 4.11 8.00 0.01 > describe(ScoresAct) vars n mean sd median trimmed mad min max range skew kurtosis se STU_ID 1 11710 4628399.85 2672260.11 4598168.00 4699942.19 3410528.56 124902.00 9199197.00 9074295.00 -0.20 -1.50 24694.50 SCH_ID 2 11710 46283.51 26722.60 45981.00 46998.93 34105.73 1249.00 91991.00 90742.00 -0.20 -1.50 246.95 BYS45 3 11710 2.88 0.92 3.00 2.97 1.48 0.00 4.00 4.00 -0.64 -0.03 0.01 BYP76 4 11710 2.77 0.94 3.00 2.84 1.48 0.00 4.00 4.00 -0.37 -0.64 0.01 DIS_ACTEX 5 11710 -0.11 0.90 0.00 -0.09 0.00 -4.00 4.00 8.00 -0.21 0.98 0.01 G8LUNCH 6 11710 0.11 0.32 0.00 0.02 0.00 0.00 1.00 1.00 2.46 4.04 0.00 SEX 7 11710 0.50 0.50 1.00 0.51 0.00 0.00 1.00 1.00 -0.02 -2.00 0.00 RACE 8 11710 0.26 0.44 0.00 0.21 0.00 0.00 1.00 1.00 1.07 -0.85 0.00 F22XRIRR 9 11710 33.67 10.16 35.06 34.10 11.82 10.41 50.89 40.48 -0.32 -0.95 0.09

THE IMPACT OF THE DISCREPANCIES BETWEEN STUDENT AND PARENT 149
F22XMIRR 10 11710 49.40 14.57 50.05 49.63 17.35 16.77 78.10 61.33 -0.12 -0.97 0.13 F22XSIRR 11 11710 23.79 6.27 23.93 23.89 7.61 10.03 35.96 25.93 -0.10 -1.00 0.06 F22XHIRR 12 11710 35.09 5.42 35.13 35.20 6.45 20.72 45.38 24.66 -0.13 -0.88 0.05 TestScore 13 11710 141.95 33.06 143.15 142.63 39.12 64.06 209.24 145.18 -0.14 -0.94 0.31 BYS45C 14 11710 0.00 0.92 0.12 0.09 1.48 -2.88 1.12 4.00 -0.64 -0.03 0.01 BYP76C 15 11710 0.00 0.94 0.23 0.07 1.48 -2.77 1.23 4.00 -0.37 -0.64 0.01 DIS_ACTEXC 16 11710 0.00 0.90 0.11 0.02 0.00 -3.89 4.11 8.00 -0.21 0.98 0.01 0 1 8618 3092 > table(ScoresAct$SEX) 0 1 5800 5910 > table(ScoresAct$G8LUNCH) 0 1 10396 1314 > > Scores_Act<-lmer(TestScore ~ RACE + SEX + DIS_ACTEXC*BYS45C + DIS_ACTEXC*G8LUNCH + BYS45C*G8LUNCH + BYS45C:DIS_ACTEXC:G8LUNCH + + (1 + DIS_ACTEXC |SCH_ID), data=ScoresAct) > > summary(Scores_Act) Linear mixed model fit by REML. t-tests use Satterthwaite's method ['lmerModLmerTest'] Formula: TestScore ~ RACE + SEX + DIS_ACTEXC * BYS45C + DIS_ACTEXC * G8LUNCH + BYS45C * G8LUNCH + BYS45C:DIS_ACTEXC:G8LUNCH + (1 + DIS_ACTEXC | SCH_ID) Data: ScoresAct REML criterion at convergence: 109583.5 Scaled residuals: Min 1Q Median 3Q Max -4.2923 -0.6773 0.0381 0.7092 3.6016 Random effects: Groups Name Variance Std.Dev. Corr SCH_ID (Intercept) 83.5989 9.143 DIS_ACTEXC 0.9448 0.972 -0.44 Residual 630.2185 25.104 Number of obs: 11710, groups: SCH_ID, 945 Fixed effects: Estimate Std. Error df t value Pr(>|t|) (Intercept) 148.3533 0.5142 1655.9916 288.490 < 2e-16 *** RACE -12.7526 0.6394 9852.9877 -19.946 < 2e-16 *** SEX -3.8153 0.4819 11501.6977 -7.918 2.64e-15 *** DIS_ACTEXC 11.1337 0.3359 1045.1643 33.146 < 2e-16 *** BYS45C 20.2627 0.3446 11548.7064 58.793 < 2e-16 *** G8LUNCH -10.8111 1.2740 1271.6458 -8.486 < 2e-16 *** DIS_ACTEXC:BYS45C 0.4273 0.2881 4576.4881 1.483 0.138 DIS_ACTEXC:G8LUNCH -4.9949 0.8738 814.7867 -5.717 1.53e-08 *** BYS45C:G8LUNCH -7.2282 0.9374 11655.8391 -7.711 1.35e-14 *** DIS_ACTEXC:BYS45C:G8LUNCH 2.9897 0.6936 5742.0102 4.310 1.66e-05 *** --- Signif. codes: 0 ‘***’ 0.001 ‘**’ 0.01 ‘*’ 0.05 ‘.’ 0.1 ‘ ’ 1 Correlation of Fixed Effects: (Intr) RACE SEX DIS_ACTEXC BYS45C G8LUNC DIS_ACTEXC:BYS45C DIS_ACTEXC:G BYS45C: RACE -0.266 SEX -0.471 -0.017 DIS_ACTEXC -0.039 -0.035 0.021 BYS45C -0.036 -0.040 -0.040 0.477 G8LUNCH -0.225 -0.227 0.007 0.024 0.035 DIS_ACTEXC:BYS45C 0.196 0.051 -0.008 0.001 -0.227 -0.095 DIS_ACTEXC:G 0.027 -0.006 -0.021 -0.384 -0.182 0.051 -0.001 BYS45C:G8LU 0.030 0.002 -0.014 -0.176 -0.366 0.078 0.083 0.512 DIS_ACTEXC:BYS45C: -0.086 -0.010 0.007 -0.001 0.094 0.271 -0.415 0.065 -0.199 > > > > Scores_Act2<-lmer(TestScore ~ SEX + RACE + DIS_ACTEXC*BYS45C + DIS_ACTEXC:G8LUNCH + BYS45C:G8LUNCH + BYS45C:DIS_ACTEXC:G8LUNCH + + (1|SCH_ID), data=ScoresAct) > summary(Scores_Act2) Linear mixed model fit by REML. t-tests use Satterthwaite's method ['lmerModLmerTest'] Formula: TestScore ~ SEX + RACE + DIS_ACTEXC * BYS45C + DIS_ACTEXC:G8LUNCH + BYS45C:G8LUNCH + BYS45C:DIS_ACTEXC:G8LUNCH + (1 | SCH_ID) Data: ScoresAct REML criterion at convergence: 109657.8 Scaled residuals: Min 1Q Median 3Q Max -4.2888 -0.6821 0.0396 0.7092 3.6515 Random effects: Groups Name Variance Std.Dev. SCH_ID (Intercept) 91.88 9.586 Residual 631.92 25.138 Number of obs: 11710, groups: SCH_ID, 945 Fixed effects: Estimate Std. Error df t value Pr(>|t|) (Intercept) 147.3092 0.5114 1781.2066 288.077 < 2e-16 *** SEX -3.7752 0.4828 11474.8194 -7.819 5.80e-15 *** RACE -13.8824 0.6273 9100.3880 -22.131 < 2e-16 *** DIS_ACTEXC 11.1462 0.3339 11647.7796 33.381 < 2e-16 *** BYS45C 20.2867 0.3457 11609.4394 58.686 < 2e-16 *** DIS_ACTEXC:BYS45C 0.1751 0.2868 11434.1449 0.611 0.541 DIS_ACTEXC:G8LUNCH -4.3554 0.8647 11623.8957 -5.037 4.80e-07 *** BYS45C:G8LUNCH -6.5755 0.9375 11691.9052 -7.014 2.44e-12 *** DIS_ACTEXC:BYS45C:G8LUNCH 4.5579 0.6688 11666.7602 6.815 9.88e-12 *** --- Signif. codes: 0 ‘***’ 0.001 ‘**’ 0.01 ‘*’ 0.05 ‘.’ 0.1 ‘ ’ 1 Correlation of Fixed Effects:

THE IMPACT OF THE DISCREPANCIES BETWEEN STUDENT AND PARENT 150
(Intr) SEX RACE DIS_ACTEXC BYS45C DIS_ACTEXC:BYS45C DIS_ACTEXC:G BYS45C: SEX -0.473 RACE -0.331 -0.016 DIS_ACTEXC -0.005 0.020 -0.032 BYS45C -0.027 -0.041 -0.032 0.481 DIS_ACTEXC:BYS45C 0.176 -0.007 0.032 -0.001 -0.221 DIS_ACTEXC:G 0.035 -0.022 0.014 -0.387 -0.188 0.008 BYS45C:G8LU 0.048 -0.014 0.020 -0.179 -0.370 0.089 0.515 DIS_ACTEXC:BYS45C: -0.025 0.006 0.052 -0.003 0.086 -0.406 0.041 -0.226 > > anova(Scores_Act, Scores_Act2) refitting model(s) with ML (instead of REML) Data: ScoresAct Models: Scores_Act2: TestScore ~ SEX + RACE + DIS_ACTEXC * BYS45C + DIS_ACTEXC:G8LUNCH + Scores_Act2: BYS45C:G8LUNCH + BYS45C:DIS_ACTEXC:G8LUNCH + (1 | SCH_ID) Scores_Act: TestScore ~ RACE + SEX + DIS_ACTEXC * BYS45C + DIS_ACTEXC * G8LUNCH + Scores_Act: BYS45C * G8LUNCH + BYS45C:DIS_ACTEXC:G8LUNCH + (1 + DIS_ACTEXC | Scores_Act: SCH_ID) Df AIC BIC logLik deviance Chisq Chi Df Pr(>Chisq) Scores_Act2 11 109683 109764 -54830 109661 Scores_Act 14 109617 109720 -54794 109589 72.006 3 1.587e-15 *** --- Signif. codes: 0 ‘***’ 0.001 ‘**’ 0.01 ‘*’ 0.05 ‘.’ 0.1 ‘ ’ 1 > ScoresPer<-read.csv("testscores_per.csv") > > ScoresPer$BYS45C<-ScoresPer$BYS45-mean(ScoresPer$BYS45) > ScoresPer$PER_PAREXC<-ScoresPer$PER_PAREX-mean(ScoresPer$PER_PAREX) > ScoresPer$DIS_PEREXC<-ScoresPer$DIS_PEREX-mean(ScoresPer$DIS_PEREX) > describe(ScoresPer, fast=T) vars n mean sd min max range se STU_ID 1 10643 4625086.94 2673789.26 124902.00 9199197.00 9074295.00 25917.62 SCH_ID 2 10643 46250.38 26737.89 1249.00 91991.00 90742.00 259.18 BYS45 3 10643 2.92 0.89 0.00 4.00 4.00 0.01 BYS48A 4 10049 3.03 0.82 0.00 4.00 4.00 0.01 BYS48B 5 10425 3.05 0.81 0.00 4.00 4.00 0.01 PER_PAREX 6 10643 3.03 0.79 0.00 4.00 4.00 0.01 DIS_PEREX 7 10643 0.11 0.74 -4.00 4.00 8.00 0.01 G8LUNCH 8 10643 0.11 0.31 0.00 1.00 1.00 0.00 SEX 9 10643 0.51 0.50 0.00 1.00 1.00 0.00 RACE 10 10643 0.26 0.44 0.00 1.00 1.00 0.00 F22XRIRR 11 10643 34.09 10.09 10.41 50.89 40.48 0.10 F22XMIRR 12 10643 50.07 14.49 16.77 78.10 61.33 0.14 F22XSIRR 13 10643 24.03 6.25 10.03 35.96 25.93 0.06 F22XHIRR 14 10643 35.31 5.40 20.72 45.38 24.66 0.05 TestScore 15 10643 143.50 32.84 64.06 209.24 145.18 0.32 BYS45C 16 10643 0.00 0.89 -2.92 1.08 4.00 0.01 PER_PAREXC 17 10643 0.00 0.79 -3.03 0.97 4.00 0.01 DIS_PEREXC 18 10643 0.00 0.74 -4.11 3.89 8.00 0.01 > describe(ScoresPer) vars n mean sd median trimmed mad min max range skew kurtosis se STU_ID 1 10643 4625086.94 2673789.26 4598576.00 4695522.69 3503091.73 124902.00 9199197.00 9074295.00 -0.20 -1.50 25917.62 SCH_ID 2 10643 46250.38 26737.89 45985.00 46954.74 35030.87 1249.00 91991.00 90742.00 -0.20 -1.50 259.18 BYS45 3 10643 2.92 0.89 3.00 3.00 1.48 0.00 4.00 4.00 -0.66 0.08 0.01 BYS48A 4 10049 3.03 0.82 3.00 3.11 0.00 0.00 4.00 4.00 -0.81 0.78 0.01 BYS48B 5 10425 3.05 0.81 3.00 3.12 0.00 0.00 4.00 4.00 -0.81 0.84 0.01 PER_PAREX 6 10643 3.03 0.79 3.00 3.10 0.74 0.00 4.00 4.00 -0.79 0.79 0.01 DIS_PEREX 7 10643 0.11 0.74 0.00 0.09 0.00 -4.00 4.00 8.00 0.61 3.87 0.01 G8LUNCH 8 10643 0.11 0.31 0.00 0.01 0.00 0.00 1.00 1.00 2.53 4.42 0.00 SEX 9 10643 0.51 0.50 1.00 0.51 0.00 0.00 1.00 1.00 -0.03 -2.00 0.00 RACE 10 10643 0.26 0.44 0.00 0.20 0.00 0.00 1.00 1.00 1.12 -0.75 0.00 F22XRIRR 11 10643 34.09 10.09 35.58 34.58 11.50 10.41 50.89 40.48 -0.37 -0.89 0.10 F22XMIRR 12 10643 50.07 14.49 50.86 50.39 17.12 16.77 78.10 61.33 -0.17 -0.95 0.14 F22XSIRR 13 10643 24.03 6.25 24.25 24.16 7.53 10.03 35.96 25.93 -0.14 -0.98 0.06 F22XHIRR 14 10643 35.31 5.40 35.43 35.44 6.43 20.72 45.38 24.66 -0.16 -0.87 0.05 TestScore 15 10643 143.50 32.84 145.26 144.36 38.76 64.06 209.24 145.18 -0.19 -0.92 0.32 BYS45C 16 10643 0.00 0.89 0.08 0.08 1.48 -2.92 1.08 4.00 -0.66 0.08 0.01 PER_PAREXC 17 10643 0.00 0.79 -0.03 0.07 0.74 -3.03 0.97 4.00 -0.79 0.79 0.01 DIS_PEREXC 18 10643 0.00 0.74 -0.11 -0.02 0.00 -4.11 3.89 8.00 0.61 3.87 0.01 > Scores_Per<-lmer(TestScore ~ RACE + SEX + DIS_PEREXC + BYS45C + DIS_PEREXC*BYS45C + G8LUNCH + DIS_PEREXC*G8LUNCH + BYS45C*G8LUNCH + BYS45C*DIS_PEREXC*G8LUNCH + + (1 + DIS_PEREX|SCH_ID), data=ScoresPer) > summary(Scores_Per) Linear mixed model fit by REML. t-tests use Satterthwaite's method ['lmerModLmerTest'] Formula: TestScore ~ RACE + SEX + DIS_PEREXC + BYS45C + DIS_PEREXC * BYS45C + G8LUNCH + DIS_PEREXC * G8LUNCH + BYS45C * G8LUNCH + BYS45C * DIS_PEREXC * G8LUNCH + (1 + DIS_PEREX | SCH_ID) Data: ScoresPer REML criterion at convergence: 100468.8 Scaled residuals: Min 1Q Median 3Q Max -4.1295 -0.6706 0.0392 0.7073 3.0254 Random effects: Groups Name Variance Std.Dev. Corr SCH_ID (Intercept) 116.545 10.796 DIS_PEREX 9.134 3.022 -0.56 Residual 671.480 25.913 Number of obs: 10643, groups: SCH_ID, 944 Fixed effects: Estimate Std. Error df t value Pr(>|t|) (Intercept) 149.5574 0.5756 1587.7092 259.826 < 2e-16 *** RACE -12.0105 0.7060 9148.3872 -17.012 < 2e-16 *** SEX -4.0860 0.5252 10388.2242 -7.779 7.98e-15 *** DIS_PEREXC 4.8944 0.5097 1520.8875 9.603 < 2e-16 *** BYS45C 16.9067 0.3920 10555.7760 43.133 < 2e-16 *** G8LUNCH -12.3257 1.4313 1225.9453 -8.611 < 2e-16 *** DIS_PEREXC:BYS45C 0.1852 0.3318 2020.2673 0.558 0.5768 DIS_PEREXC:G8LUNCH -1.5836 1.3217 813.3305 -1.198 0.2312 BYS45C:G8LUNCH -4.9509 1.0977 10499.6760 -4.510 6.55e-06 *** DIS_PEREXC:BYS45C:G8LUNCH 1.8911 0.8401 2140.0716 2.251 0.0245 *

THE IMPACT OF THE DISCREPANCIES BETWEEN STUDENT AND PARENT 151
--- Signif. codes: 0 ‘***’ 0.001 ‘**’ 0.01 ‘*’ 0.05 ‘.’ 0.1 ‘ ’ 1 Correlation of Fixed Effects: (Intr) RACE SEX DIS_PEREXC BYS45C G8LUNC DIS_PEREXC:BYS45C DIS_PEREXC:G BYS45C: RACE -0.264 SEX -0.457 -0.016 DIS_PEREXC 0.001 -0.028 -0.014 BYS45C 0.009 -0.038 -0.062 0.468 G8LUNCH -0.228 -0.221 0.000 0.011 0.021 DIS_PEREXC:BYS45C 0.191 0.026 0.002 0.341 -0.095 -0.086 DIS_PEREXC:G 0.008 -0.010 -0.002 -0.385 -0.179 -0.006 -0.132 BYS45C:G8LU 0.013 -0.002 -0.003 -0.166 -0.355 0.052 0.033 0.439 DIS_PEREXC:BYS45C: -0.077 -0.001 -0.004 -0.135 0.037 0.234 -0.395 0.405 -0.153 > > > Scores_Per2<-lmer(TestScore ~ SEX + RACE + DIS_PEREXC + BYS45C + DIS_PEREXC*BYS45C + G8LUNCH + DIS_PEREXC:G8LUNCH + BYS45C:G8LUNCH + BYS45C:DIS_PEREXC:G8LUNCH + + (1 |SCH_ID), data=ScoresPer) > summary(Scores_Per2) Linear mixed model fit by REML. t-tests use Satterthwaite's method ['lmerModLmerTest'] Formula: TestScore ~ SEX + RACE + DIS_PEREXC + BYS45C + DIS_PEREXC * BYS45C + G8LUNCH + DIS_PEREXC:G8LUNCH + BYS45C:G8LUNCH + BYS45C:DIS_PEREXC:G8LUNCH + (1 | SCH_ID) Data: ScoresPer REML criterion at convergence: 100483.5 Scaled residuals: Min 1Q Median 3Q Max -4.1102 -0.6721 0.0427 0.7135 3.1549 Random effects: Groups Name Variance Std.Dev. Number of obs: 10643, groups: SCH_ID, 944 Fixed effects: Estimate Std. Error df t value Pr(>|t|) (Intercept) 1.496e+02 5.768e-01 1.598e+03 259.289 < 2e-16 *** SEX -4.095e+00 5.258e-01 1.040e+04 -7.789 7.41e-15 *** RACE -1.209e+01 7.083e-01 9.404e+03 -17.066 < 2e-16 *** DIS_PEREXC 5.067e+00 4.916e-01 1.031e+04 10.307 < 2e-16 *** BYS45C 1.700e+01 3.915e-01 1.062e+04 43.419 < 2e-16 *** G8LUNCH -1.238e+01 1.433e+00 1.237e+03 -8.638 < 2e-16 *** DIS_PEREXC:BYS45C -1.945e-02 3.262e-01 1.030e+04 -0.060 0.9525 DIS_PEREXC:G8LUNCH -1.778e+00 1.252e+00 1.038e+04 -1.420 0.1557 BYS45C:G8LUNCH -5.005e+00 1.096e+00 1.052e+04 -4.565 5.04e-06 *** DIS_PEREXC:BYS45C:G8LUNCH 1.925e+00 8.224e-01 1.038e+04 2.341 0.0193 * --- Signif. codes: 0 ‘***’ 0.001 ‘**’ 0.01 ‘*’ 0.05 ‘.’ 0.1 ‘ ’ 1 Correlation of Fixed Effects: (Intr) SEX RACE DIS_PEREXC BYS45C G8LUNC DIS_PEREXC:BYS45C DIS_PEREXC:G BYS45C: SEX -0.457 RACE -0.264 -0.017 DIS_PEREXC 0.084 -0.014 -0.029 BYS45C 0.009 -0.062 -0.036 0.480 G8LUNCH -0.229 0.000 -0.221 -0.021 0.020 DIS_PEREXC:BYS45C 0.193 0.003 0.026 0.349 -0.087 -0.087 DIS_PEREXC:G -0.024 -0.002 -0.009 -0.392 -0.187 0.089 -0.138 BYS45C:G8LU 0.012 -0.004 -0.001 -0.171 -0.355 0.052 0.031 0.456 DIS_PEREXC:BYS45C: -0.077 -0.005 -0.001 -0.139 0.034 0.238 -0.396 0.399 -0.156 > > anova(Scores_Per, Scores_Per2) refitting model(s) with ML (instead of REML) Data: ScoresPer Models: Scores_Per2: TestScore ~ SEX + RACE + DIS_PEREXC + BYS45C + DIS_PEREXC * BYS45C + Scores_Per2: G8LUNCH + DIS_PEREXC:G8LUNCH + BYS45C:G8LUNCH + BYS45C:DIS_PEREXC:G8LUNCH + Scores_Per2: (1 | SCH_ID) Scores_Per: TestScore ~ RACE + SEX + DIS_PEREXC + BYS45C + DIS_PEREXC * BYS45C + Scores_Per: G8LUNCH + DIS_PEREXC * G8LUNCH + BYS45C * G8LUNCH + BYS45C * Scores_Per: DIS_PEREXC * G8LUNCH + (1 + DIS_PEREX | SCH_ID) Df AIC BIC logLik deviance Chisq Chi Df Pr(>Chisq) Scores_Per2 12 100516 100603 -50246 100492 Scores_Per 14 100506 100607 -50239 100478 14.476 2 0.0007186 *** --- Signif. codes: 0 ‘***’ 0.001 ‘**’ 0.01 ‘*’ 0.05 ‘.’ 0.1 ‘ ’ 1 > futureexact<-read.csv("future_act.csv") > describe(futureexact) vars n mean sd median trimmed mad min max range skew kurtosis se STU_ID 1 12954 4657154.78 2652781.62 4598578 4734366.34 3404938.42 124902 9199197 9074295 -0.22 -1.46 23307.71 SCH_ID 2 12954 46571.05 26527.82 45985 47343.17 34049.39 1249 91991 90742 -0.22 -1.46 233.08 BYS45 3 12954 2.94 0.88 3 3.02 1.48 0 4 4 -0.66 0.06 0.01 BYP76 4 12954 2.83 0.91 3 2.90 1.48 0 4 4 -0.40 -0.60 0.01 DIS_ACTEX 5 12954 -0.11 0.89 0 -0.09 0.00 -4 4 8 -0.21 1.03 0.01 G8LUNCH 6 12954 0.11 0.31 0 0.01 0.00 0 1 1 2.56 4.56 0.00 SEX 7 12954 0.51 0.50 1 0.52 0.00 0 1 1 -0.05 -2.00 0.00 RACE 8 12954 0.26 0.44 0 0.20 0.00 0 1 1 1.08 -0.84 0.00 F2S43 9 12954 3.01 0.91 3 3.08 1.48 0 4 4 -0.50 -0.60 0.01 > futureexact$BYS45C<-futureexact$BYS45-mean(futureexact$BYS45) > futureexact$BYP76C<-futureexact$BYP76-mean(futureexact$BYP76) > futureexact$DIS_ACTEXC<-futureexact$DIS_ACTEX-mean(futureexact$DIS_ACTEX) > > futureexact[!complete.cases(futureexact),] [1] STU_ID SCH_ID BYS45 BYP76 DIS_ACTEX G8LUNCH SEX RACE F2S43 BYS45C BYP76C DIS_ACTEXC <0 rows> (or 0-length row.names) > describe(futureexact, fast=T) vars n mean sd min max range se STU_ID 1 12954 4657154.78 2652781.62 124902.00 9199197.00 9074295 23307.71 SCH_ID 2 12954 46571.05 26527.82 1249.00 91991.00 90742 233.08 BYS45 3 12954 2.94 0.88 0.00 4.00 4 0.01 BYP76 4 12954 2.83 0.91 0.00 4.00 4 0.01 DIS_ACTEX 5 12954 -0.11 0.89 -4.00 4.00 8 0.01

THE IMPACT OF THE DISCREPANCIES BETWEEN STUDENT AND PARENT 152
G8LUNCH 6 12954 0.11 0.31 0.00 1.00 1 0.00 SEX 7 12954 0.51 0.50 0.00 1.00 1 0.00 RACE 8 12954 0.26 0.44 0.00 1.00 1 0.00 F2S43 9 12954 3.01 0.91 0.00 4.00 4 0.01 BYS45C 10 12954 0.00 0.88 -2.94 1.06 4 0.01 BYP76C 11 12954 0.00 0.91 -2.83 1.17 4 0.01 DIS_ACTEXC 12 12954 0.00 0.89 -3.89 4.11 8 0.01 > > futureexACT<-lmer(F2S43 ~ RACE + SEX + DIS_ACTEXC + BYS45C + DIS_ACTEXC*BYS45C + G8LUNCH + DIS_ACTEXC:G8LUNCH + BYS45C:G8LUNCH + BYS45C:DIS_ACTEXC:G8LUNCH + + (1 + DIS_ACTEXC|SCH_ID), data=futureexact) > summary(futureexACT) Linear mixed model fit by REML. t-tests use Satterthwaite's method ['lmerModLmerTest'] Formula: F2S43 ~ RACE + SEX + DIS_ACTEXC + BYS45C + DIS_ACTEXC * BYS45C + G8LUNCH + DIS_ACTEXC:G8LUNCH + BYS45C:G8LUNCH + BYS45C:DIS_ACTEXC:G8LUNCH + (1 + DIS_ACTEXC | SCH_ID) Data: futureexact REML criterion at convergence: 29654.8 Scaled residuals: Min 1Q Median 3Q Max -5.0683 -0.6353 0.0445 0.6920 3.2232 Random effects: Groups Name Variance Std.Dev. Corr SCH_ID (Intercept) 0.02554 0.1598 DIS_ACTEXC 0.01076 0.1037 -0.09 Residual 0.54807 0.7403 Number of obs: 12954, groups: SCH_ID, 956 Fixed effects: Estimate Std. Error df t value Pr(>|t|) (Intercept) 2.956e+00 1.229e-02 2.062e+03 240.523 < 2e-16 *** RACE 5.123e-02 1.697e-02 8.276e+03 3.019 0.002544 ** SEX 7.558e-02 1.339e-02 1.291e+04 5.644 1.69e-08 *** DIS_ACTEXC 2.706e-01 1.012e-02 1.073e+03 26.739 < 2e-16 *** BYS45C 6.095e-01 9.723e-03 1.160e+04 62.689 < 2e-16 *** G8LUNCH -8.829e-02 2.989e-02 1.536e+03 -2.954 0.003184 ** DIS_ACTEXC:BYS45C -9.676e-03 8.390e-03 6.238e+03 -1.153 0.248803 DIS_ACTEXC:G8LUNCH -8.015e-02 2.732e-02 1.022e+03 -2.934 0.003422 ** BYS45C:G8LUNCH -9.451e-02 2.769e-02 1.274e+04 -3.413 0.000645 *** DIS_ACTEXC:BYS45C:G8LUNCH 1.608e-02 2.093e-02 6.784e+03 0.769 0.442197 --- Signif. codes: 0 ‘***’ 0.001 ‘**’ 0.01 ‘*’ 0.05 ‘.’ 0.1 ‘ ’ 1 Correlation of Fixed Effects: (Intr) RACE SEX DIS_ACTEXC BYS45C G8LUNC DIS_ACTEXC:BYS45C DIS_ACTEXC:G BYS45C: RACE -0.286 SEX -0.555 -0.014 DIS_ACTEXC -0.022 -0.039 0.025 BYS45C -0.038 -0.044 -0.033 0.432 G8LUNCH -0.174 -0.258 0.001 0.018 0.040 DIS_ACTEXC:BYS45C 0.223 0.050 0.004 0.010 -0.232 -0.112 DIS_ACTEXC:G 0.014 0.004 -0.014 -0.370 -0.159 0.084 -0.004 BYS45C:G8LU 0.027 0.006 -0.008 -0.152 -0.350 0.095 0.081 0.464 DIS_ACTEXC:BYS45C: -0.089 -0.019 -0.003 -0.004 0.093 0.326 -0.401 0.087 -0.197 > > futureexACT2<-lmer(F2S43 ~ RACE + SEX + DIS_ACTEXC + BYS45C + DIS_ACTEXC*BYS45C + G8LUNCH + DIS_ACTEXC:G8LUNCH + BYS45C:G8LUNCH + BYS45C:DIS_ACTEXC:G8LUNCH + (1|SCH_ID), data=futureexact) > summary(futureexACT2) Linear mixed model fit by REML. t-tests use Satterthwaite's method ['lmerModLmerTest'] Formula: F2S43 ~ RACE + SEX + DIS_ACTEXC + BYS45C + DIS_ACTEXC * BYS45C + G8LUNCH + DIS_ACTEXC:G8LUNCH + BYS45C:G8LUNCH + BYS45C:DIS_ACTEXC:G8LUNCH + (1 | SCH_ID) Data: futureexact REML criterion at convergence: 29674.7 Scaled residuals: Min 1Q Median 3Q Max -5.0280 -0.6371 0.0443 0.6976 3.2643 Random effects: Groups Name Variance Std.Dev. SCH_ID (Intercept) 0.02592 0.1610 Residual 0.55626 0.7458 Number of obs: 12954, groups: SCH_ID, 956 Fixed effects: Estimate Std. Error df t value Pr(>|t|) (Intercept) 2.955e+00 1.232e-02 2.061e+03 239.902 < 2e-16 *** RACE 5.148e-02 1.698e-02 8.313e+03 3.032 0.002441 ** SEX 7.580e-02 1.341e-02 1.293e+04 5.654 1.6e-08 *** DIS_ACTEXC 2.704e-01 9.273e-03 1.284e+04 29.158 < 2e-16 *** BYS45C 6.079e-01 9.746e-03 1.172e+04 62.372 < 2e-16 *** G8LUNCH -8.736e-02 2.994e-02 1.532e+03 -2.917 0.003580 ** DIS_ACTEXC:BYS45C -9.162e-03 8.142e-03 1.287e+04 -1.125 0.260479 DIS_ACTEXC:G8LUNCH -7.954e-02 2.493e-02 1.292e+04 -3.191 0.001422 ** BYS45C:G8LUNCH -9.314e-02 2.775e-02 1.280e+04 -3.357 0.000791 *** DIS_ACTEXC:BYS45C:G8LUNCH 1.366e-02 2.034e-02 1.289e+04 0.672 0.501747 --- Signif. codes: 0 ‘***’ 0.001 ‘**’ 0.01 ‘*’ 0.05 ‘.’ 0.1 ‘ ’ 1 Correlation of Fixed Effects: (Intr) RACE SEX DIS_ACTEXC BYS45C G8LUNC DIS_ACTEXC:BYS45C DIS_ACTEXC:G BYS45C: RACE -0.286 SEX -0.554 -0.014 DIS_ACTEXC -0.004 -0.041 0.026 BYS45C -0.037 -0.043 -0.033 0.473 G8LUNCH -0.175 -0.258 0.001 0.011 0.039 DIS_ACTEXC:BYS45C 0.222 0.053 0.005 0.007 -0.234 -0.113 DIS_ACTEXC:G 0.007 0.005 -0.015 -0.372 -0.175 0.113 -0.003 BYS45C:G8LU 0.026 0.006 -0.007 -0.166 -0.350 0.095 0.082 0.509 DIS_ACTEXC:BYS45C: -0.089 -0.019 -0.004 -0.003 0.094 0.326 -0.400 0.081 -0.200 >

THE IMPACT OF THE DISCREPANCIES BETWEEN STUDENT AND PARENT 153
> anova(futureexACT, futureexACT2) refitting model(s) with ML (instead of REML) Data: futureexact Models: futureexACT2: F2S43 ~ RACE + SEX + DIS_ACTEXC + BYS45C + DIS_ACTEXC * BYS45C + futureexACT2: G8LUNCH + DIS_ACTEXC:G8LUNCH + BYS45C:G8LUNCH + BYS45C:DIS_ACTEXC:G8LUNCH + futureexACT2: (1 | SCH_ID) futureexACT: F2S43 ~ RACE + SEX + DIS_ACTEXC + BYS45C + DIS_ACTEXC * BYS45C + futureexACT: G8LUNCH + DIS_ACTEXC:G8LUNCH + BYS45C:G8LUNCH + BYS45C:DIS_ACTEXC:G8LUNCH + futureexACT: (1 + DIS_ACTEXC | SCH_ID) Df AIC BIC logLik deviance Chisq Chi Df Pr(>Chisq) futureexACT2 12 29632 29721 -14804 29608 futureexACT 14 29616 29721 -14794 29588 19.346 2 6.296e-05 *** --- Signif. codes: 0 ‘***’ 0.001 ‘**’ 0.01 ‘*’ 0.05 ‘.’ 0.1 ‘ ’ 1 > futureexper<-read.csv("future_per.csv") > describe(futureexper) vars n mean sd median trimmed mad min max range skew kurtosis se STU_ID 1 11859 4649861.65 2655493.59 4599412 4724845.35 3406396.56 124902 9199197 9074295 -0.21 -1.47 24384.91 SCH_ID 2 11859 46498.12 26554.94 45994 47247.96 34062.74 1249 91991 90742 -0.21 -1.47 243.85 BYS45 3 11859 2.97 0.86 3 3.05 1.48 0 4 4 -0.68 0.16 0.01 BYS48A 4 11240 3.07 0.80 3 3.15 0.00 0 4 4 -0.84 0.91 0.01 BYS48B 5 11619 3.08 0.79 3 3.15 0.00 0 4 4 -0.81 0.88 0.01 PER_PAREX 6 11859 3.06 0.77 3 3.14 0.74 0 4 4 -0.81 0.90 0.01 DIS_PEREX 7 11859 0.09 0.72 0 0.08 0.00 -4 4 8 0.53 4.14 0.01 G8LUNCH 8 11859 0.10 0.30 0 0.00 0.00 0 1 1 2.65 5.03 0.00 SEX 9 11859 0.51 0.50 1 0.52 0.00 0 1 1 -0.05 -2.00 0.00 RACE 10 11859 0.25 0.44 0 0.19 0.00 0 1 1 1.12 -0.74 0.00 F2S43 11 11859 3.03 0.90 3 3.10 1.48 0 4 4 -0.53 -0.54 0.01 > futureexper$BYS45C<-futureexper$BYS45-mean(futureexper$BYS45) > futureexper$PER_PAREXC<-futureexper$PER_PAREX-mean(futureexper$PER_PAREX) > futureexper$DIS_PEREXC<-futureexper$DIS_PEREX-mean(futureexper$DIS_PEREX) > > describe(futureexper, fast=T) vars n mean sd min max range se STU_ID 1 11859 4649861.65 2655493.59 124902.00 9199197.00 9074295 24384.91 SCH_ID 2 11859 46498.12 26554.94 1249.00 91991.00 90742 243.85 BYS45 3 11859 2.97 0.86 0.00 4.00 4 0.01 BYS48A 4 11240 3.07 0.80 0.00 4.00 4 0.01 BYS48B 5 11619 3.08 0.79 0.00 4.00 4 0.01 PER_PAREX 6 11859 3.06 0.77 0.00 4.00 4 0.01 DIS_PEREX 7 11859 0.09 0.72 -4.00 4.00 8 0.01 G8LUNCH 8 11859 0.10 0.30 0.00 1.00 1 0.00 SEX 9 11859 0.51 0.50 0.00 1.00 1 0.00 RACE 10 11859 0.25 0.44 0.00 1.00 1 0.00 F2S43 11 11859 3.03 0.90 0.00 4.00 4 0.01 BYS45C 12 11859 0.00 0.86 -2.97 1.03 4 0.01 PER_PAREXC 13 11859 0.00 0.77 -3.06 0.94 4 0.01 DIS_PEREXC 14 11859 0.00 0.72 -4.09 3.91 8 0.01 > > futureexPER<-lmer(F2S43 ~ RACE + SEX + DIS_PEREXC + BYS45C + DIS_PEREXC*BYS45C + G8LUNCH + DIS_PEREXC:G8LUNCH + BYS45C:G8LUNCH + BYS45C:DIS_PEREXC:G8LUNCH + + (1 + DIS_PEREXC|SCH_ID), data=futureexper) > summary(futureexPER) Linear mixed model fit by REML. t-tests use Satterthwaite's method ['lmerModLmerTest'] Formula: F2S43 ~ RACE + SEX + DIS_PEREXC + BYS45C + DIS_PEREXC * BYS45C + G8LUNCH + DIS_PEREXC:G8LUNCH + BYS45C:G8LUNCH + BYS45C:DIS_PEREXC:G8LUNCH + (1 + DIS_PEREXC | SCH_ID) Data: futureexper REML criterion at convergence: 27670.8 Scaled residuals: Min 1Q Median 3Q Max -4.9228 -0.6443 0.0644 0.6821 2.9651 Random effects: Groups Name Variance Std.Dev. Corr SCH_ID (Intercept) 0.04041 0.2010 DIS_PEREXC 0.01778 0.1333 -0.03 Residual 0.56433 0.7512 Number of obs: 11859, groups: SCH_ID, 955 Fixed effects: Estimate Std. Error df t value Pr(>|t|) (Intercept) 2.980e+00 1.363e-02 1.976e+03 218.672 < 2e-16 *** RACE 6.387e-02 1.848e-02 8.673e+03 3.456 0.000551 *** SEX 7.194e-02 1.428e-02 1.176e+04 5.037 4.8e-07 *** DIS_PEREXC 1.307e-01 1.460e-02 1.394e+03 8.956 < 2e-16 *** BYS45C 5.231e-01 1.078e-02 1.154e+04 48.540 < 2e-16 *** G8LUNCH -1.241e-01 3.337e-02 1.487e+03 -3.719 0.000207 *** DIS_PEREXC:BYS45C -7.798e-03 9.682e-03 2.782e+03 -0.805 0.420636 DIS_PEREXC:G8LUNCH -5.391e-02 3.922e-02 9.640e+02 -1.375 0.169605 BYS45C:G8LUNCH -5.724e-02 3.114e-02 1.179e+04 -1.838 0.066074 . DIS_PEREXC:BYS45C:G8LUNCH -2.244e-02 2.590e-02 2.453e+03 -0.866 0.386351 --- Signif. codes: 0 ‘***’ 0.001 ‘**’ 0.01 ‘*’ 0.05 ‘.’ 0.1 ‘ ’ 1 Correlation of Fixed Effects: (Intr) RACE SEX DIS_PEREXC BYS45C G8LUNC DIS_PEREXC:BYS45C DIS_PEREXC:G BYS45C: RACE -0.284 SEX -0.532 -0.013 DIS_PEREXC 0.078 -0.029 -0.008 BYS45C 0.013 -0.037 -0.054 0.445 G8LUNCH -0.183 -0.248 -0.006 -0.019 0.021 DIS_PEREXC:BYS45C 0.207 0.031 0.008 0.304 -0.088 -0.097 DIS_PEREXC:G -0.022 -0.010 0.001 -0.372 -0.165 0.082 -0.114 BYS45C:G8LU 0.009 0.000 0.001 -0.153 -0.345 0.060 0.030 0.399 DIS_PEREXC:BYS45C: -0.076 -0.010 -0.006 -0.114 0.033 0.267 -0.374 0.384 -0.166 > > > futureexPER2<-lmer(F2S43 ~ SEX + RACE + DIS_PEREXC + BYS45C + DIS_PEREXC*BYS45C + G8LUNCH + DIS_PEREXC:G8LUNCH + BYS45C:G8LUNCH + BYS45C:DIS_PEREXC:G8LUNCH + (1|SCH_ID), data=futureexper) > summary(futureexPER2) Linear mixed model fit by REML. t-tests use Satterthwaite's method ['lmerModLmerTest']

THE IMPACT OF THE DISCREPANCIES BETWEEN STUDENT AND PARENT 154
Formula: F2S43 ~ SEX + RACE + DIS_PEREXC + BYS45C + DIS_PEREXC * BYS45C + G8LUNCH + DIS_PEREXC:G8LUNCH + BYS45C:G8LUNCH + BYS45C:DIS_PEREXC:G8LUNCH + (1 | SCH_ID) Data: futureexper REML criterion at convergence: 27691.6 Scaled residuals: Min 1Q Median 3Q Max -4.8873 -0.6488 0.0639 0.6908 3.2272 Random effects: Groups Name Variance Std.Dev. SCH_ID (Intercept) 0.0406 0.2015 Residual 0.5733 0.7572 Number of obs: 11859, groups: SCH_ID, 955 Fixed effects: Estimate Std. Error df t value Pr(>|t|) (Intercept) 2.980e+00 1.365e-02 1.981e+03 218.258 < 2e-16 *** SEX 7.158e-02 1.431e-02 1.179e+04 5.003 5.72e-07 *** RACE 6.387e-02 1.850e-02 8.676e+03 3.453 0.000557 *** DIS_PEREXC 1.322e-01 1.352e-02 1.174e+04 9.772 < 2e-16 *** BYS45C 5.237e-01 1.079e-02 1.169e+04 48.526 < 2e-16 *** G8LUNCH -1.231e-01 3.341e-02 1.491e+03 -3.683 0.000239 *** DIS_PEREXC:BYS45C -6.306e-03 9.151e-03 1.166e+04 -0.689 0.490773 DIS_PEREXC:G8LUNCH -4.927e-02 3.548e-02 1.177e+04 -1.389 0.164880 BYS45C:G8LUNCH -5.650e-02 3.115e-02 1.184e+04 -1.814 0.069693 . DIS_PEREXC:BYS45C:G8LUNCH -1.886e-02 2.430e-02 1.168e+04 -0.776 0.437521 --- Signif. codes: 0 ‘***’ 0.001 ‘**’ 0.01 ‘*’ 0.05 ‘.’ 0.1 ‘ ’ 1 Correlation of Fixed Effects: (Intr) SEX RACE DIS_PEREXC BYS45C G8LUNC DIS_PEREXC:BYS45C DIS_PEREXC:G BYS45C: SEX -0.532 RACE -0.284 -0.013 DIS_PEREXC 0.090 -0.008 -0.030 BYS45C 0.013 -0.054 -0.036 0.475 G8LUNCH -0.183 -0.006 -0.248 -0.024 0.020 DIS_PEREXC:BYS45C 0.207 0.009 0.034 0.332 -0.095 -0.099 DIS_PEREXC:G -0.026 -0.001 -0.009 -0.381 -0.180 0.093 -0.127 BYS45C:G8LU 0.009 0.001 0.000 -0.164 -0.345 0.062 0.032 0.432 DIS_PEREXC:BYS45C: -0.076 -0.010 -0.009 -0.125 0.036 0.271 -0.377 0.386 -0.179 > > anova(futureexPER, futureexPER2) refitting model(s) with ML (instead of REML) Data: futureexper Models: futureexPER2: F2S43 ~ SEX + RACE + DIS_PEREXC + BYS45C + DIS_PEREXC * BYS45C + futureexPER2: G8LUNCH + DIS_PEREXC:G8LUNCH + BYS45C:G8LUNCH + BYS45C:DIS_PEREXC:G8LUNCH + futureexPER2: (1 | SCH_ID) futureexPER: F2S43 ~ RACE + SEX + DIS_PEREXC + BYS45C + DIS_PEREXC * BYS45C + futureexPER: G8LUNCH + DIS_PEREXC:G8LUNCH + BYS45C:G8LUNCH + BYS45C:DIS_PEREXC:G8LUNCH + futureexPER: (1 + DIS_PEREXC | SCH_ID) Df AIC BIC logLik deviance Chisq Chi Df Pr(>Chisq) futureexPER2 12 27652 27740 -13814 27628 futureexPER 14 27636 27739 -13804 27608 20.137 2 4.24e-05 *** --- Signif. codes: 0 ‘***’ 0.001 ‘**’ 0.01 ‘*’ 0.05 ‘.’ 0.1 ‘ ’ 1