the impact of title i program funding through a comparison
TRANSCRIPT

Loyola University Chicago Loyola University Chicago
Loyola eCommons Loyola eCommons
Dissertations Theses and Dissertations
2011
The Impact of Title I Program Funding Through a Comparison of The Impact of Title I Program Funding Through a Comparison of
Schoolwide Assistance and Targeted Assistance on Fifth Grade Schoolwide Assistance and Targeted Assistance on Fifth Grade
Reading Achievement Scores in Illinois: Implications for Reading Achievement Scores in Illinois: Implications for
Leadership in Public Education Leadership in Public Education
Michael E. Robey Loyola University Chicago
Follow this and additional works at: https://ecommons.luc.edu/luc_diss
Part of the Educational Administration and Supervision Commons
Recommended Citation Recommended Citation Robey, Michael E., "The Impact of Title I Program Funding Through a Comparison of Schoolwide Assistance and Targeted Assistance on Fifth Grade Reading Achievement Scores in Illinois: Implications for Leadership in Public Education" (2011). Dissertations. 53. https://ecommons.luc.edu/luc_diss/53
This Dissertation is brought to you for free and open access by the Theses and Dissertations at Loyola eCommons. It has been accepted for inclusion in Dissertations by an authorized administrator of Loyola eCommons. For more information, please contact [email protected].
This work is licensed under a Creative Commons Attribution-Noncommercial-No Derivative Works 3.0 License. Copyright © 2011 Michael E. Robey
LOYOLA UNIVERSITY CHICAGO
THE IMPACT OF TITLE I PROGRAM FUNDING THROUGH A COMPARISON OF
SCHOOLWIDE ASSISTANCE AND TARGETED ASSISTANCE ON FIFTH GRADE
READING ACHIEVEMENT SCORES IN ILLINOIS: IMPLICATIONS FOR
LEADERSHIP IN PUBLIC EDUCATION
A DISSERTATION SUBMITTED TO
THE FACULTY OF THE GRADUATE SCHOOL OF EDUCATION
IN CANDIDACY FOR THE DEGREE OF
DOCTOR OF EDUCATION
PROGRAM IN ADMINISTRATION AND SUPERVISION
BY
MICHAEL E. ROBEY
CHICAGO, ILLINOIS
MAY 2011

Copyright by Michael E. Robey, 2011 All rights reserved.

iii
ACKNOWLEDGEMENTS
St. Augustine said, “You know your true self only when tested”. The process of
completing a dissertation certainly does test you. I have been fortunate to receive the
expertise, guidance, insight, and inspiration from many individuals who have been a
constant source of encouragement to me during the many years involved in completing
the dissertation process. They helped me endure this test in life and learn more about my
true self.
Sincere gratitude must go to Dr. Vivian Gordon, my committee chair for her time,
effort, and commitment to this project. Her insight and guidance were valuable in helping
me maintain the confidence required to continue. She displayed the proper balance of
guidance, prodding, and mentoring that was necessary. I am also grateful to Dr. Terri
Pigott and Dr. James Fritts for their support and assistance as members of my dissertation
committee and all of the members of the faculty at Loyola University.
I would like to thank Ryan Williams and Jennifer Munoz for their assistance with
the analysis of the data and formatting of the document. I am appreciative of their
commitment and personal interest in my project.
I am especially grateful to my family. Colleen, my wife, and my four children
Mary Pat, Tommy, Annie, and Jack had to suffer the unending time commitment and
display enormous patience while their father and husband took more free time from the
family to continue to work on “the paper”. Jesus once said, “I did not come to you

iv
because you were worthy. I won’t leave you because you are not” (Direction of our
Times, 2004). The loyalty and devotion of my family was necessary. I could not have
completed this without their understanding. Many times it was not clear if the end would
ever be in sight. An anonymous quote, “If God brings you to it, he will bring you through
it”. The continued faith my family had in me and God is the enduring memory that I will
hold. There was certainly a bigger hand guiding me through completion of this project.
My faith has sustained and deepened through this process. Their love and understanding
are appreciated more than they know.

DEDICATION
This dissertation is dedicated to the memory of my father, Elmer Robey, who
passed away before having the opportunity to see it completed. It was a firm dedication to
education from both him and my mother, Mary Robey, which kept me in college in my
early days. Without their constant encouragement and high expectations, this day would
never have come.
vi
TABLE OF CONTENTS
ACKNOWLEDGEMENTS............................................................................................... iii LIST OF TABLES............................................................................................................. ix LIST OF FIGURES ............................................................................................................ x LIST OF ABBREVIATIONS/GLOSSARY...................................................................... xi ABSTRACT..................................................................................................................... xiv CHAPTER I: INTRODUCTION........................................................................................ 1
Purpose..................................................................................................................... 1 Poverty’s Impact on the Success of American Children.......................................... 2 Pertinent Statutes Impacting the Education of Low Income Students..................... 6 Dilemma School Leaders Face with Title I Funds................................................... 9 Research Question.................................................................................................. 11 Organization of the Study ...................................................................................... 11 Limitations of the Study......................................................................................... 13
CHAPTER II: REVIEW OF THE LITERATURE .......................................................... 18
Historical Nature of Funding in Education ............................................................ 18 No Child Left Behind............................................................................................. 27 Title I, Part A.......................................................................................................... 32 Choosing Schoolwide and Targeted Assistance Programs .................................... 37 Schoolwide Assistance Program Guidelines.......................................................... 40 Targeted Assistance Program Guidelines .............................................................. 43 Title I Indicators of Success................................................................................... 45 Reading Achievement ............................................................................................ 47 The Role of Leadership in Achievement ............................................................... 53 Funding and Achievement Research...................................................................... 59
CHAPTER III: METHODOLOGY .................................................................................. 66
Statement of the Problem....................................................................................... 66 Hypothesis.............................................................................................................. 67 Research Question.................................................................................................. 68 Population .............................................................................................................. 68 Choice of Fifth Grade Students.............................................................................. 69 Use of ISAT for Fifth Grade .................................................................................. 70 Title I Funding: Schoolwide Assistance and Targeted Assistance ........................ 71 The School Leaders Decision-making Role........................................................... 73 Demographic Area ................................................................................................. 75 Choosing the Sample Population and Refining the Study ..................................... 76 Institutional Review Board Approval .................................................................... 80
vii
Procedure for Gathering Data on the Target Population........................................ 80 Procedure for Identifying School Leaders ............................................................. 82 Procedure for Analyzing Data................................................................................ 83 Limitations of the Study......................................................................................... 84
CHAPTER IV: PRESENTATION AND ANALYSIS OF THE DATA.......................... 88
Sample Population Overview and Characteristics ................................................. 89 Data that Emerged as a Result of Principal Contact .............................................. 92 Racial Composition of the Sample Population ...................................................... 96 Low Income Characteristics of the Sample Population ....................................... 102 Low Income Percentage and Achievement Scores .............................................. 106 White Population and Achievement Scores......................................................... 109 Black Population and Achievement Scores ......................................................... 112 Hispanic Population and Achievement Scores .................................................... 115 Schoolwide and Targeted Assistance and Achievement Scores .......................... 118 Conclusion ........................................................................................................... 121
CHAPTER V: FINDINGS, CONCLUSIONS AND RECOMMENDATIONS ............ 124
Research Question................................................................................................ 124 Sample Population Overview and Characteristics ............................................... 124 Racial Composition of the Sample Population .................................................... 126 White Population and Achievement Scores......................................................... 128 Black Population and Achievement Scores ......................................................... 129 Hispanic Population and Achievement Scores .................................................... 129 Low Income Characteristics of the Sample Population ....................................... 130 Low Income Percentage and Achievement Scores .............................................. 132 Schoolwide and Targeted Assistance and Achievement Scores .......................... 135 Data that Emerged as a Result of Principal Contact ............................................ 137 Summary of Findings........................................................................................... 141 Recommendations................................................................................................ 143 Further Research .................................................................................................. 145
APPENDIX A: ACHIEVEMENT GAP BETWEEN LOW INCOME AND NON-LOW INCOME STUDENTS IN READING IN ILLINOIS IN THIRD, FIFTH, AND EIGHTH GRADES FROM 2002-2008 ................................................ 148 APPENDIX B: FREEDOM OF INFORMATION ACT REQUEST LETTER............. 150 APPENDIX C: SCRIPT FOR CONTACTING SELECTED SCHOOL........................ 152 APPENDIX D: COMPREHENSIVE DATA FOR SCHOOLS IN THE SAMPLE POPULATION ............................................................................................................ 154 REFERENCES ............................................................................................................... 156

viii
VITA............................................................................................................................... 165

ix
LIST OF TABLES
Table 1: Sample Population Overview and Characteristics.............................................. 90
Table 2: Data that Emerged as a Result of Principal Contact........................................... 94
Table 3: Racial Composition of Schoolwide Assistance Population................................ 97
Table 4: Racial Composition of Targeted Assistance Population .................................... 98
Table 5: Low Income Characteristics of Sample Population.......................................... 103
Table 6: Schoolwide and Targeted Assistance and Achievement Scores....................... 118

x
LIST OF FIGURES
Figure 1: Racial Composition of Schoolwide and Targeted Assistance Population ...... 101
Figure 2: Low Income Characteristics of Sample Population ........................................ 105
Figure 3: Low Income Percentage and Achievement ..................................................... 106
Figure 4: White Population Percentage and Achievement ............................................. 109
Figure 5: Black Population Percentage and Achievement.............................................. 112
Figure 6: Hispanic Population Percentage and Achievement......................................... 115
Figure 7: Schoolwide and Targeted Assistance and Achievement Scores ..................... 120

xi
LIST OF ABBREVIATIONS/GLOSSARY
Categorical funding: Funding targeted to an area based upon specific purpose or
concern to be addressed. Title I funding is considered categorical funding for low
income, disadvantaged students.
ESEA: Elementary and Secondary Education Act of 1965. Federal law intended
to work with public education to serve the academic needs of students. A major focus in
this law was the “War on Poverty” with Title I as the primary federal financial
component (ESEA, 1965).
IIRC: Interactive Illinois Report Card, http://iirc.niu.edu. Web site designated by
Northern Illinois University to house Illinois state data on student achievement and
testing accountability. This site contains ISAT data from 1997 to the present year (NIU,
2008).
Incidental Inclusion: When students are not identified specifically as Title I
students in a targeted assistance school, yet still benefit indirectly from a service provided
by Title I funds (TPG, 2007). Students may receive services simply by being present
when an identified student is benefiting from the instruction, resources, or small group
activity. For the purpose of this study, these scores were not excluded from the final
results.

xii
ISAT: Illinois Scholastic Achievement Test. Accountability measure used by
Illinois to measure the yearly progress of students in reading and math from third through
eighth grade.
LEA: Local Education Agency. The governing body for a school or district that
has the authority to make educational and financial decisions for the school or district.
Low Income: Measured by a student’s eligibility for a free or reduced lunch
program as determined by federal government criteria.
NCLB: No Child Left Behind. Federal law signed into effect January 8, 2002 as a
reauthorization of the Elementary and Secondary Education Act. The law serves to
increase achievement for all students originally starting with reading and math.
PSAE: Prairie State Achievement Examination. The achievement test for Illinois
high school students that is administered at 11th grade only. The Illinois State Board of
Education has acknowledged little correlation exists between the PSAE and ISAT (ISBE,
2007).
Reading achievement: Identified for the purpose of this study as students meeting
or exceeding standards on the Illinois Standards Achievement Test.
Schoolwide assistance: Use of Title I funds to upgrade the entire educational
program of the school. Funds can be used to service all children in the school (TPG,
2007).
School leader: Any administrator responsible for making decisions about the
educational programs of an individual school or for the district. For the purpose of this
study, a school leader can be anyone from a principal to a reading director to a
superintendent.
xiii
SEA: State Educational Association. Governing body for the state that makes
educational and financial decisions for that individual state.
Targeted assistance: Use of Title I funds to “target” a specific group of students
and support programs for eligible children, i.e., children who are failing or at risk of
failing to meet state standards (TPG, 2007).
Title I: A section of Elementary and Secondary Education Act. Federal assistance
grants aimed at improving the academic achievement of the disadvantaged. Funding that
is distributed to schools/districts based upon the number of low income students in
attendance. Title I is one of the first federal categorical funding initiatives.

xiv
ABSTRACT
The ability to read with proficiency and comprehension is one of the basic goals
of our educational system. Adequacy of funding these goals, particularly for lower
income students, continues to be a challenge. Despite the efforts of a variety of
educational reforms many students, particularly the economically disadvantaged,
continue to struggle with basic reading skills.
The intent of this study is to help school leaders in identifying whether
schoolwide or targeted assistance programs funded through Title I schools are associated
with higher reading achievement. The study measured reading achievement for fifth
grade students in Illinois using data from the Illinois Scholastic Achievement Test from
2006 to 2007 and compared the results of selected schools in the 40% to 90% low income
range with populations of 200 to 1,00 students in Northern Cook County and Lake
County, Illinois. Schools used for this study were split between those using schoolwide
assistance and those using targeted assistance.
The study provides information that indicates the impact of Title I funding on
reading achievement by comparing the use of schoolwide and targeted assistance. The
outcome of this study is important to school leaders in determining the general direction
to take with school programs when receiving federal funding through Title I.

1
CHAPTER I
INTRODUCTION
Purpose
“… opportunity is a prerequisite for success, whereas success is not necessarily a condition of opportunity” (Mullin & Brown, 2008, p. 5).
Education is frequently noted as the means to success for our nation’s future. The
ability to read and comprehend material is one of the most fundamental of all educational
skills and the core building block for all other learning (Lewis, 1996; National Reading
Panel [NRP], 2000; National Research Council [NRC], 1998). If opportunity to a high
quality education is indeed a prerequisite to success for students, then states and local
school leaders must find a way to “level the playing field” for low income and minority
students (Mullin & Brown, 2008).
The No Child Left Behind (NCLB, 2002) act has increased an emphasis on
meeting the educational needs of all students, including low income students. That
emphasis has been primarily structured around math and reading achievement (No Child
Left Behind [NCLB], 2002). Reading is generally considered the key to educational
success for students (Allington & Walmsley, 2007; NRP, 2000). The vast majority of
students leave our educational system reading fairly well. Concerns naturally arise about
those who do not and students who come from poor families are more likely to land in
this group than their more advantaged peers (Allington & Walmsley, 2007). The Title I
funding Section A of the Elementary and Secondary Education Act (ESEA, 1965) was

2
the largest response by the federal government for providing equal opportunity for
students who have fewer benefits due to economic hardship (Sack-Min, 2009; Tosh,
2003; Zigler, 2009). Title I allows school leaders with 40% or more of the students in
their local school classified as low income the opportunity to choose either a schoolwide
program or a targeted assistance model (Thompson Publishing Group [TPG], 2007). This
study will examine whether schoolwide assistance or targeted assistance through Title I is
associated with higher achievement in fifth grade reading scores as measured through the
Illinois Scholastic Achievement Test. The ultimate generalization of the study will be to
help school leaders determine the impact of schoolwide assistance and targeted assistance
on the reading achievement to better inform their decision-making efforts when
allocating Title I funds.
Poverty’s Impact on the Success of American Children
In the State of the Union address of 1964, the President’s Council of Economic
Advisors reported an inverse relationship between the education of the head of a family
and the prevalence of poverty and declared “a war on poverty” (Payne, 2005; Zigler,
2009) strongly linking education and poverty in America. Least we think that situations
of dire poverty are confined to other countries, United Nations Children’s Fund
(UNICEF, 2007) reminds us that the situation is more dismal in the United States than
many believe. Students in the United States fare poorly, in the bottom half of nearly all
indicators of poverty, when compared with students of other wealthy nations. UNICEF
(2007) uses the term poverty, which is even more restrictive than the federal definition of
low income which is used in allocating Title I funds and that will be used in this study.

3
UNICEF (2007) continues by saying that poverty can have devastating effects on the
educational lives of children. Their report, Child poverty in perspective: An overview of
child well-being in rich countries, states that “…when prolonged, poverty is likely to
have an effect on children’s health, cognitive development, achievement at school,
aspirations, self–perceptions, relationships, risk behaviors, and employment
prospects”(UNICEF, 2007, p. 39).
Thus, a child’s cognitive, physical, and educational development is severely
hampered by the influence of poverty preventing their full potential from being realized
(UNICEF, 2007). Parents in poverty often are preoccupied fending for basic needs and
less able to contribute in meaningful ways to their child’s education (Richmond, 2008).
Children are left unable to develop resources that are vital to their well-being and overall
development (Payne, 2008).
Poverty impacts children through a variety of influences outside of the school
environment. Children living in poverty have higher rates of lead poisoning, are not as
well fed, relocate more frequently, watch more television, are read to less, develop their
verbal abilities slower and less deeply, and do not have access to adults who can engage
them in intellectually developmental ways (Lewis, 2004; Lewis, 2008; Walker Tileston &
Darling, 2008). When under-resourced, children of poverty enter the academic world at a
disadvantage. The disadvantages continue to grow over their academic careers resulting
in lower achievement than their more advantaged peers (Payne, 2008). The less educated
and poor population is in poorer health with a shorter life expectancy, has lower paying
jobs and more frequently is unemployed, and lands in prison at a higher rate and for a

4
longer duration than their more educated and well-off peers (Evans & Schamberg, 2009;
Kirp, 2008).
Better resources enable the poor to make a difference in the overall quality of
their lives. Higher income levels allow parents to provide safer home environment for
their children, healthier food choices, and better healthcare. Communities can provide
better parks, schools, and libraries enabling parents to give their children a more
enriching educational experience (Duncan & Brooks-Gunn, 1997). An increase in
available income would aide in the overall development of children increasing their
availability to learn. The poor are a product of their environment in that when parents are
better educated themselves; they are more able to provide the approach for their children
to navigate the system better and to escape the detriments of poverty (Kozol, 1991).
Parents with less income tend to lack the education, the political insight, or understanding
of the educational system to enable their children to effectively use an education to their
benefit according to Kozol. That family income level has a greater impact on a child’s
achievement in school than any other factor suggests that there is more at work than
simple cognitive differences (Duncan & Brooks-Gunn, 1997; Evans & Schamberg,
2009).
Payne (2005) considers education the key to getting students out of or keeping
them out of the cycle of poverty. Payne states that people will leave poverty for one of
four reasons: 1) They have a goal or vision of something they want to be, 2) the situation
is so painful that any alternative would be better, 3) a mentor or role model shows them a
different way to live and convinces them that it is possible for them to live in a different

5
way, or 4) they have a specific skill or talent that provides the opportunity. Payne (2005)
also notes that this transformation can happen through interactions that take place in the
educational system. Education is often seen as a means to reversing the cycle of poverty
for the disadvantaged (Lewis, 1996; Payne 2005; Walker Tileston & Darling, 2008).
Unfortunately, the stark reality is that the poor and disadvantaged often suffer not
only from the effects of poverty, but from a poor schooling experience as well. This
experience compounds and creates a fundamental inequality in the education between the
advantaged and disadvantaged (Payne, 2005; Sawchuck, 2009). Poor and minority
children more often receive instruction from teachers who are less experienced, teaching
out of their field more frequently, less qualified, and generally considered substandard to
their counterparts in higher income areas (Sawchuck, 2009).
A moralistic perspective would state that there is no limit to the price one can
place on a child’s education, particularly when we are speaking of children who come
with the disadvantages associated with poverty (Hoff & McNeil, 2008). The number of
children living in poverty continues to grow around the world (Samuelson, 2007)
however; the reality is that there are increasingly limited funds available for education
with the current economic conditions and there will always be a finite amount of funding
available for public initiatives such as education (AP, 2008; Malone & Napolitano, 2009;
Rado, 2009).
School leaders and politicians alike have argued that a higher level financing is
required with the increased demands and higher standards imposed through No Child
Left Behind (Quaid & Pope, 2009). Some policy makers have argued that the amount of

6
funding is at an adequate level and simply needs to be spent more efficiently to provide
for the needs imposed (Hill, 2008; Podesta & Brown, 2008). The premise that increased
funding will always result in corresponding increases in achievement is not shared by all.
Samuelson (1997) argues that money does not necessarily change the outcome for those
living in poverty and that simply putting more finances into education for children living
in poverty is not an answer by itself. An increase of funding alone is not the answer and
more money for the poor and education is simply not as important as Americans believe
it is, but rather larger changes in the educational system are required (Samuelson, 1997).
Pertinent Statutes Impacting the Education of Low Income Students
With the implementation of Public Law 89-10, the Elementary and Secondary
Education Act of 1965, education was for the first time clearly tied to a federal initiative
designed to create a more uniform educational plane for low income students (Bailey &
Mosher; 1968, Klein, 2009; Payne, 2005; Zigler, 2009). The Title I section of ESEA
(1965) targeted categorical funds toward enhancing low income students’ education
(ESEA, 1965). The intent of the Title I section of ESEA (1965) was to provide more
education funding to schools with higher numbers of students living in poverty and to
provide these students with an equal opportunity of receiving a quality education (Payne,
2005). Funding was seen as a means of improving the education of students living in
poverty. This primary notion carries through today with the reauthorization of the
original ESEA (1965) into the No Child Left Behind act. The alterations to Title I
through NCLB (2002) have been made in an overt attempt to focus the attention of

7
school leaders on the learning of low income students (Podesta & Brown, 2008; Sack-
Min, 2009).
Over 100 billion dollars has been spent by the federal government on education
since the passage of the Elementary and Secondary Education Act of 1965 (White House,
2002 & NCLB, 2002). In 2008 alone, over $13.9 billion was spent to serve over 12.5
million students (Institute of Education Sciences [IES], 2007). This study intends to seek
if the funding provided by the Title I section of No Child Left Behind legislation is more
effective at impacting the achievement of low income students in reading when school
leaders choose to implement schoolwide use of funds or to target their Title I funds to
specific populations.
No Child Left Behind requires that all students regardless of race, ethnicity,
income level, special education status, or language proficiency, achieve established state
achievement targets for learning by 2014 (Hoff, 2008; NCLB, 2002). NCLB specifically
spells out subgroups, including the disadvantaged and low income, for the first time in
history that schools and states must track as groups of students at the same targeted levels
of achievement as all other students (Hoff, 2008; NCLB, 2002). According to Rothstein
(2007) the premise behind NCLB (2002) is that poor and minority students will perform
better if they are provided a higher quality education.
Section 1001 Statement of Purpose of Title I amended the Elementary and
Secondary Education Act to give the following direction:
The purpose of this title is to ensure that all children have a fair, equal, and significant opportunity to obtain a high quality education and reach, at a minimum, proficiency on challenging State academic achievement standards and state academic assessments. (NCLB, 2002)
8
No Child Left Behind has directed school leaders to use Title I categorical funds to focus
on disadvantaged children in the areas of reading and math (Hoff, 2008; TPG, 2007).
Title I is considered the key fiduciary component of NCLB (2002), the Bush
administration’s primary educational policy (Hoff, 2008). Many educators have disagreed
with the foundational components and level of success of NCLB (2002) has had, but Hoff
(2008) notes that most educators would generally agree that no law has had a greater
impact on education since the implementation of the original Elementary and Secondary
Act in 1965, particularly when dealing with the disadvantaged.
No Child Left Behind further states that goals of Title I can be achieved by
meeting the reading needs of our most needy children and meeting these needs will close
the achievement gap between the lower income population and their more advantaged
peers (NCLB, 2002). Reading is often considered the “gate keeper” to all learning
(Lewis, 1996; NRP, 2000). When disadvantaged youth enter the education system, they
are often behind their more advantaged peers who have had the benefit of growing up in
an environment more conducive to establishing the norms necessary for learning in our
formal education system (Hoff, 2008; Payne, 2007). Title I, in the early stages, seeks to
level the field with the disadvantaged for basic educational needs to better prepare
disadvantaged youth for an entry into formal education. Title I further seeks to continue
serving low income students throughout their school years to equalize experiences that
may be lacking due to poverty (Hoff, 2008; Zigler, 2009).
No Child Left Behind has given state and school leaders greater flexibility with
the use of Title I funds (TPG, 2007). The goal is to allow state and school leaders the
9
ability to focus funds on students who are in most need. Title I notes that states are to
give priority to local education agencies that have the lowest achieving schools and
students, schools that demonstrate the greatest need, and districts that have demonstrated
the greatest commitment to their lowest achieving schools through their school
improvement plans (NCLB, 2002). States have been given more control over how to
distribute funds and school leaders can demonstrate the desire to more effectively serve
students through their school improvement plans (NCLB, 2002).
Dilemma School Leaders Face with Title I Funds
Under NCLB (2002), school leaders were given the option of choosing either a
schoolwide program or in targeting their assistance with the funds provided by Title I
depending on the level of poverty that exists in their building. If the overall level of low
income, free or reduced lunch eligible students, is at 40% or higher school leaders may
choose whichever program they believe will most benefit their students (IES, 2007;
NCLB, 2002; United States Department of Education [USDE], 2002). From the school
year 1994-95 to the school year 2004-2005, the number of school leaders choosing
schoolwide assistance rose from 10% to 58% (USDE, 2007). This study seeks to find if
the increase in schoolwide use of funding is associated with higher achievement in fifth
grade. The current trend is a movement toward schoolwide use of funds and school
leaders face the choice of schoolwide or targeted assistance with very little guidance or
research to support their decision. The purpose of this study is to examine whether
schoolwide assistance or targeted assistance through Title I is associated with higher
achievement reading scores in fifth grade as measured through ISAT. The results of this

10
study will help school leaders determine if it is more effective for reading achievement to
use Title I funds in a schoolwide manner or if it is more effective to target their
assistance.
Continued and best use of Title I funds is an important issue for school leaders
because the achievement scores of low income students still lag behind the scores of their
more advantaged peers. Low income students in Illinois have scored lower on the Illinois
Scholastic Achievement Test, ISAT, every year: 34% to 15% below their more
advantaged peers in 3rd grade since 2002, 34% to 19% lower in 5th grade, and 30% to
17% lower in 8th grade (Northern Illinois University [NIU], 2008). By reviewing these
data from the Illinois Interactive Report Card in Appendix A, one will see that low
income students in Illinois are not performing to the same level as their more advantaged
peers. School leaders are under increasing pressure to bring all subgroup populations up
to the target goals established by the state and federal government since the inception of
the No Child Left Behind act making the proper use of federal Title I funds an
increasingly more important issue (Mintrop, 2008; Sack-Min, 2009).
There would seem to be a common sense relationship that would say if a school is
better financed, that the students will be better enabled to meet their academic goals
(Klein, 2009). This study will set out to determine what research says about the use of
funds through Title I for schoolwide assistance and targeted assistance and give school
leaders a better sense of which direction to turn when using federal funds from Title I. Is
either schoolwide or targeted use of funding associated with higher reading achievement
for Illinois students in fifth grade? Hill (2008) says that even when adequate funding is

11
available in schools, that if it is not appropriately focused it will not necessarily produce
desired increases in student achievement. Determining whether to apply Title I funds to a
targeted set of students or whether to institute a schoolwide program can mean a
substantial shift in financing of building level resources. This study will provide evidence
of the effectiveness if increasing the overall reading achievement of the school through
schoolwide assistance is more effective or if the targeted assistance at selected schools
results in higher achievement scores as measured by fifth grade ISAT reading.
Research Question
This study will address the following question:
When Illinois school leaders of buildings with over 40% of their school
population identified as low income choose between Title I schoolwide assistance or
targeted assistance programs, which method of distributing Title I funds is associated
with higher reading achievement scores in fifth grade as measured by ISAT?
Organization of the Study
Chapter I introduces the study describing the purpose, the impact of poverty on
students in the United States, relevant statutes impacting the education of low income
students, the dilemma school leaders face with Title I funding, the research question, the
organization of the study, definitions of terms, and the limitations of this study.
Chapter II presents a review of educational literature pertinent to the topics of
funding and reading achievement. Subjects included in this chapter are the historical
nature of funding in education, No Child Left Behind, Title I, choosing schoolwide and
targeted assistance, schoolwide guidelines, targeted assistance guidelines, reading

12
achievement, the role of leadership in achievement, and funding and achievement
research.
Chapter III includes a statement of the research problem, states the hypothesis,
lists the research question, describes the population studied, the choice of fifth grade
students, the use of ISAT for fifth grade, the two choices of Title I funding options in
schoolwide and targeted assistance, the school leaders decision-making role, the
demographic area of the sample population, choosing the sample population and refining
the study, the IRB approval process, the procedure used for gathering data on the sample
population, the procedure for identifying the school leader, the procedure for analyzing
the data, and the limitations of the study.
Chapter IV provides the results of the data analysis. This includes an overview of
the sample population, data that emerged as a result of contacting principals, the racial
composition of the sample population, the low income characteristics of the sample
population, the relationship between low income level and achievement scores, the
relationship between race and achievement scores using aggregate school-level data, and
the association of schoolwide and targeted assistance with achievement scores.
Schoolwide and targeted assistance are also compared descriptively in terms of racial
composition, socioeconomic status, and enrollment.
Chapter V summarizes the findings including conclusions and recommendations
for further study and action. The chapter begins with a statement of the research question,
describes findings from the sample population characteristic data, the racial composition
data, findings from the White population and achievement, findings from the Black

13
population and achievement, Hispanic population and achievement, the low income
characteristics of the sample population, the impact of schoolwide and targeted assistance
on achievement, data that emerged from principal contact, a summary of the findings,
recommendations, and suggestions for further research.
Appendix A includes information about the achievement gap in Illinois
Appendix B is a copy of the Freedom of Information Act request sent to the
Illinois State Board of Education.
Appendix C is a copy of the script used when contacting schools to verify the use
of Title I funds.
Appendix D includes complete data for all the schools on the sample population.
Limitations of the Study
The findings of this study are limited by several factors. Some of the limiting
factors are complexities in generalizing data from Illinois to the rest of the nation because
each state has set its own standards and target goals for achievement under NCLB (2002),
the continual changing nature of achievement measures over time, the diversity of local
communities and schools, and the current economic times during a recessionary period.
One limitation on a full-scale national study is that each state has set its own
standards and target goals for achievement under NCLB (2002). This provides an array of
widely varying standards by which students across the country are evaluated. Each state
has been given the right under NCLB (2002) to determine what standards it will measure
and what type of assessment it will use to measure those standards. Naturally there is a
tremendous variance in the emphasis of standards measured and in the quality of the
14
assessment tools. Some state standards are quite rigorous and accurately applied to
measure growth in students. Other states have not identified appropriately rigorous
standards and have not set up measures that will accurately determine if students are
making progress toward those standards (Popham, 2004). This lack of standardization
among states in terms of tested items, the incremental steps of progress in meeting the
requirements of NCLB (2002), and the assessment used would make it very difficult to
complete a comparative study across the entire nation. This limits the researcher’s study
to results from Illinois alone.
Some states, such as Illinois, have changed the assessment used over the course of
the existence of No Child Left Behind (Aarons, 2009) making a comparative study
virtually impossible to complete with long term data. States have tended to first retract
the overall testing and type of testing prior to complying with the No Child Left Behind
law. Illinois is an example of a state that altered the testing bank of questions
significantly for the 2005 ISAT. This has caused difficulty in comparing pre-2005 data to
data after 2005. According to the Illinois State Board of Education (ISBE, 2007), fifth
grade reading scores were not significantly affected, another reason this study only
focused on fifth grade scores (ISBE, 2007; NIU, 2008). Nonetheless, the study
acknowledges the use of data prior to 2005 may not provide a precise comparison of
achievement and that a limit of this study is that it applies only to the selected schools.
Illinois is addressing concerns that there is a potential disconnect between the
elementary and high school assessments which will result in a change of the ISAT in the
year 2011 or later (Leveque, 2009). In an effort to clarify and reduce standards that were

15
developed in 1997, ISBE (2007) has voted to become the 34th state to join the American
Diploma Project which will help review the Illinois standards against national and
international standards. These include the American Diploma Project standards for
college and work readiness, the National Assessment for Education Progress, and the
Massachusetts Science and Technology Engineering Curriculum Framework (Leveque,
2009). ISBE (2007) will work with the Illinois Community College Board, the Illinois
Board of Higher Education, the Illinois Business Roundtable, and the Governor’s Office
in a process that is expected to take between 18 to 24 months beginning in March of 2009
(Leveque, 2009).
The study attempted to control for location by choosing only schools located in
suburban collar counties of Chicago. Illinois is an extremely diverse state. This study has
limited for demographic location by restricting the schools to a suburban area of Chicago.
The researcher acknowledges the regional limits of the study to the immediate Chicago
suburban area which may not be transferable to a broader population in a different
demographic area.
Care was taken to account for the size of schools by selecting schools identified
from IIRC data in the 200-1000 student population range and for low income level by
selecting schools in the 40-90% range. Schools in this range of low income would have
the option of selecting their allocation method. The study accounts for variables of
ethnicity by including the covariates of number of White, Hispanic, and Black students.
This adjustment allows the researcher to reduce the observed variation between
schoolwide allocations and targeted assistance methods of distributing funds, caused not
16
by the treatment itself but by variation of the covariates. The study chose to focus only on
the use of schoolwide and targeted funding; so results may or may not extend beyond the
sample population. This study does not attempt to answer questions for all demographic
conditions; therefore, it is limited in scope only to similar populations. This study did not
attempt to account for all variations of low income students that would be possible. The
hope is that the study can first determine if there is a significant impact on the selected
demographic group that may be expanded upon in further research if determinations
indicate a significant change results in the selected group.
Recent economic times in a recessionary period have altered the current structure
of state budgets and will likely continue to impact financial investments in state
education systems. With a Consumer Price Index of only 0.1% for the 2010 school year
(Malone & Napolitano, 2009; Rado, 2009), all of the counties in this study will be
impacted with severe financial issues because of the tax cap law of 1991. This means
little to no increases in revenue for the next few years while school districts are already
locked into contracts that call for much higher increases (Malone & Napolitano, 2009;
Rado, 2009). Projected additional budget cuts are likely and the investment in educational
budgets is likely to be more drastic since reserves have been drawn down or eliminated
and states, unlike the federal government, are not allowed to run a deficit (McNichol &
Lav, 2008). Cuts in state services are most likely to affect the group of students who
benefit most from Title I services. Social services provided by states are generally
focused to help the most disadvantaged.
17
By limiting the study to schools in the suburban Chicago area, the researcher
acknowledges that the results obtained will not occur in every situation outside of the
conditions set within this study. The limited number of schools decreases the accuracy of
the information and the reliability in predicting results from the generalized conclusions
obtained from the information in this study. This study is not exhaustive and all potential
factors may not have been accounted for that would affect the outcome.
Finally, the new administration at the national level will most certainly mean
changes in how federal laws are interpreted and implemented. The new federal stimulus
package includes significant increases in funding to Title I. This may alter perceptions of
the No Child Left Behind Act and the inadequacy of funding arguments that have been
made since 2002 (Klein, 2009; Sack-Min, 2009). How the increase in financing plays out
over time as to whether it changes the future of federal financing or proves to be a one-
time infusion, will impact how states and schools use the funds (Klein, 2009). Early
indications are that regardless of the outcome, a reauthorized education bill will pay close
attention to the needs of the disadvantaged (Sack-Min, 2009).
18
CHAPTER II
REVIEW OF THE LITERATURE
The review of related literature focuses on the historical nature of funding in
education, No Child Left Behind, Title I, choosing schoolwide or targeted assistance
programs, schoolwide assistance program guidelines, targeted assistance program
guidelines, reading achievement, the role of leadership in achievement, and funding and
achievement research.
Historical Nature of Funding in Education
One could conceivably argue that the role of the federal government in education
began with the formation of the preamble of the Constitution and the Declaration of
Independence, but most certainly with the passage of the Fourteenth Amendment with its
equal protection and due process clauses (Bailey & Mosher, 1968; Borman, Stringfield,
& Slavin, 2001). Whenever Americans are concerned about the equality of rights or the
disparity of educational opportunity, the federal government can intervene to provide
opportunities for the success of all individuals (Bailey & Mosher, 1968; Jennings, 1995).
The federal government has been involved in a number of efforts to equalize the
opportunity for all. A few examples are the formation of public schools in the 18th
century, the desegregation of schools through the Brown vs. the Board of Education
decision that led to a greater concern over the equality of education for the economically
disadvantaged, the educational initiatives of former president John F. Kennedy, and
19
finally the Civil Rights Act of 1964. These and many other initiatives led to the passage
of Public Law 89-10 the Elementary and Secondary Education Act (Borman et al., 2001).
Passed on April 9, 1965, the Elementary and Secondary Education Act,
commonly referred to as ESEA (1965), was considered to be the key piece of educational
legislation for President Lyndon Johnson’s “war on poverty” and widely heralded as a
guarantee of equality of education for all (ESEA, 1965; Podesta & Brown, 2008; Zigler,
2009). ESEA (1965) primarily targeted the economically disadvantaged. ESEA (1965)
provided special funding through Title I to allocate resources to meet the needs of
“educationally deprived” children, especially through compensatory programs for the
poor that would balance the inequity that existed between disadvantaged students and the
rest of the population (Hess & Rotherman, 2007; Zigler, 2009). This marked the entry
into education financing of the federal government through categorical funding, which is
specifically targeting funds to the needs of a particular group of students (Jennings,
1995). Prior to this time, federal funds had been generalized in the form of blanket grants
with the option on specific uses of the funds left to the state or local education
organization (Hess & Rotherman, 2007). Section 201 of the ESEA (1965) states:
In recognition of the special educational needs of low income families and the impact that concentrations of low income families have on the ability of local educational agencies to support adequate educational programs, the Congress hereby declares it to be the policy of the United States to provide financial assistance … to local educational agencies serving areas with concentrations of children from low income families to expand and improve their educational programs by various means … which contribute to meeting the special educational needs of educationally deprived children (ESEA, 1965).
20
President Johnson stated that with the passage of ESEA (1965), Congress had
taken the most significant step in United States history to helping American
schoolchildren (Bailey & Mosher, 1968). ESEA (1965) was developed under the
principle of “redress” which establishes that children from low income homes, who come
to school without the advantages of children from more affluent homes, require more
educational services to be successful (Bailey & Mosher, 1968). Johnson envisioned better
health and safety measures for urban schools, active recruitment of teachers to poor
schools and training when they arrived, after school programs of enrichment and
remediation, increased instructional materials and textbooks, and better libraries to name
a few means to help disadvantaged students gain the same advantages that their peers
already had been accustomed to receiving (Hess & Rotherman, 2007).
As part of the ESEA (1965), Title I allocated funding to schools with the highest
concentrations of low income students (ESEA, 1965; Hess & Rotherman, 2007). Head
Start, a preschool program for disadvantaged children aiming at equalizing equality of
opportunity based on “readiness” for the first grade, Follow-Through, to complement the
gains made by children who participated in the Head Start Program, bilingual education
which primarily targeted Spanish-speaking children in the mid to late 1960s, and other
guidance and counseling programs were established as a part of ESEA (1965). These
programs were all aimed to help disadvantaged youth overcome educational barriers to
success (ESEA, 1965; TPG, 2007). This type of funding is now recognized as
“categorical funding” (Srikantaiah & Swayhoover, 2008).

21
Following the enactment of ESEA (1965), President Johnson stated that Congress
had finally taken the most significant step of this century to provide help to all
schoolchildren after decades of stating the need in America. There had been attempts at
passing a school bill for all of children in the United States since 1870 without success
(ESEA, 1965). The federal government has taken a larger role in funding education ever
since. President Johnson argued that the school bill was wide-reaching, because "it will
offer new hope to tens of thousands of youngsters who need attention before they ever
enroll in the first grade," and will help "five million children of poor families overcome
their greatest barrier to progress: poverty" (ESEA, 1965). He also contended that there
was no other single piece of legislation that could help so many for so little cost: "for
every one of the billion dollars that we spend on this program, will come back tenfold as
schools dropouts change to school graduates” (ESEA, 1965). For the first time, federal
funding was used with the unmistakable intention of increasing achievement for a
specific group of students (Hess & Rotherman, 2007; Jennings, 1995; Srikantaiah &
Swayhoover, 2008).
President Johnson’s statements about the significance of Title I and ESEA (1965)
would soon be challenged with the release of Equality of Educational Opportunity report
by James Coleman and others in 1966. This has since become known as the Coleman
Report (Greenwald, Hedges, & Laine, 1996). The Coleman Report states that significant
funding of schools only has a modest impact on students at best. The study reports that
home and peers have a greater influence over student achievement than schools. The
debate over increasing resources to affect student achievement has raged since these

22
counterclaims over the effectiveness of funding on a child’s achievement in public
education (Greenwald et al., 1996).
Some took the Coleman Report to mean that schools could not provide the
necessary means to significantly alter a child’s academic path. The outside influences
from family and friends were too significant to overcome. Furthermore, they took this as
an opportunity to proclaim that focusing energy and financial support in schools was
unnecessary (Hill, 2008). Others have refuted the claim. Richmond (2008) notes that with
increased funding, schools can impact low income students in many ways such as: before
and after school programs and tutoring for struggling students, roving substitutes to
provide professional collaboration time for teachers, and family activities outside of the
school day are just a few opportunities that need additional funding infused so that
schools can provide for the disadvantaged. These strategies intervene to provide
opportunities to students that will positively impact their achievement levels through our
public schools (Richmond, 2008).
Disagreements in funding have resulted in resistance at the federal, state, and
local levels. One outcome of this continued battle is a wide disparity in the financing
from school district to school district across the nation. In Illinois, for example, the
average amount spent in schools ranges from less than $6,000 to over $20,000 per student
(Winfield, 2009). Such a disparity in financing education is bound to produce a disparity
in performance. Historically, schools that tend to perform the best, tend to have the
highest dollar amount per pupil expenditure (Rosborg, McGee, & Burgett, 2003). Voices
for Illinois Children, a nonprofit organization concerned for the well-being of Illinois

23
children, contends that the gap is increasing between the rich and the poor. They note
that, “there are great inequalities between school districts with high and low property
values” and that “test scores and graduation rates show notable disparities” between the
wealthy and the poor (Winfield, 2009).
Leveling the financial field will certainly help; however, increasing student
achievement is certainly a complicated matter. Barton (2004) identifies fourteen different
factors that have the highest impact on a student’s overall achievement. The fourteen
factors were: birth weight, lead poisoning, hunger and nutrition, reading to young
children, television watching, parent availability, student mobility, parent participation,
rigor of curriculum, teacher experience and attendance, teacher preparation, class size,
technology-assisted instruction, and school safety. While one could argue about the
importance and order of importance of each particular factor, it is difficult to argue that
any of these factors do not impact an individual student’s achievement. Which factor
impacts a particular child the most or what combination of factors is having the most
impact is very difficult to tell (Barton, 2004). This could be one reason behind the lack of
research directly linking funding and achievement.
How can one definitely state that funding for the school would or would not make
a difference? Walters (2009) argues that the larger issue may be in coordination of funds
from the state and local level to address the underlying causes of poverty. He notes that
we have so many issues to address and so many different programs designed to help
students that the better coordination may provide a better opportunity to impact the lives
of families living in poverty. Some of the root causes may be lack of adequate health
24
care, single parent or absent parent homes, parents with little or no formal education
themselves, kids who are parents themselves, unsafe neighborhoods, gangs, drugs,
language issues, and students who work long hours to supplement the family income
(Walters, 2009). There are many programs designed to address these issues, however,
there is minimal collaboration between the various groups responsible for helping
students and schools (Walters, 2009). Resources should be coordinated to help students
who are in most need (Walters, 2009). All of these factors influence the performance of
students in the building, yet how do we determine which is addressed and how equipped
are schools to deal with each or any of these conditions?
The advent of No Child Left Behind spurred a rash of lawsuits concerning
unfunded mandates and adequacy of funding. Americans have identified “lack of
adequate funding” as the number one problem facing our schools today for the sixth year
in a row (Bushaw & Gallup, 2008). Federal initiatives have been imposed on states which
have the legal responsibility of providing public education. The federal government still
produces less than ten percent of the financing for school districts, on average, across the
nation (Shen, 2000) demonstrating a disconnect between mandates and funding of those
mandates (Hoff, 2008; Walsh, 2009). The Illinois public education system relies heavily
on local property tax contributions to finance public schools. Local funding has long been
rooted in the system of government in Illinois, through the autonomy sought by local
educational institutions to oversee their own educational systems. This system of
governing and funding schools in Illinois is known as “local control” (Mullin & Brown,
2008; Verstengen & Driscoll, 2008). Inequities in funding are to be theoretically balanced
25
out through state and federal means so that all students are provided an equal opportunity
to receive a high quality education. With such disparities existing across Illinois, this
funding equalization from the state and federal government is certainly not a reality
(Mullin & Brown, 2008).
Illinois has the nation’s second largest school funding disparity, in the United
States, between low and high income schools ranking 49th out of all fifty states in
contributing to public school funding (Urban League, 2008; Winfield, 2009). State levels
of funding have fallen in Illinois, from 48% of the overall expenses that school incur in
1976 to 28% in 2007 (Urban League, 2008). This has resulted in shifting the burden for
financing public education to local property tax owners while requirements from the
state, through NCLB (2002), have increased the cost of educating children (Dobbs, 2004;
Mathis, 2003; Podesta & Brown, 2008). This coupled with the given that local property
tax owners in lower income areas are less able to adequately fund schools than their
wealthier peers has created a tremendous system of inequality especially in a locally
controlled education state like Illinois (Urban League, 2008; Verstengen & Driscoll,
2008; Winfield, 2009).
In its lawsuit against Illinois, the Urban League (2008) claimed that because of
the financial inequities of the state, Illinois was denying students’ rights to a high quality
education. Although the lawsuit was brought forth on behalf of minority students, one
may draw the conclusion that the impact is felt by all communities that are less able to
finance their educational system with the same level of support financially. The impact is
lower achievement, more students dropping out of school, and less college attendance for
26
these students than their peers. The Urban League (2008) contends that the lack of
funding is significant because it results in higher class sizes, poorer condition of facilities,
fewer extra and co-curricular activities, less qualified teachers, a shortage of supplies, and
outdated textbooks and curriculum. In the lawsuit, the Urban League estimates this deficit
at $6 billion in Illinois alone.
Inequitable funding for education is an issue in many states. The assurance of
equal opportunity for low income students to a high quality education should be elevated
as a priority in our country (Arroyo, 2008). If closing the achievement gap continues to
be a high national priority, funding of education and equitable funding of education need
to become higher priorities (Arroyo, 2008). Federal funding initiatives, such as Title I,
are intended to help bridge the gap; yet the sad truth is that the gap has grown over time
rather than decreased (Hoff, 2008; United States Census Bureau [USCB], 2006; Urban
League, 2008; Winfield, 2009). Most educators and legislators agree that more funding of
the mandates required by NCLB (2002) is necessary (Sack-Min, 2009).
The federal government, under President Bush, stated that NCLB (2002) did
indeed provide adequacy in financing. Under the Unfunded Mandates Reform Act of
1995, federal agencies are required to assess their actions on all other government bodies.
Federal government research states that NCLB (2002) increased funding by 18%, in Title
I in 2002 (USDE, 2002), which the Bush administration asserted was adequate to fund all
the new requirements of NCLB (2002). Because of these increases, the United States
Department of Education claims that the provisions of the Unfunded Mandates Reform
Act do not apply. Lawsuits, to date, have upheld the claims of funding adequacy for the
27
federal government. The lawsuits have not been successful, effectively passing the
challenge of funding programs back to the state and local level (USDE, 2002).
The American Recovery and Reinvestment Act of 2009, the new federal stimulus
package, offers substantially higher funding for education. Among the initiatives of the
act are an emphasis on high-poverty students and recruitment of teachers to less affluent
schools (Klein, 2009; Parsons, 2009). The argument of underfunding or unfunded
mandates has been weakened by this act and the infusion of billions of dollars, however,
to this point; the act continues the emphasis on accountability measures that were brought
by No Child Left Behind (Klein, 2009; Toppo, 2009). Rep. George Miller of California,
head of the House Education and Labor Committee, has vowed to lead Congress in
working with the new administration to rework NCLB (2002) into a more flexible, fair,
and better funded law (Sack-Min, 2009).
No Child Left Behind
No Child Left Behind legislation has promised to help every child in America
become proficient in both reading and math by the year 2014. With the onset of this new
legislation signed into law on January 8, 2002, came the largest sustained increase of
funding in the history of education in the United States. Title I funds rose 52% from $8.8
billion to $13.3 billion (Bush, 2004; IES, 2007). As the largest federal financing program,
Title I has been used by NCLB (2002) to influence schools and “leverage” the change
that the administration was pursuing. Title I accountability through NCLB (2002)
measures the accountability of all students and rewards or withholds funds for schools
that meet or fail to meet achievement standards (TPG, 2007).

28
Improving the education for all children can and should be of national importance
and the federal government should play a large role in helping our schools educate all
children, especially those who begin their education with a disadvantage (Rothstein,
2007). No Child Left Behind was widely hailed as a victory for poor and minority
children by Democrats and Republicans alike (Hess & Rotherman, 2007). The premise of
NCLB (2002) is a simple concept of taking a few standards, primarily reading and math
related, and enforcing them rigorously. In doing so, improvement is expected (Hess &
Rotherman, 2007; Mintrop, 2008). For schools that are struggling to meet these standards
an initial step of involvement from the federal government, according to Education
Secretary, at the time, Rod Paige and President Bush is an increase in available funding
for that school to enable implementation of intervention programs such as tutoring for
students and professional development and training for staff. According to their press
release, “the public has a right to demand great returns on their investment” (Mathis,
2003). For schools that fail to meet the standards, NCLB (2002) requires changes in their
programming from offering students tutoring services all the way up to demanding
closing or restructuring of the school. If schools fail to comply with these requirements,
they forfeit their funding (TPG, 2007).
No Child Left Behind has changed the landscape of instruction in classrooms
across the country (Hess & Rotherman, 2007; Srikantaiah & Swayhoover, 2008). The
Center on Education Policy notes that teachers are using more class time for activities to
focus on test preparation. Many teachers claim that it is to provide an opportunity for
disadvantaged children to participate in the format of the test they will be using and

29
provide a better assessment of every child’s actual achievement level (Srikantaiah &
Swayhoover, 2008). Teachers report that they are using less variety in their instruction
for the lower performing students and in lower performing schools (Srikantaiah &
Swayhoover, 2008). Teachers also feel a need to stick more closely to the required
objectives and learning skills, yet that creative learning for students has weakened their
overall education. Curriculum is more closely aligned to state goals and articulation K-8
has drastically increased (Srikantaiah & Swayhoover, 2008). There has been an increase
in the focus on reading and math skills (not disputed as vital for every child’s education)
and on the use of reading skills in all other courses, but at the expense of all learning
goals for all other subjects (Hoff, 2008; Srikantaiah & Swayhoover, 2008).
NCLB (2002) has caused American educators to begin looking systematically at
education as a whole for the first time in this country (DeLorenzo, Battino, Schreiber, &
Gaddy Carrio, 2008). Overall successes of NCLB (2002) include more informed and
better use of data to drive instructional goals, targeting students who are not learning and
an increase focus on differentiating to meet the needs of all students, increased efforts to
involve parents in their child’s education, an overall rise in achievement across the
country, and a narrowing of the achievement gap between the general population and the
disadvantaged (Hess & Rotherham, 2007; Srikantaiah & Swayhoover, 2008). Problematic
areas reported by educators include the focus on the punitive measures for not meeting
achievement targets, continually changing policies or programs in underperforming
schools because of a different sense of urgency, and a reported increase in under or

30
unfunded mandates as a result of No Child Left Behind (Hess & Rotherham, 2007;
Mintrop, 2008; Srikantaiah & Swayhoover, 2008).
Despite the United States Department of Education claims of improving the
educational opportunities of disadvantaged children, No Child Left Behind has
inadvertently provided an opportunity for proponents of more equitable financial backing
of schools (Hess & Rotherman, 2007; Mintrop, 2008). States have made progress toward
advancing curricular goals and targets. They have set the baseline for defining what
constitutes an adequate education in their own state, defining this through outcome goals
and standards (Mintrop, 2008).
No Child Left Behind requires the states to meet their own established standards.
Many state test results show that many schools are not meeting the standards that the
states have set for themselves (Schmoker & Marzano, 1999; Weingarten, 2009) and when
comparing scores since the inception of NCLB (2002) to scores prior, the same success is
not demonstrated by national assessments such as the National Assessment of
Educational Progress or NAEP (DeLorenzo et al., 2008). Some have used this as an
opportunity to call for national standards because all states are not measuring student
progress in the same manner and all schools are not held to the same standard
(Weingarten, 2009). At this time, the new education administration has not demonstrated
any support for national standards despite a call for a better and more uniform system of
assessment (Sack-Min, 2009).
Legislators have voiced the concern of whatever shape the reauthorization takes,
that the focus will continue to be on ensuring an adequate education for all children

31
(Sack-Min, 2009). Especially in light of our current economic crisis, the needs of the
poor continue to be a priority (Sack-Min, 2009). Supporters of inadequate funding
initiatives seized the opportunity to hold states accountable for funding the schools that
do not meet the adequate yearly progress that states themselves have defined (Hoff, 2008;
Winfield, 2009). The vast majority of these failing schools happened to be in low income
areas with less available funding. Critics claim that the “soft bigotry” that former
President Bush spoke of when addressing the need for NCLB (2002), has not been
addressed and that the federal government has not provided the funding to adequately
pursue its policy (Blankstein, 2004; Hoff, 2008). With the current gap between well-
funded school districts and their poorer counterparts, lawsuits have risen out of the nature
of equitably funding schools (Mintrop, 2008; Winfield, 2009).
Illinois currently has one of the most inequitable school funding systems in the
nation (Carey, 2004; Dobbs, 2004; Rosborg et al., 2003) and has been the target of a
number of adequacies in funding lawsuits (Urban League, 2008; Verstengen & Driscoll,
2008). Key to the defense of NCLB (2002) is the clause that was inserted by lawmakers
that “Nothing in this act shall be construed to … mandate a state or any subdivision to
spend any funds or incur any costs not paid for under this act.” Judges, however, are
questioning why Congress would include an unfunded mandate as it did (Walsh, 2009).
Early indications are that the new presidential administration will make fully
funding educational mandates a priority, further politicizing the situation, but delighting
educators across the country (Quaid & Pope, 2009). The federal stimulus money provided
through the American Recovery and Reinvestment Act has not addressed full funding,

32
yet remains a significant increase in funding for federal mandates such as the Individuals
with Disabilities Act for special education and Title I for the disadvantaged. There is an
opportunity for this to alter perceptions around the concept of unfunded mandates (Klein,
2009; Parsons, 2009). Some legislators are cautioning that the stimulus money is
substantial, approximately $100 billion, but that it may cause challenges for schools when
the money runs out in two year. It is unclear at this point as to whether the stimulus is
temporary, the most likely scenario, or part of a plan of large increases from the federal
government to public education (Dillon, 2009).
Title I, Part A
Federal funding for schools through programs such as the Title I, Part A provision
of the Elementary and Secondary Education Act which is known simply as Title I, were
to help impoverished communities engage “at risk” students by targeting extra resources
and funneling funds into their schools (Shen, 2000; USDE, 2003). Although primarily
intended to help the most impoverished students, Title I is used in over ninety percent of
all public school districts and fifty percent of all schools in the United States (Cowan,
2003; TPG, 2007). Even with alterations made to the provisions in Title I with the
reauthorization of ESEA (1965), now called the No Child Left Behind act, it is still the
largest single federal financing program for primary and secondary schools in the United
States (Shen, 2000; USDE, 2003).
It is helpful to have a little background and understanding of how funds flow from
the federal level to the local level. Title I funds arrive to Local Education Agencies, the
LEA or school district, through what is known as “a state-administered program.” This

33
means that funds are transferred to the State Education Agency, the SEA, from the U.S.
Department of Education, the USDE. If the LEA meets requirements established by both
the SEA and the USDE for income level and achievement of all students, funds are
transferred to the LEA to be used at the local schools (NCLB, 2002; TPG, 2007).
In determining the initial funding level, the USDE looks at the SEA’s average
per-pupil expenditure and the LEA’s count of low income students. In addition, all LEAs
must have at least ten children that meet the low income standard and an overall
population of low income students that exceeds two percent of the LEA’s total student
population (NCLB, 2002; TPG, 2007). The SEA then modifies the findings of the USDE
to account for new districts and schools through information that was not originally
available to the USDE (NCLB, 2002; TPG, 2007). Initially, these funds are allocated into
four separate funding sources: basic, concentrated, targeted, and finance incentive grants.
Basic uses the previously mentioned count of low income students and SEA per pupil
expenditure to provide a foundational funding level for schools (Cowan, 2003; TPG,
2007).
The basic funding level provides funding to the most LEAs and contains the
largest total amount (Cowan, 2003; TPG, 2007). Concentrated and targeted funds provide
an additional boost of funding per child for LEAs with higher levels of poverty. Finally,
finance incentive grants are awarded to SEAs that direct more of their funding toward
high poverty areas and have highly equalized school finance systems (TPG, 2007). This
rewards the states that most closely follow the spirit of the original intent of Title I
(Cowan, 2003). Title I also contains a “hold harmless” provision. This means that LEAs
34
are guaranteed a certain portion of their previous year funding depending on their level of
poverty. This amount can be 85%, 90%, or 95% and applies to all of the funds. All of
these funds: basic, concentrated, targeted, and education finance incentive grants are
grouped together in the end to provide an LEA with one set grant amount for Title I
(NCLB, 2002; TPG, 2007).
Title I requirements prior to No Child Left Behind, inadvertently created a
conflict with other interventions and programs in some schools (Cowan, 2003;
Kimbrough & Hill, 1981). Title I requires that schools document the use of specific
interventions with students and demonstrate that they are exceeding the service provided
to all other children. This created a system in many schools where students are pulled out
of their regular classrooms and from the rest of the student population (Cowan, 2003;
Kimbrough & Hill, 1981). In an effort to document that students received an additional,
or supplemental, program schools pulled students out of their regular classroom
instruction (Cowan, 2003; Kimbrough & Hill, 1981). Pull out programs are a manor of
simplifying the recordkeeping and financial management. This method, though not
inherently bad, may cause the unintended consequence that students miss the instruction
provided in the regular classroom with the general education curriculum with their peers.
Frequently this prevents students from making gains with the general classroom
curriculum that are the intended outcome through the supplemental services (Kimbrough
& Hill, 1981). By requiring the supplemental program documentation, Title I may
inadvertently be reducing students’ achievement levels because state tests are typically
35
based upon standards that are included in the regular classroom curriculum (Kimbrough
& Hill, 1981).
The allocation of funds from the LEAs to schools has changed little since the
inception of NCLB (2002) and remains fairly restrictive (Cowan, 2003; TPG, 2007). Title
I funds can only be distributed to schools that are in the geographic location of the
attendance area of eligible schools or to students who reside in the same geographic
location (NCLB, 2002; TPG, 2007). LEAs must first reserve a comparable amount of
funding to educate eligible children who do not attend a Title I school (students who are
homeless, neglected, or sheltered) and reserve funds for administrative costs to provide
service to both public and eligible private school children. In addition, if the LEA
receives over $500,000, funds must be set aside for parental involvement, teacher and
paraprofessional training to achieve NCLB (2002) qualification guidelines, twenty
percent for supplemental educational services or SES and transportation if any schools in
the LEAs jurisdiction did not meet AYP targets, and an additional ten percent if the LEA
itself did not meet AYP targets as established under No Child Left Behind (NCLB, 2002;
TPG, 2007). Although NCLB (2002) has increased the funding available through Title I,
it has clearly restricted the use of such funds and added a layer of complicity to the
process of distributing the funds (Cowan, 2003; Tosh, 2003).
Furthermore, schools must be ranked by poverty levels. LEAs may rank schools
by free and reduced lunch eligibility, Temporary Assistance to Needy Families eligibility,
Medicaid eligibility, the census data, or a composite of all of these (NCLB, 2002; TPG,
2007). Most public schools use free and reduced lunch eligibility because of the ease of
36
acquiring the data (TPG, 2007). The first consideration is to account for any school with
over a seventy five percent poverty level according to the above criteria. These schools
must be given priority regardless of grade-level and age of students. For example, if an
LEA has a priority goal of servicing students at the younger grades, yet has a high school
that meets the 75% limit, then the LEA must service students in the high school first.
Schools over 75% must be served first of all of the LEAs eligible schools (NCLB, 2002;
TPG, 2007).
LEAs with enrollment over 1000 students and more than one school have been
given limited options in determining eligible schools if below the 75% poverty level
(NCLB, 2002; TPG, 2007). The LEA may use actual enrollment figures in the school
rather than in the schools attendance area, designate any school with at least 35% of the
students low-income eligible for funds, may skip any eligible school if equivalent
amounts are available from any state or local fund comparable to Title I, may use the
percentage of low-income students from schools that feeds into it rather than its own
since many high school students fail to report low-income status, or may “grandfather”
any school for an additional year if it was eligible the previous year (NCLB, 2002; TPG,
2007).
Finally, funds are distributed to all schools based on the total number of children
designated as low-income without regard to achievement levels or the identified needs of
the students or schools. If choosing to fund any school with less than 35% poverty, then
funding to all other eligible schools must be at least 125% of the per pupil amount
received for the year (NCLB, 2002; TPG, 2007). Expenditures are commonly used to

37
offset teacher and paraprofessional salaries and add additional instructional help in
classrooms or for books and other materials. Title I services can also be used for
counseling, health, nutritional services, or social services if other sources of funding are
not readily available and the services are deemed appropriate to improving student
achievement (NCLB, 2002; TPG, 2007).
Choosing Schoolwide and Targeted Assistance Programs
Greater flexibility in the use of federal grants has been allowed with the advent of
No Child Left Behind. One of the areas with greater flexibility was in Title I categorical
funding. Schools are now allowed the option of implementing a schoolwide system
according to Section 1114 of NCLB (2002) or in targeting their assistance as noted in
Section 1115 of NCLB (2002) to students if their overall low income level at the school
is 40% or higher, as determined by Title I criteria, most commonly free and reduced
lunch data (TPG, 2007). Since the establishment of Title I in 1965, schools have
generally targeted the assistance to students who were in most need (NCLB, 2002; TPG,
2007). With the number of schools choosing schoolwide assistance rising from 10% to
58% from 1994-95 to 2004-2005 (USDE, 2007) one would naturally wonder how the
programs differ, which has proven to be more effective, and what has sparked the change
in school Title I programs in just ten years.
When originally introduced as an option in 1978, schoolwide programs were
based upon the concept that by improving the overall educational opportunity of all
students that the needs of all would be met. More has been learned since that time and
LEAs are now more likely to implement a comprehensive school model to improve the
38
performance of all (TPG, 2007). The U.S. Department of Education asks that schools
consider whether the program is likely to improve the performance of the lowest
performing student or whether it is more likely to be effective at enhancing their
performance by targeting additional programs only to these students (NCLB, 2002; TPG,
2007).
Although schools had the flexibility in choosing either a schoolwide program or a
targeted assistance model since 1998, No Child Left Behind added another layer of
flexibility for schools considering a schoolwide program. Prior to NCLB (2002), the
threshold of 50% poverty was the guideline for LEAs to have a choice. NCLB (2002)
lowered that level to 40% allowing more schools the option (NCLB, 2002; TPG, 2007).
Critics have argued that the level is too low and the intent of the law has been diminished
with this flexibility. Proponents argue that the impacting the entire school program is
more effective and by allowing more flexibility, more students will be served (TPG,
2007).
Schoolwide and targeted assistance programs through Title I are similar in that
both are intended to enhance the overall achievement of the most disadvantaged children
and the students most at risk of failure so that they may reach acceptable levels of
performance on state achievement tests. NCLB (2002) requires that all schools receiving
Title I funds use a scientific-based and research method of instruction in an effort to
prove the effectiveness of the instructional method (Hopper, 2008; NCLB, 2002; TPG,
2007).

39
All schools receiving Title I funds are required to use highly qualified teachers,
certified in the subject area to be taught, to work with eligible students and coordinate
programs with all other state and federal programs as well as the school’s regular
education programs. All services provided through Title I are expected to supplement, or
add to the regular education program, rather than to supplant or take the place of the
regular education program (Hopper, 2008; TPG, 2007). As a categorical funding
initiative through the original Elementary and Secondary Education Act of 1965, Title I
programs are anticipated to be an enhancement or addition to the regular educational
program of qualifying students (ESEA, 1965; Hopper, 2008; NCLB, 2002; USDE, 2002).
The important distinction between the two Title I programs is that schoolwide
programs are comprehensive reform designed to upgrade the entire educational program
whereas targeted assistance is designed to provide support only to the identified students
(TPG, 2007). Hess (2005) argues that school leaders must focus Title I funding on
students who are in most academic need and not based upon a child’s socioeconomic
status. Initial determinations in Title I service are made based on poverty level, but then
allowances are made to serve the most academically needy students. The point is well
taken, yet does not help resolve the dilemma that school leaders face in deciding whether
to implement a schoolwide program or a targeted assistance model (Hess, 2005).
A growing body of evidence shows that when implementing a schoolwide
program that it is possible to increase the achievement of all students, including the
economically disadvantaged, despite the overall demographics of the school (TPG,
2007). With the relaxation of restrictions on schoolwide programs, more and more
40
schools are choosing this type of Title I program with the use of federal funds to enhance
the learning of all of their students (USDE, 2007). This study will determine if
schoolwide Title I programs or targeted assistance programs are have resulted in higher
increases student achievement with Illinois fifth grade low income students.
Schoolwide Assistance Program Guidelines
Schoolwide programs are designed to provide an upgrade to the educational
program for all students, including low achieving students. Schoolwide programs offer
the opportunity to upgrade all programs, curriculum, structures, and resources to impact
the entire student body. In a schoolwide program for Title I, services are integrated into
the regular educational program and not a distinct separation from it (NCLB, 2002; TPG,
2007). The belief is that in improving the entire school program, it will benefit the
disadvantaged students (Pogrow, 2005). Schools must have a low income level over 40%
with their overall student population to have the choice of a schoolwide program. An
important note is that all students in a schoolwide program are considered Title I students
and are therefore be eligible for services (NCLB, 2002; TPG, 2007). This stipulation
allows the school to implement programs that would enhance their overall curriculum
rather than just working with specific groups of students, provide professional
development for all staff, and blend or consolidate all other funds to enhance purchasing
power (Hopper, 2008; NCLB, 2002; USDE, 2002).
In a schoolwide program, overall school needs are identified though an annual
needs assessment for the building and services may address the needs of all of the
students. A commitment to ongoing continual overall school improvement is required

41
(TPG, 2007). Specific students do not need to be identified that will receive focused
instruction as in the targeted model; however, the needs of the lowest achieving students
are expected to be met. Schoolwide programs are also required to implement a plan that
addresses the transition of preschool children into their local elementary school and if
Migrant Education Program funds are received, must continue to address the needs of
these children regardless of Title I status (Hopper, 2008; NCLB, 2002; TPG, 2007;
USDE, 2002).
Schools at or above the 40% level have the option available to them of providing
targeted assistance or the option of implementing a schoolwide program. Schools below
the 40% threshold do not have the option and must provide targeted assistance to the
students who are in most need (Hopper, 2008; NCLB, 2002; USDE, 2002). A school
need only meet the criteria of 40% at the time of determining eligibility and if numbers
subsequently dip below this barrier, schools will retain their status. If schools do not meet
the eligibility requirement or choose not to offer a schoolwide program, then they are a
targeted assistance school as described in the next section (TPG, 2007). Thompson
Publishing reports in 2008 that Title I schoolwide programs have further responsibilities
and:
… are still required to meet all programmatic requirements of the Individuals with Disabilities Education Act (IDEA). In addition, schoolwide programs must still meet program-linked requirements relating to health, safety, civil rights, student and parental participation and involvement, services to private school children, maintenance of effort, uses of federal funds to supplement, not supplant non-federal funds, and the distribution of funds to state and local educational agencies. Finally, the authority to combine federal funds only applies to program funded by ED; programs supported by other agencies, such as the school lunch

42
program administered by the U.S. Department of Agriculture, may not be combined. Although the intent is to continue services through all other funded programs and
is still to increase offerings to students in low income areas, schoolwide programs have
much more freedom in determining allowable costs because of the impact on the entire
student body (TPG, 2007). Schoolwide programs have the freedom to implement nearly
any program to impact the achievement of all students if the services are integrated
together to produce higher achievement. Schoolwide programs have been given the
opportunity to implement what would be considered “radical programs” if the intent is a
comprehensive improvement. Nearly any expense that is made with the intent of
supplementing the regular schoolwide plan and not to supplant it is allowable (TPG,
2007).
Schoolwide plans are determined through a needs assessment for all students in
the school, a plan developed to address the needs of all these students based upon the
assessment, and a determination of how well the plan has worked for these students and
improvements for the future (NCLB, 2002; TPG, 2007). Due to the accountability
requirements basically being the plan itself and the freedoms associated with schoolwide
plans since the inception of NCLB (2002), schoolwide plans have become the Title I
program of choice for schools that have the option. If the plan fails to advance student
achievement over time, then an LEA may require a school to revert back to a targeted
assistance model (TPG, 2007).
43
Targeted Assistance Program Guidelines
Targeted assistance schools must select students based upon the lowest achieving
and not upon the lowest income. Students who are failing or most at risk of failing should
be given priority (NCLB, 2002; TPG, 2007). The individual school is selected based
upon the overall low income level and the poverty level of the district, but the individual
students are selected based upon low achievement levels regardless of the individual
student’s poverty. Students who fit the federal criteria for Head Start and Even Start
which are pre-Kindergarten services, Migrant, Neglected or Delinquent, and Homeless
children must be included as a part of the selection process. Criteria must be listed along
with a plan for the supporting services that will enable this group to meet state standards
(Hopper, 2008; NCLB, 2002; TPG, 2007; USDE, 2002). Children from preschool
through grade 2 must be identified on the basis of teacher judgment, parental input, and
other developmentally appropriate measures (NCLB, 2002; TPG, 2007). Children in
grades three and above must be chosen based upon “multiple educationally related,
objective criteria established by the LEA” (TPG, 2007). Funds are to be used for services
that directly support the eligible students and professional development funds are only
allowed for staff members that work directly with Title I students (Hopper, 2008; NCLB,
2002; USDE, 2002).
Targeted assistance programs are to focus their attention on students, staff,
programs, and resources that will impact the identified students. While this criterion is
more restrictive in identifying students to qualify than a schoolwide program, other
students are not entirely excluded. If other requirements of Title I are met, students may

44
be receive service in a targeted assistance school if they fit the context of “incidental
inclusion” (TPG, 2007). Incidental inclusion may occur only if services are designed to
meet the needs of identified Title I students, if the services focus on identified students, if
inclusion of others does not decrease the amount, quality, or duration of services for
identified students; does not increase the cost of the services; or does not exclude any
students who would otherwise qualify for Title I services (NCLB, 2002; TPG, 2007).
Students may be included for service through incidental inclusion if they are in the same
small reading group, benefit from the same materials as identified students, or benefit in
some way simply by being present when identified students receive their service. They
may not be directly or individually served (NCLB, 2002; TPG, 2007).
Targeted assistance schools are directed to minimize pull out services and provide
them in a general education setting whenever possible. A model that encompasses
services provided in a general education classroom is accepted and preferred by the
federal government. Additional educational opportunities are expected through extended
day programs that happen before or after school, during the summer, or on days when
school is not normally in session (Hopper, 2008; NCLB, 2002; USDE, 2002).
A key principle of targeted assistance to students is that the service provided must
be supplementary to the regular education program or in addition to the regular classroom
instruction that all other students receive. Service must not supplant or replace the general
classroom instruction (NCLB, 2002; TPG, 2007). Generally students in targeted
assistance programs are provided with extra instruction in math or literacy (NCLB, 2002;
TPG, 2007). The most prevalent interventions focus on younger students with reading

45
difficulties. Providing early readers with interventions to help offset the disadvantages of
poverty as quickly as possible is the most common of all Title I strategies (Hopper,
2008).
Title I Indicators of Success
Title I was designed to improve the academic achievement of disadvantaged
students (TPG, 2007). Both schoolwide and targeted assistance programs through Title I
are intended to enhance the overall achievement of the most disadvantaged children and
the students most at risk of failure so that they may reach acceptable levels of
performance on state achievement tests (Hopper, 2008; NCLB, 2002; TPG, 2007). Title I,
Section A, subpart 1, section 1111B of NCLB (2002) states that the academic standards
required should be the same that the state applies to all other schools.
Meeting the same academic standard is defined in Illinois as meeting or exceeding
the scale score chosen each year on the Illinois Standards Achievement Test, ISAT, by
the state of Illinois. This academic standard of achievement changed with the inception of
the No Child Left Behind act to be the same achievement goals set by the states for all
students regardless of income (NCLB, 2002). The threat of withholding federal funds,
Title I being the largest federal funding source for public schools in our country, has been
the primary incentive for states and local school districts to follow the requirements of No
Child Left Behind (Hess & Rotherman, 2007; NCLB, 2002).
NCLB (2002) requires school leaders to document progress for low achieving
students and to identify students who are having difficulty with reading or who are as risk
of failure in reading according to measures used at the school level. The measures chosen
46
at the local level must meet the criteria referenced in Section 1112 of the No Child Left
Behind act which states that “at the local educational agency's discretion, a description of
any other indicators that will be used in addition to the academic indicators described in
section 1111 for the uses described in such section” (NCLB, 2002).
School leaders must demonstrate the reliability of measures they use in this
process to the state educational agency (Illinois State Board of Education [ISBE], 2010).
According to Section 1112 of the No Child Left Behind act, targeted assistance schools
must also include “a description of how teachers, in consultation with parents,
administrators, and pupil services personnel, in targeted assistance schools under section
1115, will identify the eligible children most in need of services under this part” (NCLB,
2002).
Leaders choosing schoolwide assistance must demonstrate the overall
achievement plan for their school while targeted assistance schools must additionally
show plans for how Title I identified students will reach state achievement levels (NCLB,
2002; ISBE 2010).
Other indicators of success may be used in addition to achievement to
demonstrate progress. These include, but are not limited to, increasing graduation and
attendance rates. Options are chosen by individual school leaders and the rationale for
inclusion of these measures as indicators of the success of the school Title I plan must be
justified and approved by the state (ISBE, 2010; TPG, 2007). Illinois requires that all
districts receiving Title I funds have an approved plan on file electronically at
www.iirc.niu.edu which indicates the use of allocated funds with activities described in

47
the Title I plan that will be incorporated into the school and district improvement plans
(ISBE, 2010). The stated goal is to integrate all school and district planning to provide a
more concentrated effort (ISBE, 2010).
School leaders have a duty to be knowledgeable about the differing programs and
their effect on the achievement of their students. At a time of difficult financial stress, it
is imperative that school leaders know what programs will have the most impact on their
student and to use their limited funds most effectively (Allington & Walmsley, 2007;
NRC, 1998). Understanding if schoolwide programs have a greater impact on the
achievement of fifth grade students than targeted assistance programs, will help school
leaders make difficult decisions about the use of their Title I funding in all elementary
schooling years to maximize the impact on improved reading.
Reading Achievement
With the increased emphasis on meeting the educational needs of all students,
through No Child Left Behind, schools amplified their efforts in establishing proficient
readers (NCLB, 2002). As noted previously, reading is considered the key to educational
success for students (Allington & Walmsley, 2007; NRC, 1998). The vast majority of
students leave our educational system reading fairly well. Concerns naturally arise on the
work must center on those who do not and students who come from poor families are
more likely to land in this group than their more advantaged peers (Allington &
Walmsley, 2007; NRC, 1998).
Emergent readers must be able to coordinate a variety of thinking skills such as
recognizing words, making meaning of words and text, and remembering the information
48
that was read. The development of reading skills is commonly divided into the following
three common areas: alphabetic including phonemic awareness and phonics, fluency, and
comprehension with vocabulary and text comprehension. Each can of course be
subdivided further or labeled differently, yet these three divisions are generally accepted
(NRC, 1998; NRP, 2000). Literacy acquisition is a complex cognitive skill and one must
keep in mind that each of the above areas is essential for students to learn to read and
cannot be taken as a separate practice from the other in helping students learn the process
of reading. For most children, this is a fairly predictable process. Some, however,
continue to struggle. An interruption in any of the skill developments increases the
possibility that reading will be delayed (NRC, 1998; NRP, 2000).
The National Reading Panel states that phonemic awareness is “the ability to
focus on and manipulate phonemes in spoken words.” The English language contains 41
phonemes, or sounds, that combine together to form words and syllables. Phonemic
awareness is not a complete reading program, but rather a part of an overall process of
helping students learn to read. It is an important first step in helping students understand
the alphabet and how the English language works primarily up to, but not limited to, the
first grade level (NPR, 2000). Phonemic awareness is an imperative means to help
students understand how to use the alphabet and how to read and spell words. Phonemic
awareness and letter knowledge and recognition are the two most important predictors for
whether or not children will learn to read in their first few years of school, thus
emphasizing the importance of instruction in phonemic awareness (NRP, 2000; Pogrow,
2005).

49
Phonics instruction stresses the acquiring of letter-sound associations with the
alphabet and understanding how this translates into spelling and reading words. Like
phonemic awareness, phonics instruction is primarily designed for beginning readers in
the early grades or for students who are struggling to read later in their school careers
(NRP, 2000; Pogrow, 2005). Phonics instruction differs from phonemic awareness in that
children are taught to manipulate phonemes with letters and not just the sounds. Both
alphabetic instructions are designed for primary school age children or for children who
are struggling to read. Students who fail to grasp the concepts of alphabet at an early age
fail to develop the indispensable skills for reading later (NRC, 1998; NRP, 2000; Pogrow,
2005). This study focuses on fifth grade children and it is assumed that most students,
except struggling readers, have mastered these skills by the time they take the fifth grade
ISAT (ISBE, 2007).
Fluency has often been described as the most neglected of all reading skills
because early educators spent little instructional time developing fluency in students
(Allington, 1983; NRP, 2000). The assumption was that if students understood how
words went together and were proficient in recognizing words that improved fluency
would follow. Such skills likely have a positive impact on fluency; however, the outcome
is not inevitable. Fluency is the ability to read text with speed, accuracy, and the proper
expression needed to extract the proper meaning from the text (Allington, 1983; NRP,
2000). Readers become more fluent through a combination of quick recall of sight words,
guided reading, repeated oral practice, and independent or recreational reading. There is a

50
close relationship between fluency and the ability to comprehend what is read (Allington,
1983; NRC, 1998; NRP, 2000).
The final component, and what many call the “real reason” for reading, is
comprehension (NRC, 1998; NPR, 2000). Durkin (1993) describes comprehension as the
“essence of reading” and describes it as being “essential not only to academic learning
but to life-long learning”. Skilled readers blend all of their learning to gain a better
understanding when interacting with text. A reader who is able to blend the skills is
making use of the text to gather information, learn about a topic, or simply to be
entertained (NRC, 1998; NRP, 2000).
Word recognition and understanding, or vocabulary, is an important
comprehension developmental skill. Words that are not in the reader’s vocabulary are not
understood and can have a significant impact on the reader’s comprehension, or
misconceptions that may occur, of the text. Vocabulary is crucial to the learned skills of
effective readers (NRP, 2000). Skilled readers who comprehend can recall, question and
answer, and summarize text. Reading comprehension is a complex intentional cognitive
process that blends all of the skills together to help readers make sense out of the text
(NRC, 1998; NRP, 2000). Students certainly begin to comprehend material when they
first learn to read. Intentional understanding does not come until readers are able to
recognize and sound out text, they read it fluently enough to prevent distraction.
Educators generally agree that most students begin to effectively comprehend material
and use read material for learning in the upper elementary grades (NRC, 1998; NRP,
2000). This concept aligns well with the Illinois Learning Standards and the assessment
51
of comprehension on achievement tests, ISAT, in Illinois in upper elementary school
(ISBE, 2007).
Given the emphasis nationally on early reading success and interventions, it is not
surprising that the bulk of Title I funding is directed toward primary and elementary
students (TPG, 2007). Program benefits for services provided by Title I are much higher
at the early grade levels and with younger children. This has led many educators and
policy makers to call for service to children in the preschool and early elementary years
to maximize the effectiveness of Title I funds (Zigler, 2009).
Early intervention remains a key for students who struggle with reading because
most reading issues can be prevented (NRC, 1998). Many students are identified for
special education services because of reading difficulties. If reading interventions can be
successfully implemented in schools at early stages, then inappropriate referrals to special
education can be reduced (Allington & Walmsley, 2009). Most do not argue against the
need for early intervention, they would maintain that all students attain higher reading
scores when there is consistency and continuity in curriculum aligned to goals and
expectations of general classroom learning. School leaders should not allow the focus on
high needs students to the neglect of the entire school population (Borman et al., 2001).
To prevent reading difficulties, children must be provided with the opportunity to
master uses of the alphabet orally and in writing, experiment and explore the different
functions of language, be identified early and provided with appropriate interventions as
well as solid classroom instruction, and become enthusiastic about reading for lifelong
learning with opportunities to experience success (NRC, 1998; NPR, 2000). School

52
leaders need to ensure these opportunities are available to their students. Teachers need to
have an understanding of the developmental need of students and how to assess reading
difficulties and interpret data received, as well as the process of reading and writing.
School leaders must ensure the opportunity for staff members working with children to
be provided with solid professional development that continually allows staff members to
update their skills with the most recent research and best practices (NRC, 1998). The
primary role of school leaders should be to ensure that consistent, high quality learning
takes place for all students regardless of their ability or life circumstances (Hess, 2005).
One suggested negative impact of NCLB (2002) is that with the increase focus on
test preparation, teachers are narrowing their instruction and, correspondingly, decreasing
the enjoyment of reading. A byproduct is a reduction in graduates who will become
lifelong readers (Gallagher, 2009). School leaders cannot allow this to happen (Hess,
2005). Others argue that apparent achievement gains, through standardized tests, will not
play out over time if teachers truly do narrow the focus of instruction. The importance of
standardized testing cannot be downplayed. There is a high correlation between students
who score poorly and children who come from poor and less educated families (Allington
& Walmsley, 2007). High scores on standardized test can open possibilities for college
education and better or higher paying jobs after school. With a higher proportion of low
income and disadvantaged students meeting standards on achievement tests, the need for
a program such as Title I that will help reduce the disadvantages that come with poverty
is greater now more than ever (Allington & Walmsley, 2007; Podesta & Brown, 2008;
Shen, 2000).
53
The Role of Leadership in Achievement
School leaders have a duty to be knowledgeable about the differing programs and
their effect on the achievement of their students. At a time of difficult financial stress, it
is imperative that school leaders know what programs will have the most impact on their
student and to use their limited funds most effectively (Allington & Walmsley, 2007;
NRC, 1998). Understanding if schoolwide programs have a greater impact on the
achievement of fifth grade students than targeted assistance programs, will help school
leaders make difficult decisions about the use of their Title I funding in all elementary
schooling years to maximize the impact on improved reading.
Since early intervention programs have proven the most effective at enabling
students to be lifelong readers, school leaders should use a majority of their Title I funds
in the early stages of a child’s learning (Allington & Walmsley, 2007; NRC, 1998). A
commitment should be made to small class sizes and attracting and retaining excellent
teachers in the primary grades. There should be a stated and committed effort to
understanding the unique needs and the importance of learning in the initial grades. Too
often there is less of a commitment to academics with the youngest children, severely
inhibiting the growth of the most disadvantaged (Hess, 2005; Ladd, 2002). School leaders
must maintain a commitment to the success of academic reading programs in the primary
grades to decrease intervention needs when children advance in age (Hess, 2005; NRC,
1998; TPG, 2007). School leaders must understand the importance of good instruction for
early learners. The National Reading Council (1998) has identified first grade as a critical
year and notes that poor instruction in first grade may have lasting long-term effects and
54
lead to increased interventions and higher costs later. School leaders should be wary
when making staff assignments of placing quality staff members in the early grades,
particularly with first grade assignments (Allington & Walmsley, 2007; NRC, 1998).
Effective leaders establish the proper priorities and challenge students and
teachers alike to raise their expectation level by setting the proper conditions for success
(Marzano & Waters, 2009). When students are taught with low expectations, the pace of
instruction tends to slow and less learning occurs over time (Lewis, 2008). Many teachers
in this scenario believe that since the students are not capable, they must slow the pace.
The outcome tends to be exasperated over time with students falling continually farther
behind their peers (Lewis, 2008; NRC, 1998). An effective school leader does not
minimize the effects that poverty can have of students, nor do they minimize any out of
school experiences that hinder learning, yet they certainly set the tone and expectation
that all will learn (Blankstein, 2004; DuFour, DuFour, & Eaker, 2008). Effective school
leaders understand that most educators entered the teaching profession with a sense of
social justice and a hope to make a difference in the lives of children. Priorities are placed
on high quality and effective instruction for all students (Blankstein, 2004). The moral
purpose remains intact in most educators and bringing out the continual commitment is
one function of leadership (Blankstein, 2004; DeLorenzo et al., 2008; NRC, 1998;
Walker Tileston & Darling, 2008).
Highly effective educators understand the importance of results and
accountability (Blankstein, 2004; Marzano & Waters, 2009). A function of the best
leaders is to ensure that the curriculum, instruction, and assessment are aligned to the
55
state standards. They work with staff to ensure that all learning is focused on what
students need to know and be able to do and establish effective assessments to determine
the effectiveness of their school programs (Blankstein, 2004; DeLorenzo et al., 2008;
NCLB, 2002; NRC, 1998; TPG, 2007). Practices are grounded in research and proven to
be effective with teachers (NCLB, 2002; TPG, 2007). Data is analyzed and a
professional culture is established where everyone is allowed to critique the work of
others in a proactive and collegial manner (Hess, 2005).
Even though Title I is categorical assistance to impact the achievement of low
income students, it is imperative that school leaders use Title I funding to enhance the
instruction of students who are struggling the most academically; regardless of their
socioeconomic status (Hess, 2005). The success of all students has become a significant
priority since the passage of NCLB (2002) and with the recent changes in the use of
either schoolwide or targeted assistance as a means of addressing academically struggling
students; either program can be used effectively to address targeted populations (NCLB,
2002; TPG, 2007).
We know that disadvantaged students tend to make up a significant portion of all
students who fail and by concentrating efforts on the academically at-risk, the intent of
Title I funding is still maintained (Hess, 2005). Schoolwide assistance is designed to
impact all students with a particular concentration on the academically struggling while
the central purpose of targeted assistance is focusing on the most academically challenge
students who are at risk of failing (TPG, 2007). A decision about who to focus funding on
is in the inherent nature of Title I. School leaders need to ensure that the focal point

56
remains helping all students succeed regardless of the chosen use of funding option
(Allington & Walmsley, 2007; NRC, 1998).
Schools that do well despite the challenges they face with disadvantaged students
do so, in large part, because of effective leadership (Allington & Walmsley, 2009; Lewis,
2008; Marzano & Waters, 2009). Hess (2005) believes that there is no more important
individual in a school building than the principal. Principals need to focus the building on
establishing the proper priorities, setting the conditions for success, and have an
understanding of how a solid reading program will effectively impact the students in their
building. District support staff must ensure that the principal and the school have
opportunities for success by providing the proper resources and establishing the right
parameters across the district (Marzano & Waters, 2009). Principals must be allowed to
be the instructional leader of the building with a minimization of managerial tasks
(Blankstein, 2004; DeLorenzo et al., 2008; DuFour et al., 2008; TPG, 2007).
As the instructional leader, the primary objective of building principals should be
to ensure that high quality adult learning and collaboration takes place that will positively
impact student achievement. All discussions and decisions should revolve on the impact
student learning they will have on the achievement of students (DuFour & Eaker, 1998;
Hess, 2005). Principals need to understand their role as the instructional leader of the
building involves the primary tasks of coaching adults or helping teachers become better
at their craft and impressing upon the students the priority of academics in a school
building (Hess, 2005). The primary goal of an instructional leader or coach is to increase
the capacity of the staff working with children. Professional development, with proper

57
coaching, that centers on student learning and best practices with time for the adults in
the building to collaborate and discuss best practices and to review student achievement
data is imperative in propelling schools forward (DuFour & Eaker, 1998; Hess, 2005).
Effective leaders are able to read the culture and climate of their building and
know how to blend together their own leadership to have maximum impact on student
learning. Many school leaders have this skill, yet few take the actions necessary to truly
become effective. When the time is right to implement changes, far too often in
education, we fail to act. In education, particularly in the neediest schools, we allow
resistance to change to grow instead of acting. Leaders need to alter their habits by
making more timely changes (Hess, 2005). Education is a highly personal business with
those living in poverty the most in need of a personalized education (Walker Tileston &
Darling, 2008). School leaders have a moral imperative to make changes quickly that will
benefit students and to ensure that the education of youth is not subservient to the needs
of the adults in the building (Blankstein, 2004; DeLorenzo et al., 2008; DuFour et al.,
2008; Hess, 2005).
Processes and procedures should first be determined school and district wide to
ensure the proper focus and allocation of resources. You must first determine the
direction needed (Blankstein, 2004; DeLorenzo et al., 2008; DuFour et al., 2008; Hess,
2005). Hess notes that in a traditionally recalcitrant institution, you may need to jolt the
system to help people understand that you are serious about the change that is needed. If
you allow resistance to grow, the bureaucracy will overtake you. When principals have
demonstrated the ability to move a school forward and properly have established

58
priorities, more discretion must be allowed (Blankstein, 2004; Hess, 2005). The more
success that a principal can demonstrate with their staff, the more leeway they should be
allowed. If a building is not producing, then more oversight may be necessary. If children
are making appropriate progress, then building leaders need to be allowed the opportunity
to tailor the programs in their building to best meet the needs of their students
(DeLorenzo et al., 2008; Hess, 2005). Building leadership understands the unique needs
of their population and must be allowed the opportunity to innovate, be creative, and take
risks that will deal with their students in ways that they determine to be most effective. At
this point effective district leadership should be working to free the building of excessive
policies and mandates so that they have the freedom to act (DeLorenzo et al., 2008; Hess,
2005).
Being the leader in a school with high needs is a stressful situation. Lower income
schools are often plagued with low paying positions, few resources, lack of recognition
for success and other obstacles creating a more difficult leadership position. Many
effective leaders do not remain for long periods of time in their positions (Lewis, 2008).
Unfortunately, a drawback to effective leadership playing such a key role in a school’s
success is that when the leader leaves, the success does not sustain itself (Lewis, 2008).
Districts need to ensure that effective leadership is rewarded and retained (Hess, 2005;
Lewis, 2008).
Whatever the specific paths that are taken to enhance the learning of struggling
students by school leaders, the path must be a comprehensive reform (Hess, 2005; TPG,
2007). Effective educators acknowledge the difficulties they face with a disadvantaged

59
population, but do not accept excuses for failing to meet the needs of students. They
understand that it takes a community investment to impact students’ lives and seek out
opportunities to engage parents and community members in whatever manner would
provide the most success (Hess, 2005; Houston, 2008; NCLB, 2002; TPG, 2007). They
understand the importance of impacting the community of students as well as their school
day. Effective leaders take all of the best practices and weave them together into an
effective learning environment for all students (Hess, 2005; Houston, 2008; NCLB, 2002;
TPG, 2007).
Funding and Achievement Research
There would seem to be a common sense relationship between school funding and
the ability of students to meet their academic goals. One would think that such an
argument would not exist; however, there are opposing views (Klein, 2009). This study
will set out to determine what research says about the impact of Title I funding on the
reading achievement of fifth grade students through schoolwide assistance and targeted
assistance.
Results of funding in education and the adequacy of funding for education are
inconclusive (Hill, 2008; Klein, 2009; Viadero, 2008). While the argument that no price
can be put on the proper education of a child is a valid moral argument, some argue that
funding is already at adequate levels to provide a high quality education for all children.
One issue noted with Title I is that the federal government allocates funds through a
combination of the number of low income students and the state per student expenditure
(Podesta & Brown, 2008). This effectively puts states with a low tax base at a

60
disadvantage because of the low level of their state expenditure on students (Viadero,
2008). States with the highest poverty rates also tend to have the lowest tax base leading
to less of an infusion of Title I money. This is the opposite of the intent of Title I (Podesta
& Brown, 2008).
Another issue noted by Hill (2008) and Viadero (2008) is that it is not the amount
of funding, but rather the use of the funds. Schools could do a better job of allocating
funds for specific uses or of using their existing funding base as it was intended by
taxpayers. When categorical funding such as Title I is increased some school districts
have reallocated local funds to decrease the intended increase for this group of students.
This effectually negates the purpose of this categorical benefit (Hill, 2008; McKinnon,
2009). This replacement of local funds with federal funds is counter to the general
purpose of categorical funding. Categorical funding is intended to supplement local funds
for programs and not to supplant it (Kimbrough & Hill, 1981). Zigler (2009) expresses
that schools that receive Title I funding spend the resources on an array of services and
do not focus their efforts enough to impact the achievement of students adding another
dimension to the allocation of Title I funds. A more focused effort on the early
elementary reading needs of students to follow up the gains that have been made by many
states with preschool education is needed (Pogrow, 2005). Use the resources for a central
theme instead of the myriad of options currently available through Title I and
achievement of the disadvantaged will follow (Zigler, 2009).
Local funding is a politically charged issue and so deeply engrained the American
education system that changes in the methods of funding may not be possible

61
(McKinnon, 2009; Miller, 2008). Local funding, when not equalized by federal or state
funds, naturally creates a disparity in funding across the country. Lower property values
equal smaller local tax bases that equate to less money for schools. For an area with a less
property value to generate the same amount of money as a higher property value,
residents have to share a larger burden through a higher tax rate. This increases their
share of the burden (Hill, 2008; Miller, 2008). Miller claims that this system of property
tax revenue is antiquated and based upon ideals from the nineteenth century when the
wealthy and the poor lived within the same taxing area and shared the same public
schools. Federal and state funds are needed to offset this change along with less reliance
on local property tax revenue. If not, then the disparity will grow. Miller estimates the
level of federal spending should increase to 25% to 30% to limit the impact of the
inequalities caused by property tax funding through local control.
Some opponents have pointed to minimal or no significant increase in test scores
to correspond with comparable increases in funding (Barton, 2004). Barton would argue
that there is no evidence to support increases in achievement when money is infused into
a system. Greenwald et al. (1996) argue the opposing view point when they note that
school financial resource levels are positively associated with student achievement. That
increase in resource allocation can have a significant positive effect of student
achievement. Dobbs (2004) agrees when he states, when substantial funding changes are
initiated with primary grade students that there is a slow, but gradual improvement in
student achievement that will sustain itself given enough time. Funding changes that have
been initiated in some states simply need more time to prove their ability to change. More

62
knowledge on this topic will be gained with the significant increases in federal funding
through the American Recovery and Reinvestment Act, according to Randi Weingarten
the president of the American Federation of Teachers, “If the money is well spent, and if
we’re able to maintain and improve educational outcomes for kids, we will make a
powerful case that money still matters” (Klein, 2009, p. 24).
Interestingly, Dobbs (2004) also notes that there has been no significant change in
the achievement of students with an influx of funding. According to Dobbs, there has
been little change in the overall achievement of schools when funding levels were
increased. He cites examples of schools in South Carolina and New Jersey where great
pains were taken to level the financial playing field. The intended purpose was to allow
equal opportunity for low income students. These states saw little change in their overall
achievement levels. Individuals can lie on either side of the argument, or in Dobb’s case,
both sides.
Research has not provided a definitive answer as to whether or not increased
financing results in a corresponding increase in achievement, nor can it probably do so
until more long-term studies are completed and funding equities remain stable. Far too
many states, as is the case in Illinois, rely on local property taxes to supplement funding
for public services (Winfield, 2009). During difficult financial times the battle for public
finances can be a difficult one. Consistent financing needs to remain in order to truly
ascertain the correlation. There are many factors that lead to increase student
achievement. An influx of money to low income districts is just one factor that may help
improve overall student performance (Carey, 2004; Hill, 2008).
63
Even when money is provided to financially poor districts, there is great inequity
in the manner in which this financial gain is allocated (Carey, 2004). School districts
have not always distributed their funds based upon academic need. Frequently funds have
been distributed to schools based upon budgetary means. One example, provided by
Carey, is that funds allocated for staff salaries are distributed based upon the salary of
each staff member. Typically the lower performing schools with the highest low income
students receive less because they tend to have the least experienced teachers who make
the least (Hill, 2008). Staff placements and union contracts can be a prohibitive factor
when improving student achievement. Generally one would argue that the most
experienced teachers would be most capable of providing the best education for
disadvantaged students, yet placement is not always determined by the greatest need
(Hill, 2008). It would seem that when allocating funds, the decisions need to be based
upon the total dollar figure rather than the allocation of staff members. If not, the
appearance of inequitable distribution of funds will exist (Carey, 2004; Hill, 2008;
Podesta & Brown, 2008).
Funds need to be allocated and targeted properly to have the most impact in
schools. Principals report difficulty with state and district officials in restrictions that are
put on the use of funds. They also report confusion on how to properly and best use Title
I funds (USDE, 2003). Hill (2008) argues for a better reallocation of funds. Under current
systems and methods of allocation, it may not be possible to determine how to best use
funds and what individual interventions may be providing the best results. He states that
we may not end up with a better type of education, but rather a more expensive one.

64
In the United States, we must face the fact that inequality of funding is still an
issue and will continue to be an issue for the foreseeable future (Podesta & Brown, 2008).
Resources are limited and with the advent of tax caps in Illinois, schools face a future of
limited increases in revenue. The recent 0.1% increase in the Consumer Price Index, the
CPI, is a good example of how funding will need to be pared back and schools will need
to become much more cognizant of how they spend finances (Malone & Napolitano,
2009; Rado, 2009). All of this comes at a time when the federal stimulus package is
intended to increase financial options for students and help reduce the so called
“unfunded mandates” imposed by No Child Left Behind (Malone & Napolitano, 2009;
Rado, 2009; Toppo, 2009).
What remains to be seen is how the economic downturn will mesh with local
funding to prevent a reduction in services. Title I has been mentioned as a significant
benefactor in the stimulus package with noted increases of $5 billion in 2009 alone
(Dillon, 2009; Malone & Napolitano, 2009; & Mehta & Song, 2009). Critics argue that
this will lead to a significant expansion of the federal government in the role of education
and shift the balance of power from the state and local level (Mehta & Song, 2009). We
need to be careful to provide the funding where the most need is, acknowledge that the
American school system is made up of an unbelievably unique set of school systems and
to ensure a minimization of micromanagement from the federal government so that
schools have the freedom to meet the needs of their students (Sack-Min, 2009).
Proponents argue that the role of the federal government in the achievement of the
disadvantaged is long overdue and will help level the educational opportunity for this

65
long neglected subgroup. It has led to a renewed call for national standards and would
eliminate some of the concerns over reliability with NCLB (2002) and states setting their
own accountability standards (Hoff, 2009; Weingarten, 2009). Critics call this a case of
“federalism” while proponents counter that it is “nationalism” with the distinction being
that the federal government would not set the standards, only support the cause (Hoff,
2009). Certainly the movement is gaining momentum. What remains to be seen is if this
movement will continue forward or bow to the political pressure that past efforts have
conceded to difficult to overcome (Hoff, 2009; Weingarten, 2009).
It is generally agreed that substantial work on education policy will not begin
until later in the year 2009 with potential passage of a bill in 2010 well before the 2014
deadline established by No Child Left Behind (Sack-Min, 2009). While the actual
outcome of new legislation is unknown, there are certain common characteristics
mentioned. The federal roles in accountability and funding are at the top of nearly
everyone’s list (Sack-Min, 2009). Expansion of the experimental growth model and the
potential use of multiple assessments to demonstrate adequate student progress will
certainly contrast the rigid, “one size fits all” model that is currently in place. Concern
still exists regarding helping the economically disadvantaged who will more likely face
sanctions in the near future without changes to either accountability of funding to provide
higher quality of service (Sack-Min, 2009).

66
CHAPTER III
METHODOLOGY
The purpose of this chapter is to outline the methodology used in this study. The
chapter begins with a statement of the research problem, lists the research question, states
the hypothesis, describes the population studied, the process for choosing the sample
population and refining the study, the IRB approval process, the procedure used for
gathering data on the target population, the procedure for analyzing the data, and the
limitations of the study.
Statement of the Problem
When Illinois school leaders of buildings with over 40% of their school
population identified as low income choose between Title I schoolwide assistance or
targeted assistance programs, which method of distributing Title I funds is associated
with higher reading achievement scores in fifth grade as measured by ISAT? With the
onset of NCLB (2002) schools that qualified with 40% or more of their population
considered low income were given a choice in either schoolwide assistance or targeted
assistance for qualifying students. Prior to 2002, schools did not have this option (TPG,
2007).
This study will examine whether schools using Title I funds for either schoolwide
assistance or targeted assistance are associated with higher achievement in fifth grade
reading scores as measured through the Illinois Standards Achievement Test. There is a

67
limited amount of research available to help school leaders in determining which method
of distributing Title I funds is associated with higher reading achievement scores in fifth
grade as measured by ISAT. A comparative study will be conducted between schools
choosing schoolwide or targeted assistance methods of distributing Title I funds, with
fifth grade students reading scores on the ISAT from 2006 and 2007. In generalizing the
outcome of this study to the larger target population, findings of this study will add to the
body of knowledge that exists in helping school leaders determine the impact of
schoolwide assistance and targeted assistance on reading achievement, and thus better
inform decision-making efforts when choosing their method of allocating Title I funds.
Data from the Illinois Interactive Report Card website is demonstrative regarding
fifth grade achievement scores on ISAT. Appendix A, IIRC data, demonstrate that fifth
grade achievement scores for low income students throughout Illinois have increased
from 38% of students meeting or exceeding standards to 58% from 2002 to 2008. This is
a 20% increase in the overall achievement scores on ISAT in fifth grade over the six year
time frame (NIU, 2008). Students who were in the category of “not low income”
increased over the same time frame from 72% meeting and exceeding in 2002 to 86% in
2008, a 14% increase. While all test scores in Illinois rose from 2002 to 2008, a slightly
larger increase has occurred with low income students (NIU, 2008).
Hypothesis
From the data of the study, the researcher predicts that reading achievement
scores as measured on fifth grade ISAT for both schoolwide assistance programs and
targeted assistance programs in Illinois have increased from 2006 to 2007. Because the

68
number of schools across the nation choosing schoolwide assistance rose from 10% to
58% from school year 1994-95 to school year 2004-2005 (USDE, 2007) the researcher
hypothesizes that a larger increase in reading achievement will be measured on fifth
grade ISAT from schools implementing the Title I schoolwide assistance model. The
researcher theorizes that school leaders, as a group, will choose a method of distributing
funds that result in higher achievement. The larger increase in ISAT reading
achievement scores in fifth grade from 2006 to 2007 for Title I schoolwide assistance
programs may or may not be significant.
Research Question
This study will address the following question:
When Illinois school leaders of buildings with over 40% of their school
population identified as low income choose between Title I schoolwide assistance or
targeted assistance programs, which method of distributing Title I funds is associated
with higher reading achievement scores in fifth grade as measured by ISAT?
Population
Influencing factors in choosing the population for this section include the
convergence of fundamental reading processes at the fifth grade level, frequent changes
in ISAT measures, distribution of Title I funding, decision of school leaders in choosing
schoolwide or targeted distribution of funds, and the composition of suburban Chicago
demographics.
69
Choice of Fifth Grade Students
This study focuses on fifth grade students because the nature of learning to read at
this age has evolved more deeply into comprehension (Borman et al., 2001), content on
Illinois Standards Achievement Test contains items designed to assess a student’s ability
to master early reading skills as well as comprehension within content areas (ISBE,
2007). The researcher has made an assumption that the culmination of elementary
reading skill learning peaks in fifth grade.
Simplistically, one could argue that learning to read can be divided into the
fundamental processes of decoding to begin the initial reading processes and focusing on
the higher order thinking skills required to understand and comprehend the material that
is read (NRP, 2000; Pogrow, 2005). Around third grade, the cognitive ability of children
begins to change resulting in a need for a different type of instruction for reading
comprehension (Popgrow, 2005). Since one could argue that decoding and
comprehension are equally important and that the purpose of all reading is to learn to
understand the material being read (NRP, 2000; Pogrow, 2005), this study has chosen to
focus on a grade level where both of these reading skills are required for learning in
Illinois: in fifth grade. The Illinois Assessment Frameworks in fifth grade begin the more
complex process of assessing a student’s ability to comprehend and understand written
material leading to an increased emphasis on the ISAT for testing comprehension skills
(ISBE, 2007).
Individual elementary school buildings in Illinois contain a large variety of
configurations such as K-2, K-5, K-6, and K-8. According to the Illinois State Board of

70
Education, most elementary buildings are structured to include some arrangement of fifth
grade students (ISBE, 2007b). Based upon the configuration of grade levels in schools
and the assumption by the researcher that grade five is a culmination of the elementary
learning experience for many Illinois students, fifth grade was chosen.
Use of ISAT for Fifth Grade
ISAT is a criterion-referenced assessment that measures how well students are
achieving relative to the Illinois Learning Standards (Ponisciak, 2005). Results are
measured on scale scores. Cut points are established within score ranges and converted to
performance levels of exceeds standards, meets standards, below standards, and academic
warning (NIU, 2008). These performance levels can then be established for each
individual student test score. Scores are reported for a school’s performance based upon
the number of students in each category (NIU, 2008). For the purpose of this study, the
researcher intends to compare the percentage of students in fifth grade in a building that
are meeting standards or exceeding standards in 2006 to the percentage of the population
meeting or exceeding in 2007.
The ISAT was first piloted in Illinois in 1999 and then utilized statewide in 2001
(Srikantaiah & Swayhoover, 2008). Illinois did not consistently test all grades prior to the
2006 testing session. However, when No Child Left Behind mandated yearly assessments
in 2006, all grades from third through eighth were assessed. Before 2006, testing was
only conducted in grades 3, 5, and 8 for elementary and middle schools (NIU, 2008). To
provide a consistent number of years of data and to establish trends in future studies, one

71
of these grades on the ISAT was necessary to select. Fifth grade scores on the ISAT were
chosen by the researcher.
Title I Funding: Schoolwide Assistance and Targeted Assistance
School leaders may use Title I funds for children from preschool age to high
school (TPG, 2007). Sixty-five percent of students served through Title I funding are in
grades one through six. Another 12% of students served through Title I are in preschool
and kindergarten programs. School leaders employ just under 80% of all Title I funds for
use with elementary students sixth grade and under (IES, 2007). For this reason, the
researcher chose to focus the study in an elementary grade, specifically fifth grade.
Greater flexibility in the use of federal grants has been allowed with the advent of
No Child Left Behind. One of the areas with greater flexibility was in Title I categorical
funding. Schools are now allowed the option of implementing a schoolwide system
according to Section 1114 of NCLB (2002) or in targeting their assistance as noted in
Section 1115 of NCLB (2002) to students if their overall low income level at the school
is 40% or higher, as determined by Title I criteria. The most commonly used criteria is
free and reduced lunch data (TPG, 2007). Since the establishment of Title I in 1965,
schools have generally targeted the assistance to students who were in most need (NCLB,
2002; TPG, 2007).
When originally introduced as an option in 1978, schoolwide programs were
based upon the concept that by improving the overall educational opportunity of all
students that the needs of all would be met. More has been learned since that time and
local education agencies are now more likely to implement a comprehensive school

72
model to improve the performance of all (TPG, 2007). The U.S. Department of Education
asks that schools consider whether the program is likely to improve the performance of
the lowest performing student or whether it is more likely to be effective at enhancing
their performance by targeting additional programs only to these students (NCLB, 2002;
TPG, 2007).
Although schools had the flexibility in choosing either a schoolwide program or a
targeted assistance model since 1998, No Child Left Behind added another layer of
flexibility for schools considering a schoolwide program. Prior to NCLB (2002), the
threshold of 50% poverty was the guideline for local education agencies to have a choice.
NCLB (2002) lowered that level to 40% allowing more schools the option of choosing
schoolwide assistance (NCLB, 2002; TPG, 2007). Critics have argued that the level is too
low and the intent of the law has been diminished with this flexibility. Proponents argue
that impacting the entire school program is more effective and by allowing more
flexibility, more students will be served (TPG, 2007).
The important distinction between the two Title I programs is that schoolwide
programs are comprehensive reform designed to upgrade the entire educational program
whereas targeted assistance is designed to provide support only to the identified students
(TPG, 2007). A growing body of evidence shows that when implementing a schoolwide
program that it is possible to increase the achievement of all students, including the
economically disadvantaged, regardless of the overall demographics of the school (TPG,
2007). With the relaxation of restrictions on schoolwide programs, more and more
73
schools are choosing this type of Title I program with the use of federal funds to enhance
the learning of all of their students (USDE, 2007).
Data from federal Title I funding provided to individual schools will be analyzed
to determine if schoolwide assistance or targeted assistance is associated with increases in
the overall ISAT fifth grade reading scores of selected schools in Illinois. Schools with an
enrollment of less than 200 or more than 1000 will be excluded from this study to provide
a more reliable source of data over time and to better compare results to studies
conducted by the U. S. Department of Education (NIU, 2008). The primary selection
criterion, of schools over 40%, was chosen because these schools are allowed the option
of implementing schoolwide or targeted assistance. Schools must designate annually and
report to the state which method they have selected for distributing Title I funds (TPG,
2007).
The School Leaders Decision-making Role
Over time, the researcher believes that school leaders have worked to become
more inclusive in their service delivery model to Title I students. The researcher has
made the assumption that more schools are reducing their “pull out” approach and
delivering more services to children in general classroom settings so that students may
benefit from both classroom instruction and additional services provided through Title I.
The researcher believes this will result in a movement toward more elementary school
leaders in Illinois choosing schoolwide assistance.
Under NCLB (2002), school leaders were given the option of choosing either a
schoolwide program or in targeting their assistance with the funds provided by Title I

74
depending on the level of poverty that exists in their building. If the overall level of low
income, free or reduced lunch eligible students, is at 40% or higher school leaders may
choose whichever program they believe will most benefit their students (IES, 2007;
NCLB, 2002; USDE 2002b). From the school year 1994-95 to the school year 2004-
2005, the number of school leaders choosing schoolwide assistance rose from 10% to
58% (USDE, 2007). This study seeks to find if the increase in schoolwide use of funding
is associated with higher achievement in fifth grade. The current trend is a movement
toward schoolwide use of funds and school leaders face the choice of schoolwide or
targeted assistance with very little guidance or research to support their decision. The
purpose of this study is to examine whether schoolwide assistance or targeted assistance
through Title I is associated with higher reading achievement scores in fifth grade as
measured through ISAT. The results of this study will help school leaders determine if it
is more effective for reading achievement to use Title I funds in a schoolwide manner or
if it is more effective to target their assistance.
Continued and best use of Title I funds is an important issue for school leaders
because the achievement scores of low income students still lag behind the scores of their
more advantaged peers. Low income students in Illinois have scored lower on the Illinois
Scholastic Achievement Test, ISAT, every year: 34% to 15% below their more
advantaged peers in third grade from 2002 to 2008, 34% to 19% lower in fifth grade, and
30% to 17% lower in eighth grade (NIU, 2008). By reviewing these data from the Illinois
Interactive Report Card in Appendix A, one will see that low income students in Illinois
are not performing to the same level as their more advantaged peers. School leaders are

75
under increasing pressure to bring all subgroup populations up to the target goals
established by the state and federal government since the inception of the No Child Left
Behind act, making the proper use of federal Title I funds an increasingly more important
issue (Mintrop, 2008; Sack-Min, 2009). There would seem to be a common sense view that would say if a school is better
financed, that the students will be better enabled to meet their academic goals (Klein,
2009). This study will set out to determine what research says about the use of funds
through Title I for schoolwide assistance and targeted assistance and give school leaders
a better sense of which direction to turn when using federal funds from Title I. Is either
schoolwide or targeted use of funding associated with higher reading achievement for
Illinois students in fifth grade? Hill (2008) says that even when adequate funding is
available in schools, that if it is not appropriately focused it will not necessarily produce
desired increases in student achievement. Determining whether to apply Title I funds to a
targeted set of students or whether to institute a schoolwide program can mean a
substantial shift in financing of building level resources. This study will provide evidence
of the effectiveness of increasing the overall reading achievement of the school through
schoolwide assistance is more effective or if the targeted assistance at selected schools
results in higher achievement scores as measured by fifth grade ISAT reading.
Demographic Area
Schoolwide assistance and targeted assistance schools were chosen from schools
that were identified through the Freedom of Information Act, FOIA; request listed in
Appendix B. The FOIA identified schools represent a broad cross section of schools in
76
north suburban Chicago, Illinois. Schools were chosen from the immediate Chicago
suburban counties which for the purpose of this study were Cook, DuPage, Lake, and
Will counties. Due to the unique nature of the Chicago Public School system, any school
within CPS was eliminated to allow a better comparative study of suburban schools. The
researcher further attempted to control for demographics by limiting the selected schools
to Lake and northern Cook counties, as identified by the Illinois School Board
Association (Illinois State Board of Education [ISBE], 2007). It is acknowledged by the
researcher, that the chosen schools will still vary in their demographic consistency.
Schools will only be selected if they have allocated funds through the same method,
schoolwide or targeted assistance, in both comparative years of 2006 and 2007.
Choosing the Sample Population and Refining the Study
Choosing the population for this section was somewhat challenging. The original
study was to be a simple t-test comparing the mean scores for fifth grade ISAT reading
over a multi-year period between schools in the suburban Chicago area selecting
schoolwide and targeted assistance distribution of Title I funds. Data were received
through a Freedom of Information Act request from Illinois State Board of Education and
eligible schools were identified. Schools were determined eligible for this study if they
had met the 40% low income threshold and selected the same method of distributing Title
I funds for each year.
Data were requested from 2002 to 2008 from ISBE but were only available for
2005 to 2007. Title I designation prior to 2005 was unavailable from at the state level and
thus limited the study years. Further research determined that cumulative school ISAT

77
scores were altered in the year 2005 due to the inclusion of all non-English speaking
students’ scores. Illinois previously had used the IMAGE, Illinois Measures of Academic
Growth Exam, for this population. With the inclusion of this population of students, the
validity of comparing years prior to 2006 was no longer viable because the population of
students compared was no longer similar.
There were a number of challenges in choosing schools for this study. Several
schools on the original list did not include a fifth grade population. Schools from the list
that did not contain a fifth grade population in the years 2006 and 2007 were removed.
All schools on the list received from ISBE that were identified as containing a fifth grade
population were separated out if also listed as having consecutive years of leaders solely
choosing schoolwide or targeted assistance. Any schools that were included in the FOIA
request, yet did not meet all the criteria, were removed from the list of eligible schools
and not included in the sample population.
The original research method was to be a paired t-test, comparing the mean
reading achievement scores of the schoolwide and targeted schools. The researcher
attempted to limit other potential factors so as to increase the likelihood of finding a valid
assumption that the change in reading achievement score was due to the method of Title I
funding distribution chosen. Selected schools were closely matched with racial category,
income level, previous year reading achievement score, and demographics within Lake
County, Illinois. The results yielded a very small sample which was an unacceptable
number of schools to compare for a valid study. When the sample was expanded within
78
each of these parameters, the researcher was unable to maintain a close enough match
between schools and yield a high enough number.
After discussion of various options and potential changes to research
methodology, it was decided to account for the common variables of demographic area,
race, and income level through an Analysis of Covariance or ANCOVA. Since schools
could not be matched closely enough with these factors, it was determined to account for
the variables in the research instead. Demographic area was expanded to Cook, Lake,
Will, and DuPage counties. Income level was controlled for by limiting the low income
level to 40% to 80% and the student population in the school to between 200 and 1,000
students. Still an insufficient number of schools were pulled from the ISBE data. The
original list of 493 schools was narrowed to only 15 schoolwide and 65 targeted. The
researcher’s advisors agree that this was insufficient and suggested alternative methods of
grouping or perhaps even an alternative variation of the study.
Consideration was given to expanding the study to the entire state with the caveat
that schools, even though all would be in Illinois, may have very little in common.
Another consideration was to choose fewer schools and very closely match them. This
idea was discarded due to the significance with such a small sample population. Finally,
it was decided to expand the upper limit of income criteria to 90% and to observe how
this impacted the overall number of schools in each category. This change altered the
number of eligible schools to 32 schoolwide and 72 targeted. Of this number, only seven
schools were deemed eligible for the study from Will and DuPage counties. The decision
79
was made to eliminate all schools from these two counties since the impact would be
minimal on the overall population chosen.
The remaining dilemma the researcher faced was the variability between schools
in Southern Cook County and northern Cook and Lake counties. When using guidelines
established by the Illinois School Board Association to separate out northern Cook and
Lake counties as the target population, 16 schoolwide and 21 targeted schools remained
eligible. It was argued that even though two counties were remaining, the schools in
northern Cook County share many common characteristics and educational philosophies.
The researcher’s dissertation advisors agreed that although the number of remaining
eligible schools was on the lower end, the number was defendable and the counties were
similar enough in their population. With the common characteristics these schools now
shared, it was determined that the only variable that would be accounted for in the
ANCOVA would be the three racial categories of White, Black, and Hispanic. The
remaining schools had very small racial populations of multicultural and Asian. Due to
the small populations, these variables would not be used in the study.
The criteria for the study were then finalized. Schools included in the study
contain a fifth grade population in northern Cook and Lake counties, are between 40%
and 90% low income, housed between 200 and 1,000 students, and chose either
schoolwide or targeted assistance for two consecutive years in 2006 and 2007. Variables
still to be accounted for were the racial designations of White, Black, and Hispanic as
reported on each schools state report card available publicly from ISBE.

80
Institutional Review Board Approval
IRB, or Institutional Review Board, approval was sought for contacting any of the
potential schools solely on the basis of the researcher determining if selected schools had
used any of their funds for math. It is important to note that information regarding ISAT
scores and Title I status is publicly available and the reason for personal contact with
school leaders was only to verify the use of funds for reading improvement. If a selected
school used funds for math, or was uncertain of the use of funds for either school year,
the school was eliminated from consideration and another school was chosen. The
researcher contacted the principal of each building to ask for such information or to
request direction to the appropriate school or district personnel who would have
information about expenditure of Title I funds. The script submitted for IRB approval is
listed in Appendix C.
Procedure for Gathering Data on the Target Population
Illinois Standards Achievement Test data were gathered primarily through the
school report cards of each of the selected schools and through the summary data listed in
the Interactive Illinois Report Card, http://iirc.niu.edu/. These data are publicly available
through ISBE, the Illinois State Board of Education, and the IIRC website. ISAT overall
scores in fifth grade reading will be compared to note an increase or decrease in the
percentage of students meeting and exceeding state standards from 2006 to 2007.
Title I designations and funding amounts were gathered through ISBE. A
Freedom of Information Act, FOIA; request was mailed by the researcher on January 15,
2009 and data was received on March 3, 2009. Any information provided by ISBE prior

81
to school years 2006, 2007, and 2008 was removed from the original request due to
unavailability of Title I information prior to 2006. A copy of the FOIA request is
included as Appendix B. Since data from ISBE was limited to three academic years, the
study became more restricted.
The researcher chose to eliminate the school year 2008 due to reliability concerns
of ISAT data. Reliability in comparing data from 2008 to prior years 2006 and 2007 came
into question because of a change in the ISAT test results in school year 2008. Illinois
schools began testing all English Language Learners with the ISAT instead of the Illinois
Measures of Academic Growth Exam, or the IMAGE, language proficiency test (NIU,
2008). Data erroneously included information from a few high schools, middle schools,
and elementary schools not containing a fifth grade population. Since this study focuses
on fifth grade reading achievement, the potential list of schools from the original list was
reduced.
Ultimately the list of schools from ISBE included schools in the requested
counties which were: Cook without the City of Chicago, Lake, DuPage, and Will. To
more closely match the selected schools, the researcher then narrowed the group to
schools in Lake and northern Cook counties. Included was whether the school had
reported themselves as following the schoolwide assistance model and the amount of
Title I funding each school received. After submission of the IRB request, individual
school leaders were called by the researcher to verify whether or not the individual
schools used any of their Title I distribution for math or if they chose to use all the
available funding for reading. Schools that used any of the distribution for math, or that

82
could not verify if they did, were eliminated. The data were limited to only elementary
schools that included fifth grade and were between the 40% and 90% poverty level
defined by Title I. The researcher verified this information about the grade configuration
and income level of individual schools received in the FOIA request through Illinois
School Report Cards for 2006 and 2007. In addition to income level, the researcher also
collected data on race for federally identified subgroups of White, Black, and Hispanic
population as a percentage of total population. These data will be included as covariates
in the ANCOVA. Reported racial percentages for Asian population were not included
due to low reported percentages in the target school population. These data are all
publicly available on the Illinois State Board of Education web site at
http://www.isbe.net.
Procedure for Identifying School Leaders
The researcher identified the most current school leader through publicly
available records. The purpose of contacting school leaders and seeking IRB approval
was to verify the type of assistance chosen and if Title I funding was used solely for the
improvement of reading achievement. The building principal for the targeted schools was
identified through the Regional Office of Education, or ROE, listings of Lake and Cook
counties in Illinois. The web site of each ROE lists all of the schools and the principal of
each school in their respective counties (North Cook Intermediate Service Center
[NCISC], 2010). The researcher then contacted each principal from the telephone number
listed using the script submitted to IRB found in Appendix C. If the building principal

83
directed the researcher to another individual in the district, this individual was then
contacted using the same script (see Appendix C).
Procedure for Analyzing Data
The research question in this study was answered through both quantitative and
qualitative means. Qualitative research was used in verifying the use of Title I data. The
researcher telephoned school leaders selected from the sample population, as outlined
with the script in Appendix C, solely to verify the use of Title I funding for reading
purposes only.
From this broader suburban population, it is acknowledged by the researcher that
it is often difficult to see changes associated with variables in two years of data. Due to
the inability to control for all possible variables the ANCOVA, analysis of covariance
regression analysis, was chosen to reduce the unexplained variance that might occur
through possible variables of race and thus increase the precision of group mean
estimates in determining whether schoolwide or targeted assistance is associated with
higher reading achievement scores. From this population, the researcher administered the
ANCOVA program through a computer software package called Statistical Package for
the Social Sciences or SPSS v15.0. The choice of this program is for the purpose
comparing the mean values of fifth grade ISAT reading scores with schoolwide and
targeted assistance schools. The results of this were then compared to the covariates of
race to reduce the unexplained variance and thus increase the precision of group mean
estimates. After initial entry, all information was again checked for accuracy by the
researcher. A second party confirmed the data a third time. Results illustrated the current
84
information involving the distribution of Title I funding assistance and fifth grade reading
scores on ISAT.
The final population chosen represented schools with fifth grade populations in
Lake and northern Cook counties in Illinois that chose either schoolwide or targeted
assistance for both 2006 and 2007. Selected schools were to use all of their Title I
funding distribution on reading programs. The mean fifth grade ISAT reading scores
were compared for 2006 and 2007 between schools that chose schoolwide and targeted
distributions of Title I funds. These results were then compared to the racial categories of
White, Black, and Hispanic.
Limitations of the Study
The findings of this study are limited by several factors. The intent of the study is
to determine which source of Title I funding, schoolwide assistance or targeted
assistance, is associated with higher reading scores on the fifth grade ISAT. The ultimate
generalization is to provide school leaders with guidance in making decisions about their
use of Title I funding. The study is limited only to public schools. While private schools
in Illinois are allocated Title I funds, limits are placed on the amount and based upon
calculations from the public school area in which the private school is located (TPG,
2007). This study intended to focus only on public schools in Illinois and is therefore
limited in nature to this population.
The study attempted to control for location by choosing only schools located in
suburban Chicago counties of Lake and the northern section of Cook. This study has
limited for demographic location by restricting the schools to this suburban area of
85
Chicago. The researcher acknowledges the regional limits of the study to the immediate
Chicago suburban area which may not be transferable to a broader population in a
different demographic area. By limiting the study to schools in the suburban Chicago
area, the researcher acknowledges that the results obtained will not occur in every
situation outside of the conditions set within this study. State educational policies and
laws for the distribution of funding and curricular requirement vary across the nation.
Illinois has three separate tax systems in counties that have tax cap limits, those that do
not, and entirely different rules for the Chicago Public School System. The limited
number of schools and restrictions on selected counties decreases the accuracy of the
information and the reliability in predicting results from the generalized conclusions
obtained from the information in this study. This study is not exhaustive and all potential
factors may not have been accounted for that would affect the outcome.
Some states, such as Illinois, have changed the assessment used over the course of
the existence of No Child Left Behind (Aarons, 2009) making a comparative study
virtually impossible to complete with long term data. States have tended to first retract
the overall testing and type of testing prior to complying with the NCLB (2002). Illinois
is an example of a state that altered the testing bank of questions significantly for the
2005 ISAT. This has caused difficulty in comparing pre-2005 data to data after 2005.
According to ISBE, fifth grade reading scores were not significantly affected, another
reason this study only focused on fifth grade scores (ISBE, 2008; NIU, 2008).
Nonetheless, the study acknowledges the use of data prior to 2005 may not provide a

86
precise comparison of achievement and that a limit of this study is that it applies only to
the selected schools in the selected years.
Care was taken to account for the size of schools by selecting schools identified
from Illinois School Report Card data in the 200-1,000 student population range and for
low income level by selecting schools in the 40% to 90% range. Schools in this range of
low income would have the option of selecting their allocation method. The study
accounts for variables of ethnicity by including the covariates of the number of White
students, the number of Black students, and the number of Hispanic students. This
adjustment allows the researcher to reduce the observed variation between schoolwide
allocations and targeted assistance methods of distributing funds caused not by the
treatment itself but by variation of the covariates. The study chose to focus only on the
use of schoolwide and targeted funding; results may or may not extend beyond the
sample population. This study does not attempt to answer questions for all demographic
conditions; therefore, it is limited in scope only to similar populations. This study did not
attempt to account for all variations of low income students that would be possible. The
hope is that the study can first determine if there is a significant impact on the selected
demographic group that may be expanded upon in further research if determinations
indicate a significant change results in the selected group.
Recent economic times in a recessionary period have altered the current structure
of state budgets and may continue to impact financial investments in state education
systems. With a Consumer Price Index of only 0.1% for the 2010 school year (Malone &
Napolitano, 2009; Rado, 2009), both of the counties in this study may be impacted with
87
severe financial issues because of the tax cap law of 1991. This means little to no
increases in revenue for the next few years while school districts are already locked into
contracts that call for much higher increases (Malone & Napolitano, 2009; Rado, 2009).
Projected additional budget cuts could occur and the investment in educational budgets
could be more drastic since reserves have been drawn down or eliminated and states,
unlike the federal government, are not allowed to run a deficit (McNichol & Lav, 2008).
Cuts in state services could affect the group of students who benefit most from Title I
services. Social services provided by states are generally focused to help the most
disadvantaged (McNichol & Lav, 2008).
Finally, the new administration at the national level could mean changes in how
federal laws are interpreted and implemented. The new federal stimulus package includes
significant increases in funding to Title I. If this occurs, perceptions of the No Child Left
Behind Act and the inadequacy of funding arguments that have been made since 2002
may be altered (Klein, 2009; Sack-Min, 2009). How the increase in financing plays out
over time and whether it changes the future of federal financing or proves to be a one-
time infusion, will impact how states and schools use the funds (Klein, 2009). Early
indications are that regardless of the outcome, a reauthorized education bill will pay close
attention to the needs of the disadvantaged (Sack-Min, 2009). Therefore, the effective use
of Title I funds may become even more important to school leaders in the future.

88
CHAPTER IV
PRESENTATION AND ANALYSIS OF DATA
The chapter provides the results of the data analysis. This includes an overview of
the sample population and the characteristics of schools, data that emerged as a result of
contacting principals, the relationship between low income level and achievement scores,
the relationship between race and achievement scores using aggregate school-level data,
and the relationship between schoolwide and targeted assistance and achievement scores.
Schoolwide and targeted assistance are also compared descriptively in terms of racial
composition, socioeconomic status, and enrollment.
Below is a series of tables and figures that describe the information referenced in
this study. The information includes the overall characteristics of the schools included in
the sample population: the county in which the school is located, whether the school
chose schoolwide or targeted assistance for both 2006 and 2007, the percentage of low
income students in the school, the percentage of students in fifth grade meeting or
exceeding standards on the ISAT reading exam, the total enrollment of the school, and
the percentage of White, Black, and Hispanic students in each school. Further
information is included on the relationship between achievement, income, race, and
schoolwide and targeted assistance available through Title I.
89
Sample Population Overview and Characteristics
The table below is a set of data collected from schools chosen for this study on the
characteristics of the overall population of students in each school. Table 1: Sample
Population Overview and Characteristics, represents an overview of the characteristics of
schools in the sample population in 2006 and 2007. The applicable data are in Table 1.
The first column represents the number assigned by the researcher to the
identified school. This process was used by the researcher to protect the identity of
schools involved in the study. The actual names are listed in Appendix D. The assigned
number was used to identify the school while analyzing the data in SPSS Statistics v15.0.
The second column indicates the location of the school by the two counties, Lake
or Cook, in Illinois chosen by the researcher for this study. Schools included in this
sample population were either located in Lake County or northern Cook County of
suburban Chicago, Illinois. Schools not within the boundaries of these two areas are not
included in the study.
The third column contains whether the school leader chose schoolwide or targeted
assistance for both 2006 and 2007. If the school leader chose schoolwide assistance for
both years it is indicated as Yes. If the school leader chose targeted assistance for both
years, it is indicated with a No. Any school that did not choose either schoolwide or
targeted assistance for both 2006 and 2007 was not included in this study.
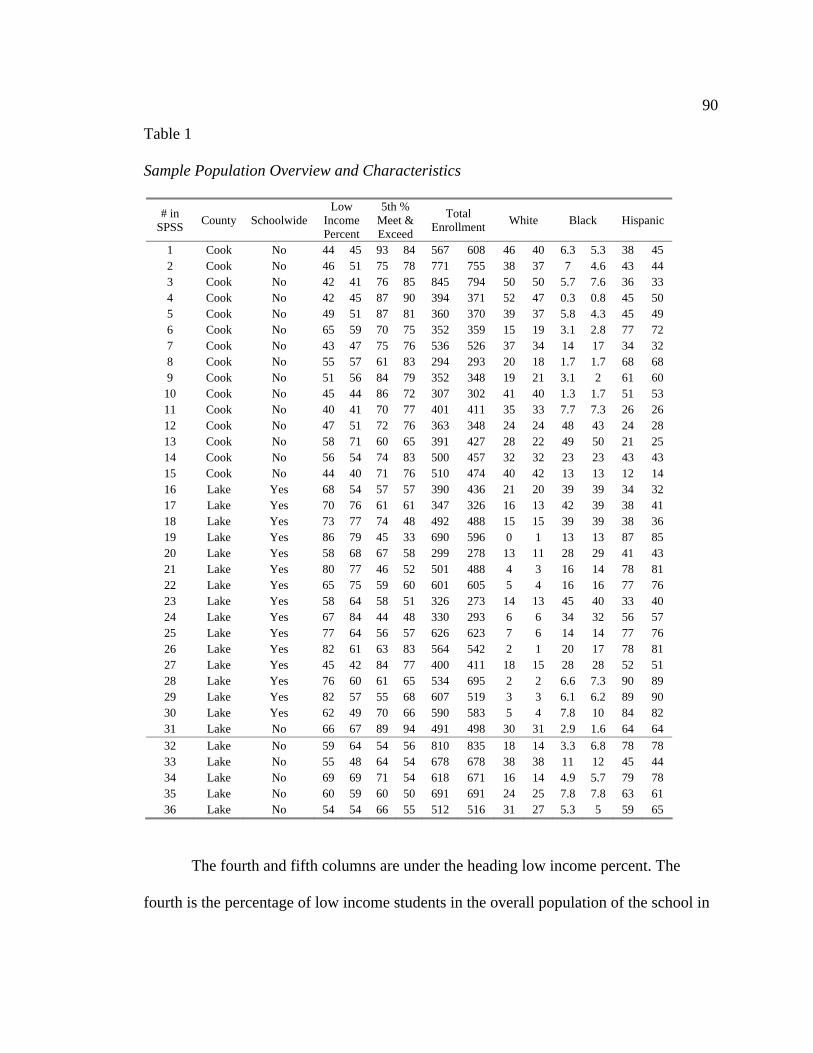
90
Table 1
Sample Population Overview and Characteristics
# in SPSS
County Schoolwide Low
Income Percent
5th % Meet & Exceed
Total Enrollment
White Black Hispanic
1 Cook No 44 45 93 84 567 608 46 40 6.3 5.3 38 45 2 Cook No 46 51 75 78 771 755 38 37 7 4.6 43 44 3 Cook No 42 41 76 85 845 794 50 50 5.7 7.6 36 33 4 Cook No 42 45 87 90 394 371 52 47 0.3 0.8 45 50 5 Cook No 49 51 87 81 360 370 39 37 5.8 4.3 45 49 6 Cook No 65 59 70 75 352 359 15 19 3.1 2.8 77 72 7 Cook No 43 47 75 76 536 526 37 34 14 17 34 32 8 Cook No 55 57 61 83 294 293 20 18 1.7 1.7 68 68 9 Cook No 51 56 84 79 352 348 19 21 3.1 2 61 60 10 Cook No 45 44 86 72 307 302 41 40 1.3 1.7 51 53 11 Cook No 40 41 70 77 401 411 35 33 7.7 7.3 26 26 12 Cook No 47 51 72 76 363 348 24 24 48 43 24 28 13 Cook No 58 71 60 65 391 427 28 22 49 50 21 25 14 Cook No 56 54 74 83 500 457 32 32 23 23 43 43 15 Cook No 44 40 71 76 510 474 40 42 13 13 12 14 16 Lake Yes 68 54 57 57 390 436 21 20 39 39 34 32 17 Lake Yes 70 76 61 61 347 326 16 13 42 39 38 41 18 Lake Yes 73 77 74 48 492 488 15 15 39 39 38 36 19 Lake Yes 86 79 45 33 690 596 0 1 13 13 87 85 20 Lake Yes 58 68 67 58 299 278 13 11 28 29 41 43 21 Lake Yes 80 77 46 52 501 488 4 3 16 14 78 81 22 Lake Yes 65 75 59 60 601 605 5 4 16 16 77 76 23 Lake Yes 58 64 58 51 326 273 14 13 45 40 33 40 24 Lake Yes 67 84 44 48 330 293 6 6 34 32 56 57 25 Lake Yes 77 64 56 57 626 623 7 6 14 14 77 76 26 Lake Yes 82 61 63 83 564 542 2 1 20 17 78 81 27 Lake Yes 45 42 84 77 400 411 18 15 28 28 52 51 28 Lake Yes 76 60 61 65 534 695 2 2 6.6 7.3 90 89 29 Lake Yes 82 57 55 68 607 519 3 3 6.1 6.2 89 90 30 Lake Yes 62 49 70 66 590 583 5 4 7.8 10 84 82 31 Lake No 66 67 89 94 491 498 30 31 2.9 1.6 64 64
32 Lake No 59 64 54 56 810 835 18 14 3.3 6.8 78 78 33 Lake No 55 48 64 54 678 678 38 38 11 12 45 44 34 Lake No 69 69 71 54 618 671 16 14 4.9 5.7 79 78 35 Lake No 60 59 60 50 691 691 24 25 7.8 7.8 63 61 36 Lake No 54 54 66 55 512 516 31 27 5.3 5 59 65
The fourth and fifth columns are under the heading low income percent. The
fourth is the percentage of low income students in the overall population of the school in
91
2006 and the fifth column is the percentage of low income students in the overall
population of the school in 2007. The percentage is what each school reported to the state
of Illinois in 2006 and 2007.
The sixth and seventh columns are under the heading fifth grade percentage
meeting and exceeding. The sixth column represents the percentage of fifth grade
students in the overall school fifth grade population that met and exceeded standards on
the reading portion of the ISAT in 2006. The seventh column represents the percentage of
fifth grade students in the overall school fifth grade population that met and exceeded
standards on the reading portion of the ISAT in 2007.
The eighth and ninth columns are under the heading total enrollment. The eighth
column is the reported number of all students enrolled in the school in 2006. The ninth is
the reported number of all students enrolled in the school in the school in 2007.
The tenth and eleventh columns are under the heading White. The tenth column
represents the percentage of the overall the student population in the building classified
as White in 2006. The eleventh column represents percentage of the overall the student
population in the building classified as White in 2007.
The twelfth and thirteenth columns are under the heading Black. The twelfth
column represents the percentage of the overall the student population in the building
classified as Black in 2006. The thirteenth column represents percentage of the overall
the student population in the building classified as Black in 2007.
The fourteenth and fifteenth columns are under the heading Hispanic. The
fourteenth column represents the percentage of the overall the student population in the

92
building classified as Hispanic in 2006. The fifteenth column represents percentage of the
overall the student population in the building classified as Hispanic in 2007.
Fifteen of the selected schools from the sample population are in Cook County
and 21 schools are located in Lake County. Fifteen school leaders selected schoolwide
assistance and 21 targeted assistance. All 15 of the schools that selected schoolwide
assistance were located in Lake County. Of the 21 schools selecting targeted assistance,
15 were in Cook County and six were in Lake County. The percentage of low income
students in all schools in the sample population ranged from 40 to 86% of the overall
school population. The overall population in all sample population schools ranged from
273 to 845 students. The percentage of overall student population identified as White in
all schools in the sample population ranged from 0 to 52%, Black from 0.3 to 50%, and
Hispanic from 12 to 90%.
Data that Emerged as a Result of Principal Contact
The researcher contacted the principals of all schools included in the sample
population to verify the use of Title I funds in their school. The intent of this study was to
determine if Title I schoolwide or targeted assistance was associated with higher reading
achievement. School principals were contacted to verify if funds were spent entirely on
reading or if any were spent on math interventions. When contacting principals as
planned for the study, issues evolved that the researcher did not anticipate. In nearly
every case, when the researcher contacted the principal, the researcher was directed to a
member of the district office. Principals either did not know or were not certain if any of
the Title I funding was used for math programs and interventions. Most often the
93
principal referred the researcher to a reading director or assistant superintendent when
asked if any Title I funds at the school were used for math in 2006 and 2007. As planned
in the IRB submission, the researcher thanked the principal and did not probe further with
questions. Many principals voluntarily replied with comments and summary of these
comments is noted in Table 2. It is important to note that the researcher did not plan for
this type of commentary in the study and did not ask for elaboration of any commentary
made by principals.
The original question was:
When Illinois school leaders of buildings with over 40% of their school
population identified as low income choose between Title I schoolwide assistance or
targeted assistance programs, which method of distributing Title I funds is associated
with higher reading achievement scores in fifth grade as measured by ISAT?
Based upon responses received, it was determined by the researcher to include all
information given by building and district leaders. Once a pattern emerged from the
answers given by school leaders, the answers were grouped into common topics
discussed and captured as data.
The table below is a set of data collected from principals of schools chosen for
this study that emerged from the researcher contacting the principals. Table 2: Data that
Emerged as a Result of Principal Contact, represents commentary from the principals of
schools in the sample population. The applicable data are in Table 2.
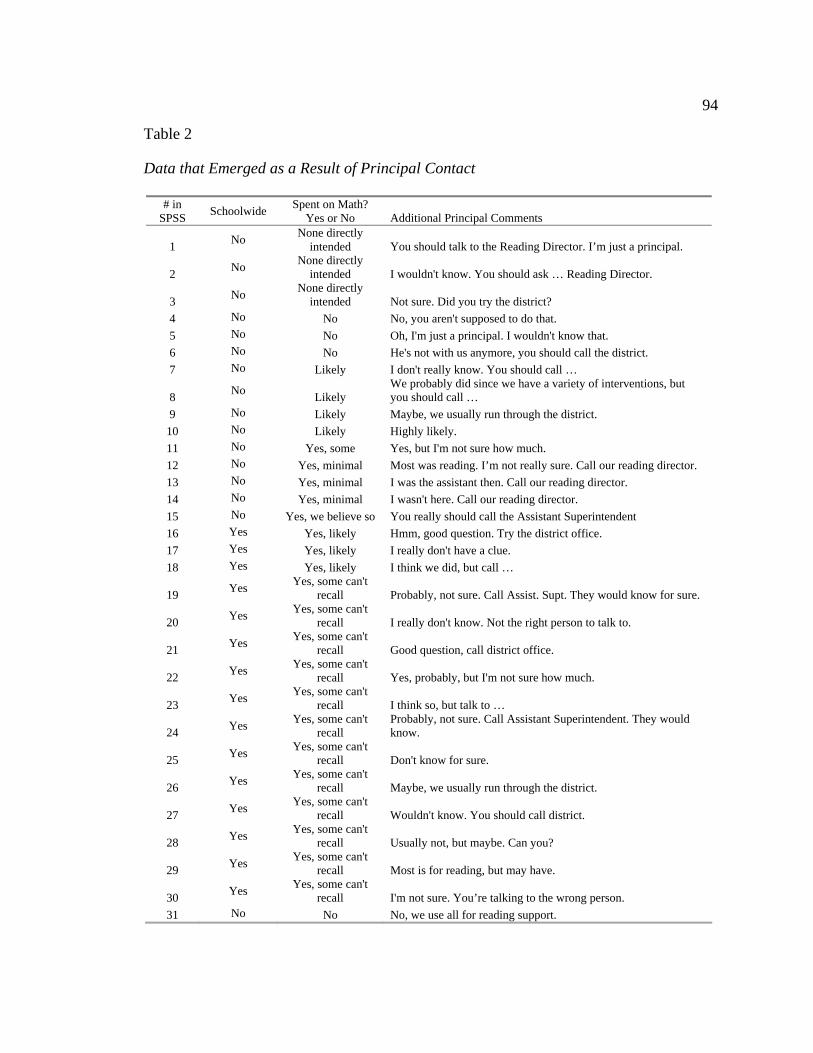
94
Table 2
Data that Emerged as a Result of Principal Contact
# in SPSS
Schoolwide Spent on Math?
Yes or No Additional Principal Comments
1 No
None directly intended You should talk to the Reading Director. I’m just a principal.
2 No
None directly intended I wouldn't know. You should ask … Reading Director.
3 No
None directly intended Not sure. Did you try the district?
4 No No No, you aren't supposed to do that.
5 No No Oh, I'm just a principal. I wouldn't know that.
6 No No He's not with us anymore, you should call the district.
7 No Likely I don't really know. You should call …
8 No
Likely We probably did since we have a variety of interventions, but you should call …
9 No Likely Maybe, we usually run through the district.
10 No Likely Highly likely.
11 No Yes, some Yes, but I'm not sure how much.
12 No Yes, minimal Most was reading. I’m not really sure. Call our reading director.
13 No Yes, minimal I was the assistant then. Call our reading director.
14 No Yes, minimal I wasn't here. Call our reading director.
15 No Yes, we believe so You really should call the Assistant Superintendent
16 Yes Yes, likely Hmm, good question. Try the district office.
17 Yes Yes, likely I really don't have a clue.
18 Yes Yes, likely I think we did, but call …
19 Yes
Yes, some can't recall Probably, not sure. Call Assist. Supt. They would know for sure.
20 Yes
Yes, some can't recall I really don't know. Not the right person to talk to.
21 Yes
Yes, some can't recall Good question, call district office.
22 Yes
Yes, some can't recall Yes, probably, but I'm not sure how much.
23 Yes
Yes, some can't recall I think so, but talk to …
24 Yes
Yes, some can't recall
Probably, not sure. Call Assistant Superintendent. They would know.
25 Yes
Yes, some can't recall Don't know for sure.
26 Yes
Yes, some can't recall Maybe, we usually run through the district.
27 Yes
Yes, some can't recall Wouldn't know. You should call district.
28 Yes
Yes, some can't recall Usually not, but maybe. Can you?
29 Yes
Yes, some can't recall Most is for reading, but may have.
30 Yes
Yes, some can't recall I'm not sure. You’re talking to the wrong person.
31 No No No, we use all for reading support.

95
Table 2 (continued)
# in SPSS
Schoolwide Spent on Math?
Yes or No Additional Principal Comments
32 No No, don't think so Not sure. Did you try the district?
33 No No, don't think so I don't know. Call … (district office).
34 No No, don't think so Probably not.
35 No No, don't think so You should probably talk to …
36 No No, don't think so Call the district.
The first column represents the number assigned by the researcher to the
identified school. This process was used by the researcher to protect the identity of
schools and principals involved in the study. The actual names are listed in Appendix D.
The assigned number was used to identify the school while analyzing the data in SPSS
Statistics v15.0.
The second column contains whether the school leader chose schoolwide or
targeted assistance for both 2006 and 2007. If the school leader chose schoolwide
assistance for both years it is indicated as Yes. If the school leader chose targeted
assistance for both years, it is indicated with No. Any school that did not choose either
schoolwide or targeted assistance for both 2006 and 2007 was not included in this study.
The third column represents the principals response to the questions of whether
any of the Title I funds were used for math programs. The intent of the researcher was to
classify each as a simple yes or no answer. After receiving these data, it was necessary to
elaborate since few responses received were simply yes or no answers.
The fourth column represents additional information supplied by the principals in
the sample population schools. Principal in the sample population offered additional
commentary that the researcher did not solicit nor ask principals to elaborate upon. Of the
96
answers received from school leaders, 12 were classified as a response that no Title I
funds were spent on math interventions. Four replied with a direct no response, five
replied with a no that they did not think so, and three replied that none was intended
directly for math interventions. All twelve of the schools classified as a no response
chose schoolwide assistance for Title I funding.
Of the answers received from school leaders, 24 were classified as a response that
yes some Title I funds were spent on math interventions. One replied with a yes some,
one replied with a yes we believe so, three replied with yes but minimal, three replied
with yes it is likely, twelve replied with a yes some was used but they could not recall
how much, and four replied with a likely. Every yes answer received was a qualified
answer, meaning that school leaders were not certain of the amount of impact or if there
was any impact of including Title I funds for mathematics on reading achievement
scores. Every school leader who responded that some Title I funds were used for math
programs noted that the majority of Title I funding used in their school was still intended
to enhance the reading ability of students. Schools that responded with yes answers
consisted of all 15 of the targeted assistance schools and nine of the 21 schoolwide
assistance schools.
Racial Composition of the Sample Population
Data was collected about the racial composition, White, Black, and Hispanic, of
the sample population. The table below represents the racial composition of schools
choosing schoolwide assistance through Title I. Table 3: Racial Composition of

97
Schoolwide Assistance Population, represents the average percentage of each racial
category in all of the sample schools that chose schoolwide assistance in 2006 and 2007.
Table 3
Racial Composition of Schoolwide Assistance Population
Race 2006 Average
Percentage Standard Deviation
2007 Average Percentage
Standard Deviation
White 8.64 6.61 7.85 6.09
Black 23.58 13.69 22.82 12.65
Hispanic 63.40 22.15 63.93 21.52
The first column contains the three major racial categories accounted for in this
study. The three categories are White, Black, and Hispanic.
The second column indicates the average percentage of all schoolwide assistance
schools in each of the racial categories in 2006. The average percentage of the students
who were White in schoolwide assistance schools was 8.64% in 2006. The average
percentage of the students who were Black in schoolwide assistance schools was 23.58%
in 2006. The average percentage of the students who were Hispanic in schoolwide
assistance schools was 63.40% in 2006.
The third column represents the standard deviation from the mean for all of the
schoolwide schools in the sample population in 2006. The standard deviation in 2006 for
the White population was 6.61, 13.69 for Black, and 22.15 for Hispanic.
The fourth column indicates the average percentage of all schoolwide assistance
schools in each of the racial categories in 2007. The average percentage of the students
who were White in schoolwide assistance schools was 7.85% in 2007. The average

98
percentage of the students who were Black in schoolwide assistance schools was 22.82%
in 2007. The average percentage of the students who were Hispanic in schoolwide
assistance schools was 63.93% in 2007.
The fifth column represents the standard deviation from the mean for all of the
schoolwide schools in the sample population in 2007. The standard deviation in 2007 for
the White population was 6.09, 12.65 for Black, and 21.52 for Hispanic.
The percentage of students in schoolwide assistance schools in each racial
category remained relatively consistent from 2006 to 2007. The percentage of White
students on average in the schoolwide assistance schools was 8.64%in 2006 and 7.85% in
2007, the percentage of Black students on average in the schoolwide assistance schools
was 23.58%in 2006 and 22.82% in 2007, and the percentage of Hispanic students on
average in the schoolwide assistance schools was 63.40%in 2006 and 63.93% in 2007.
The table below represents the characteristics of school choosing targeted
assistance through Title I. Table 4: Racial Composition of Targeted Assistance
Population represents the average percentage of each racial category in all of the sample
schools for targeted assistance schools in 2006 and 2007. The applicable data follows:
Table 4
Racial Composition of Targeted Assistance Population
Race 2006 Average
Percentage Standard Deviation
2007 Average Percentage
Standard Deviation
White 32.00 11.02 30.71 10.52
Black 10.65 13.51 10.59 13.12
Hispanic 48.17 19.29 49.18 18.36

99
The first column contains the three major racial categories accounted for in this
study. The three categories are White, Black, and Hispanic.
The second column indicates the average percentage of all targeted assistance
schools in each of the racial categories in 2006. The average percentage of the students
who were White in targeted assistance schools was 32.00% in 2006. The average
percentage of the students who were Black in targeted assistance schools was 10.65% in
2006. The average percentage of the students who were Hispanic in targeted assistance
schools was 48.17% in 2006.
The third column represents the standard deviation from the mean for all of the
targeted schools in the sample population in 2006. The standard deviation in 2006 for the
White population was 11.02, 13.51 for Black, and 19.29 for Hispanic.
The fourth column indicates the average percentage of all targeted assistance
schools in each of the racial categories in 2007. The average percentage of the students
who were White in targeted assistance schools was 30.71% in 2007. The average
percentage of the students who were Black in targeted assistance schools was 10.59% in
2007. The average percentage of the students who were Hispanic in targeted assistance
schools was 49.18% in 2007.
The fifth column represents the standard deviation from the mean for all of the
targeted schools in the sample population in 2007. The standard deviation in 2007 for the
White population was 10.52, 13.12 for Black, and 18.36 for Hispanic.
The percentage students in targeted assistance schools in each racial category
remained relatively consistent from 2006 to 2007. The percentage of White students on

100
average in the targeted assistance schools was 32.00% in 2006 and 30.71% in 2007, the
percentage of Black students on average in the targeted assistance schools was 10.65% in
2006 and 10.59% in 2007, and the percentage of Hispanic students on average in the
targeted assistance schools was 48.17%in 2006 and 49.18% in 2007.
Between 2006 and 2007 there were only minor differences in racial groups for
schools in the sample population. However, among the Title I funding options of
schoolwide assistance and targeted assistance there were substantial differences in racial
composition. In 2006 the average percentage of Black students in schoolwide assistance
schools was 23.58% which was higher than the targeted assistance average of 10.65% in
2006. The average percentage of Hispanic students in schoolwide assistance schools of
63.40% was higher than the 48.17% average in targeted assistance schools. Again, the
same trend is observed in 2007 with the average percentage of Black students in
schoolwide assistance schools at 22.82% which was higher than the targeted assistance
average of 10.59% in 2006. The average percentage of Hispanic students in schoolwide
assistance schools of 63.93% was higher than the 49.18% average in targeted assistance
schools. The proportions are reversed for White students with an average percentage of
8.64% in schoolwide assistance schools in 2006 while targeted assistance schools
contained an average of 32.00%. The same trend is observed in 2007 with 7.85% on
average in schoolwide assistance schools and 30.71% on average in targeted assistance
schools.
Data were collected on the racial composition of schools and presented for
schoolwide and targeted assistance for the sample population. Figure 1: Racial

101
Composition of Schoolwide and Targeted Assistance Population, are comparative figures
representing the percentage of the overall population in selected schools that fall into
each racial category.
Figure 1. Racial Composition of Schoolwide and Targeted Assistance Population
The left half of the figure represents the analysis of data for schoolwide assistance
and the right side represents targeted assistance schools. The racial category for each year
of the study, 2006 and 2007, is represented along the Y axis and the mean percent is
along the X axis. Each racial category is grouped together to allow comparison from
2006 to 2007 and by type of assistance to compare from race to race.
The first two bars on the left side of the graph represent the average percentage of
White students in schoolwide assistance schools in the sample population is 8.64% in
102
2006 and 7.85% in 2007. The second two bars under schoolwide assistance represent the
average percentage of Hispanic students in the sample population is 63.40% in 2006 and
63.93% in 2007 and the third two bars represent the average percentage of Black students
in the sample population is 23.58% in 2006 and 22.82% in 2007.
The first two bars on the right side of the graph represent the average percentage
of White students in targeted assistance school in the sample population is 32.00% in
2006 and 30.71% in 2007. The second two bars under targeted assistance represent the
average percentage of Hispanic students in the sample population is 48.17% in 2006 and
49.18% in 2007 and the third two bars represent the average percentage of Black students
in the sample population is 10.65% in 2006 and 10.59% in 2007.
Figure 1 represent that schools selecting either schoolwide assistance or targeted
assistance had consistent levels of racial composition in each category from 2006 to
2007. The population did not change much in terms of racial composition from year to
year. This consistency helped generated a useful sample population for the purposes of
this study. The population had very little shift in all racial groups between both
schoolwide and targeted assistance schools. The overall trend was for more White
students in schools that selected targeted assistance and more Hispanic and Black
students in schools that selected schoolwide assistance in both 2006 and 2007.
Low Income Characteristics of the Sample Population
The next table represents the low income characteristics of the sample population.
Table 5: Low Income Characteristics of Sample Population, represents the average
percentage of low income of the overall population of schoolwide assistance schools and

103
targeted assistance schools in the sample population in 2006 and 2007. The applicable
data follows:
Table 5
Low Income Characteristics of Sample Population
Title I Assistance Selected
2006 Average Percentage
Standard Deviation
2007 Average Percentage
Standard Deviation
Schoolwide 70.00 11.24 65.73 12.08
Targeted 51.93 8.79 53.03 9.34
The first column represents the type of Title I assistance chosen by the school
leader. Schools chose either schoolwide or targeted assistance.
The second column represents the percentage of the overall population that was
classified as low income on average in all schools in the sample population in 2006. The
percentage of low income students on average in schoolwide schools was 70.00% in
2006. The average percentage of low income students in targeted schools was 51.93% in
2006.
The third column represents the standard deviation from the mean for all schools
in the sample population in 2006. The standard deviation for schoolwide assistance
schools was 11.24. The standard deviation for targeted assistance schools was 8.79.
The fourth column represents the percentage of the overall population that was
classified as low income on average in all schools in the sample population in 2007. The
percentage of low income students on average in schoolwide schools was 65.73% in

104
2007. The average percentage of low income students in targeted schools was 53.03% in
2007.
The fifth column represents the standard deviation from the mean for all schools
in the sample population in 2007. The standard deviation for schoolwide assistance
schools was 12.08. The standard deviation for targeted assistance schools was 9.34.
Schoolwide assistance schools had higher percentages of students classified as
low income compared to the targeted assistance schools. The averages were consistent
across both years in 2006 and 2007.
Data were collected on the low income characteristics of both schoolwide and
targeted assistance school in 2006 and 2007. Figure 2: Low Income Characteristics of
Sample Population, represents a comparison between 2006 and 2007 of the average
percentage of low income in schoolwide and targeted assistance school in the sample
population.
The left half of the figure represents information collected from schools in the
sample population that chose schoolwide assistance and the right half of the figure
represents sample population schools choosing targeted assistance. The X or horizontal
axis represents the two years of the study, 2006 and 2007. The Y or vertical axis
represents the percentage of the overall population of students classified as low income in
the sample schools.

105
Figure 2. Low Income Characteristics of Sample Population
The first bar on the left side of the graph represents that the average percentage of
students in schools that selected schoolwide assistance was 70.00% low income in 2006.
The second bar represents the average for the same schools decreased slightly to 65.73%
of students classified as low income in 2007.
The first bar on the right side of the graph represents that the average percentage
of students in schools that selected targeted assistance was 51.93% low income in 2006.
The second bar on the right half of the graph represents the average for the same schools
increased slightly to 53.03% of students classified as low income in 2007.
Figure 2 represents that schoolwide assistance schools were consistently higher in
the average percentage of students classified as low income from the overall sample
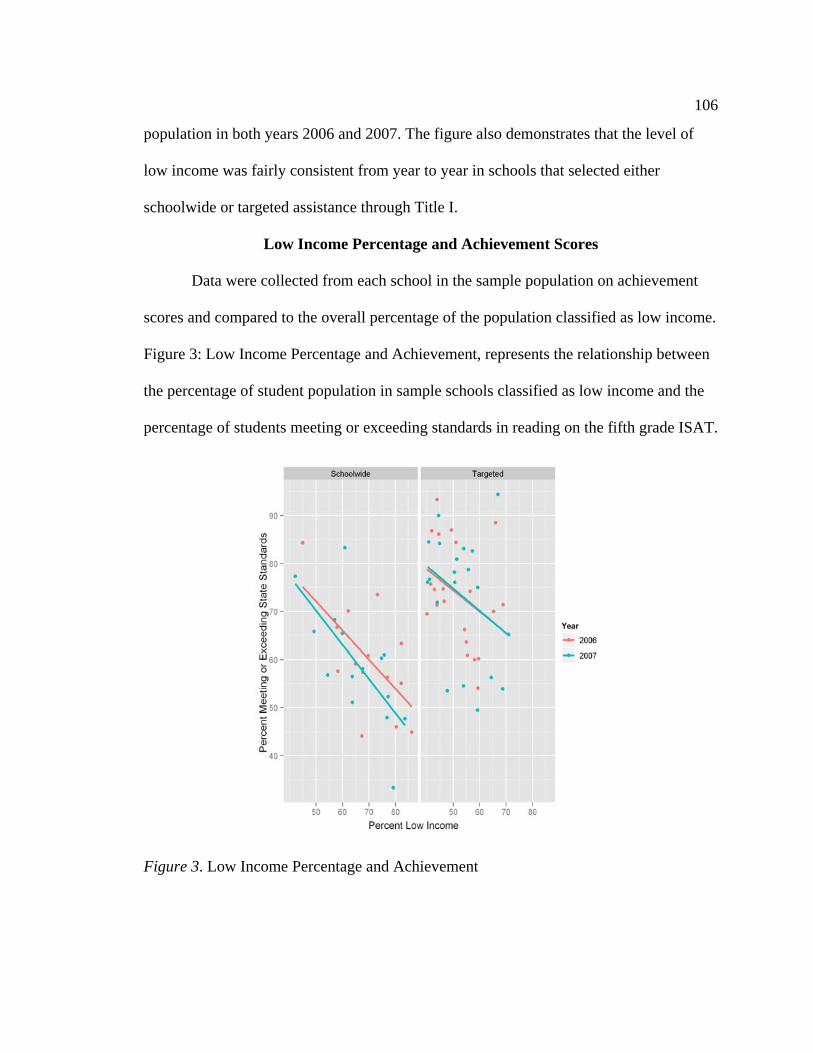
106
population in both years 2006 and 2007. The figure also demonstrates that the level of
low income was fairly consistent from year to year in schools that selected either
schoolwide or targeted assistance through Title I.
Low Income Percentage and Achievement Scores
Data were collected from each school in the sample population on achievement
scores and compared to the overall percentage of the population classified as low income.
Figure 3: Low Income Percentage and Achievement, represents the relationship between
the percentage of student population in sample schools classified as low income and the
percentage of students meeting or exceeding standards in reading on the fifth grade ISAT.
Figure 3. Low Income Percentage and Achievement

107
The left half of the figure represents information collected from schools in the
sample population that chose schoolwide assistance and the right half of the figure
represents sample population schools choosing targeted assistance. The X or horizontal
axis represents the percentage of students classified as low income from the overall
population in sample population schools. The Y or vertical axis represents the percentage
of students in sample population schools meeting or exceeding standards that were
established for the reading portion of the fifth grade ISAT.
Figure 3 displays each school from the sample population plotted as a dot with the
percentage of low income on the X axis and the percentage of students meeting or
exceeding on the Y axis. The left side of the figure represents the results for each school
from the sample population in red for 2006 and the corresponding results for the same
schools in blue for 2007. Targeted schools follow on the right side of the figure with the
results for each school from the sample population in red for 2006 and the corresponding
results for the same schools in blue for 2007.
The lines through each figure are regression lines representing the relationship
between the X axis and Y axis variables. The relationship between the variables of
percentage of low income and the percentage meeting or exceeding for each year are
represented by the regression lines. Each year is represented with a different color with
2006 in red and 2007 blue.
Regression lines for schools selecting schoolwide assistance are angled in both
years downward from left to right. This downward angle represents that the higher the
percentage of low income students in sample schools, the lower the percentage of the
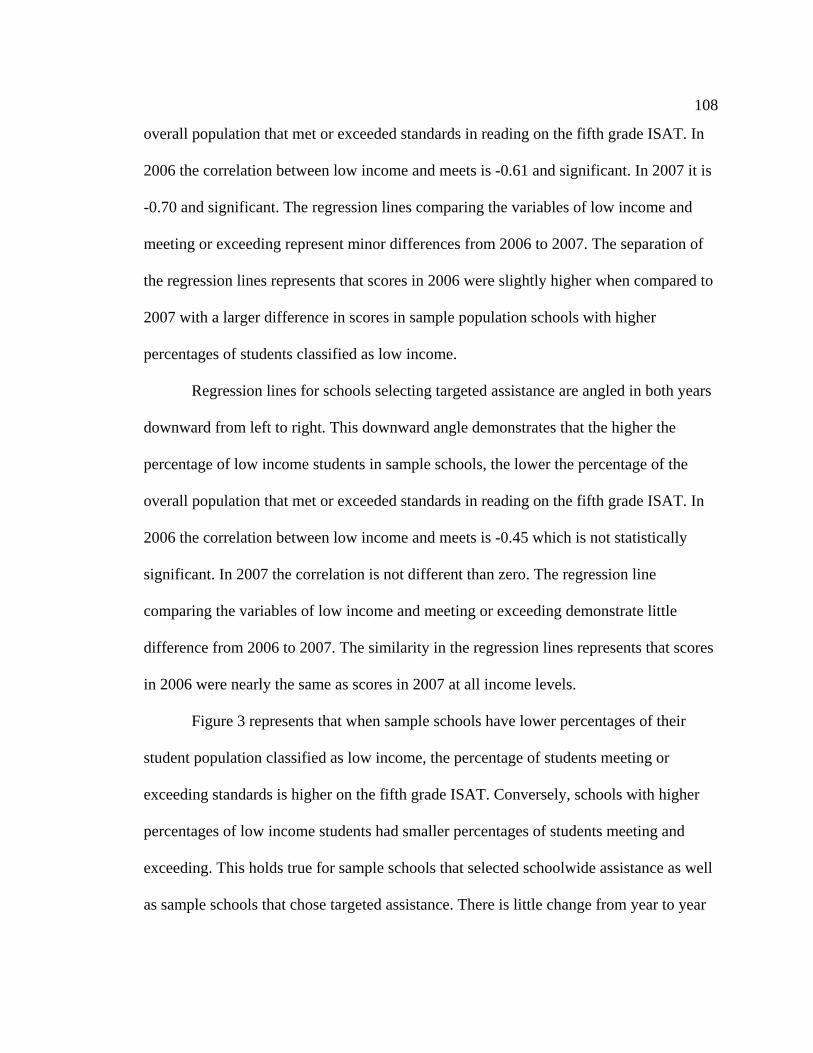
108
overall population that met or exceeded standards in reading on the fifth grade ISAT. In
2006 the correlation between low income and meets is -0.61 and significant. In 2007 it is
-0.70 and significant. The regression lines comparing the variables of low income and
meeting or exceeding represent minor differences from 2006 to 2007. The separation of
the regression lines represents that scores in 2006 were slightly higher when compared to
2007 with a larger difference in scores in sample population schools with higher
percentages of students classified as low income.
Regression lines for schools selecting targeted assistance are angled in both years
downward from left to right. This downward angle demonstrates that the higher the
percentage of low income students in sample schools, the lower the percentage of the
overall population that met or exceeded standards in reading on the fifth grade ISAT. In
2006 the correlation between low income and meets is -0.45 which is not statistically
significant. In 2007 the correlation is not different than zero. The regression line
comparing the variables of low income and meeting or exceeding demonstrate little
difference from 2006 to 2007. The similarity in the regression lines represents that scores
in 2006 were nearly the same as scores in 2007 at all income levels.
Figure 3 represents that when sample schools have lower percentages of their
student population classified as low income, the percentage of students meeting or
exceeding standards is higher on the fifth grade ISAT. Conversely, schools with higher
percentages of low income students had smaller percentages of students meeting and
exceeding. This holds true for sample schools that selected schoolwide assistance as well
as sample schools that chose targeted assistance. There is little change from year to year

109
in both schoolwide and targeted assistance schools with the patterns remaining consistent
from 2006 to 2007. This represents little change from year to year for either schoolwide
or targeted assistance.
White Population and Achievement Scores
Data were collected from each school in the sample population on achievement
scores and compared to the overall percentage of the population classified as White.
Figure 4: White Population Percentage and Achievement, represents the relationship
between the percentage of the student population classified as White in sample schools
and the percentage of students meeting or exceeding standards in reading on the fifth
grade ISAT.
Figure 4. White Population Percentage and Achievement

110
The left half of the figure represents information collected from schools in the
sample population that chose schoolwide assistance and the right half of the figure
represents sample population schools choosing targeted assistance. The X or horizontal
axis represents the percentage of students classified as White from the overall population
in sample population schools. The Y or vertical axis represents the percentage of students
in sample population schools meeting or exceeding standards that were established for
the reading portion of the fifth grade ISAT.
Figure 4 displays each school from the sample population plotted as a dot with the
percentage of White students in the sample population schools on the X axis and the
percentage of students meeting or exceeding on the Y axis. The left side of the figure
represents the results for each school from the sample population in red for 2006 and the
corresponding results for the same schools in blue for 2007. Targeted schools follow on
the right side of the figure with the results for each school from the sample population in
red for 2006 and the corresponding results for the same schools in blue for 2007.
The lines through each figure are regression lines representing the relationship
between the X axis and Y axis variables. The relationship between the variables of
percentage of low income and the percentage meeting or exceeding for each year are
represented by the regression lines. Each year is represented with a different color with
2006 in red and 2007 blue.
Regression lines for schools selecting schoolwide assistance are angled upward
from left to right in 2006 and downward from left to right in 2007. The upward angle of
the 2006 regression line represents that the higher the percentage of White students in

111
sample schools, the higher the percentage of the overall population that met or exceeded
standards in reading on the fifth grade ISAT. The correlation is 0.81 and significant. The
downward angle of the regression line for 2007 in schoolwide assistance represents fewer
students meeting or exceeding standards as the percentage of the overall White
population increased in the sample schools. The correlation is not different than zero. The
regression lines comparing the variables of low income and meeting or exceeding
represent differences from 2006 to 2007. The separation of the regression lines represents
that scores in 2006 were much higher for White students when compared to scores in
2007. This difference represents that achievement levels tended to decrease for White
students in schools selecting schoolwide assistance from 2006 to 2007.
Regression lines for schools selecting targeted assistance are angled in both years
upward from left to right. This upward angle demonstrates that the higher the percentage
of White students in sample schools, the higher the percentage of the overall population
that met or exceeded standards in reading on the fifth grade ISAT. The correlation
between low income and meets is 0.52 in 2006 and significant. In 2007 the correlation is
0.57 and significant. The regression line comparing the variables of low income and
meeting or exceeding demonstrate little difference from 2006 to 2007. The similarity in
the regression lines represents that scores in 2006 were nearly the same as scores in 2007
for White populations in targeted assistance schools.
Figure 4 represents that schoolwide assistance may have a negative impact on
achievement for White students and that targeted assistance may have no significant
impact on the achievement of White students in the sample population.

112
Black Population and Achievement Scores
Data were collected from each school in the sample population on achievement
scores and compared to the overall percentage of the population classified as Black.
Figure 5: Black Population Percentage and Achievement, represents the relationship
between the percentage of the student population classified as Black in sample schools
and the percentage of students meeting or exceeding standards in reading on the fifth
grade ISAT.
Figure 5. Black Population Percentage and Achievement
The left half of the figure represents information collected from schools in the
sample population that chose schoolwide assistance and the right half of the figure
represents sample population schools choosing targeted assistance. The X or horizontal

113
axis represents the percentage of students classified as Black from the overall population
in sample population schools. The Y or vertical axis represents the percentage of students
in sample population schools meeting or exceeding standards that were established for
the reading portion of the fifth grade ISAT.
Figure 5 displays each school from the sample population plotted as a dot with the
percentage of Black students in the sample population schools on the X axis and the
percentage of students meeting or exceeding on the Y axis. The left side of the figure
represents the results for each school from the sample population in red for 2006 and the
corresponding results for the same schools in blue for 2007. Targeted schools follow on
the right side of the figure with the results for each school from the sample population in
red for 2006 and the corresponding results for the same schools in blue for 2007.
The lines through each figure are regression lines representing the relationship
between the X axis and Y axis variables. The relationship between the variables of
percentage of low income and the percentage meeting or exceeding for each year are
represented by the regression lines. Each year is represented with a different color with
2006 in red and 2007 blue.
Regression lines for schools selecting schoolwide assistance are angled upward
from left to right in 2006 and downward from left to right in 2007. The upward angle of
the 2006 regression line represents that the higher the percentage of Black students in
sample schools, the higher the percentage of the overall population that met or exceeded
standards in reading on the fifth grade ISAT. The downward angle of the regression line
for 2007 in schoolwide assistance represents fewer students meeting or exceeding

114
standards as the percentage of the overall Black population increased in the sample
schools. The regression lines comparing the variables of low income and meeting or
exceeding were zero in both 2006 and 2007 indicating no relationship. The separation of
the regression lines represents that scores in 2006 were higher for Black students when
compared to scores in 2007. This difference represents that achievement levels tended to
decrease for Black students in schools selecting schoolwide assistance from 2006 to
2007. The difference was not significant in this study.
Regression lines for schools selecting targeted assistance are angled in both years
downward from left to right. This downward angle demonstrates that the higher the
percentage of Black students in sample schools, the higher the percentage of the overall
population that met or exceeded standards in reading on the fifth grade ISAT. The
correlation between low income and meets is not different from zero in either 2006 or
2007. The regression line comparing the variables of low income and meeting or
exceeding demonstrate little difference from 2006 to 2007. The similarity in the
regression lines represents that scores in 2006 were nearly the same as scores in 2007
with a small increase for Black populations in targeted assistance schools.
Figure 5 represents that schoolwide assistance may have a negative impact on
achievement for Black students and that targeted assistance may have no significant
impact on the achievement of Black students in the sample population.

115
Hispanic Population and Achievement Scores
Data were collected from each school in the sample population on achievement
scores and compared to the overall percentage of the population classified as Hispanic.
Figure 6: Hispanic Population Percentage and Achievement, represents the relationship
between the percentage of the student population classified as Hispanic in sample schools
and the percentage of students meeting or exceeding standards in reading on the fifth
grade ISAT.
Figure 6. Hispanic Population Percentage and Achievement
The left half of the figure represents information collected from schools in the
sample population that chose schoolwide assistance and the right half of the figure
represents sample population schools choosing targeted assistance. The X or horizontal

116
axis represents the percentage of students classified as Hispanic from the overall
population in sample population schools. The Y or vertical axis represents the percentage
of students in sample population schools meeting or exceeding standards that were
established for the reading portion of the fifth grade ISAT.
Figure 6 displays each school from the sample population plotted as a dot with the
percentage of Hispanic students in the sample population schools on the X axis and the
percentage of students meeting or exceeding on the Y axis. The left side of the figure
represents the results for each school from the sample population in red for 2006 and the
corresponding results for the same schools in blue for 2007. Targeted schools follow on
the right side of the figure with the results for each school from the sample population in
red for 2006 and the corresponding results for the same schools in blue for 2007.
The lines through each figure are regression lines representing the relationship
between the X axis and Y axis variables. The relationship between the variables of
percentage of low income and the percentage meeting or exceeding for each year are
represented by the regression lines. Each year is represented with a different color with
2006 in red and 2007 blue.
Regression lines for schools selecting schoolwide assistance are angled downward
from left to right in 2006 and upward from left to right in 2007. The downward angle of
the 2006 regression line represents that the higher the percentage of Hispanic students in
sample schools, the lower the percentage of the overall population that met or exceeded
standards in reading on the fifth grade ISAT. The correlation between low income and
meets is not different from zero and is not significant. The upward angle of the regression

117
line for 2007 in schoolwide assistance represents more students meeting or exceeding
standards as the percentage of the overall Hispanic population increased in the sample
schools. The correlation between low income and meets is not different from zero and is
not significant. The regression lines comparing the variables of low income and meeting
or exceeding represent differences from 2006 to 2007. The separation of the regression
lines represents that scores in 2006 were lower for Hispanic students when compared to
scores in 2007. This difference represents that achievement levels tended to increase for
Hispanic students in schools selecting schoolwide assistance from 2006 to 2007.
Regression lines for schools selecting targeted assistance are angled in both years
downward from left to right. This downward angle demonstrates that the higher the
percentage of Hispanic students in sample schools, the higher the percentage of the
overall population that met or exceeded standards in reading on the fifth grade ISAT. The
correlation between low income and meets is not different than zero in either 2006 or
2007. The regression line comparing the variables of low income and meeting or
exceeding demonstrate a no difference from 2006 to 2007. The similarity in the
regression lines represents that scores in 2006 were nearly the same as scores in 2007
with a small decrease for Hispanic populations in targeted assistance schools.
Figure 7 represents that schoolwide assistance may have a positive impact on
achievement for Hispanic students and that targeted assistance may have no significant
impact on the achievement of Hispanic students in the sample population.

118
Schoolwide and Targeted Assistance and Achievement Scores
The table below represents the achievement score average for schoolwide and
targeted assistance schools. Table 6: Schoolwide and Targeted Assistance and
Achievement Scores, represents the average percentage of students meeting or exceeding
standards in reading on the ISAT in 2006 and 2007 for schools in the sample population
that selected schoolwide and targeted assistance funding through Title I. The applicable
data follows:
Table 6
Schoolwide and Targeted Assistance and Achievement Scores
Title I Assistance Selected
2006 Average Percentage
Standard Deviation
2007 Average Percentage
Standard Deviation
Schoolwide 60.01 10.89 59.01 12.35
Targeted 73.55 10.83 73.39 12.39
The first column represents the type of Title I assistance chosen by the school
leader. Schools chose either schoolwide or targeted assistance.
The second column represents the percentage of the overall population that met or
exceeded reading standards on the ISAT on average in all schools in the sample
population in 2006. The percentage of students on average meeting or exceeding
standards in schoolwide schools was 60.01% in 2006. The percentage of students on
average meeting or exceeding standards in targeted schools was 73.55% in 2006.

119
The third column represents the standard deviation from the mean for all schools
in the sample population in 2006. The standard deviation for schoolwide assistance
schools was 10.89. The standard deviation for targeted assistance schools was 10.83.
The fourth column represents the percentage of the overall population that met or
exceeded reading standards on the ISAT on average in all schools in the sample
population in 2007. The percentage of students on average meeting or exceeding
standards in schoolwide schools was 59.01% in 2007. The percentage of students on
average meeting or exceeding standards in targeted schools was 73.39% in 2007.
The fifth column represents the standard deviation from the mean for all schools
in the sample population in 2007. The standard deviation for schoolwide assistance
schools was 12.35. The standard deviation for targeted assistance schools was 12.39.
Targeted assistance schools had higher percentages of students on average
meeting or exceeding standards compared to the schoolwide assistance schools. The
averages were consistent across both years in 2006 and 2007. There was, however, very
little change from year to year in either method of Title I funding selected. Neither
schoolwide assistance nor targeted assistance scores actually rose, on average, from the
previous year.
Data were collected on the achievement levels of both schoolwide and targeted
assistance schools in 2006 and 2007. Figure 7: Schoolwide and Targeted Assistance and
Achievement Scores, represents a comparison between 2006 and 2007 of the average
percentage of students meeting or exceeding reading standards on ISAT in schoolwide
and targeted assistance schools in the sample population.
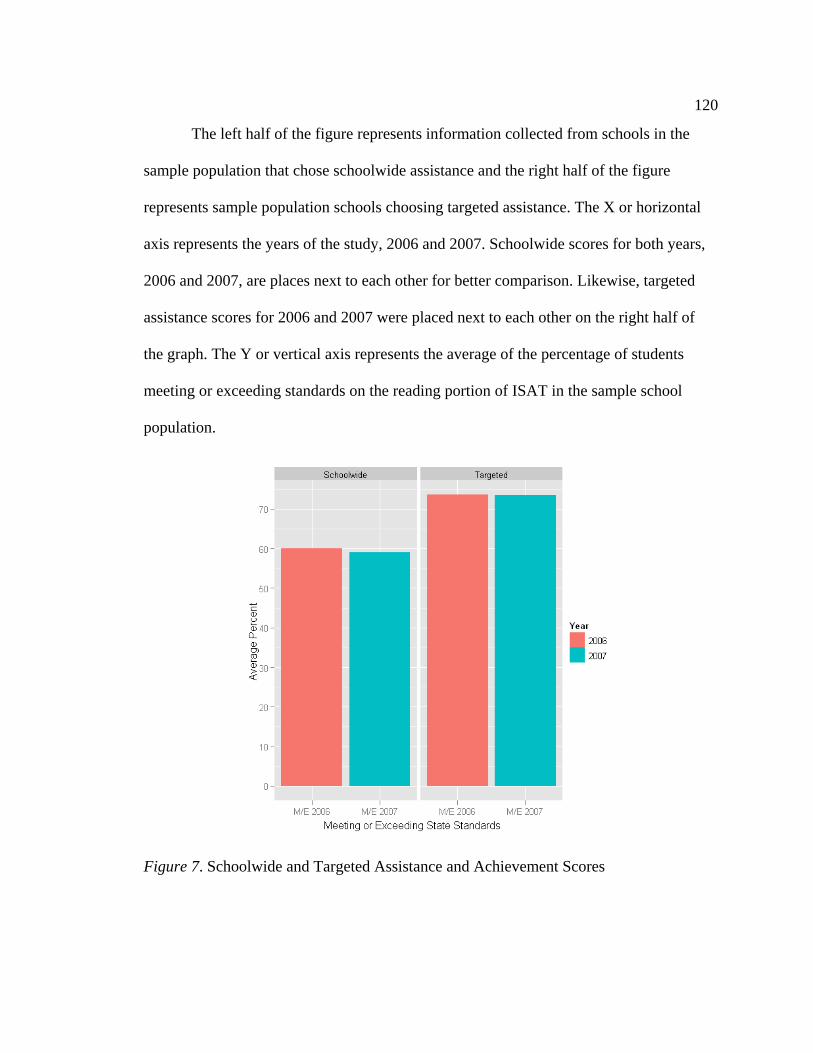
120
The left half of the figure represents information collected from schools in the
sample population that chose schoolwide assistance and the right half of the figure
represents sample population schools choosing targeted assistance. The X or horizontal
axis represents the years of the study, 2006 and 2007. Schoolwide scores for both years,
2006 and 2007, are places next to each other for better comparison. Likewise, targeted
assistance scores for 2006 and 2007 were placed next to each other on the right half of
the graph. The Y or vertical axis represents the average of the percentage of students
meeting or exceeding standards on the reading portion of ISAT in the sample school
population.
Figure 7. Schoolwide and Targeted Assistance and Achievement Scores

121
The first bar on the left side of the graph represents that the average percentage of
students in schools that met or exceeded was 60.01% for schoolwide assistance schools in
the sample population in 2006. The second bar on the left side of the graph represents the
average for the same schools decreased slightly to 59.01% of students meeting or
exceeding on average in 2007.
The first bar on the right side of the graph represents that the average percentage
of students in schools that met or exceeded was 73.55% for targeted assistance schools in
the sample population in 2006. The second bar on the right side of the graph represents
the average for the same schools decreased slightly to 73.39% of students meeting or
exceeding on average in 2007.
Figure 7 represents that targeted assistance schools were consistently higher in the
average percentage students meeting and exceeding reading standards on ISAT in both
years 2006 and 2007. The figure also demonstrates that the percentage of students
meeting and exceeding reading standards for both schoolwide and targeted assistance was
fairly consistent from year to year on average with neither demonstrating an appreciable
gain, but rather demonstrating minor decreases from the study years of 2006 to 2007.
Conclusion
This study addressed the following question:
When Illinois school leaders of buildings with over 40% of their school
population identified as low income choose between Title I schoolwide assistance or
targeted assistance programs, which method of distributing Title I funds is associated
with higher reading achievement scores in fifth grade as measured by ISAT?

122
In conclusion this chapter provided the results of the data analysis. This included
an overview of the sample population and the characteristics of schools, data that
emerged as a result of contacting principals, the relationship between low income level
and achievement scores, the relationship between race and achievement scores using
aggregate school-level data, and the association of schoolwide and targeted assistance
with achievement scores. Schoolwide and targeted assistance were also compared
descriptively in terms of racial composition, socioeconomic status, and enrollment.
Schools in the sample population did not change much in terms of any racial
group from 2006 to 2007 in either schoolwide or targeted assistance schools. The overall
trend was for schools with higher percentages of White students to select targeted
assistance and schools with higher percentages of Hispanic and Black students to select
schoolwide assistance in both 2006 and 2007. The percentage of students classified as
low income was consistently higher in schoolwide assistance schools than in targeted
assistance schools in both 2006 and 2007 with that percentage consistent and unchanging
from year to year.
Schools in the sample population with higher percentages of low income students
had lower percentages of students meeting and exceeding standards in reading on the
fifth grade ISAT. Schoolwide assistance achievement scores decreased from 2006 to
2007 for White and Black students while increasing significantly for Hispanic students.
Targeted assistance school achievement scores did not change for White students,
increased slightly for Black students, and decreased for Hispanic students from 2006 to
2007 in the sample population. Both schoolwide and targeted assistance scores for the
123
overall sample population decreased slightly from 2006 to 2007 in reading on the fifth
grade ISAT.

124
CHAPTER V
FINDINGS, CONCLUSIONS AND RECOMMENDATIONS
This chapter summarizes the findings including conclusions and
recommendations for further study and action. The chapter begins with a statement of the
research question, includes a summary of the findings, makes recommendations for
school leaders, and includes suggestions for further research.
Research Question
This study addressed the following question:
When Illinois school leaders of buildings with over 40% of their school
population identified as low income choose between Title I schoolwide assistance or
targeted assistance programs, which method of distributing Title I funds is associated
with higher reading achievement scores in fifth grade as measured by ISAT?
There was no significant difference between schools in the sample population that
chose schoolwide assistance programs and schools that chose targeted assistance
programs when measured by the fifth grade reading scores on ISAT in this study.
Sample Population Overview and Characteristics
Care was taken to account for the size of schools by selecting schools identified
from IIRC or Illinois Interactive Report Card data in the 200-1,000 student population
range and for low income level by selecting schools in the 40-90% range. Schools in this
range of low income had the option of selecting either schoolwide or targeted assistance

125
and chose either for both 2006 and 2007. All schools in the sample population were
located in Lake or northern Cook counties in suburban Chicago, Illinois to reduce
variability from demographic location. The study accounts for variables of race by
including the covariates of number of White, Black, and Hispanic students.
Table 1 represents an overview of the characteristics of schools in the sample
population of this study in 2006 and 2007. In examining these data, one could find that
fifteen of the selected schools from the sample population are in Cook County and
twenty-one schools are located in Lake County. Fifteen school leaders selected
schoolwide assistance and twenty-one selected targeted assistance. All 15 of the schools
that selected schoolwide assistance were located in Lake County. Of the 21 schools
selecting targeted assistance, 15 were in Cook County and 6 were in Lake County. The
percentage of low income students in all schools in the sample population ranged from 40
to 86 percent of the overall school population. The overall population in all sample
population schools ranged from 273 to 845 students. The overall percentage of the
student population identified as White in all schools in the sample population ranged
from 0 to 52%, Black from 0.3 to 50%, and Hispanic from 12 to 90%.
The researcher attempted to match schools closely through the location in the
county, grade level served, low income percentages, size of student population, and racial
composition of the school. Even through this process of matching, there is variance
between schools in the sample population that had to be accounted for in the study. As a
result of the variance in the population in schools in this study, one could argue that
school leaders should be careful in comparing results from school to school. School
126
leaders should match schools as closely with any characteristics that are unique to their
own school as possible when considering potential successful interventions or learning
opportunities that might transfer to the leader’s own school.
Racial Composition of the Sample Population
No Child Left Behind requires that all students regardless of race, ethnicity,
income level, special education status, or language proficiency, achieve established state
achievement targets for learning by 2014 (Hoff, 2008; NCLB, 2002).
Table 3 represents an overview of the racial composition of schoolwide assistance
schools in the sample population in 2006 and 2007. In examining these data, one could
find that the percentage of students in schoolwide assistance schools in each racial
category remained relatively consistent from 2006 to 2007. The percentage of White
students on average in the schoolwide assistance schools was relatively small at 8.64% in
2006 and 7.85% in 2007, the percentage of Black students on average in the schoolwide
assistance schools was 23.58% in 2006 and 22.82% in 2007, and the percentage of
Hispanic students on average in the schoolwide assistance schools was very high at
63.40% in 2006 and 63.93% in 2007.
The result of these data represents that the predominant racial category in
schoolwide assistance school in the sample population was Hispanic. When adding the
Hispanic and Black percentages, the vast majority of the racial composition is accounted
for in schoolwide schools with approximately 87% of the overall population. The larger
percentage of population in Black and Hispanic races renders the results more valid for
minority populations selecting schoolwide assistance.

127
Table 4 represents an overview of the racial composition of targeted assistance
schools in the sample population in 2006 and 2007. In examining these data, one could
find that the percentage of students in targeted assistance schools in each racial category
remained relatively consistent from 2006 to 2007. The percentage of White students on
average in the targeted assistance schools was 32.00% in 2006 and 30.71% in 2007, the
percentage of Black students on average in the targeted assistance schools was 10.65% in
2006 and 10.59% in 2007, and the percentage of Hispanic students on average in the
targeted assistance schools was 48.17% in 2006 and 49.18% in 2007.
The result of these data represents that the predominant racial category in targeted
assistance school in the sample population was Hispanic. Targeted assistance racial
populations were more evenly divided between Hispanic and White races. School leaders
with predominately Black racial populations will have less applicable information
provided from targeted school data due to the low percentage of just under 11% on
average for 2006 and 2007.
Figure 1 is comparative figures representing the percentage of the overall
population in selected schools that fall into each racial category in 2006 and 2007. Figure
1 represents that schools selecting either schoolwide assistance or targeted assistance had
consistent levels of racial composition in each category from 2006 to 2007. The
population did not change much in terms of racial groups from year to year in 2006 and
2007. The population had very little shift in all racial groups between both schoolwide
and targeted assistance schools from year to year. The overall trend was for more White

128
students in schools that selected targeted assistance and more Hispanic and Black
students in schools that selected schoolwide assistance in both 2006 and 2007.
In examining these data, one could find that the consistency in percentages of
racial category from 2006 to 2007 helped generated a useful sample population for the
purposes of this study. The study compared school populations that on average were
close to the same from 2006 to 2007.
White Population and Achievement Scores
Figure 4 represents the relationship between the percentage of the overall student
population classified as White in sample schools and the percentage of students meeting
or exceeding standards in reading on the fifth grade ISAT. In examining these data, one
could find that in 2006 when sample schools selecting schoolwide assistance contained a
higher percentage of the overall population in the White category, achievement tended to
increase rapidly. Conversely, in 2007 as the White category rose as a percentage of the
overall population of schoolwide assistance schools, achievement scores decreased
slightly. This decline in achievement from 2006 to 2007 in Figure 4 represents that
schoolwide assistance may have had a negative impact on achievement for White
students in the sample population.
In examining the sample population regression lines for targeted assistance in the
White population, one would see a different trend. The higher the percentage of White
students in the school, the higher the achievement scores for schools in the sample
population. This is demonstrated by the upward trend in the regression line in Figure 4.
Between year differences were very small with the regression lines in 2006 and 2007 for

129
targeted assistance schools indicating a minor or no impact of targeted assistance on
achievement of White students in the sample population for this study.
Black Population and Achievement Scores
Figure 5 represents the relationship between the percentage of the overall student
population classified as Black in sample schools and the percentage of students meeting
or exceeding standards in reading on the fifth grade ISAT. In examining these data, one
could find that in 2006 when sample schools selecting schoolwide assistance contained a
higher percentage of the overall population in the Black category, achievement tended to
increase. Conversely, in 2007 as the Black category rose as a percentage of the overall
population of schoolwide assistance schools, achievement scores decreased. This decline
in achievement from 2006 to 2007 in Figure 4 represents that schoolwide assistance may
have had a negative impact on achievement for Black students in the sample population.
In examining the sample population regression lines for targeted assistance in the
Black population, one would see a very different trend. As the percentage of students in
the Black category increased, achievement scores decreased. Figure 5 demonstrates an
increase in the trend between scores in 2006 and 2007 for targeted assistance schools in
the sample population indicating either no impact or a minor positive impact of targeted
assistance on achievement of Black students in the sample population from 2006 to 2007.
Hispanic Population and Achievement Scores
Figure 6 represents the relationship between the percentage of the overall student
population classified as Hispanic in sample schools and the percentage of students
meeting or exceeding standards in reading on the fifth grade ISAT. In examining these

130
data, one could find that in 2006 when sample schools selecting schoolwide assistance
contained a higher percentage of the overall population in the Hispanic category,
achievement tended to decrease rapidly. Conversely, in 2007 as the Hispanic category
rose as a percentage of the overall population of schoolwide assistance schools,
achievement scores increased. This increase in achievement from 2006 to 2007 in Figure
4 represents that schoolwide assistance may have had a positive impact on achievement
for Hispanic students in the sample population.
In examining the sample population regression lines for targeted assistance, one
would see a different trend. As the percentage of students in the Hispanic category
increased, achievement scores decreased slightly in 2006. Conversely, when the
percentage of students in the Hispanic category increased as a percentage of the overall
population for targeted assistance schools in 2007, achievement decreased at a more rapid
rate. This is demonstrated by the downward trend in the regression line in Figure 6.
Between year differences were small with the regression lines demonstrating a negative
difference between scores in 2006 and 2007. The regression line for 2007 has a steeper
decline than in 2006 for targeted assistance schools in the sample population indicating a
minor or negative impact of targeted assistance on the achievement of Hispanic students
in the sample population from 2006 to 2007.
Low Income Characteristics of the Sample Population
Table 3 represents the average percentage of low income of the overall population
of schoolwide assistance schools and targeted assistance schools in the sample population
in 2006 and 2007. In examining these data, one could find that schoolwide assistance
131
schools had higher percentages of students classified as low income compared to the
targeted assistance schools. The averages were consistent across both years in 2006 and
2007.
Figure 2 is comparative figures representing the percentage of the overall
population in selected schools that fall into the low income category in 2006 and 2007.
Figure 2 confirms that schoolwide assistance percentages of students classified as low
income were consistently higher than the percentage of students in targeted assistance
schools for the two years of this study. The average percentage of students meeting and
exceeding on the fifth grade reading portion of the ISAT in schoolwide assistance schools
was 70.00% in 2006 compared to 65.73% in 2007. These numbers are higher than for
targeted assistance school in 2006 with 51.93% and 2007 at 53.03%.
The result of these data represents a disparity between schoolwide assistance and
targeted assistance in the population served. Between year differences were small, but
between program differences were larger as one would expect. Schoolwide assistance is
meant to serve the overall population of the school by definition and targeted assistance is
to focus more on the students who qualify through Title I low income standards (TPG,
2007). It would make sense that schoolwide assistance schools tend to have higher
concentrations of low income students since the intent of schoolwide assistance is to aid
the entire population of the school. The belief is that in improving the entire school
program, it will benefit the disadvantaged students (Pogrow, 2005). The important
distinction between the two Title I programs is that schoolwide programs are
comprehensive reform designed to upgrade the entire educational program whereas

132
targeted assistance is designed to provide support only to the identified students (TPG,
2007).
The percentages of low income students in schoolwide programs vary little from
70% in 2006 to 66% in 2007. The percentage of low income students as a part of the
overall population varies even less in targeted assistance school from 52% in 2006 to
53% in 2007. The small variance in the percentage of low income students in each
schoolwide and targeted assistance make these data useful for the purposes of this study.
Low Income Percentage and Achievement Scores
Figure 3 represents the relationship between the percentage of student population
in sample schools classified as low income and the percentage of students meeting or
exceeding standards in reading on the fifth grade ISAT. In examining these data, one
could find that that when sample schools have lower percentages of their student
population classified as low income, the percentage of students meeting or exceeding
standards is higher on the fifth grade ISAT. Conversely, schools with higher percentages
of low income students had smaller percentages of students meeting and exceeding. This
holds true for sample schools that selected schoolwide assistance as well as sample
schools that chose targeted assistance. There is little change from 2006 to 2007 in either
schoolwide or targeted assistance schools with the pattern of downward achievement
correlated to decreasing income level. This trend remains consistent from 2006 to 2007
and changes little from year to year for either schoolwide or targeted assistance.
Continued and best use of Title I funds is an important issue for school leaders
because the achievement scores of low income students still lag behind the scores of their

133
more advantaged peers. Low income students in Illinois have scored lower on the Illinois
Scholastic Achievement Test, ISAT, every year: 34% to 15% below their more
advantaged peers in third grade since 2002, 34% to 19% lower in fifth grade, and 30% to
17% lower in eighth grade (NIU, 2008). By reviewing these data from the Illinois
Interactive Report Card in Appendix A, one will see that low income students in Illinois
are not performing to the same level as their more advantaged peers. School leaders are
under increasing pressure to bring all subgroup populations up to the target goals
established by the state and federal government since the inception of the No Child Left
Behind act making the proper use of federal Title I funds an increasingly more important
issue (Mintrop, 2008; Sack-Min, 2009).
The result of these data represents that with increases in the percentage of low
income students in a school, the lower the achievement levels of students and is
consistent with findings noted in Appendix A. The intent of Title I is to counteract the
effects of a lack of resources for students who are less advantaged. These data would
support the notion that lower income students are in need of assistance to equalize
opportunity. We know that disadvantaged students tend to make up a significant portion
of all students who fail and by concentrating efforts on the academically at-risk we
maintain the intent of Title I funding (Hess, 2005).
One could argue as the Coleman Report did that significant funding of schools
only has a modest impact on students at best. The Coleman Report notes that home and
peers have a greater influence over student achievement than schools (Greenwald et al.,
1996). Proponents have argued about the effectiveness of Title I assistance and the use of

134
federal funds (Hill, 2008; Podesta & Brown, 2008). Taken in isolation, these data from
Figure 3 tend to confirm the Coleman report findings. Figure 3 data demonstrate little
impact of Title I funding on higher levels of poverty because student achievement
continues to decline as student income level declines. According to Title I (2007), the
higher the percentage of students designated as low income, the higher the funding the
school receives. This increase in funding should translate into an increase in achievement
(Hill, 2008; Podesta & Brown, 2008). According to the sample drawn from this study, it
does not.
The researcher contends that although the impact may not be seen in the results of
this study, that generalizing to the rest of Illinois shows a stark contrast in the overall
achievement of low income students. Data from the IIRC, Illinois Interactive Report
Card, website is demonstrative regarding fifth grade achievement scores on ISAT.
Appendix A, IIRC data, demonstrate that fifth grade achievement scores for low income
students throughout Illinois have increased from 38% of students meeting or exceeding
standards to 58% from 2002 to 2008. This is a 20% increase in the overall achievement
scores on ISAT in fifth grade over the six year time frame. Students who were in the
category of “not low income” increased over the same time frame from 72% meeting and
exceeding in 2002 to 86% in 2008, a 14% increase. While all test scores in Illinois rose
from 2002 to 2008, with a slightly larger increase has occurred with low income students.
This demonstrates the gap between low income students and their more advantaged peers
closing over time in Illinois. This study showed little to no difference between test scores
from 2006 to 2007.
135
Schoolwide and Targeted Assistance and Achievement Scores
Table 4 represents the average percentage of students meeting or exceeding
standards in reading on the ISAT in 2006 and 2007 for schools in the sample population
that selected schoolwide and targeted assistance funding through Title I. In examining
these data, one could find that schoolwide assistance achievement scores for the sample
population changed very little or dropped slightly from 60.01 in 2006 to 59.01 in 2007.
This lack of change in scores would indicate that schoolwide assistance made very little
difference in the overall achievement of students from 2006 to 2007.
In examining the targeted assistance scores there was no significant movement
from 73.55 in 2006 to 73.39 in 2007. Targeted assistance schools had higher percentages
of students on average meeting or exceeding standards compared to the schoolwide
assistance schools. The averages were consistent across both years in 2006 and 2007.
There was, however, very little change from year to year in either method of Title I
funding selected. Neither schoolwide assistance nor targeted assistance scores actually
rose, on average, for schools in the sample population from 2006 to 2007. This contrasts
with the data in Appendix A from IIRC.
Figure 7 is comparative figures representing the average percentage of students
meeting or exceeding reading standards on ISAT in schoolwide and targeted assistance
schools in the sample population. Figure 2 confirms that schoolwide assistance
percentages of students meeting or exceeding standards on the reading portion of ISAT
were consistently lower than the percentage of students in targeted assistance schools in
2006 and 2007. It also confirms very little, if any, change from 2006 to 2007 for either
136
schoolwide or targeted assistance schools. This would seemingly indicate that neither
schoolwide nor targeted assistance had an impact on the overall reading achievement of
students in the sample population from 2006 to 2007.
The researcher had theorized that school leaders were making a conscious effort
in choosing schoolwide assistance. Under NCLB (2002), school leaders were given the
option of choosing either a schoolwide program or in targeting their assistance with the
funds provided by Title I depending on the level of poverty that exists in their building. If
the overall level of low income is at 40% or higher, school leaders may choose whichever
program they believe will most benefit their students (IES, 2007; NCLB, 2002; USDE
2002b). From the school year 1994-95 to the school year 2004-2005, the number of
school leaders choosing schoolwide assistance rose from 10% to 58% (USDE, 2007).
With such an increase in the choices school leaders made, one would naturally presume
that their choice would be to move toward the most effective program to enhance student
achievement. Findings of this study appear to be inconsistent with the choices that school
leaders are making.
A growing body of evidence shows that when implementing a schoolwide
program that it is possible to increase the achievement of all students, including the
economically disadvantaged, despite the overall demographics of the school (TPG,
2007). With the relaxation of restrictions on schoolwide programs, more and more
schools are choosing this type of Title I program with the use of federal funds to enhance
the learning of all of their students (USDE, 2007). This study intended to determine if
schoolwide Title I programs or targeted assistance programs resulted in higher increases

137
student achievement with Illinois fifth grade low income students. This study found no
significant impact of either schoolwide of targeted assistance on the overall achievement
of fifth grade students on the reading portion of ISAT.
Data that Emerged as a Result of Principal Contact
Table 4 represents data that were collected from principals when contacted for
verification in the use of Title I funding for reading purposes only. In examining these
data, one could find that almost every principal voluntarily replied with comments. It is
important to note that the researcher did not plan for this type of commentary in the study
and did not ask for elaboration. Every yes answer received from a school leader was a
qualified answer, meaning that school leaders were not certain of the amount of impact or
if there was any impact at all of including Title I funds for mathematics on reading
achievement scores.
These data emerged through the researcher contacting school leaders, specifically
the building principals for schools in the sample population. Principals, as the leaders of
their school, are required to track not only the type of assistance received but also how
the funds were allocated at their school. It is clear from the data collected in Table 4 that
principals did not comply with the legal mandates. NCLB (2002) requires school leaders
to document progress for low achieving students and to identify students who are having
difficulty with reading or who are as risk of failure in reading according to measures used
at the school level (NCLB, 2002). Leaders choosing schoolwide assistance must
demonstrate the overall achievement plan for their school while targeted assistance

138
schools must additionally show plans for how Title I identified students will reach state
achievement levels. Clearly, school leaders did not comply with these legal mandates.
Every school leader who responded that some Title I funds were used for math
programs noted that the majority of Title I funding was still intended to enhance the
reading ability of students even if some had been used for other purposes such as math.
School leaders believed a view shared by the researcher, that Title I funds spent on math
programs likely had an impact on reading scores as well. School leaders noted that when
any area of student learning is altered, there may be a resulting change in other areas of
student learning. Many cited that the students receiving the support Title I funds were
typically the same students regardless of which major subject area schools might chose to
allocate Title I funds. This is consistent with the concept of incidental inclusion.
Incidental inclusion is when students are not identified specifically as Title I
students in a targeted assistance school, yet still benefit indirectly from a service provided
by Title I funds (TPG, 2007). Students may receive services simply by being present
when an identified student is benefiting from the instruction, resources, or small group
activity. For the purpose of this study, these scores were not excluded from the final
results. Most school leaders believed that the researcher’s question was not entirely
relevant because students receiving Title I funding for reading were essentially the same
students receiving the funding for math. Efforts are not so neatly divided between subject
area and the impact from any interventions would alter the learning for the same group of
students regardless of which subject was the focus of the funding.
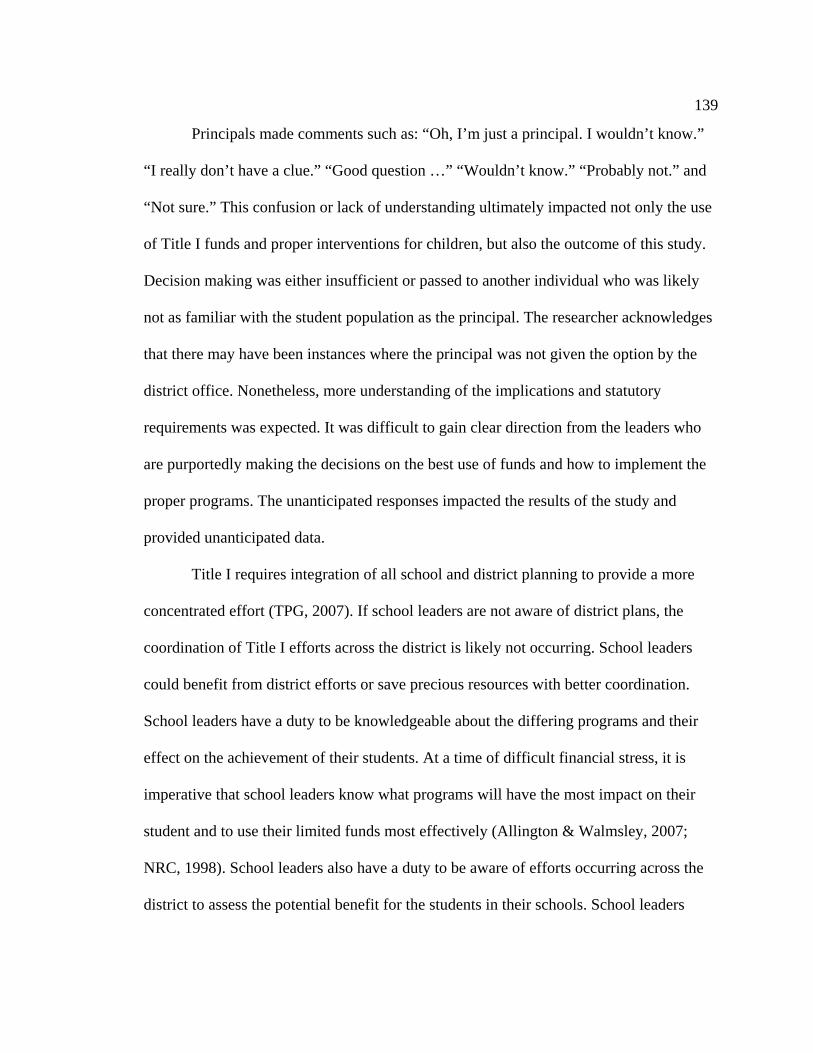
139
Principals made comments such as: “Oh, I’m just a principal. I wouldn’t know.”
“I really don’t have a clue.” “Good question …” “Wouldn’t know.” “Probably not.” and
“Not sure.” This confusion or lack of understanding ultimately impacted not only the use
of Title I funds and proper interventions for children, but also the outcome of this study.
Decision making was either insufficient or passed to another individual who was likely
not as familiar with the student population as the principal. The researcher acknowledges
that there may have been instances where the principal was not given the option by the
district office. Nonetheless, more understanding of the implications and statutory
requirements was expected. It was difficult to gain clear direction from the leaders who
are purportedly making the decisions on the best use of funds and how to implement the
proper programs. The unanticipated responses impacted the results of the study and
provided unanticipated data.
Title I requires integration of all school and district planning to provide a more
concentrated effort (TPG, 2007). If school leaders are not aware of district plans, the
coordination of Title I efforts across the district is likely not occurring. School leaders
could benefit from district efforts or save precious resources with better coordination.
School leaders have a duty to be knowledgeable about the differing programs and their
effect on the achievement of their students. At a time of difficult financial stress, it is
imperative that school leaders know what programs will have the most impact on their
student and to use their limited funds most effectively (Allington & Walmsley, 2007;
NRC, 1998). School leaders also have a duty to be aware of efforts occurring across the
district to assess the potential benefit for the students in their schools. School leaders

140
contacted in this study did not seem to know where funds were being spent, what they
were spent on, who the students were that benefited, and what the interventions were
across the district with Title I funds. This lack of knowledge inhibits a coordinated
district effort and clouds the likelihood that funds are being used to the maximum benefit
of the low income students they are intended to serve.
School leaders have a duty to be knowledgeable about the differing programs and
their effect on the achievement of their students. At a time of difficult financial stress, it
is imperative that school leaders know what programs will have the most impact on their
student and to use their limited funds most effectively (Allington & Walmsley, 2007;
NRC, 1998). The U.S. Department of Education asks that schools consider whether the
choice they make of schoolwide assistance is likely to improve the performance of the
lowest performing student or whether it is more likely to be effective at enhancing their
performance by targeting additional programs only to these students (TPG, 2007; NCLB,
2002). Understanding if schoolwide programs have a greater impact on the achievement
of fifth grade students than targeted assistance programs, will help school leaders make
difficult decisions about the use of their Title I funding in all elementary schooling years
to maximize the impact on improved reading. The data from this study demonstrated that
school leaders either did not know or did not comply with the legal mandates of Title I
and NCLB (2002).

141
Summary of Findings
From the data of the study, the researcher predicted that reading achievement
scores as measured on fifth grade ISAT for both schoolwide assistance programs and
targeted assistance programs in Illinois would have increased from 2006 to 2007. With
the number of schools across the nation choosing schoolwide assistance rising from 10%
to 58% from school year 1994-95 to school year 2004-2005 (USDE, 2007) the researcher
hypothesized that a larger increase in reading achievement would be measured on fifth
grade ISAT from schools implementing the Title I schoolwide assistance model. The
researcher theorized that school leaders, as a group, would choose a method of
distributing funds that resulted in higher achievement. This study did not find a
significant difference between the achievement for students in either schoolwide or
targeted assistance.
Interestingly, there did seem to be a difference in the scores of schoolwide and
targeted assistance when comparing the predominant racial category of students and
reading scores. More schools with a larger White population of students selected targeted
assistance while more schools with nonwhite populations selected schoolwide assistance.
Targeted assistance scores tended to be higher for White students and scores for nonwhite
students tended to be higher where schoolwide programs were selected.
Title I is the most significant infusion of federal funding into education (TPG,
2007). Given the significance of this investment, one would expect an equalized result or
at least a less pronounced decrease in achievement as the percentage of low income
students increases in a school. There seems to be movement across the state in closing the

142
gap for low income and non low income students as demonstrated in Appendix A. This
was not the case for the schools in the sample population. The intent of Title I was to
balance the impact for disadvantaged youth in America (Tosh, 2003; Zigler, 2009). This
seems to be the case in Illinois, yet not with the schools in the sample population.
Did school leaders intentionally select the program for their population that would
lead to higher test scores? As a researcher, when starting with the problem, it was
anticipated that school leaders were indeed making this conscious decision. The
researcher is now worried that they may not be or that the decision is being made by
other members of the district with little input from the school leader. It also was
determined by the researcher that the participating school leaders really did not pay
attention to or are not familiar with the statute requirements and how to implement them.
Many school leaders referred the researcher to another district employee because they did
not know how funds were being used. Many did not know how funds were being used
and were not tracking the progress of Title I students in any way differently than they did
for all other students despite the statute requirements of Title I.
School leaders are to track to the achievement of low income students to ensure
that they are making progress toward state standards (TPG, 2007). It would seem that
most school leaders are not aware of the progress their low income students are making.
In fact, one school leader even noted that the district would not allow the leader to know
who the low income students were for fear it was a violation of the Family Educational
Rights and Privacy Act. This type of commentary is disturbing in that it is clear that most
school leaders in this study were not aware of and did not follow the requirements of

143
Title I. This uncertainty was consistent with principals who reported to the U.S.
Department of Education (2003) that they were confused on how to properly and best use
Title I funds. The confusion certainly is present with principals in this study.
Recommendations
In viewing the demographic information of schools in this study, school leaders
need to take care when comparing results. Successful interventions with similar
populations that have been proven to work should be the focus of school leaders’ efforts.
School leaders should look closely when comparing results from schools other than their
own and to take into account that results may vary in one school to another due to the
variance in the student population. The results may have little to do with the Title I
funding method chosen. School leaders should consult with colleagues who have had
success with the achievement of students in Title I programs while keeping in mind that
the characteristics of the student population in each school will differ, potentially impact
resulting student achievement. The varying characteristics should not deter school leaders
from reviewing strategies in other schools, but rather cause school leaders to use caution
and to match the population of their own school with comparable schools particularly
with race and income levels.
The study did find that there may have been marginal increases in targeted
assistance programs and marginal decreases in schoolwide assistance programs for Black
students which may lead school leaders with predominately Black populations to
implement targeted assistance. There may have been marginal increases in scores for
schoolwide assistance and marginal decreases in scores for targeted assistance programs

144
for Hispanic students. This should encourage school leaders with predominately Hispanic
populations to consider implementing schoolwide assistance. There may have been
marginal increases in targeted assistance scores for White populations and a decrease in
scores for schoolwide. In some cases the number of students in the sample population is
relatively small and school leaders should use caution in making broad generalizations
about race. The results of this study should be expanded upon with further study in
randomized experiments.
Given the significance of the investment in Title I by our federal government,
there is a need for more professional development in the use of Title I funds for school
leaders. School leaders were unaware of the statute requirements of Title I and their
responsibilities under the law. There is a need for more purposeful collection of data on
Title I performance and the use of funding as school leaders attempt to reach goals
outlined under Title I. School leaders need to more closely monitor the relationship
between achievement outcomes and interventions and track data and performance
outcomes as required under Title I. School leaders need to make more purposeful
decisions with Title I funds to enhance the overall achievement of students. The
researcher would encourage school leaders to look closely at their own allocations for
Title I funds and the capability of your school and district to provide greater opportunities
for the disadvantaged based upon each local situation. Although generalizations can be
made from the results of this study, certainly local factors may guide a school leader to an
alternative decision. It is difficult to generalize without considering local school needs.

145
Further Research
The disparity between Title I options raises interesting questions that could be
asked of school leaders in the future. Why is it that all of the schools selected for this
study in Lake County chose schoolwide assistance and that 15 of the 21 schools in Cook
County chose targeted assistance? Was there a focus of training through the Lake County
Regional Office of Education, or lack thereof in Cook County, that encouraged schools to
pursue schoolwide funding? Were there other reasons that could be probed deeper by
future researchers? What questions might school leaders answer regarding the type of
assistance chosen in their schools in either county that would lead to clarity?
Because the study was limited to only two school years, a more long-term study
would yield more pertinent results. A nation-wide study with various assessment data
other than ISAT would yield a more predictable result and allow future researchers to
assess the impact of Title I funding over time. The use of nation-wide assessments such a
NAEP, the National Assessment of Educational Progress, would allow for a broader
comparison and not limit the study to Illinois. Title I is a federal funding program and
naturally, more research should be conducted at a national level. Variations in ISAT tests
and cut scores limited the years available in this study. The lack of consistency provided
by ISAT limited the available years and population for this study.
There were challenges present with a study that was quasi-experimental in nature.
In attempting to match the characteristics of the schools so closely, the researcher
decreased opportunities for randomization. While this process allowed for a feasible
opportunity to study schools and Title I funding in Lake and northern Cook counties, it
146
did decrease the likelihood that the condition of choosing schoolwide or targeted
assistance could be identified as the cause of the change in achievement. Further research
with randomization would be necessary to draw more valid assumptions.
There are so many factors that impact the learning of a child other than the type of
Title I funding. Programs and funding are intertwined and cannot act alone. Each affects
and impacts the other often with intentional and unintended consequences. Future
research is needed to support, extend, and refine the process for matching general
resources to specific contexts. A study on the effectiveness of individual reading
interventions and programs currently utilized in schools would be very helpful for school
leaders. What are some of the specific interventions in literacy that would improve the
learning opportunities for students? Studies that differentiate between type of funding and
various reading interventions across the country would be useful for school leaders.
Generalized studies are helpful in providing broad direction and guidance for school
leaders, yet more specific information on the type of reading interventions allowed
through Title I would offer even more guidance for school leaders.
With such confusion abounding in school leaders as to the statutory requirements
and the proper use of Title I funds, a deeper qualitative study would yield insight into the
thinking of principals. This researcher was somewhat limited in the scope and depth or
probing for answers from school leaders and all of the feedback from principals was
unsolicited. The researcher suggests that further study be conducted in a purposeful
manner to gauge the extent of confusion that seems to exist at both the national level and
within the schools in the sample population.

147
During the period of time since the researcher began this study much has changed.
With the changes in the Illinois state assessments and a potential national curriculum
through the common core state standards, the researcher proposes a study from the point
of implementation. Current proposals have the implementation occurring around 2014.
Stimulus money had a significant impact on three fiscal years of 2008 to 2011. Title I
funding amounts are skewed during this time with the influx of billions of dollars over a
short period of time. This would either suggest potential research options with funding
allocated only through these funds or a study of the changes and impact of funding over
this three year period of time.
148
APPENDIX A
ACHIEVEMENT GAP BETWEEN LOW INCOME AND NON-LOW INCOME
STUDENTS IN READING IN ILLINOIS IN THIRD, FIFTH, AND EIGHTH GRADES
FROM 2002-2008

149
Figure A1. ISAT Performance Comparison by Income from 2002 to 2008
Figure A2. Illinois Achievement Gap Between Low Income and Non Low Income

150
APPENDIX B
FREEDOM OF INFORMATION ACT REQUEST LETTER

151
Thursday, January 15, 2009 Freedom of Information Office Illinois State Board of Education 100 North First Street Springfield, IL 62777-0001 ATTN: FOIA Request To whom it may concern, Please consider this a request through the Freedom of Information Act. I was directed to you at the request of Dana F. Kinley, Principal Consultant for Grants & Programs. I am a doctoral student working on my dissertation at Loyola University Chicago. The study I am preparing is designed to determine for school leaders the value of participating in a schoolwide or a targeted assistance Title I program when individual schools have a choice. Information will only be used for the purpose of this research on my dissertation. The information I am requesting can be delineated as follows:
Schools receiving Title I funding in suburban Cook, DuPage, Lake, and Will counties.
I do not wish to have any information from the Chicago Public School system. The designation of each elementary school with 5th grade students, as to whether
they chose targeted assistance or schoolwide Title I assistance and the amount of funding each school received from the 2001-02 school year to the 2007-08 school year.
The overall yearly funding levels through Title I that the entire state received from the 2001-02 school year through the 2007-08 school year. Information can be either emailed to [email protected] or mailed to the address listed below in whatever format is most convenient. If there are any costs associated with the duplication or if you have any questions about my request, please let me know. Thank you for your time and consideration. Sincerely, Michael E. Robey

152
APPENDIX C
SCRIPT FOR CONTACTING SELECTED SCHOOL
153
Hello, my name is Michael Robey and I am a doctoral student at Loyola
University in the process of completing my dissertation comparing changes in
achievement scores on the 5th grade ISAT associated with schoolwide and targeted
assistance Title I school funding allocations.
I have one very quick question that I’d like to ask you about your school and Title
I funding if I may.
If principal refuses or chooses not to answer:
Thank you for your time.
If principal accepts:
Did your school use any portion of Title I funds in 2006 or 2007 for Math
instruction or was the entire amount allocated for Reading? If you do not know, could
you give me the name and phone number of the person in your school or district that
would know?
Thank you so much for you time. I really appreciate it.

154
APPENDIX D
COMPREHENSIVE DATA FOR SCHOOLS IN THE SAMPLE POPULATION

155
Table D
Comprehensive Data for Schools in the Sample Population

156
REFERENCES
Aarons, D. I. (2009, January). In Chicago, Duncan seen as collaborator. Education Week, 28(16), 1, 24-25.
Allington, R., & Walmsley, S. (Eds.). (2007). No quick fix, the RTI edition: Rethinking
literacy programs in America’s elementary schools. New York: Teachers College Press & International Reading Association.
Allington, R. L. (1983). Fluency: The neglected reading goal in reading instruction. The
Reading Teacher, 36(6), 556-561. Arroyo, C. G. (2008). The funding gap. Retrieved from
http://www.closingtheachievementgap.org/cs/ctag/view/resources/75 Associated Press. (2008, December). Budget woes could mean school cutbacks.
Education Week, 28(15), 14. Bailey, S. K., & Mosher, E. K. (1968). ESEA: The Office of Education administers a law.
Syracuse, NY: University Press. Barton, P. E. (2004, November). Why does the gap persist? Educational Leadership,
62(3), 8-13. Biemer, P. E., & Lyberg, L. E. (2003). Introduction to survey quality. Hoboken, NJ: John
Wiley & Sons. Blankstein, A. M. (Ed.). (2004). Failure is not an option: Six principles that guide
student achievement in high-performing schools (1st ed.). Thousand Oaks, CA: Corwin Press.
Borman, G. D. (2000). Title I: The evolving research base. Journal of Education for
Students Placed At-Risk, 5, 27-45. Borman, G. D., Stringfield, S. C., & Slavin, R. E. (Eds.). (2001). Title I: Compensatory
education at the crossroads. Sociocultural, political, and historical studies in education. Mahwah, NJ: Lawrence Erlbaum Associates.
Bouchard, D., & Sutton, W. (2001). The gift of reading. Custer, WA: Orca Book.

157
Bush, G. W. (2004, October). The essential work of democracy. Phi Delta Kappan, 86(2), 114-119.
Bushaw, W. J., & Gallup, A. M. (2008, September). Americans speak out: Are educators
and policy makers listening? Phi Delta Kappan, 90(1), 9-20. Carey, K. (2004). The funding gap 2004. Washington, DC: The Education Trust. Cowan, K. T. (2003). The new Title I: The changing landscape of accountability.
Washington, DC: Thompson Publishing Group. DeLorenzo, R. A., Battino, W. J., Schreiber, R. M., & Gaddy Carrio, B. B. (2008).
Delivering on the promise: The education revolution. Bloomington, IN: Solution Tree Press.
Dillon, S. (2009, March 9). U.S. to nation’s schools: Spend fast, keep receipts. The New
York Times. Retrieved from http://www.nytimes.com/2009/03/09/education/09educ.html?_r=2&partner=rss&emc=rss
Direction of Our Times (2004). Volume one: Direction for our times. Thoughts on
spirituality as given to Anne, a lay apostle. Justice, IL: Author. Dobbs, M. (2004, June 7). Poor schools sue for funding: Higher standards are basis for
seeking educational adequacy. The Washington Post, p. A13. DuFour, Ri., & Eaker, R. (1998). Professional learning communities at work: Best
practices for enhancing student achievement. Bloomington, IN: Solution Tree Press.
DuFour, R., DuFour, R., & Eaker, R. (2008). Revisiting professional learning
communities at work: New insights for improving schools. Bloomington, IN: Solution Tree Press.
Duncan, G. J., & Brook-Gunn, J. (Eds.). (1997). The consequences of growing up poor.
New York: Russell Sage Foundation. Durkin, D. (1993). Teaching them to read (6th ed.). Boston, MA: Allyn & Bacon. Elementary & Secondary Education Act (ESEA) of 1965, Pub. L. No. 89-10, 79 Stat. 27-
58 (1965).
158
Evans, G., & Schamberg, M. (2009). Childhood poverty, chronic stress, and adult working memory. Proceedings of the National Academy of Sciences: Vol. 106(16), pp. 6545-6549. New York: The Rockefeller University. doi: 10.1073/pnas.0811910106
Freedman, D., Purves, R., & Pisani, R. (2007). Statistics. New York: W. W. Norton &
Company. Gallagher, K. (2009). Readacide: How schools are killing reading and what you can do
about it. Portland, ME: Stenhouse. Greenwald, R., Hedges, L. V., & Laine, R. D. (1996). The effect of school resources on
student achievement. Review of Educational Research, 66(3), 361-397. Hess, F. (2005). Urban school reform: Lessons from San Diego. Cambridge, MA:
Harvard Education Press. Hess, F. M., & Rotherham, A. J. (2007, January). NCLB (2002) and the competitiveness
agenda, happy collaboration or a collision course? Phi Delta Kappan, 88(5), 345-352.
Hill, P. T. (2008). The school finance redesign project: A synthesis of work to date.
Retrieved from University of Washington, Center on Reinventing Public Education website http://www.crpe.org/cs/crpe/download/csr_files/sfrp_interim_07_web.pdf
Hoff, D. J. (2008, December). Bush impact on schools to outlive term. Education Week,
28(15), 1 & 18-19. Hoff, D. J (2009, March). National standards gain steam. Education Week, 28(23), 20-21. Hoff, D. J., & McNeil, M. (2008, September). Top-Notch education ‘a moral obligation’
Obama tells throng. Education Week, 28(2), 16-17. Hopper, G. (2008). Schoolwide and targeted assistance program requirements (Bulletin
No. 04-08). Springfield, IL: Illinois State Board of Education. Retrieved from Illinois State Board of Education http://www.isbe.state.il.us/e-bulletins/
Houston, P. (2008). No Challenge Left Behind: Transforming American education
through heart and soul. Thousand Oaks, CA: Corwin Press. Illinois State Board of Education. (2007). Illinois Reading Assessment Framework in
Grades 3-8: State Assessments beginning season 2006. Retrieved from http://www.isbe.net/assessment/IAFIndex.htm

159
Illinois State Board of Education. (2007). Directory of educational entities. Retrieved
from http://www.isbe.state.il.us/research/htmls/directories.htm Illinois State Board of Education. (2010). Illinois e-Plans: Title I district plan guide (No.
7-10). Retrieved from http://www.isbe.net/sos/htmls/title1.htm Institute of Education Sciences, National Center for Education Evaluation and Regional
Assistance, United States Department of Education. (2007). Final Report on the National Assessment of Title I: Summary of Key Findings (NCEE 2007-4014). Washington, DC: National Center for Education Evaluation and Regional Assistance, Institute of Education Sciences.
Institute of Educational Sciences (2008). Fast facts. Retrieved from
http://nces.ed.gov/fastfacts/display.asp?id=158 Jennings, J. (1995). National issues in education: Elementary and secondary education
Act. Bloomington, IN: Phi Delta Kappa International. Kimbrough, J., & Hill, P. (1981). The aggregate effects of federal education programs.
Santa Monica, CA: RAND. Kirp, D. (2008, September 22). Audacity in Harlem. The American Prospect. Retrieved
from http://www.prospect.org/cs/articles?article=audacity_in_harlem Klein, A. (2009, March). Effect of stimulus on NCLB (2002) renewal mulled. Education
Week, 28(24), 19 & 24. Kozol, J. (1991). Savage inequalities. New York: Harper Perennial. Ladd, H. (2002). Market-based reforms in urban education. Washington, DC: Economic
Policy Institute. Lake County Regional Office of Education. (2010). School directory 2010-2011.
Retrieved from http://www.ltc1n.k12.il.us/Test/roe_sch_dir/docs/LAKE_COUNTY_SCHOOL_DIRECTORY.pdf
Lewis, A. C. (1996, November). Breaking the cycle of poverty. Phi Delta Kappan, 78,
186-187. Lewis, A. C. (2004, October). Redefining inexcusable. Phi Delta Kappan, 86(2), 100-
101.

160
Lewis, A. C. (2008, February). A columnist at risk. Phi Delta Kappan, 89(6), 403-404. Leveque, M. (2009). 2009 Illinois state assessments. Illinois Principals Association
Building Leadership. 16, 1-4. Malone, T. & Napolitano, J. (2009, February 24). Schools hope for the best: Prepare for
the worst. Chicago Tribune. Retrieved from http://www.chicagotribune.com Marzano, R. J., & Waters, T. (2009). District leadership that works: Striking the right
balance. Bloomington, IN: Solution Tree Press and Mid-continent Research for Education and Learning.
Mathis, W. (2003, May). No Child Left Behind: Costs and Benefits. Phi Delta Kappan,
84, 679-686. McKinnon, J. (2009, January 7). Bush to tout his No Child Left Behind initiative. The
Wall Street Journal. Retrieved from http://online.wsj.com/article/SB123137380916262737.html
McMillen, B. J. (2004). School size, achievement, and achievement gaps. Education
Policy Analysis Archives, 12(58), 1-24. McNichol, E., & Lav, I. (2008, December 23). State budget troubles worsen.
Washington, DC: Center on Budget Policies and Priorities. Mehta, S., & Song, J. (2009, February 13). Nation’s schools would get $106 billion from
federal economic stimulus package. The Los Angeles Times. Retrieved from http://www.latimes.com
Miller, M. (2008, December 28). Nixon’s the one to imitate on education. The New York
Times, p. WK10. Mintrop, H. (2008, December). But are schools getting better? Education Week, 28(15),
24-25. Mullin, C. M. & Brown, K. (2008). Grounding research in reality: Fiscal equity and K-
12 funding in Illinois (Policy Research No. IERC 2008-3). Edwardsville, IL: Illinois Education Research Council.
National Reading Panel. (2000). Teaching children to read: An evidence-based
assessment of the scientific research literature on reading and its implications for reading instruction. Washington, DC: National Institute for Literacy.
161
National Research Council. (1998). Preventing reading difficulties in young children. Washington, DC: National Academy Press.
No Child Left Behind (NCLB (2002)) Act of 2001, Public Law 107-110-Jan. 8, 2002,
115 Stat. 1425, 20 U.S.C. § 6301 et seq. [On-line], Available: http://www.ed.gov/policy/elsec/leg/esea02/107-110.pdf
North Cook Intermediate Service Center. (2010). Frequently asked questions: What are
the North Cook ISC districts? Retrieved from http://www.ncisc.org/new_site/main/faqs.asp
Northern Illinois University. (2008). State Report Card. Retrieved from
http://iirc.niu.edu/ Parsons, C. (2009, March 11). Obama’s education overhaul. Chicago Tribune, p. 6. Payne, R. (2005). A framework for understanding poverty. Highlands, TX: aha! Process. Payne, R. (2008). Under-resourced learners. Highlands, TX: aha! Process. Podesta, J., & Brown, C. G. (2008, July). Needed: Federal action for fair funding of high-
poverty schools. Education Week. 27(44), 28 & 32. Pogrow, S. (2005, September). Hots revisited: A thinking development approach to
reducing the learning gap after grade 3. Phi Delta Kappan, 87(1), 64-75. Ponisciak, S. (2005). Understanding the Prairie State Achievement Exam: A descriptive
report with analysis of student performance. Chicago, IL: Consortium on Chicago School Research, University of Chicago.
Popham, W. J. (2004, February). Tawdry tests and AYP. Educational Leadership, 62(4),
85-86. Quaid, L., & Pope, J. (2009, January 25). Stimulus: school money will be hard to cut
later. Seattle Post-Intelligencer. R Development Core Team (2009). R: A language and environment for statistical
computing. Retrieved from http://www.R-project.org Rado, D. (2009, March 5). Illinois tax cap yokes schools in Chicago’s southwest suburbs.
Chicago Tribune. Retrieved from http://www.chicagotribune.com/news/local/chi-tax-cap-sw-zone-05mar05,0,6629654.story
162
Richmond, P. (2008, December 26). Evergreen Elementary defeats obstacles, wins state award. The Seattle Times. Retrieved from http://seattletimes.nwsource.com/html/education/2008560773_distinguishedschool26m.html
Rosborg, J., McGee, M., & Burgett, J. (2003). What every superintendent and principal
needs to know. Santa Maria, CA: Education Communication Unlimited. Rothstein, R. (2007, December 17). Leaving No Child Left Behind, behind. The
American Prospect. Retrieved from http://www.prospect.org/cs/articles?article=leaving_nclb_behind
Sack-Min, J. (2009, February). The fate of NCLB (2002). American School Board
Journal, 196(2), 26-27. Samuelson, R. (1997, April 30). The culture of poverty. The Washington Post. p. A21. Samuelson, R. (2007, October 31). The global poverty trap. Newsweek. Retrieved from
http://www.newsweek.com/id/67277 Sawchuck, S. (2009, March). Stimulus bill spurs focus on teachers. Education Week,
28(24), 1 & 18. Schmoker, M., & Marzano, R. (1999, March). Realizing the promise of standards-based
education. Educational Leadership, 56(6), 17-21. Shen, F. (2000). Does Title I money matter? Chicago, IL: University of Chicago,
Educational Research Center. Srikantaiah, D., Zhang, Y., & Swayhoover, L. (2008). Lessons from the classroom level:
Federal and state accountability in Illinois. Washington, DC: Center on Education Policy. Retrieved from Center on Education Policy http://eric.ed.gov:80/PDFS/ED503896.pdf
Thompson Publishing Group, Inc. (2007). Title I handbook. Washington, DC: Author. Toppo, G. (2009, January 19). Stimulus gives schools $142B with strings. USA Today.
Retrieved from http://www.usatoday.com/news/education/2009-01-19-school-stimulus_N.htm
Tosh, K. (2003). The new Title I: the changing landscape of accountability. Washington,
DC: Thompson Publishing Group.

163
UNICEF, Innocenti Research Centre. (2007). Report Card 7.Child poverty in perspective: An overview of child well-being in rich countries. Florence, Italy: Author. Retrieved from UNICEF website http://unicef-icdc.org/publications/pdf/rc7_eng.pdf
United States Census Bureau, Governments Division. (March 2006). Public education
finances 2004. Retrieved from United States Census Bureau website http://www.census.gov/govs/www/school04.html
United States Department of Education (2002). Title I — Improving the Academic
Achievement of the Disadvantaged. No Child Left Behind Act. [On-line], Available: http://www.ed.gov/policy/elsec/leg/esea02/pg1.html
United States Department of Education (2002, December 2). Title I: Improving the
academic achievement of the disadvantaged: Final rules and regulations. Federal Register, 67(231), 71710-71771.
United States Department of Education, Office of the Under Secretary, Policy and
Program Studies Service. (2003) A snapshot of Title I Schools, 2000–01(Doc No. 2003-02).Washington, D.C.: Author.
Urban League v. Illinois, complaint 08CH30490 filed August 20, 2008 in the Circuit
Court of Cook County, Illinois, County Department, Chancery Division. [On-line], Available: http://www.schoolfunding.info/news/litigation/ILComplaint.pdf
Verstegen, D. A., & Driscoll, L. G. (2008). Educational opportunity: The Illinois
dilemma. Journal of Education Finance, 33(4), 331-351. Viadero, D. (2008, December 10). Study calls for tightly tying school funding to strategic
goals. Education Week, 28(15), 8. Walker Tileston, D., & Darling, S. (2008). Why culture counts. Bloomington, IN:
Solution Tree Press. Walsh, M. (2009, January). Federal appeals court weighs union’s suit over NCLB (2002).
Education Week, 28(16), 7. Walters, D. (2009, January 7). New approach needed to aide poor students. Sacramento
Bee, p. 3A. Weingarten, R. (2009, February 16). The case for national standards. The Washington
Post, p. A15.

164
White House, Washington, DC. (2002). Fact sheet: No Child Left Behind Act. Retrieved from http://georgewbush-whitehouse.archives.gov/news/releases/2002/01/ 0020108.html
Winfield, P. (2009, February 6). Study shows growing education gap. Naperville Sun,
Retrieved from http://www.studentsfirst.us/printer/article.asp?c=219081 Zigler, E. (2009, February). A new Title I. Education Week, 28(20), 26 & 34.

165
VITA
Michael E. Robey was born in Dubuque, Iowa on April 21, 1963 to Elmer and
Mary Robey. He attended Warren High School in Warren, Illinois after moving from
Iowa in seventh grade. After high school, he obtained an Associate Degree from
Highland Community College in Freeport, Illinois and graduated cum laude in 1986 from
Northern Illinois University with a B.S.Ed. in Technology Education.
In 1996, he completed his master’s degree from National-Louis University in
Evanston, Illinois in Technology in Education. In 2001, he returned to graduate school to
obtain his Type 75 administration certificate, his Superintendent’s endorsement in 2006,
and completed his doctoral degree in educational administration and supervision in the
Spring of 2011 all from Loyola University Chicago.
Michael has spent his entire educational career in Illinois teaching technology
education and industrial arts in Rochelle, Crystal Lake, Fisher, and Skokie also serving as
technology director and team leader for the final two years of his teaching career.
He entered into administration as the Assistant Principal of Wood Oaks Jr. High
School in Northbrook from 2001-2004, was the Principal of Blackhawk Middle School in
Bensenville from 2004-2007, Assistant Superintendent of Triad Community Unit School
District in Troy from 2007-2008, and is currently the Assistant Superintendent for
Elementary Schools in Evanston/Skokie School District 65.

DISSERTATION COMMITTEE
The Dissertation submitted by Michael E. Robey has been read and approved by the following committee: Vivian M. Gordon, J.D., Ph.D., Director Associate Professor, School of Education Loyola University Chicago Therese D. Pigott, Ph.D. Associate Professor, School of Education Loyola University Chicago James Fritts, Ph.D. Instructor, School of Education Northeastern Illinois University