the impacts of sector-specifi c policies and regulations on ... · the impacts of sector-specifi...
TRANSCRIPT

The Impacts of Sector-Specifi c Policies and Regulations on the Growth of SMES in Eight Sectors of
the South African Economy
Development Policy Research Unit July 2006 Working Paper 06/112 ISBN: 1-920055-33-9

Development Policy Research Unit Tel: +27 21 650 5705Fax: +27 21 650 5711
Information about our Working Papers and other published titles are available on our website at:http://www.commerce.uct.ac.za/dpru/
Abstract
The paper aims to identify the impacts of sector-specifi c policies and regulations
on the growth of – and job creation by – SMEs in eight sectors of the South African
economy. Where appropriate and, where possible, impacts are quantifi ed. The aim
is also to develop suggestions for policy changes and regulatory reforms which
would reduce the regulatory cost burden on these SMEs and permit them to grow
and take on workers more readily.
The paper contains descriptions of sector-specifi c policies and regulations in the
eight selected sectors, qualitative assessment of the impacts of sector-specifi c
policies and regulations on SMEs in the the selected sectors, quantitative
assessment of these impacts and suggestions are made for policy changes and
reforms to the sector-specifi c regulatory environments of the selected sectors.
The eight sectors are agri-processing, the automotive industry, clothing and
textiles, fi nancial services, information and communications technology (ICT),
mining, pharmaceuticals and tourism.

Acknowledgements
This Working Paper is one in a series emanating from the SMME project, within the
Employment Promotion Programme, which is aimed at Understanding the Regulatory
Environment for Small Business in South Africa. The DPRU are the Programme
Managers of this DFID funded project whose goal is to promote an enabling environment
for employment creation in South Africa, and to contribute to the Government’s goal of
reducing unemployment.

Glossary
ASATA – Association of South African Travel Agents
DTI – Department of Trade and Industry
DCCS – Duty Credit Certifi cate Scheme
ICASA – Independent Communications Authority of South Africa
ICT – Information and Communications Technology
MCC – Medicines Control Council
MFRC – Micro Finance Regulatory Council
MIDP – Motor Industry Development Programme
NATIS – National Transport Information System
RCP – Road Carrier Permit
SABS – South African Bureau of Standards
SANAS – South African National Accreditation System
SAPC – South African Pharmacy Council
SATSA – Southern Africa Tourism Services Association
SME – Small and medium enterprises
TGCSA – Tourism Grading Council of South Africa
THETA – Tourism, Hospitality & Sport Education & Training Authority
VANS – Value-added network services

Table of Contents 1. Agri-Processing.............................................................................................1 Outline of Sector-Specifi c Regulations...................................................1 Agri-Processing SMES’ Perceptions of Sector-Related Regulations.....5 Suggestions for Sector-Level Reforms..................................................7
2. Automotive Industry......................................................................................8 Outline of Sector-Specifi c Regulations...................................................8 Automotive SMES’ Perceptions of Sector-Specifi c Regulations..........11 Suggestions for Sector-Level Reforms.................................................12
3. Clothing and Textiles..................................................................................13 Outline of Sector-Specifi c Regulations.................................................13 Clothing and Textiles SMES’ Perceptions of Sector-Specifi c Regulations...........................................................................................15 Suggestions for Sector-Level Reforms..............................................16
4. Financial Services......................................................................................17 Outline of Sector-Specifi c Regulations...............................................17 Financial Services SMES’ Perceptions of Sector-Specifi c Regulations......................................................................................19 Suggestions for Sector-Level Reforms................................................20
5. Information and Communications Technology.......................................21 Outline of Sector-Specifi c Regulations...............................................21 ICT SMEs’ Perceptions of Sector-Specifi c Regulations......................23 Suggestions for Sector-Level Reforms.................................................24
6. Mining..........................................................................................25 Mining SMEs’ Perceptions of Sector-Specifi c Regulations................25 Suggestions for Sector-Level Reforms...............................................26
7. Pharmaceuticals..........................................................................................28 Outline of Sector-Specifi c Regulations...............................................28 Pharmaceutical Firms’ Perceptions of Sector-Specifi c Regulations....32 Suggestions for Sector-Level Reforms................................................33
8. Tourism.......................................................................................................34 Outline of Sector-Specifi c Regulations................................................34 Tourism SMEs’ Perceptions of Sector-Specifi c Regulations...............36 SBP Suggestions for Sector-Level Reforms........................................37

9. Modeling the Impact of Sector-Specifi c Regulation on Employment Growth.......................................................................................................38
10. Concluding Remarks..................................................................................41
11. A Note on Sources....................................................................................43

The Impacts of Sector-Specifi c Policies and Regulations on the Growth of SMES in Eight Sectors of the South African Economy
1
1. Agri-Processing
In aggregate, food processing fi rms in South Africa have an annual turnover of R57
billion, employ 183,000 people and account for 2.4 per cent of total GDP. Agri-processing
contributes 13 per cent of manufacturing employment and about 12 per cent of the
manufacturing value.
Outline of Sector-Specifi c Regulations
Agri-processing has a complex regulatory environment. Agri-processing fi rms are subject
to regulation by the national Department of Health, the national Department of Agriculture,
the national Department of Environmental Affairs and Tourism, provincial departments of
health and local authorities, the Perishable Products Export Control Board, the South
African Bureau of Standards (SABS) and, indirectly, by the South African National
Accreditation System (SANAS). Food retailers are one of a few types of retail operations
that require specifi c licensing. Retailing premises are subject to inspections and are
required to comply with guidelines for storage and display. It is also important to note
that for each sub-sector there are usually a set of unique procedures and administrative
requirements.
Further, fi rms in export supply chains are often – at least in theory – held to the regulatory
standards of South Africa’s developed country trading partners. These requirements
are codifi ed by the Codex Alimentarius commission, a joint body of the World Health
Organisation and the Food and Agriculture Organisation, recently recognised by the
World Trade Organisation as the international body that sets standards for the global food
trade. South Africa has 18 Codex Alimentarius committees, involving the Departments of
Agriculture, Health, Trade and Industry, the South African Bureau of Standards and the
National Consumers Forum.

DPRU WP 06/112 Strategic Partnerships for Business Growth in Africa
2
The key pieces of legislation affecting the food industry include:
The Foodstuffs, Cosmetics and Disinfectants Act, 1972 (Act 54 of 1972):
This Act governs the manufacture, sale and importation of foodstuffs, cosmetics and
disinfectants from a safety/public health point of view and is administered by the
Directorate: Food Control of the Department of Health and enforced by local authorities in
their areas of jurisdiction. Import control is performed on behalf of the National Department
by Provincial Departments of Health. The Act regulates foodstuffs as such as well as
their labelling and advertising. It does not regulate hygiene provisions that relate to the
handling and transport of food.
The Health Act, 1977 (Act 63 of 1977):
There are several sets of regulations promulgated under this Act that have direct relevance
to food safety and are enforced by local authorities in their areas of jurisdiction. These
include:
Regulations Governing General Hygiene Requirements for Food
Premises and the Transport of Food (G.N. No. R. 918 of 30 July
1999), which regulate hygiene provisions that relate to, amongst
others, the handling and transport of food.
Regulations Relating to Milking Sheds and the Transport of Milk
(G.N. No.R. 1256 of 27 June 1986).
Regulations Relating to Inspections and Investigations (G.N. No.
R. 1128 of 24 May 1991), which provide for detention and seizures
of food.
Regulations Regarding Food and Water Vessels (G.N. No. R. 1575
of 10 September 1971), which aims to prevent the transmission of
certain metals from containers to foodstuffs.
General Regulations Promulgated in terms of the Public Health
Act, 1919 (G.N. No. R.180 of 10 February 1967), which regulates
transport of meat and meat products.
The Liquor Products Act (Act 60 of 1989)
This Act is administered by the Directorate: Food Safety and Quality Assurance of the
Department of Agriculture. It sets up requirements for wines and spirits.
•
•
•
•
•

The Impacts of Sector-Specifi c Policies and Regulations on the Growth of SMES in Eight Sectors of the South African Economy
3
The Agricultural Products Standards Act, 1990 (Act 119 of 1990):
This Act controls and promotes specifi c product quality standards for the local market and
for export purposes. It is administered and enforced by the Directorate: Food Safety and
Quality Assurance in the Department of Agriculture. Assignees such as the Perishable
Products Export Control Board (PPECB) are appointed and authorized to do physical
inspections under the Act.
The Standards Act, 1993 (Act 29 of 1993):
This Act, administered by the SABS, creates compulsory specifi cations for canned meat
and fi sh products and frozen sea foods.
The Meat Safety Act (Act 40 of 2000):
This Act is administered by the Directorate: Food Safety and Quality Assurance in the
Department of Agriculture and enforced by the Departments of Agriculture of the nine
provinces. It regulates meat safety and hygiene standards in abattoirs and regulates the
importation and exportation of unprocessed meat.
This regulatory environment has changed rapidly in the past ten years. Fifty new sets
of regulations on foodstuffs have been issued since 1994.1 In focus group discussions
and interviews in 2004, fi rms reported that this rapid change has been a challenge in
itself, since it requires fi rms not only to remain informed but also to engage in policy
discussions.
1 Based on information posted on: http://www.doh.gov.za/docs/legislation-f.html

DPRU WP 06/112 Strategic Partnerships for Business Growth in Africa
4
Figure 1: Sector-Specific Regulatory Costs as a Percentage of Turnover: Firms in the Agri-
Processing Sector vs. the Economy, by Number of Employees2
2
0
0.002
0.004
0.006
0.008
0.01
0.012
0.014
<5 <10 <50 <100 <200 <500 >500
Main sample Agri-processing
Given both the complexity of the regulatory environment for agri-processing, and its
rate of change in the last decade, it is not surprising that 32 agri-processing fi rms3
surveyed reported that sector-specifi c regulations formed a larger proportion of their total
regulatory costs (33 per cent) than they did for fi rms in any other sector, or for fi rms in the
representative sample (21.6 per cent).
The details of this pattern of costs expressed as percentage of turnover and by number of
employees, as in Figure 1, are perhaps more surprising. As with the main sample, sector-
specifi c regulatory costs rise as fi rms become larger and, presumably, more complex and
more visible to the regulatory authorities. However, they stay below costs in the main
sample in all but two size categories, and are extremely low for agri-processors employing
fewer than 10 people.4 This seems to suggest that SME agri-processors are not strongly
affected by sector-specifi c regulations. Possible reasons for this are discussed below.
2 The 2004 SBP survey was not designed with sector-specific regulations particularly in
mind. For this reason, the data illustrated in Figures 1,4,6,7,9,11, 13 and 15 is likely to
contain a small element of non-sector-specific costs.
3 The agri-processing sample included firms involved in meat processing, dairy, fruit
and vegetable canning, grain milling, oils and general grocery manufacturing.
4 It is also noteworthy that in almost all size categories face lower overall regulatory
costs than the average South African firm.
The Impacts of Sector-Specifi c Policies and Regulations on the Growth of SMES in Eight Sectors of the South African Economy
5
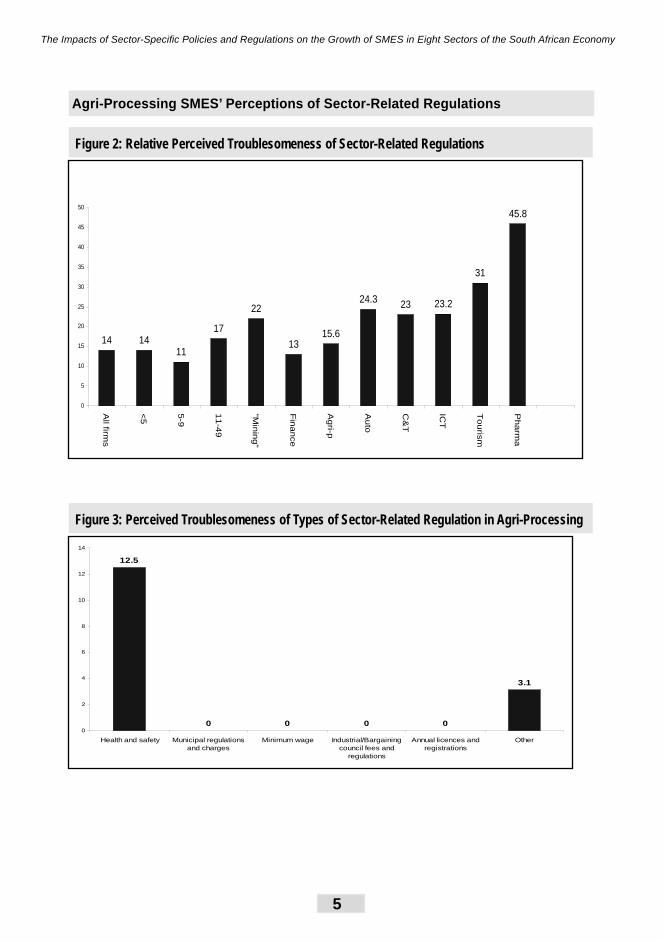
Agri-Processing SMES’ Perceptions of Sector-Related Regulations
Figure 2: Relative Perceived Troublesomeness of Sector-Related Regulations
14 1411
17
22
1315.6
24.3 23 23.2
31
45.8
0
5
10
15
20
25
30
35
40
45
50
All firm
s
<5
5-9
11
-49
"Min
ing
"
Fin
an
ce
Ag
ri-p
Au
to
C&
T
ICT
To
uris
m
Ph
arm
a
Figure 3: Perceived Troublesomeness of Types of Sector-Related Regulation in Agri-Processing
12.5
0 0 0 0
3.1
0
2
4
6
8
10
12
14
Health and safety Municipal regulationsand charges
Minimum wage Industrial/Bargainingcouncil fees and
regulations
Annual licences andregistrations
Other

DPRU WP 06/112 Strategic Partnerships for Business Growth in Africa
6
Figures 2 and 3 (and the analogous Figures 4 and 5) were generated by re-combining
fi rms’ responses in the 2004 survey on which regulations they perceived as most
troublesome, so as to isolate those categories of regulation which tend to be more
sector-specifi c. These are the ‘health and safety,’ ‘municipal regulations and charges’,
‘minimum wage,’ ‘industrial bargaining council’, ‘annual licenses and registrations’ and
‘other’ categories. (By way of context, VAT was mentioned as ‘troublesome’ by 29 per
cent of respondents.)
These fi gures therefore give a sense of the relative perceived troublesomeness of sector-
specifi c regulation and of the types of regulation which make up this burden. As can be
seen, agri-processors perceive themselves to be less than averagely troubled by sector-
specifi c regulations, and experience no signifi cant trouble except from health and safety
regulations.
The data do not permit us to isolate the perceptions of agri-processing SMEs. For these
we turn to the results of a 2004 focus group and interviews in 2003 and 2005. Agri-
processing SMEs reported:
A sense of isolation from the regulatory environment: they did not
know with any precision what the regulations governing their sector
were; they did not know how to fi nd out about these regulations;
and they did not know when or by whom they would be inspected,
or what would be required of them if they were to be inspected.
They tended to be inclined to believe that they were unlikely to be
inspected. As a result, they tended to report that compliance with
regulations was, in practice, inexpensive
A sense that larger fi rms use sector-specifi c regulations to
reduce competition. For instance, sector and sub-sector specifi c
requirements on food quality, content and labelling are perceived
to be enforced by public offi cials only at the specifi c urging of
larger fi rms looking to raise costs for their SME competitors and/or
to protect the image of their own products.
•
•

The Impacts of Sector-Specifi c Policies and Regulations on the Growth of SMES in Eight Sectors of the South African Economy
7
Suggestions for Sector-Level Reforms
In the words of one focus group participant, ‘enforcement is the weakest link’ in the
agri-processing sector. This is certainly the most likely explanation for the pattern of
results seen here, in which all fi rms – and particularly SMEs – report relatively low sector-
specifi c regulatory costs despite operating in a sector which is apparently very extensively
regulated by a number of over-lapping authorities.
International experience and common sense both suggest that a simpler regulatory
structure is likely to be easier to enforce. This is likely to have benefi ts for consumer
safety – especially for the poorer consumers more likely to purchase their food from
SMEs. There is also a considerable amount of qualitative evidence to suggest that larger
fi rms are using the regulatory environment to reduce competition from SMEs. This may
be undesirable, and should certainly be looked at more closely, to see, for instance,
whether or not the benefi ts of this practice in terms of improved quality of goods outweigh
its costs to consumers and to employment.

DPRU WP 06/112 Strategic Partnerships for Business Growth in Africa
8
2. Automotive Industry
The automotive industry employs about 280 000 people. Of these 3 per cent work in tyre manufacturing, 12 per cent in assembly, 21 per cent in component manufacturing and 64 per cent in trade and services.
Outline of Sector-Specifi c Regulations
The most signifi cant regulators of the automotive industry are SABS, which administers
a complex system of automotive manufacturing and maintenance standards on behalf
of the Minister of Trade and Industry; the Department of Transport, which regulates the
motor trade under the National Road Traffi c Act, 1996; the Department of Minerals and
Energy, which regulates petrol stations under the Petroleum Products Act, 1977, as
amended, and the Department of Trade and Industry (DTI),which administers the Motor
Industry Development Programme (MIDP). The industry is also regulated by provincial
Road Traffi c Acts and by municipal by-laws.
The MIDP has been central to the expansion, diversifi cation and export successes of the
automotive manufacturing industry but, as will be seen below, it also generates signifi cant
regulatory costs for smaller fi rms in the sector.
The SABS standards system is highly elaborate, and changes rapidly with technological
change. A division of SABS, Standards SA, operates a three tier system managing
standards for the automotive sector. These are national compulsory specifi cations (VC),
recommended practices (ARP) and rationalised user specifi cations (NRS).
The objective of compulsory specifi cations (VC) is to promote and maintain standardisation
and quality where safety, health, consumer protection or the environment are concerned.
Twenty compulsory specifi cations detailed by Standards SA apply directly to the automotive
industry. Standards South Africa’s recommended practices (ARP) are of a lower status
than, and consequently do not take precedence over VC standards. Rationalised user
specifi cations (NRS) are specifi cations created by organisations other than Standards
SA. ARP or NRS specifi cations may be used by a technical committee when setting
national standards. Standards SA have established a series of technical committees to
consult stakeholders on formulating standards for various products. Nine committees
relate to the automotive sector. In formulating standards, the technical committees guard
against setting unique specifi cation that could be used as a barrier to trade.

The Impacts of Sector-Specifi c Policies and Regulations on the Growth of SMES in Eight Sectors of the South African Economy
9
There are a series of levies associated with certifying that products meet the relevant
standard products; these are paid to Standards SA and are used to fi nance the technical
committees and enforcement.
The South African National Accreditation Service (SANAS) is responsible for accrediting
organisations that carry out testing and inspections. This is particularly important for
vehicle roadworthy certifi cation, where private service providers carry out most of the
actual enforcement.
Under the National Road Traffi c Act, Regulation 70, 79, 80, 85, retail automotive fi rms
require a Motor Trade Permit and Number and to register every vehicle distributed with
the National Transport Information System (NATIS). Importers of used vehicles require
a special permit; this regulation was introduced to control vehicle “dumping” and to
protect local assemblers. The manufacturing of number plates also requires a separate
registration under Regulation 49 of the National Road Traffi c Act.
Manufacturers and importers of new vehicles require a specifi c registration under
Regulations 39 and 46 of the Road Traffi c Act on top of normal business registration.
Additionally, under Regulation 41, for every new model to be sold in South Africa, fi rms
must submit design and testing documentation to Standards SA (and sometimes a model
of the vehicle itself) to demonstrate that it meets VC standards.

DPRU WP 06/112 Strategic Partnerships for Business Growth in Africa
10
Figure 4: Sector-Specific Regulatory Costs as aPercentage of Turnover: Firms in the
Automotive Sector Vs. the Economy, by Number of Employees
0.0%
0.2%
0.4%
0.6%
0.8%
1.0%
1.2%
<5 <10 <50 <100 <200 <500 >500
Main sample Automotive sector
The 33 automotive sector fi rms5 surveyed reported that sector-specifi c regulations formed
a relatively small proportion of their total regulatory costs (9 per cent).
Figure 4 shows the incidence of these costs by fi rm size. There are two distinct peaks – in
the 10 to 50 employees and 200 to 500 employee size bands.
5 This included firms involved in service and retail, component manufacturing and
vehicle assembly.

The Impacts of Sector-Specifi c Policies and Regulations on the Growth of SMES in Eight Sectors of the South African Economy
11
Automotive SMES’ Perceptions of Sector-Specifi c Regulations
Figure 5: Perceived Troublesomeness of Types of Sector-Related Regulation in the Automotive Sector
0
6.1
0
9.1
0
9.1
0
1
2
3
4
5
6
7
8
9
10
Health and safety Municipal regulationsand charges
Minimum wage Industrial/Bargainingcouncil fees and
regulations
Annual licenses andregistrations
Other
Referring back to Figure 2, it can be seen that despite the fact that sector-specifi c costs
form a relatively small proportion of their regulatory burden, automotive fi rms report
perceiving sector-related regulations as a signifi cantly greater burden than the average
fi rm. This burden is perceived to derive equally from industrial council determinations
and from ‘other’ – usually the most narrowly sector-specifi c – regulation. Municipal
regulations were also perceived as troublesome, perhaps because local governments
tend to regulate petrol stations and garages more closely than many other types of
enterprise.
A 2004 focus group and the 2005 interviews revealed that two features of this sector’s
regulatory framework were particularly expensive and troublesome for SMEs: the MIDP
and the related processes of SABS certifi cation and National Transport Information
System (NATIS) registration.
The benefi ts of the MIDP are not in doubt, but it also creates signifi cant regulatory
costs for smaller automotive fi rms seeking to enter the supply chain of the exporting
manufacturers. Firms utilising the MIDP system are required to fi le ‘Declaration of Origin’
forms for all inputs and components. This form – the DA 190 declaration – is fi led on a

DPRU WP 06/112 Strategic Partnerships for Business Growth in Africa
12
quarterly basis at the Department of Trade and Industry. With over 20,000 components
going into a single motor vehicle, the amount of time spent completing forms is signifi cant.
According to one participant in an SBP focus group with the industry, ‘Every single item
in the bill of materials of a component or car has to be traced “back to import” or to when
it was “dug out of the ground” and DA190 declarations must be made at each point along
the supply chain’. An additional complication is created by the fact that MIDP import
credits are only valid for 12 months from date of issue.
The large manufacturers usually employ a team of people to manage the DA 190s received from suppliers and to submit their own forms to the Department of Trade and Industry. This is clearly a cost that is more acceptable to, and absorbed within, a large fi rm which is simultaneously enjoying major benefi ts from the MIDP. It is much less clear, however, that the MIDP burden is reasonable for smaller fi rms and fi rms that do not export, but which are required nonetheless to complete DA 190 forms for their clients. For a medium sized component manufacturer, it is common for managers to spend fi ve days every quarter compiling the required documentation.
SMEs interviewed in 2005 reported that they perceived the SABS automotive product
certifi cation and NATIS systems to be slow, inconvenient and expensive. One SME
reported that it had taken over a year to obtain SABS approval for a new model of trailer
and that NATIS registration had required multiple trips to Pretoria. Another SME involved
in transport reported that they employed a person full time to ‘stand in queues at the
Department of Transport.’
Suggestions for Sector-Level Reforms
An investigation of whether it is possible to reduce the reporting burdens imposed on
SMEs by the MIDP is required.
It is also likely that a ‘time and motion’ study of SABS certifi cation and NATIS registration
for smaller equipment manufacturers and retailers would point to simplifi cations and other
ways of reducing the regulatory burden that would be of signifi cant benefi t to SMEs in the
automotive sector.

The Impacts of Sector-Specifi c Policies and Regulations on the Growth of SMES in Eight Sectors of the South African Economy
13
3. Clothing and Textiles
The clothing and textile industries are often considered separately. There are, however,
enough similarities and linkages between the two to warrant a joint review of their
regulatory environment.
Outline of Sector-Specifi c Regulations
The only signifi cant sector-specifi c regulatory system that applies to the clothing and
textiles industry is the DTI’s Duty Credit Certifi cate Scheme (DCCS). The DCCS was due
to expire at the end of March 2005. It has, however, been extended to March 2007, with
modifi cations which may make it easier for SMEs to benefi t from it. The quantitative and
qualitative information discussed in this report were gathered before the 2005 changes.
In its 2004 form, the DCCS enabled clothing and textile exporters to earn import duty
offsets. In order to qualify for the credits, companies had to enter a productivity monitoring
scheme, as well as invest a minimum of 4 per cent of their wage bill on training. (Newspaper
reports suggest that the performance assessments have since been discontinued and
the training requirements modifi ed.) DCCS credits are tradable within the industry. As a
result, credits are usually earned by manufacturers who export, and in turn on-sell these
to clothing importers.

DPRU WP 06/112 Strategic Partnerships for Business Growth in Africa
14
Figure 6: Sector-Specific Regulatory Costs as a Percentage of Turnover: Firms in the Clothing and Apparel Sector Vs. the Economy, by Number of Employees
0.0%
0.5%
1.0%
1.5%
2.0%
2.5%
<5 <10 <50 <100 <200 <500 >500
Main sample Clothing & apparel
Figure 7: Sector-Specific Regulatory Costs as a Percentage of Turnover: Firms in the Textiles Sector Vs. the Economy, by Number of Employees
0.0%
0.2%
0.4%
0.6%
0.8%
1.0%
1.2%
<5 <10 <50 <100 <200 <500 >500
Main sample Textiles sector
With two exceptions, the 58 fi rms in clothing and textiles had lower sector-specifi c
regulatory costs than South African fi rms in general. In fact, sector-specifi c regulatory
costs in the clothing and apparel industry are the lowest amongst all the sectors surveyed.

The Impacts of Sector-Specifi c Policies and Regulations on the Growth of SMES in Eight Sectors of the South African Economy
15
Sector-specifi c compliance costs for the textile industry are also much lower (less than
half) than in the rest of the economy. SMEs in both sub-sectors seem to be almost
completely unaffected by sector-specifi c regulations.
Clothing and Textiles SMES’ Perceptions of Sector-Specifi c Regulations
Figure 8: Perceived Troublesomeness of Types of Sector-Related Regulation in the Clothing and Textiles Sector
5.3 5.3
8.8
1.8
0
1.8
0
1
2
3
4
5
6
7
8
9
10
Health and safety Municipal regulations andcharges
Minimum wage Industrial/Bargainingcouncil fees and
regulations
Annual licenses andregistrations
Other
Despite their low recorded sector-specifi c regulatory costs, clothing and textiles fi rms
reported that sector-specifi c regulations made up a close-to-average proportion of their
total regulatory costs, and reported themselves to be averagely troubled by sector-
specifi c regulations. Two explanations for this seem plausible. First, given their detailed
knowledge of their own sector and their relative ignorance of other sectors, it could be
that managers are unlikely to perceive that their own fi rms are in fact less expensively
regulated than other types of fi rms. Second, the SBP survey differentiated between
minimum wage determinations and sector-specifi c regulations when asking for regulatory
cost assessments. However, in this sector, which is under intense cost pressure from
imports, minimum wages and conditions of employment are strongly perceived by
managers to be a sector-specifi c problem.
Interviews (2003) and a focus group (2004) showed that larger clothing and textiles
SMEs perceived that:
The DCCS is diffi cult and expensive for SMEs to access and its •

DPRU WP 06/112 Strategic Partnerships for Business Growth in Africa
16
benefi ts are confi ned to the largest fi rms
Minimum wages and conditions of employment agreed at the
industry bargaining council have the effect of making larger and
more visible SMEs less competitive and less likely to expand
output and employment; and also of ‘driving’ production into ever-
smaller ‘cut, make and trim’ SMEs which are able to ignore and
evade bargaining council agreements.
Regulations against illegal imports are very poorly enforced.
As might be expected from the quantitative results, very small clothing SMEs operating
outside areas of union strength reported no sector-specifi c regulatory costs or problems.
Suggestions for Sector-Level Reforms
Further simplifi cation of the DCCS to make it more accessible to SMEs may be
required.
Larger SMEs called for more fl exibility in conditions of employment, particularly concerning
overtime.
Firms in the sector would very strongly support more effective implementation of the
regulatory system against illegal imports.
•
•

The Impacts of Sector-Specifi c Policies and Regulations on the Growth of SMES in Eight Sectors of the South African Economy
17
4. Financial Services
At December 2004, the Micro Finance Regulatory Council (MFRC) had 1905 registered
micro-lenders on its books. Of these, 1 488 were registered as close corporations and so
are, presumably, SMEs. Some of the 287 private companies registered with the MFRC
may also be SMEs.6 In October 2002, the MFRC estimated that around 30 per cent of
micro-lenders were not registered with the MFRC.7
Outline of Sector-Specifi c Regulations
At the time of the survey, micro-lenders were regulated by the MFRC under its July 2002
rules, made in terms of the 1999 Exemption Notice to the Usury Act, 1968.
The 1999 exemption notice permitted micro-lenders to make loans of up to R10 000
for not longer than 36 months at rates of interest above the Usury Act limits but not
exceeding 10 times the average prime overdraft rate.
Under the MFRC’s July 2002 rules, micro-lenders were obliged to apply and pay for
registration with the MFRC; re-register annually; inform the MFRC of any material
changes to the ownership or status of the business; keep detailed accounts and records
of the conditions of each loan made; make detailed fi nancial reports to the MFRC every
month on each loan made; and register each new loan made and each loan paid back
with the MFRC within 2 business days of making the loan or ending the transaction.
Quarterly and annual statistical returns in a prescribed format were required, as were
annual fi nancial statements audited by a person approved by the MFRC. Registered
micro-lenders were also subject to MRFC rules on reckless lending, which required that
lenders ‘shall, prior to entering a money-lending transaction with a borrower, consider
the ability of the borrower to make the required payments… and still to meet his or her
necessary living expenses.’8
6 http://www.mfrc.co.za/detail.php?s=95, accessed August 2005
7 MFRC, Report on unregistered lenders, October 2002.
8 MFRC rules, July 2002, Rule 4.3

DPRU WP 06/112 Strategic Partnerships for Business Growth in Africa
18
However, despite this demanding set of requirements, Figure 9 shows that a sample of
240 fi nancial services including micro-fi nance SMEs did not face higher than average
sector-specifi c regulatory costs.
Figure 9: Sector-specific Regulatory Costs as a Percentage of Turnover: Firms in the Financial Services Sector Vs. the Economy, by Number of Employees
0.0%
0.1%
0.2%
0.3%
0.4%
0.5%
0.6%
0.7%
0.8%
<5 <10 <50 <100 <200 <500 >500
Main sample Financial services

The Impacts of Sector-Specifi c Policies and Regulations on the Growth of SMES in Eight Sectors of the South African Economy
19
Financial Services SMES’ Perceptions of Sector-Specifi c Regulations
Possible reasons for this are suggested by a re-examination of the 2004 qualitative data
and 2005 interviews and desktop research.
Figure 10: Perceived Troublesomeness of Types of Sector-Related Regulation in the Financial Services Sector
1
8
1
2
1
0
1
2
3
4
5
6
7
8
9
Health and safety Municipal regulationsand charges
Minimum wage Annual licences andregistrations
Industrial/Bargainingcouncil fees and
regulations
Figure 2 shows that fi nancial services fi rms are the least ‘troubled’ of all South
African businesses by regulation. Figure 10 shows that MFRC (and other fi nancial
sector) licenses and regulations were only mentioned as ‘troublesome’ by 2 per
cent of respondents. One 2005 interviewee remarked that the MFRC ‘was no
trouble at all’ to his micro-lending business, while giving the strong impression
that he had not actually considered registration.

DPRU WP 06/112 Strategic Partnerships for Business Growth in Africa
20
Suggestions for Sector-Level Reforms
SBP’s data suggests the possibility that the MFRC may be underestimating the proportion
of fi nancial SMEs that operate without registration or oversight.
Effective ways of raising the level of regulatory compliance include simplifi cation of
registration and reporting requirements – and this should perhaps be considered here.
It may also be the case that the R10 000 maximum limit on Usury Act-exempt loans is too
low and that micro-lenders therefore prefer the risks of illegality to the costs of not being
able to make larger loans.

The Impacts of Sector-Specifi c Policies and Regulations on the Growth of SMES in Eight Sectors of the South African Economy
21
5. Information and Communications Technology
The two largest components of the ICT sector are telephony and value-added network
services (VANS). The most common VANS service is providing internet access. The
sector also includes retail provision of ICT goods and services. SMEs in the ICT sector
tend to be retailers and small VANS or other ICT service providers.
Outline of Sector-Specifi c Regulations
The sector-specifi c regulatory environment of the ICT sector operates at two very distinct
levels. Regulation of the major ICT providers (Telkom, the major mobile providers,
Sentech and the other large IT fi rms) is undertaken by ICASA and the Department of
Communications. The main effects of this slow and controversial regulatory process on
SMEs have been through their cost structures rather than by way of specifi c regulations
that apply to ICT SMEs.
There has, however, also been a less well-known process of regulatory development in
the sector, operating largely through the Department of Communications and Parliament
rather than through ICASA, and this has direct impacts on SMEs.9 The relevant legislation
is:
The Electronic Communications and Transactions Act, 2002.
Chapters in the Act on Cryptography and ‘Protection of Critical
Databases’ appear to place heavy registration and reporting
requirements on ICT SMEs
Regulation 1241 of 2003 and Notice 837 of 2004 issued under
the Telecommunications Act, 1996, which require small VANS
providers to pay annual fees to ICASA and the Universal Service
Fund
The Regulation of Interception of Communications and Provision
of Communication-Related Information Act, 2002, which requires
small VANS to maintain infrastructure (or pay into an offi cial fund
that aims to cover the costs of leasing infrastructure) that will permit
9 The interpretations of the regulations in this section are based on input from industry
experts (S & P Esselaar, Report on regulatory compliance costs in the ICT sector,
October 2004) and therefore do not necessarily reflect the perceptions of SMEs.
•
•
•

DPRU WP 06/112 Strategic Partnerships for Business Growth in Africa
22
undetectable monitoring by law enforcement authorities of their
clients’ communications; and also requires additional paperwork
when opening an internet account for a client.
Figure 11: Sector-specific Regulatory Costs as a Percentage of Turnover: ICT Firms Vs. the Economy, by Number of Employees
0.0%
2.0%
4.0%
6.0%
8.0%
10.0%
12.0%
14.0%
<5 <10 <50 <100 <200 <500 >500
Main sample Information communication technology
Despite these regulations, sector-specifi c regulatory costs in the information and
communication technology are reported to be generally slightly lower than in the rest of the
economy. However, a single fi rm among the 40 survey claimed to have spent an amount
equivalent to 50 per cent of turnover on professional and consulting fees in complying with
sector-specifi c regulations. This is not implausible, if this fi rm were attempting to obtain
an important ICT license from ICASA and/or the Department of Communications. If this
observation is omitted the industry average drops to 0.23 per cent, which is signifi cantly
lower than in the rest of the economy. ICT fi rms reported incurring only 12 per cent of
their total regulatory costs from sector-specifi c regulations, compared to 22 per cent for
the representative sample of South African fi rms

The Impacts of Sector-Specifi c Policies and Regulations on the Growth of SMES in Eight Sectors of the South African Economy
23
ICT SMEs’ Perceptions of Sector-Specifi c Regulations
Since the ‘other’ category is likely to contain a large proportion of highly sector-specifi c
regulatory costs, it is interesting that this category is so prominent in Figure 12. This,
however, refers to the perceptions of ICT fi rms of all sizes.
For information on SMEs, we turn to a 2004 commissioned paper from an industry expert, and interviews in 2003 and 2005. These give the impression that ICT-sector SMEs have the following perceptions about sector-specifi c regulations:
Most SMEs ‘fl y below the radar’ of sector-specifi c regulations,
but many are concerned that the costs of compliance would be
crippling if it did become necessary to comply
SMEs perceive the regulatory environment for ICT to be complex
and internally contradictory
SMEs or larger start-ups that are trying to win a major license or
have other reasons for being fully compliant with the ICT-sector
regulatory system face extraordinarily high regulatory costs as a
proportion of their turnover
•
•
•

DPRU WP 06/112 Strategic Partnerships for Business Growth in Africa
24
Figure 12: Perceived Troublesomeness of Types of Sector-Related Regulation in ICT Sector
2.6 2.6
7.7
2.6
0
7.7
0
1
2
3
4
5
6
7
8
9
Health and safety Municipal regulationsand charges
Minimum wage Industrial/Bargainingcouncil fees and
regulations
Annual licenses andregistrations
Other
Suggestions for Sector-Level Reforms
Several of the more demanding statutory requirements on SMEs in this sector to hold
large quantities of information, maintain infrastructure and/or pay turnover levies should
probably be reconsidered. It appears that these requirements may impose excessive
burdens on SMEs and that, at least partly as a result, they tend to be ignored or evaded.
Once again, it seems likely that a simpler regulatory system, focusing on what is essential
and practically possible, would achieve a higher standard of compliance.
One interviewee raised the possibility that regulations defi ning the differences between
various kinds of electrical and electronic technicians are unnecessarily restrictive. He
reported that these regulations were a signifi cant constraint on growing his business.

The Impacts of Sector-Specifi c Policies and Regulations on the Growth of SMES in Eight Sectors of the South African Economy
25
6. Mining
The very small sample of mining fi rms in the 2004 survey (7) makes it impossible to
generate useful comparisons between sector-specifi c compliance costs in mining and
fi rms in general. Useful ‘troublesomeness’ comparisons are also ruled out.
Mining SMEs’ Perceptions of Sector-Specifi c Regulations
Nevertheless, interesting perceptions emerged from a focus group held in 2005 with a
group of SMEs in Steelpoort, nearly all of which are service providers to the local platinum
mines, and from 2005 interviews with sector experts and with small Johannesburg,
Springs and Witbank-based mine services providers.
By far the most powerful perceptions emerging from these discussions and interviews
related to the health and safety requirements enforced by large mining companies on
their SME contractors. SMEs perceived that:
Health and safety regulations in mining have been getting rapidly
more complex and more expensive to comply with (often now
approaching 30 per cent of a typical contract’s value)
Compulsory health and safety training – ‘induction’ – processes are
often extremely elaborate and repetitive. One SME claimed that
induction can take up to a week per contract; another suggested
3 days quarterly, yet another claimed that, in one extreme case, 2
hours of each work day on a short contract were spent receiving
the same health and safety induction.
It is not possible for SME contractors to fully recover the cost of
these compliances from their corporate employers
The increasing complexity and rigor of these regulations has not
led to an increase in their actual level of safety
Corporate mines’ interpretations of these regulations vary
considerably from one to the other. They often refuse to accept
each others accreditations and therefore impose repeated
unnecessary costs on SME contractors. SME contractors are
obliged, for instance, to get different sets of health certifi cate ‘red
•
•
•
•
•

DPRU WP 06/112 Strategic Partnerships for Business Growth in Africa
26
cards’ for their employees from each mine for which they work, in
many cases even when mines are within the same group.
The practice of requiring all the equipment used by contractors
on-site to be assessed in advance for safety – ‘tagged’ – has
been over-extended. One SME claimed, for instance, that shovels
employed in fence construction were individually assessed for
safety. Several other SMEs perceived that very extensive ‘tagging’
requirements are imposed on contractors by mine managers as a
form of ‘job creation’ for retrenched former mine employees now
working as tagging consultants.
SMEs also reported that they are obliged to compile very extensive ‘contractor’s packs’
as a pre-condition for being awarded a contract, and that these documents are required
to contain vast quantities of unnecessary detail about working methods, equipment and
personnel. (One contractor’s pack shown to an SBP researcher concerned the construction
of a fence, and ran to roughly 600 pages.)
Suggestions for Sector-Level Reforms
Given the fact that the perceived increase in the complexity and rigor of safety regulations
has been accompanied by a signifi cantly declining trend in fatalities per million hours
worked since 198810, any proposed relaxations or simplifi cations of mine health and
safety regulations to benefi t SMEs should be approached with extreme caution.
However, there seems to be no good reason why the Department of Minerals and Energy,
mining corporations, labour unions and SMEs should not work towards the standardisation
across mining groups and mining regions of interpretations of the health and safety
regulations, and therefore towards mutual recognition of each other’s health and safety
certifi cations for SME suppliers.
Contractors are always likely to complain that they cannot fully recover the cost of compliance from their corporate employers. However, interviewees also reported that one important reason why their ‘margins are squeezed’ is that nines do not explicitly state the level and
10 See Chamber of Mines, Mining safety performance statistics available at
www.bullion.org.za, accessed August 2005
•

The Impacts of Sector-Specifi c Policies and Regulations on the Growth of SMES in Eight Sectors of the South African Economy
27
extent of health and safety compliance required of successful tenderers. As a result, SMEs fear that they will be under-bid by more cavalier or more inexperienced competitors. They also report being frequently ‘surprised’ mid-contract by new or unanticipated health and safety requirements. Mining houses and individual mines should take greater care to ensure that health and safety requirements are always clearly spelled out in invitations to tender and that requirements not change mid-contract unless absolutely necessary.

DPRU WP 06/112 Strategic Partnerships for Business Growth in Africa
28
7. Pharmaceuticals
The pharmaceutical industry has sales of around R13 billion a year and accounts for
0.6 per cent of GDP. The private pharmaceutical sector employs about 41 500 people
– around 19 500 in manufacturing, 4 500 in wholesale operations and at least 17 500 in
community pharmacies.
Outline of Sector-Specifi c Regulations
The pharmaceutical sector is regulated by authorities created in the Medicines and
Related Substances Act, 1997, as amended, 2002 and 2004; the Pharmacy Act, 1974,
as amended 1997 and 2000. These authorities are the Medicines Control Council (MCC)
and the South African Pharmacy Council. (SAPC) Both are ultimately responsible to the
Minister of Health.
A comprehensive set of Regulations to the Medicines Act has been published, running to some 70 pages. In addition the MCC from time to time publish guidelines on matters of practice and interpretation of the Act. At present, for instance, a draft Code of Practice for the marketing of medicines (64 pages) has been published for public comment.
The MCC has 11 technical committees. These include the Clinical Committee,
Pharmaceutical and Analytical Committee, Clinical Trials Committee, Scheduling
Committee, Veterinary Committee, Pharmacovigilance Committee, Biological Committee,
Complementary Medicines Committee, and African Traditional Medicines Committee.
There are two main types of sector-specifi c regulations: those applying to the manufacture
of pharmaceuticals and those applying to retailing.
Under the Medicines Act, application for the licensing or registration of a medicinal product
by the MCC requires completion of an MRF1 document and submission of all relevant
data. The application includes 17 annexes, requiring complete information regarding the
formulation of the medicine, the raw material specifi cations, fi nal product specifi cations,
analytical control procedures, method of manufacture, details of pharmacology,
bioavailability and toxicity, safety and effi cacy. This dossier is submitted to the MCC, and
the evaluation process currently takes between two and three years. (It is anticipated that
the backlog will be compounded by the ‘call up’ for listing of the approximately 13 000
complementary medicines available in South Africa and by the introduction of compulsory
patient information leafl ets and a pre-screening process as a new fi rst stage of medicine
registration.)

The Impacts of Sector-Specifi c Policies and Regulations on the Growth of SMES in Eight Sectors of the South African Economy
29
During this time, the company and the responsible pharmacists must remain registered,
and thus incur expense without income. After evaluation and prior to the licensing for
the product, the applicant is subject to a site inspection, paid for by the applicant. After
the product is licensed, an annual retention fee is payable, and the product’s license is
re-evaluated every fi ve years. Manufacturers must also adhere to regulations on labels,
storage, batch control, and product complaint handling.
A manufacturer is required to conduct routine self compliance audits and present
documentary evidence that these have taken place when audited by the inspectors of
the MCC or the SA Pharmacy Council. Areas to be monitored include labelling, storage,
batch release and authorisation, product complaint handling, lot control, batch tracking
and validation of manufacturing processes and equipment .
Should there be changes to any process after the issuing of the product licence,
amendments need to be submitted to the MCC for ratifi cation or approval prior to
implementation. These must be substantiated with the necessary evidence and
documentation.
Before 2003, medicines manufactured in South Africa destined for sale on the export
market only did not have to be registered in South Africa prior to manufacture and sale.
Since that date, any medicine manufactured in South Africa, even if only for export, must
be registered prior to it being made.
The inspectorate of the MCC conducts routine audits with each fi rm, including
wholesalers/distributors (and licensed dispensing premises under the new amendments)
being audited at least once every three years. Those with major non-compliance issues
receive follow up audits should the corrective action following the audit report be deemed
insuffi cient. Should compliance still not be achieved, the Inspectorate may close the
facility until such time as it is satisfi ed that patient safety and adequate manufacturing
practices are in place.
Most manufacturers have a regulatory department and/or employ a dedicated regulatory pharmacist. In addition, manufacturing fi rms will often need to hire regulatory consultants. In larger organisations, the costs involved in establishing and carrying such a person or department can be amortised over a wide basket of products, but the smaller entity will often devote a signifi cant proportion of income towards maintaining their licences.

DPRU WP 06/112 Strategic Partnerships for Business Growth in Africa
30
A retail pharmacy (referred to in the sector as a ‘community pharmacy’) must be licensed
by the Department of Health, have facilities approved by the SAPC and be noted in a
register held by the MCC. The license applies only to the specifi ed location and individual.
A new application is required if the business is to be relocated and a ‘certifi cate of need’
must now be obtained from the Department of Health. The registered pharmacists
operating the pharmacy and their pharmacy assistants pay an annual re-registration fee
to the SAPC.
Community pharmacies are required to keep records of all medicine transactions for products above Schedule 1. Sales of schedule 5 and 6 medicines – such as opiates – must be entered in a separate register and reconciled by the pharmacist quarterly. Records of prescriptions and purchase orders must be retained on the premises for a minimum of fi ve years.
Manufacturers and retailers are required under the Medicines Act to generate
documentation on their premises in the form of a Site Master File, containing fl oor plans
and ‘Standard Operating Procedures’ for the specifi c manufacturing or retail operation.
Community pharmacies, manufacturers and distributors are also subject to regulations
on medicines temperature control, which can create signifi cant capital costs for smaller
fi rms.
Mandatory community service for pharmacists was introduced as a condition of registration
under the 2000 Pharmacy Amendment Act. Thus, in order to become registered as a
practicing pharmacist, one must fi rst do a year’s internship followed by a year of community
service prior to registration by the SA Pharmacy Council.
In April 2004, price control in the form of Medicines Act regulations was applied to the
sector. The data below was gathered before this change.

The Impacts of Sector-Specifi c Policies and Regulations on the Growth of SMES in Eight Sectors of the South African Economy
31
Figure 13: Sector-specific Regulatory Costs as a Percentage of Turnover: Pharmaceutical Firms Vs. the Economy, by Number of Employees
0.0%0.2%0.4%0.6%0.8%1.0%1.2%1.4%1.6%1.8%
<5 <10 <50 <100 <200 <500 >500
Main sample Pharmaceuticals
As Figure 13 shows, sector-specifi c regulatory costs for the pharmaceutical industry are
higher for every employment band than for ‘average’ fi rms in the rest of the economy, and
also higher than the other sectors considered in this report with the surprising exception
of the tourism sector. Costs are regressively distributed across fi rms, as they are for the
economy as a whole.
Since poor quality or incorrectly provided medicines pose grave risks, and since there are
important social goals which a freer market in drugs may not be able to meet, it is no doubt
appropriate that the sector should be properly regulated. However, it remains an open
question whether smaller fi rms in the industry need to be so expensively regulated.

DPRU WP 06/112 Strategic Partnerships for Business Growth in Africa
32
Pharmaceutical Firms’ Perceptions of Sector-Specifi c Regulations
Referring back to Figure 2 we see that the 35 pharmaceutical fi rms in SBP’s survey
reported themselves as particularly ‘troubled’ by sector-specifi c regulations. Figure 14
shows that the bulk of this troublesomeness is perceived to derive from ‘other’ – largely
sector-specifi c – regulation.
Figure 14: Perceived Troublesomeness of Types of Sector-Related Regulation in the Pharmaceuticals Sector
14.3
0 0
2.9 2.9
25.7
0
5
10
15
20
25
30
Health and safety Municipal regulationsand charges
Minimum wage Industrial/Bargainingcouncil fees and
regulations
Annual licenses andregistrations
Other
Research commissioned by SBP from an industry expert in 2004 did not reveal any
pharmaceutical manufactures that would qualify as SMEs.11 It is perhaps an interesting
fi nding in itself that despite repeated attempts, no community pharmacist in the
Johannesburg area would agree to be interviewed for this project. For this reason, the
suggestions for sector-level reform are entirely based on the work commissioned from
the industry expert.
11 J Meekings, The cost of regulatory compliance in the South African pharmaceutical industry,
October 2004

The Impacts of Sector-Specifi c Policies and Regulations on the Growth of SMES in Eight Sectors of the South African Economy
33
Suggestions for Sector-Level Reforms
Three obvious areas for reform are:
Rationalising regulatory oversight of retail pharmacies, perhaps to
a single body responsible for the routine licensing and inspection
Modernising information storage requirements on retail pharmacies
to permit electronic storage
Taking steps to reduce delays and backlogs in medicine
registration by the MCC. It may be appropriate, for instance, to
consider delaying current plans to register complementary and
alternative medicines until the conventional medicines backlog is
reduced.
•
•
•

DPRU WP 06/112 Strategic Partnerships for Business Growth in Africa
34
8. Tourism
In 2004, tourism employed around 512 000 people in South Africa – nearly 4,2 per cent of
total employment. In 2003, foreign direct spending on tourism injected nearly R54 billion
into the economy.
Outline of Sector-Specifi c Regulations
As Figure 15 shows, SBP’s sample of 42 fi rms in the tourism sector had a signifi cantly
heavier than average sector-specifi c regulatory burden. The average tourism fi rm spends
more on sector-specifi c regulatory costs than does any other type of fi rm: three times
as much as those in the rest of the economy. Tourism SMEs with between 5 and 10
employees report exceptionally high sector-specifi c regulatory costs, as do fairly large
tourism fi rms.
Figure 15: Sector-specific Regulatory Costs as a Percentage of Turnover: Pharmaceutical Firms Vs. the Economy, by Number of Employees
0.0%
0.5%
1.0%
1.5%
2.0%
2.5%
3.0%
3.5%
<5 <10 <50 <100 <200 <500 >500
Main sample Tourism sector
There is something of a puzzle here. SBP’s desktop research in 2004-5 and SME
interviews in 2005 uncovered only one set of compulsory national sector-specifi c
regulations that apply to tourism SMEs strictly in their capacity as tourism fi rms. These
are the 2001 Regulations issued under the Tourism Act, 1993, as amended, 2000. These
regulations are fairly demanding. Registration as a tour guide is conditional upon formal
proof of competence, which in turn requires tour guides to have a valid heavy-vehicle
licence and to have undergone training – often rather rigorous, province-specifi c training

The Impacts of Sector-Specifi c Policies and Regulations on the Growth of SMES in Eight Sectors of the South African Economy
35
– accredited by the Tourism, Hospitality and Sport Education and Training Authority
(THETA). Provincial tourism authorities have been created under provincial tourism Acts,
but only the KwaZulu-Natal provincial government appears to have made regulations
requiring that tourism fi rms within their jurisdiction be registered with the provincial
tourism authority.
Tourism fi rms are also subject to several important – but not strictly compulsory – regulatory
requirements. These include membership of the grading scheme run by the Tourism
Grading Council of South Africa (TGCSA); administering and paying over the 1 per cent
voluntary12 levy on tourists to the Tourism Business Council of South Africa (TBCSA) to
fund international marketing; and, where relevant, maintaining membership of industry
associations such as the Southern Africa Tourism Services Association (SATSA) and the
Association of South African Travel Agents (ASATA). It is likely that some of the costs
of these voluntary registrations – which are, apparently, quite strongly enforced through
peer pressure within the industry – are refl ected in Figure 15
Nevertheless, it is highly implausible that a single set of national regulations on tour guides, one provincial registration requirement and some semi-voluntary association memberships could explain the reported pattern of unusually high regulatory costs A more likely explanation of this pattern of costs is the fact that, in the ordinary course of their business, tourism fi rms tend to engage in a wide range of highly regulated activities – such as transport, catering and foreign exchange transactions – which are not strictly sector specifi c but which each entail signifi cant regulatory costs. From the perspective of tourism fi rms, these regulations are perceived as sector-specifi c because they are an integral part of the everyday business of the tourism fi rm.
12 It is voluntary for firms to administer the pay over the levy to the TBCSA. Clients, it
appears, are rarely if ever given the option.

DPRU WP 06/112 Strategic Partnerships for Business Growth in Africa
36
Tourism SMEs’ Perceptions of Sector-Specifi c Regulations
Figure 16: Perceived Troublesomeness of Types of Sector-Related Regulation in the
Tourism Sector
4.8
19
0
2.4
0
4.8
0
2
4
6
8
10
12
14
16
18
20
Health and safety Municipal regulationsand charges
Minimum wage Industrial/Bargainingcouncil fees and
regulations
Annual licenses andregistrations
Other
Tourism fi rms of all sizes in the 2004 SBP sample perceived themselves to be more
troubled by regulation than any other type of fi rm except pharmaceutical companies
(Figure 2). They perceived municipal regulations as being responsible for the bulk of this
diffi culty (Figure 16.)
In 2005 interviews, tourism SMEs corroborated the perception that municipal regulations and charges (particularly municipal regulations on bus transport and other traffi c issues) were troublesome to them, and also reported signifi cant diffi culty from the following regulations:
The Department of Transport’s Road Carrier Permit (RCP)
regulations under the Road Transportation Act, 1977 as amended.
These require every single application for a 3 year RCP to be
published in the Government Gazette for comment. (This means
that every bus on the road requires an RCP application to be
published in the Gazette.) These applications are also, in the
perception of one interviewee, subject to several other inordinate
•

The Impacts of Sector-Specifi c Policies and Regulations on the Growth of SMES in Eight Sectors of the South African Economy
37
delays. This interviewee reported that obtaining temporary 2-week
RCPs for his SME’s buses required the fi rm to employ a person
full-time ‘to stand in the queue at the Department of Transport.’
While the 2001 regulations on tour guides were welcomed as a
valuable form of quality control and skills development, long delays
and ineffi ciencies were reported from THETA. One fi rm complained
that the high required standard of knowledge and province-by-
province specifi city of the training were disproportionate to the
requirements of the job.
Regulations governing foreign exchange were perceived as
cumbersome, and the costs of foreign exchange transactions as
exorbitant
South African visa requirements for nationals of neighboring
countries were perceived as excessive
One SME travel agent perceived ASATA’s rules and inspections
of members as having the effect of reducing the competitiveness
of SMEs.
SBP Suggestions for Sector-Level Reforms
Investigation of ways to increase the effi ciency of the tour guide regulations seem called
for. Urgent action to remove the bottleneck created by the RCP regulations is undoubtedly
required.
The major regulatory challenge facing tourism SMEs, however, seems to come from regulations that are not strictly specifi c to tourism narrowly defi ned. Rather, these regulations apply to fi rms that provide a range of personal services. This wider problem will require wider solutions, including systematic review of the regulatory environment for the services sector in general.
•
•
•
•

DPRU WP 06/112 Strategic Partnerships for Business Growth in Africa
38
9. Modeling the Impact of Sector-Specifi c Regulation on Employment Growth13
13
The 2004 SBP survey asked fi rms to name factors that discouraged them from hiring
more employees, and each fi rm was allowed three answers. This question was asked
before the more detailed questions on regulations, so as not to bias respondents towards
naming regulation as one of the constraints. A yes/no variable was derived from these
answers that indicates whether a fi rm listed regulations as one of the three most important
constraints on employment growth. This variable was created and used as the dependent
variable in a probit regression in order to gauge what determines whether fi rms perceive
regulation as being a constraint on employment growth.14
When estimating this regression while including all the different types of regulatory
costs (expressed as a percentage of turnover) as explanatory variables, sector-specifi c
regulatory costs showed up as the type of cost with the largest positive coeffi cient, which
indicates that a marginal increase in this type of regulation was more discouraging of
employment growth than any of the other kinds of compliance costs.
Table 1 presents a model in which we control for employment bands and sector, as well as including total recurring and sector-specifi c regulatory costs. Sector-specifi c costs have a positive and signifi cant effect on the probability that a fi rm perceives regulation as constraining employment growth. Tourism also shows a signifi cant positive effect.
13 This section reports on statistical analysis of the 2004 representative sample
commissioned by SBP in August 2005 from Rulof Burger, Economics Department,
Stellenbosch University
14 A similar regression was estimated on whether regulations were constraining firm
growth, but the results were less conclusive.

The Impacts of Sector-Specifi c Policies and Regulations on the Growth of SMES in Eight Sectors of the South African Economy
39
Table 1: Probit Regression on whether Regulation is Perceived to Constrain Employment
Dependent Variable: Regulation Perceived as Constraining Employment
Observations 664
Employment bands:
Between 5 and 10 0.286**
(0.011)
Between 10 and 50 0.369*
(0.061)
Between 50 and 100 0.354
(0.492)
Between 100 and 200 0.742
(0.299)
Between 200 and 500 0.697
(0.431)
More than 500 0.113
(0.893)
Recurring regulatory costs -0.276
(0.170)
Sector-specific regulatory costs 7.079***
(0.007)
Tourism 1.583**
(0.041)
Note: Value of standard errors in parenthesis.* Signifi cant at 10 per cent, ** at 5 per cent and *** at 1 per cent levels.
Figure 17 demonstrates the simulated impact of a decrease in the sector-specifi c
regulatory costs on the fi rm’s perception that regulations acted as a constraint on the
fi rm’s employment growth. As the costs are decreased from 5 per cent to 0 per cent15
the probability that the fi rm will feel constrained by regulations to expand employment
decreases from 56.3 per cent to 42.8 per cent.
15 Although the sector-specific regulatory costs for the average firm comprises only 0.6
per cent of turnover, approximately 2.5 per cent of firms experienced a burden
exceeding 5 per cent.

DPRU WP 06/112 Strategic Partnerships for Business Growth in Africa
40
Figure 17: Simulated Effect of a Decrease on Sector-Specific Regulatory Costs on Employment
Growth
40%
42%
44%
46%
48%
50%
52%
54%
56%
58%
0% 1% 2% 3% 4% 5%
Sector-specific regulatory cost (as % of turnover)
Sh
are
of
firm
s t
ha
t p
erc
eiv
ed
re
gu
lati
on
s a
s
a c
on
str
ain
t o
n e
mp
loy
me
nt
gro
wth
Regression analysis therefore shows that the level of sector-specifi c regulatory costs that
a fi rm pays is an important determinant of whether this fi rm is discouraged by regulations
from hiring more workers. All other things being equal, a decrease in these costs should
therefore increase employment.
Unfortunately, the data does not allow us to infer the magnitude of employment growth
that is at stake.

The Impacts of Sector-Specifi c Policies and Regulations on the Growth of SMES in Eight Sectors of the South African Economy
41
10. Concluding Remarks
Sector-specifi c regulations create some signifi cant costs for SMEs, particularly in the
automotive, pharmaceutical and tourism sectors. Percentages of turnover spent on
sector-specifi c regulatory compliance may seem relatively small, but a small percentage
of turnover will usually translate into a large percentage of profi t.
Further, SMEs in all the sectors discussed in this report perceive sector-specifi c
regulatory costs and burdens as constraints to growth and to employing more people. In
fact, regression analysis suggests that an increase in sector-specifi c regulatory costs is
more discouraging of employment growth than an increase in any other kind of regulatory
compliance cost. It is clear, therefore, that the kinds of reforms to the sector-specifi c
regulatory environment suggested in this report would stimulate employment.
However, most of the samples analysed in this report are too small to be representative
– and the qualitative research discussed here was not deep enough to be defi nitive.
This paper has therefore established that changes to the sector-specifi c regulatory
environment would often benefi t SMEs, and has identifi ed certain obvious candidates
for abolition or reform. More complete and precise details about which sector-specifi c
regulations to reform, about how exactly to change them, and about the likely costs
and benefi ts of these reforms, can only emerge from deeper qualitative and quantitative
research with larger sector samples. We strongly recommend that larger sector studies
of this sort be undertaken in the sectors discussed here, but also in agriculture, fi shing,
construction and retail personal services.
As the case of tourism shows, it would often also be important to look closely at the
regulatory environment from the point of view of expanding SMEs, rather than too
narrowly by sector. At least in tourism – and almost certainly in other service sectors
– what appears to matter is the range of regulations, each relating to apparently different
sectors, that an SME is likely to encounter in its daily business. ‘Time and motion’ studies
of the ways in which SMEs interact with the regulatory environment are likely to be a
valuable tool here.
This report suggests that sector-specifi c regulations have very little impact on the
behaviours and costs of SMEs in agri-processing and in the clothing and textiles sectors,
and that ICT and fi nancial services SMEs also often ignore, evade, or are simply unaware
of sector-specifi c regulations. There are good social and economic reasons for wanting

DPRU WP 06/112 Strategic Partnerships for Business Growth in Africa
42
SMEs in these sectors to be more compliant with certain sector-specifi c regulations. But
they are only likely to become more compliant if the regulatory environment in these
sectors is simplifi ed to the point where both compliance and enforcement become realistic
possibilities.

The Impacts of Sector-Specifi c Policies and Regulations on the Growth of SMES in Eight Sectors of the South African Economy
43
11. A Note on Sources
SBP made a commitment to interviewees and focus group participants that their
identities would not be divulged. SMEs tend not co-operate with research except on this
condition.
It is therefore not possible to provide the standard list of interviewees and focus group
participants.
Focus groups
5 focus groups were held:
1. Agri-processing group, 9 participants, Johannesburg 26 July 2004
2. Automotive group, 8 participants, Johannesburg, 27 July 2004
3. Clothing and textiles group, 8 participants, Cape Town, 28 July 2004
4. Steelpoort group (including mining and construction SMEs), Steelpoort, Mpumalanga 11 July 2005
5. Springs group (including SMEs in manufacturing, mining, construction, ICT, fi nancial services manufacturing), Springs, Gauteng, 2 August 2005
Interviews
A total of 45 in-depth interviews were undertaken.
23 interviews conducted with SMEs in February and March 2003 for an earlier project but
exploring relevant issues were reanalysed for this report. This set of interviews included
SMEs in agri-processing, clothing and textiles, ICT and mining.
22 interviews were conducted in August and October 2005 specifi cally for this project.
SMEs in each sector discussed in this report were interviewed, except for Clothing and
Textiles (covered by its own focus group) and pharmaceuticals. As remarked above,
repeated efforts to secure interviews with community pharmacies failed. It was therefore
necessary to rely on a paper commissioned from an industry expert to gather qualitative
information on this sector.