the impacts of u.s.-latin american trade on the southwest ... · mr. david brightwell, regional...
TRANSCRIPT

Technical Report Documentation Page 1. Report No.
SWUTC/02/167221-1
2. Government Accession No.
3. Recipient’s Catalog No.
5. Report Date
September 2002
4. Title and Subtitle
The Impacts of U.S.-Latin American Trade on the Southwest’s Economy and Transportation System: Case Studies of Coffee and Steel on the U.S.-Brazil Trade Corridor
6. Performing Organization Code
7. Author(s)
Leigh B. Boske and John C. Cuttino
8. Performing Organization
Research Report 167221-1
10. Work Unit No. (TRAIS)
9. Performing Organization Name and Address Center for Transportation Research University of Texas at Austin 3208 Red River, Suite 200 Austin, Texas 78705-2650
11. Contract or Grant No. 10727
10727
13. Type of Report and Period Covered
12. Sponsoring Agency Name and Address
Southwest Region University Transportation Center Texas Transportation Institute Texas A&M University System College Station, Texas 77843-3135
14. Sponsoring Agency Code
15. Supplementary Notes
Supported by general revenues from the State of Texas. 16. Abstract
This report traces economic and transport impacts of U.S.-Latin America trade through case studies of coffee and steel from Brazil to the U.S.-destination Port of Houston. It is the second of a two-report series on economic impacts, following The Impacts of U.S.-Latin American Trade on the Southwest's Economy and Transportation System: An Assessment of Impact Methodologies, and adopting a similar case study methodology to more adequately measure the cumulative impacts of trade along a commodity's value/supply chain.
The recommended methodology entails the adoption of the transportation corridor and the commodity shipments as units for analysis, and the case studies of coffee and steel delineate how trade and transportation actually take place. The report follows trade and transport through various stages of production and consumption from the originating region in Brazil, through the Brazilian gateway ports of Vitória and Santos, to arrival at the Port of Houston with analysis of the commodities movements along multiplicative supply chains. Cumulative impacts are measured in relation to actual movement and activity. In this way, the report identifies more policy-relevant impacts, identifies trade opportunities, and reveals factors aiding and impeding the effective functioning of a trade/transport corridor.
17. Key Words
Trade Corridor, Transportation Corridor, Logistics, U.S.-Brazil Trade, U.S.-Latin America Trade
18. Distribution Statement
No restrictions. This document is available to the public through NTIS: National Technical Information Service 5285 Port Royal Road Springfield, Virginia 22161
19. Security Classif.(of this report)
Unclassified
20. Security Classif.(of this page)
Unclassified
21. No. of Pages
146
22. Price
Form DOT F 1700.7 (8-72) Reproduction of completed page authorized


The Impacts of U.S.-Latin American Trade on the Southwest's Economy and Transportation System:
Case Studies of Coffee and Steel on the U.S.-Brazil Trade Corridor
By
Leigh B. Boske and
John C. Cuttino
SWUTC/03/167221-1
Southwest Region University Transportation Center
Center for Transportation Research
University of Texas at Austin
Austin, Texas 78712
September 2002

iv

v
Abstract
This report traces economic and transport impacts of U.S.-Latin America trade through case studies of coffee and steel from Brazil to the U.S.-destination Port of Houston. It is the second of a two-report series on economic impacts, following The Impacts of U.S.-Latin American Trade on the Southwest's Economy and Transportation System: An Assessment of Impact Methodologies, and adopting a similar case study methodology to more adequately measure the cumulative impacts of trade along a commodity's value/supply chain.
The recommended methodology entails the adoption of the transportation corridor and the commodity shipments as units for analysis, and the case studies of coffee and steel delineate how trade and transportation actually take place. The report follows trade and transport through various stages of production and consumption from the originating region in Brazil, through the Brazilian gateway ports of Vitória and Santos, to arrival at the Port of Houston with analysis of the commodities movements along multiplicative supply chains. Cumulative impacts are measured in relation to actual movement and activity. In this way, the report identifies more policy-relevant impacts, identifies trade opportunities, and reveals factors aiding and impeding the effective functioning of a trade/transport corridor.

vi
Disclaimer
The contents of this report reflect the views of the authors, who are responsible for the facts and the accuracy of the information presented herein. This document is disseminated under the sponsorship of the Department of Transportation, University Transportation Centers Program, in the interest of information exchange. Mention of trade names or commercial products does not constitute endorsement or recommendation for use.

vii
Acknowledgments
The authors recognize that support for this research was provided by a grant from the U.S. Department of Transportation, University Transportation Centers Program to the Southwest Region University Transportation Center which is funded 50% with general revenue funds from the State of Texas. This report could not have been completed without the generous donation of time and information by dozens of individuals. The following individuals deserve special recognition for their assistance on various aspects of this study: Mr. Carlos de Aldecoa, President, CADECO Industries, Inc., Houston, Texas; Ms. Doris J. Bautch, Chief, Division of Ports, U.S. Maritime Administration, Washington, D.C.; Dr. Stephen O. Bender, Principal Specialist, Unit for Sustainable Development and Environment, Organization of American States, Washington, D.C.; Mr. David Brightwell, Regional Sales Manager-Imports, Lykes Lines, Houston, Texas; Ms. Beatriz Machado Caiado, Maritime Transportation Section, Tubarão Steel Company, Serra, Espírito Santo, Brazil;. Mr. Paulo Augusto Camello, Manager, Cabotage Operations Center, Aliança Navegação e Logística, Ltda., Rio de Janeiro, Rio de Janeiro, Brazil; Ms. Pedrita V. Castiglioni, Technical Adviser, Mideast Region, Mercosul Atlantic Corridor Consortium, Vitória, Espírito Santo, Brazil; Mr. Fábio Paes Daibert, Export Manager, USIMINAS, Belo Horizonte, Minas Gerais, Brazil; Mr. Marcelo Mares Esposito, Commercial Assistant, Atlântica Café, Santa Luzia, Minas Gerais, Brazil; Eng. João Arthur de Faria, Logistics Manager, USIMINAS, Belo Horizonte, Minas Gerais, Brazil; Eng. Wellington Izael Viana Fraga, Port of Vitória Manager, USIMINAS, Vitória, Espírito Santo, Brazil; Eng. Fernando Gazal, TRAINMAR Brasil, United Nations Conference on Trade and Development, Santos, São Paulo, Brazil; Mr. Thomas J. Heidt, Market Development Manager, Port of Houston Authority, Houston, Texas;
viii
Mr. Jan Hoffmann, Maritime Economist, Transportation Unit, Natural Resources and Infrastructure Division, United Nations Economic Commission for Latin America and the Caribbean, Santiago, Chile; Mr. Daniel Knelp, Finance Director, State of Espírito Santo Port Operators Sindicate, Vitória, Espírito Santo, Brazil; Mr. Rainer Lilienthal, General Manager, Trade Development, Port of Houston Authority, Houston, Texas; Mr. Cleber Cordeiro Lucas, Manager, Sales Department, Logistics Division, Companhia Vale do Rio Doce, Belo Horizonte, Minas Gerais, Brazil; Eng. Fernando Machado, Logistics Manager, USIMINAS, Belo Horizonte, Minas Gerais, Brazil; Capt. Alistair Macnab, President, Greater Houston Port Bureau, Houston, Texas; Ms. Charlotte McCanless, Bill Potts, Inc., Houston, Texas; Mr. José dos Santos Martins, Executive Director, State of Espírito Santo Port Operators Sindicate, Vitória, Espírito Santo, Brazil; Mr. Bob Moore, Assistant Vice President, Salzgitter International, Inc., Houston, Texas; Mr. Eamonn Mulchrone, Maurice Pincoffs Company, Inc., Houston, Texas; Mr. Alvanir De Nadai, General Coordinator, Serra Industrial and Multimodal Terminal (TIMS), Serra, Espírito Santo, Brazil; Mr. Roberto N. Nogueira, Business Manager, The Brazilian Chamber for International Trade, Belo Horizonte, Minas Gerais, Brazil; Mr. Carlos Eduardo Magirius Peixoto, Sales Executive, Tubarão Steel Company, Serra, Espírito Santo, Brazil; Mr. Sidney Rezende, International Trade, Transport and Financing Division, United Nations Economic Commission for Latin America and the Caribbean, Santiago, Chile; Mr. John F. Rydlund, Trade Development Manager, Steel, Projects and General Cargo, Turning Basin Terminals, Port of Houston Authority, Houston, Texas; Mr. Rogério Azevedo Schiavo, Commercial Adviser, Atlântica Café, Santa Luzia, Minas Gerais, Brazil; Mr. A.H. Sheffield, Coffee Sampler, Houston, Texas;

ix
Mr. José Moreira da Silva, President, Santos Commercial Association, Santos, São Paulo, Brazil; Ms. Flávia de Paula Silva, Marketing and Development, Logistics Division, Companhia Vale do Rio Doce, Vitória, Espírito Santo, Brazil; Mr. Carl J. Sobremisana, Maritime Transportation Specialist, U.S. Maritime Administration, Washington, D.C.; Eng. Sandra Maria Ferraz Stehling, Director of Operations, Mercosul Atlantic Corridor Consortium, Vitória, Espírito Santo, Brazil; Mr. Steve Stewart, President, Gulf Winds International, Houston, Texas; and, Eng. Paulo Augusto Vivacqua, President, Mercosul Atlantic Corridor Consortium, Vitória, Espírito Santo, Brazil.

x
xi
Executive Summary
Analyzing the economic and transportation impacts of U.S.-Latin American trade is becoming increasingly more important for transportation planners and policymakers. As Latin American democracies and economies are becoming more stable, transparent, and open, U.S. trade with Latin America is growing at higher rates than trade with other regions of the world. Moreover, since the Summit of the Americas in Quebec City, Canada in April 2001 established the year 2005 as a target for the conclusion of negotiations for a Free Trade Area of the Americas (FTAA), U.S.-Latin American trade has attracted growing political and business interest. Because of its geography and proximity to major production and consumption centers, the U.S. Southwest and its ports along the Gulf of Mexico currently send and receive much of the U.S.-Latin trade, sitting in a privileged position to capture future increased flows. This is placing, now and in the future, greater demands on the transportation system. With international trade theory emphasizing that economic growth depends on the extent to which regions can capitalize on their comparative advantages, the existence and operation of an efficient and effective transportation infrastructure becomes a necessary component of a region’s comparative advantage. In order to assess the effectiveness and efficiency of the transport infrastructure, this investigation addresses the economic and transportation impacts of U.S.-Latin American trade on the U.S. Southwest’s economy and transportation system.1 Over the years, economic and transport literatures have developed a diversity of techniques to measure impacts. The results have provided useful tools capable of estimating the impacts of trade, transportation, and new infrastructure on regional development. This aids in situating future transportation supply and demand across a multimodal infrastructure, comprising roads and highways, inland waterways and sea lanes, railroads, and air corridors. Theory underlying these studies has had practical applications in helping to determine whether or not new investment in transportation is warranted amid competing demands for public and private investment. Though current economic and transportation impact methodologies help decide whether or not to fund a project, possibly arriving at conclusions on how much to build, they do not investigate the transportation process itself. With a focus on measurement of aggregate demand, the current state-of-the-art does little to compute cumulative impacts along a set infrastructure; it does not reveal factors affecting transport both internal (e.g., congestion) and external (e.g., regulation) to the process. How these process factors affect the attitudes and decisions of transport users is also missing from formal impact analysis. National research programs that compute impacts from national accounts data overlook the questions of process, such as how freight moves, what it encounters, and how this affects a transportation system’s safety, reliability, effectiveness, and efficiency. To best capture impacts related to process, this study traces economic and transportation impacts at the shipment-level from origin to destination.
1 According to the U.S. Department of Transportation designation, the Southwest region refers to the five-state region comprising the states of Arizona, Louisiana, New Mexico, Oklahoma, and Texas.
xii
The Corridor as Unit of Analysis In order to follow a shipment and measure the economic and transportation impacts of U.S.-Latin American trade, this study adopts the trade corridor as the unit of analysis. A basic definition of a trade corridor is the geographical area over which significant amounts of trade flow from one territory to another. Transportation and logistics services are important components of a trade corridor. It is at this level of analysis where investigation addresses how trade actually takes place, requiring case studies of particular shipments, where one can assess what happens. This study applies case studies of coffee and steel exports from Latin America to the U.S. Southwest. It is only by tracing freight shipments along a trade corridor that cumulative impacts can be revealed. Choice of Case Study For purposes of analyzing the impacts of U.S.-Latin American trade, this report analyzes the waterborne trade between the two biggest trading partners in the region, the United States and Brazil. For the U.S. Southwest, to further narrow the study to a tractable size, the U.S. Gulf Port of Houston was selected as the U.S. port of entry/exit. The Port of Houston ranks second in the U.S. in terms of foreign tonnage and is the principal gateway to the U.S. Southwest from the Gulf Coast. In addition, the Port of Houston has carried out several economic impact studies dating back to the 1960s.2 For Brazil, the leading port of Santos was selected, having also been subject to economic impact analysis as Brazil’s most important and historic port for foreign trade.3 Though not directly comparable with the approach developed in this study, past studies serve as useful points of departure in situating local and regional impacts associated with U.S.-Latin American trade. This salience cannot be understated since the FTAA negotiations will take place primarily between U.S. and Brazilian negotiation teams. An analysis of Port of Houston trade data collected by the Port Import Export Reporting Service (PIERS) of the Journal of Commerce Group identified regionally significant commodities trading between Santos and Houston. A regionally significant commodity is consistently traded in sufficient quantity over time so that it generates measurable impacts on other business activity. Further analysis revealed that another Brazilian port, Vitória, along with Santos exported sizeable volumes of coffee and steel products to Houston. Because imported steel and coffee are processed and refined in further stages of production, they meet the test of “regionally significant.” Since these three ports handled both commodities, this study concentrated on the impacts of Brazilian coffee and steel exports through the ports of Santos and Vitória to the U.S. Southwest through the Port of Houston.
2 Warren Rose, Catalyst of an Economy: The Economic Impact of the Port of Houston 1958-1963 (Houston, Texas: Center for Research in Business and Economics, University of Houston, August 1965); Martin Associates, The Local and Regional Economic Impacts of the Port of Houston (Lancaster, Pennsylvania, March 29, 1999); and, Marilyn McAdams Sibley, The Port of Houston-A History (Austin, Texas: University of Texas Press, 1968). 3 Jose Ribeiro de Araujo Filho, Santos-O Porto do Café (Rio de Janeiro: Fundacao Instituto Brasileiro de Geografia, 1969).
xiii
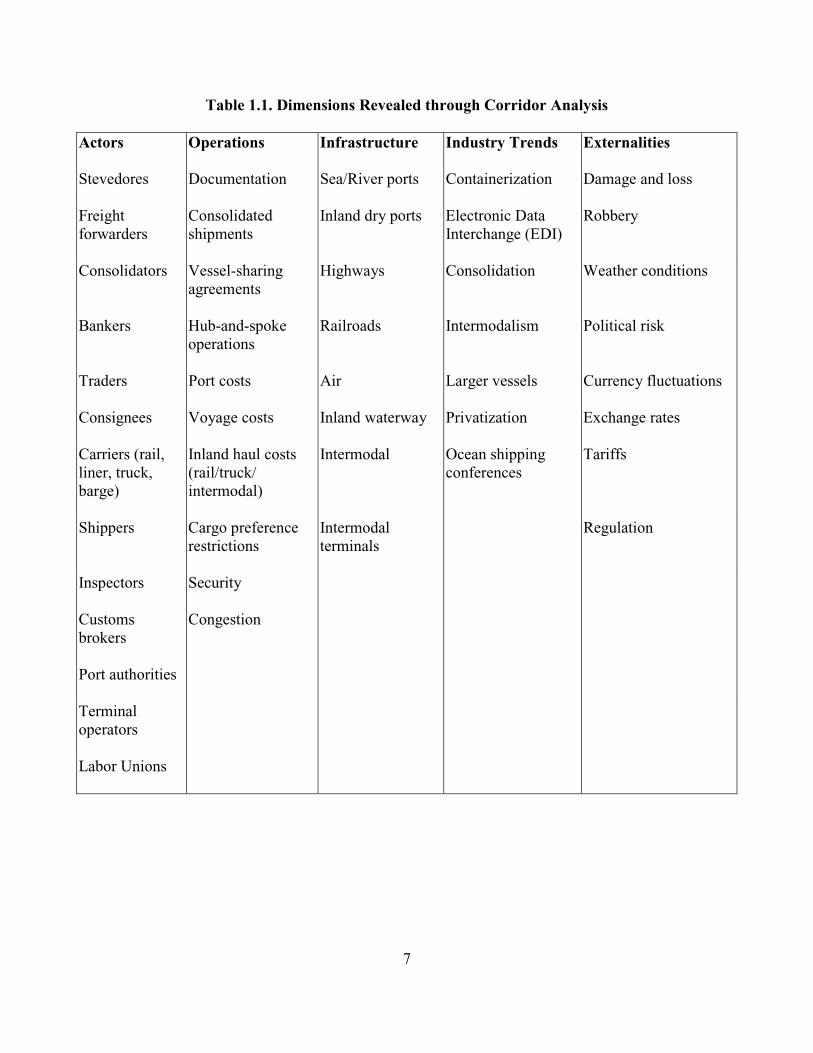
By focusing on imports, this research is a departure from conventional impact analysis based on exports. Imports were selected because of the dearth of information on the impact of imports on the U.S. economy and transportation system. Much of the transportation impact literature relies on multipliers of basic commodities, assuming an export origin. Economic base theory on which much early impact analysis was framed held that transportation demand was derived from, among other things, a region’s freight flow from production centers to markets.4 For discerning international trade impacts, this leads to an export-oriented framework for among other reasons, the availability of data. Such theory overlooked attributes specific to a transportation process, such as volume, capacity, transshipment, speed, time etc. Applying a typology elaborated by Yin,5 the case studies selected are both descriptive and explanatory, following the carriage of coffee and steel from Brazilian ports of Santos and Vitória to the U.S. Southwest through the Port of Houston. Coffee and steel were selected because of their economic significance. Coffee and steel arrive as both finished products and raw materials for an American cycle of transformation and distribution. Their impacts expand throughout the economy. Both coffee and steel have differential impacts in the market place and in their use of transportation. The use of multiple case studies, therefore, will elicit a more comprehensive set of attributes and impacts of trade along a given U.S.-Latin American corridor. This logic can be replicated and extended to other Latin American countries and U.S. regions. These case studies describe and explain the impacts of trade on the transport system. The Results Figures A and B summarize the economic impacts of our case study shipments of coffee and steel. Tracing the carriage of freight from origin to destination reveals several dimensions that had been previously neglected in conventional economic impact analysis. Table A reproduces table 1.1 from chapter 1 of the report, introducing some of the areas where a corridor-based approach may be informative, detailing the non-quantitative yet policy-relevant impacts. A discussion of these elements is presented in the report, drawing from real life examples of the case studies of coffee and steel and, specifically, the shipments traced.
4 Gerald Kraft, John R. Meyer, and Jean-Paul Valette, The Role of Transportation in Regional Economic Development (Lexington, Massachusetts: Lexington, 1971), pp. 8-9. 5 Robert K. Yin, “The Role of Theory in Doing Case Studies,” in Applications of Case Study Research (Applied Social Research Methods Series, vol. 34, 1994), p. 5.

xiv
Figure A. Shipment Level Impacts along the U.S.-Brazil Coffee Corridor for the Year 2000/01
Sources: Port of Vitória Collective Bargaining Agreement (Convenção Coletiva de Trabalho), Vitória, Espírito Santo, April 22, 1999; “USA Tariffs,” Libra web site, available at: www.libra.com.br, cited April 22, 2002; Email from Marcelo Mares Esposito, Sales Manager, Café Atlântica, Belo Horizonte, Minas Gerais, “Survey Questionnaire,” to John Cuttino, May 29, 2002.
Stage 1: By hand, coffee is harvested in eastern Minas Gerais highlands (Serra do Caparão) and transported to a central drying patio at the fazenda. The harvest, which produced this shipment, yielded 2,038 60-kilogram sacks. Small trucks and pickup trucks used to transport the harvest to the drying patio. Average drying period is 19 days.
Stage 2: After drying, coffee cherries are bagged in 60-kg sacks and trucked from several fazendas no farther than 35 km to a processing center at Manhuaçu, Minas Gerais, 250 km from Vitória. Coffee sacks are emptied into a pile with coffees of similar quality. In an automated process, coffee beans are separated from the cherries, washed, blended, and rebagged into 60-kg sacks.
Stage 3: Three-hundred twenty 60-kg sacks are transported to Vitória along with an additional order of 640 sacks in a convoy of 2 trucks, 1 trailer, and an escort guard. Labor includes three truck drivers and two escort guards. Transport covers a distance of 250 km in five hours at a speed of 50 km per hour over steep and mountainous terrain on BR-262.
Stage 4: Arrival at container stuffing terminal and warehouse on premises of Port Authority of Espírito Santo. 320 sacks filled into one container and sent by intraport rail link to container terminal to be loaded on Libra Buenos Aires. Labor: A team of 4 laborers and a foreman stuff container. Paid by production, each laborer earns R$34.78 per day plus R$0.23 per bag. Costs: Stuffing- R$11.59 per ton. For 19.2 ton shipment- R$222.53 or $130.
Port of Vitória-based Activity
Brazilian Inland-based Activity
Stage 5: Loading from yard to ship on Libra Buenos Aires. Labor: One team of longshoreman move containers in port. Stevedores load container onto ship. Costs: Crane moves- R$27.73, intraport forklift move- R$8.41, transteiner move- R$12.62. Three moves total R$48.76 or $28.68 plus terminal handling charge.
Stage 6: Maritime Transport to the Port of Houston- Libra Beunos Aires departs TVV on July 4, 2000 with a duration of 13 days. Costs: $1850 freight charge of Libra tariff for container from Vitória to Houston. Voyage from Vitória follows route Puerto Cabello, Venezuela, Veracruz, Mexico, Altamira, Mexico, Houston, Texas, and New Orleans, Louisiana.
Total Brazil Outbound Economic/Transportation Impacts: Stage 1: Labor costs estimated at R$48 per sack, transport costs- 63 centavos per sack. Stage 2: Transport costs estimated at 30 centavos per sack. Processing costs amount to R$3 per sack. Stage 3: Over the road freight charges including insurance and security cost R$1.62 per bag. Stage 4: Container stuffing costs $130. Stage 5: Handling costs $28.68 plus terminal handling charge. Stage 6: Ocean freight charges estimated at $1,850 for transport from Vitória to Houston.

xv
Figure A, continued
Sources: Interview by John Cuttino with Carlos de Aldecoa, President, CADECO, Houston, Texas, February 25, 2002; Telephone interview by John Cuttino with Capt. Alistair Macnab, Executive Secretary, Greater Houston Coffee Association, Houston, Texas, June 20, 2002; Greater Houston Coffee Association, Transportation Module, Houston, Texas, August 14, 2001; and Marine Exchange of the West Gulf, “July 2000 Vessel Log,” Houston, Texas.
Stage 7: Arrival of the Libra Buenos Aires at the Port of Houston at 6:45 am Monday, July 17, 2000. Ship unloading container at Barbour’s Cut Berth #2, stevedores unload container to terminal yard, intraport move to storage area. Costs: TEU move- $185, inbound handling- $24.80, wharfage- $55.10 Ship-to-shore gantry crane for unloading move, intraport forklift move to storage area.
Total U.S. Inbound Economic/Transportation Impacts: Costs for a TEU move, $185; inbound handling, $24.80; wharfage, $55.10. Ship-to-shore gantry crane for unloading move, intraport forklift move to storage area.
Stage 8: Processing at Port of Houston- awaiting clearances and documentation for U.S. Food and Drug Administration, U.S. Department of Agriculture, Customs, and sampling. Labor involves partial involvement of one freight forwarder/customs house broker to facilitate documentation. One sampler enters port terminal area to extract coffee sample for testing at out-of-state laboratory. Costs include USDA and FDA charges of $10-$25 per TEU, Customs entry $75-$150 per TEU, and $12 per sample plus airfreight. Further activities involve notification of client, transportation of documents, electronic data interchange for exchange of documents, letters of credit, clearances etc.
Port of Houston-based Activity
Stage 9: Activity: Drayage from port terminal to CADECO bonded warehouse, unloading of sacks at warehouse. 320-60 kg sacks are unloaded from container and stacked on pallets inside warehouse. Labor: One trucker, two laborers to unload, one forklift operator to move sacks Costs: $100-$225 per TEU Transportation Consumed: One container on one truck travels 25 miles from Barbour’s Cut to CADECO warehouse for storage.
Stage 10: Drayage to roaster, loading of truck, delivery to Kraft.
United States Inland-based Activity

xvi
Figure B. Shipment Level Impacts along the U.S.-Brazil Steel Corridor for the Year 2001
Stage 1: Production of steel coil. Production requires arrival of inputs (coke, coal, iron ore) via Vitória-Minas Railway (Estrada de Ferro Vitória-Minas, EFVM) from Minas Gerais mining regions and port of Tubarão. Mill is located between inland sources of iron ore and port of Tubarão, supplying foreign import inputs.
Stage 2: Loading of 95 steel coil to EFVM rail cars. Attachment to standard general cargo train operated by Companhia Vale do Rio Doce (CVRD). Steel coils load at Independente Camara Terminal at km 436. Railcars fitted to carry approximately 6-9 coils. Shipment of 95 flat rolled steel coils totals 880.7 metric tons.
Stage 3: Consolidation of rail shipments and transport from km 436 to km 30, location of Praia Mole Steel Products Terminal. Train comprises 120 railcars, using two 2,700 horsepower diesel electric locomotives.
Stage 4: Arrival at Port of Tubarão’s Praia Mole Steel Products Terminal. Praia Mole operates 24/7/365. Storage yard has capacity for 900,000 tons. Exporting berths accommodate two vessels of 70,000 DWT or three vessels of 37,000 DWT. Cranage includes five cranes with 42 metric ton capacity and three cranes with 25 metric ton capacity. Shipment of 95 coils is consolidated with other shipments from Belgo Mineira and Açominas, totalling 3,866 metric tons.
Port of Vitória-based Activity
Brazilian Inland-based Activity
Stage 5: Steel loaded aboard TBS Latin America Lines’ Comanche Belle. Stevedoring services undertaken by Companhia Vale do Rio Doce.
Stage 6: Maritime transport to Houston from Praia Mole Steel Products Terminal adjacent to port of Tubarão. TBS Latin America Lines’ Comanche Belle departs on March 11, 2001. Bill of Lading processed on March 17, 2001.
Total Brazil Outbound Economic/Transportation Impacts: Shipment was sold on a basis of cost and freight (CFR) named port of shipment, Praia Mole. The ocean freight charge for this shipment was $24 per metric ton or $21,136.80.
xvii
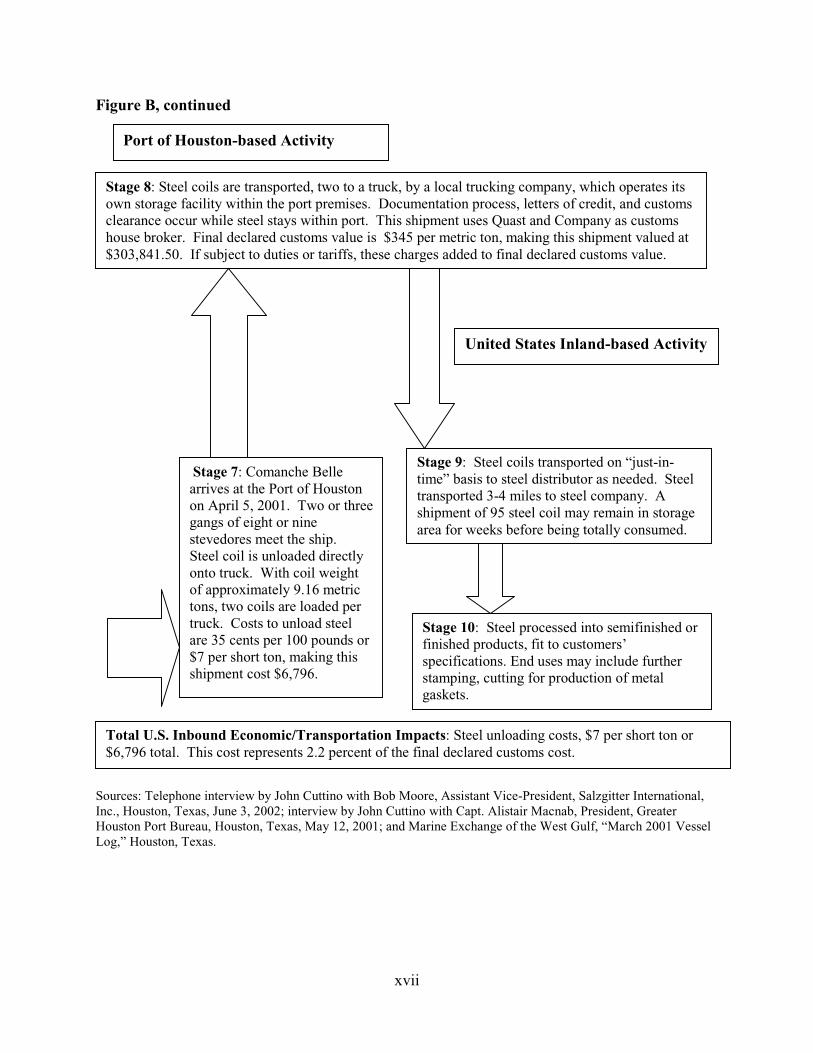
Figure B, continued
Sources: Telephone interview by John Cuttino with Bob Moore, Assistant Vice-President, Salzgitter International, Inc., Houston, Texas, June 3, 2002; interview by John Cuttino with Capt. Alistair Macnab, President, Greater Houston Port Bureau, Houston, Texas, May 12, 2001; and Marine Exchange of the West Gulf, “March 2001 Vessel Log,” Houston, Texas.
Stage 7: Comanche Belle arrives at the Port of Houston on April 5, 2001. Two or threegangs of eight or nine stevedores meet the ship. Steel coil is unloaded directly onto truck. With coil weight of approximately 9.16 metric tons, two coils are loaded per truck. Costs to unload steel are 35 cents per 100 pounds or $7 per short ton, making this shipment cost $6,796.
Total U.S. Inbound Economic/Transportation Impacts: Steel unloading costs, $7 per short ton or $6,796 total. This cost represents 2.2 percent of the final declared customs cost.
Stage 8: Steel coils are transported, two to a truck, by a local trucking company, which operates its own storage facility within the port premises. Documentation process, letters of credit, and customs clearance occur while steel stays within port. This shipment uses Quast and Company as customs house broker. Final declared customs value is $345 per metric ton, making this shipment valued at $303,841.50. If subject to duties or tariffs, these charges added to final declared customs value.
Port of Houston-based Activity
Stage 9: Steel coils transported on “just-in-time” basis to steel distributor as needed. Steel transported 3-4 miles to steel company. A shipment of 95 steel coil may remain in storage area for weeks before being totally consumed.
Stage 10: Steel processed into semifinished or finished products, fit to customers’ specifications. End uses may include further stamping, cutting for production of metal gaskets.
United States Inland-based Activity
xviii
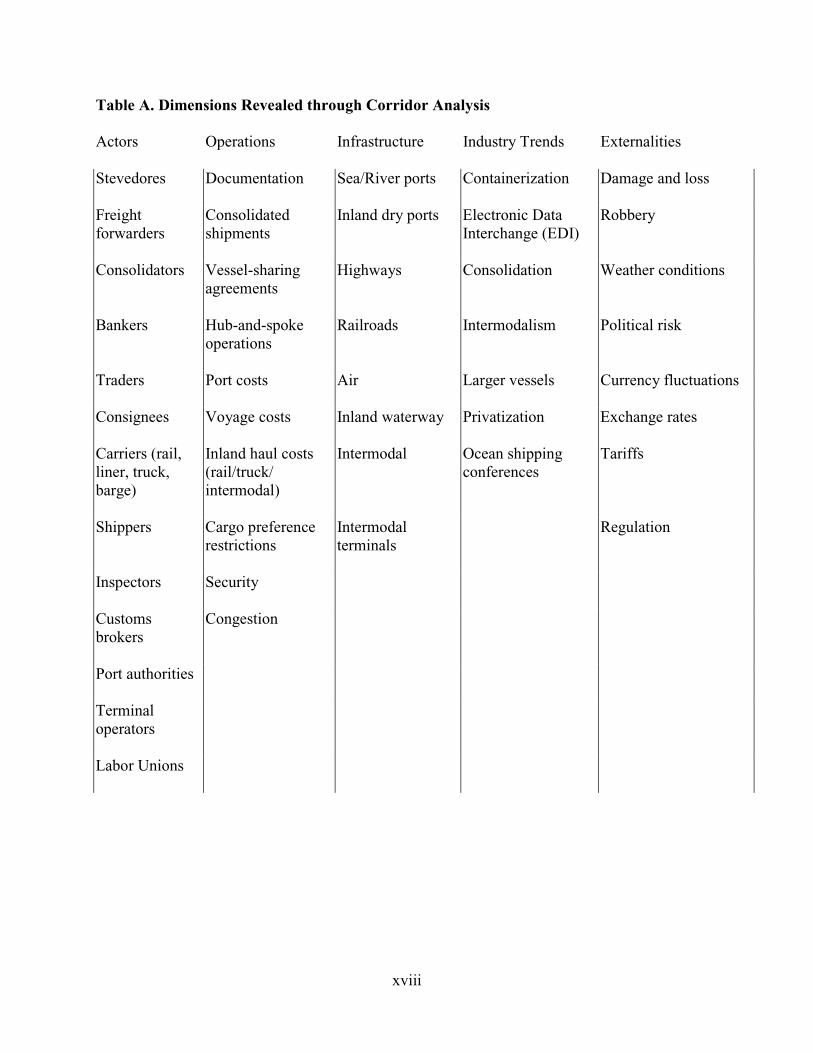
Table A. Dimensions Revealed through Corridor Analysis Actors Operations Infrastructure Industry Trends Externalities
Stevedores Documentation
Sea/River ports Containerization Damage and loss
Freight forwarders
Consolidated shipments
Inland dry ports Electronic Data Interchange (EDI)
Robbery
Consolidators Vessel-sharing agreements
Highways Consolidation Weather conditions
Bankers Hub-and-spoke operations
Railroads Intermodalism Political risk
Traders Port costs
Air Larger vessels Currency fluctuations
Consignees Voyage costs
Inland waterway Privatization Exchange rates
Carriers (rail, liner, truck, barge)
Inland haul costs (rail/truck/ intermodal)
Intermodal Ocean shipping conferences
Tariffs
Shippers Cargo preference restrictions
Intermodal terminals
Regulation
Inspectors Security
Customs brokers
Congestion
Port authorities
Terminal operators
Labor Unions

xix
Table of Contents
Chapter 1. Introduction to Economic and Transportation Impact Analysis ........................1
Ports as Gateways for Addressing Foreign Trade ...........................................................2 Firms not Nations Compete.............................................................................................3 The Corridor as Unit of Analysis ....................................................................................3 Logistics...........................................................................................................................4 Logistics within Transportation Corridors ......................................................................5 Trade Corridors versus Transportation Corridors ...........................................................6 Choice of Case Study ....................................................................................................11 Data Requirements ........................................................................................................12 Structure of the Study ....................................................................................................13
Chapter 2. The Coffee Commodity Chain and U.S./Brazilian Trade................................15
Characteristics of the Global Coffee Trade ...................................................................15 The Transport and Handling of Coffee..........................................................................17 U.S.-Brazilian Coffee Trade..........................................................................................19 Coffee Ports of Entry.....................................................................................................22 Note on Transshipment..................................................................................................25 The Port of Houston’s Sphere of Influence ...................................................................25 Summing Up..................................................................................................................26
Chapter 3. Coffee from Brazil to Houston ........................................................................29
Brazilian Coffee Exports from Santos and Vitória to Houston .....................................30 Coffee Transport to Exporting Port ...............................................................................32 Port Operations at Vitória and Santos ...........................................................................34 Vitória............................................................................................................................37 Maritime Freight Costs from Vitória to Houston ..........................................................38 Santos.............................................................................................................................39 Port Costs.......................................................................................................................40 Maritime Freights from Santos to Houston ...................................................................41 Coffee Arrival at Houston .............................................................................................41 Transport to Local Roasters in Houston ........................................................................43 The Coffee Corridor ......................................................................................................43 Tracing a Specific Coffee Shipment..............................................................................43 From Harvest to Mill .....................................................................................................44 Inland Transport to Port.................................................................................................44 Arrival at Port and Port-related Activity .......................................................................45 Waterborne Transport from Vitória to Houston ............................................................45 Arrival at the Port of Houston Barbour’s Cut Terminal................................................47 Drayage from Barbour’s Cut to the Intermediate Warehouse Facility..........................47 Roasting at Kraft............................................................................................................48

xx
Conclusions and Intangibles along the Coffee Corridor ...............................................48
Chapter 4. The Steel Commodity Chain and U.S./Brazilian Trade..................................51
Characteristics of the Global Steel Trade ......................................................................51 Brazilian Steel Sector ....................................................................................................53 Transport and Handling of Steel....................................................................................56 Steel Ports of Entry........................................................................................................60 The Sec. 201 Investigation and President George W. Bush’s Final Determinations ....62 Impact of Sec. 201 Final Determinations on U.S.-Brazilian Trade...............................64
Chapter 5. Steel Trade from Brazil to Houston .................................................................67
GEARBULK Shipping ..................................................................................................69 Tracing a Steel Shipment from Vitória to Houston.......................................................70 Arrival in Houston .........................................................................................................71 Costs ..............................................................................................................................72 Impact of U.S. Protectionism ........................................................................................72 The Economic Impact of Steel in Houston....................................................................73 Steel Corridor Conclusions............................................................................................74
Chapter 6. Cumulative Economic Impacts of International Trade ....................................75
The Results ....................................................................................................................77 Actors.............................................................................................................................83 Operations......................................................................................................................84 Infrastructure .................................................................................................................86 Externalities ...................................................................................................................87 Directions for Further Research ....................................................................................88
Appendix A. U.S. Steel Policy and Implications on U.S.-Brazilian Steel Trade ..............89
Appendix B. Economic Impacts of One TEU for Texas Region (MARAD Port Economic Impact Kit).................................................................101
Appendix C. Economic Impacts of Steel Shipment for Texas Region (MARAD Port Economic Impact Kit).................................................................109
Select Bibliography .........................................................................................................117
xxi
List of Tables
Table 1.1. Dimensions Revealed through Corridor Analysis ..............................................7
Table 1.2. Components of a Transportation Corridor .........................................................8
Table 2.1. Transporting Green Coffee...............................................................................18
Table 2.2. Selected Countries’ Share of U.S. Green Coffee Imports (%) .........................19
Table 2.3. Brazilian Coffee Production in Million 60-kg Bags (July-June)*....................20
Table 2.4. Coffee Spheres of Influence (Inland Destinations) ..........................................26
Table 3.1. 1999 Brazilian Coffee Exports to the United States (60-kg sacks) ..................30
Table 3.2. Houston Coffee Imports from Brazil and Colombia ........................................31
Table 3.3. Market Share of Houston Coffee Imports (% of total).....................................31
Table 3.4. Houston Coffee Imports from Vitória and Santos............................................32
Table 3.5. Santos and Vitória Container Price Comparison (US$) ...................................40
Table 3.6. Logistics Costs (1997)......................................................................................41
Table 4.1. U.S. Steel Imports by Source Country in terms of Quantity (short tons).........52
Table 4.2. U.S. Steel Imports by Source Country in terms of Value (thousands of dollars) ............................................................................................52
Table 4.3. World and Brazilian Crude Steel Production (millions of metric tons) ...........53
Table 4.4. Active Brazilian Labor Force Employed in Steel Activities ............................54
Table 4.5 Brazilian Steel Industry .....................................................................................55
Table 4.6. CST Export Market Distribution (%) ...............................................................56
Table 4.7. Cargoes Transported on EFVM (thousands of metric tons).............................57
Table 4.8. 1998 Brazilian Steel Production by State.........................................................59
Table 4.9. U.S. Imports of Steel by Port (HTS #72-millions of metric tons)....................61
Table 4.10. U.S. Iron and Steel Products Imports by Port (HTS #73-millions of metric tons) ........................................................................62
Table 4.11. 2000 U.S. Steel Imports and ITC Suggested Remedy....................................63
Table 4.12. President Bush’s Sec. 201 Final Determinations on Steel Imports ................64

xxii
Table 4.13. U.S. Tariff Rate Quota for Slabs (kilograms).................................................65
Table 4.14. U.S. Steel Imports from Brazil (short tons)....................................................66
Table 5.1. Houston Imports from Brazil (millions of dollars)...........................................68
Table 5.2. U.S. Iron/Steel Imports from Brazil via Houston (HTS#72)...........................68
Table 5.3. U.S. Iron/Steel Products Imports from Brazil via Houston (HTS#73).............68
Table 5.4. GEARBULK Steel Shipments from Praia Mole to Houston (2000)................70
Table 6.1. Dimensions Revealed through Corridor Analysis ............................................82
Table A.1. Iron & Steel Antidumping (AD) and Countervailing Duty (CVD) Petitions as Share of Total AD and CVD Petitions .............................................................90
Table A.2. U.S. and Brazil Prices of Hot-Rolled Steel Per Ton (US$).............................94
xxiii
List of Figures
Figure 2.1. The Coffee Commodity Chain ........................................................................16
Figure 2.2. Map of Brazil .................................................................................................21
Figure 2.3. Average New York Price of Brazilian Robusta Green Coffee (cents per pound) ...................................................................................................23
Figure 2.4. U.S. Green Coffee Imports from Brazil ..........................................................24
Figure 3.1. Brazilian Interstate Highway Network Serving Coffee Transport..................35
Figure 3.2. Transport Route of Sample Coffee Shipment .................................................46
Figure 4.1. Minas Gerais to Vitória Steel Export Corridors..............................................58
Figure 5.1. Transport Route of Sample Steel Shipment ....................................................71
Figure 6.1. Shipment Level Impacts along the U.S.-Brazil Coffee Corridor for the Year 2000/01..............................................................................................78
Figure 6.2. Shipment Level Impacts along the U.S.-Brazil Steel Corridor for the Year 2001 .......................................................................................................................80
Figure A.1. Brazilian Steel Imports to the United States ..................................................93

xxiv

1
Chapter 1. Introduction to Economic and Transportation Impact Analysis
Analyzing the economic and transportation impacts of U.S.-Latin American trade is becoming increasingly more important for transportation planners and policymakers. As Latin American democracies and economies are becoming more stable, transparent, and open, U.S. trade with Latin America is growing at higher rates than trade with other regions of the world. Moreover, since the Summit of the Americas in Quebec City, Canada in April 2001 established the year 2005 as a target for the conclusion of negotiations for a Free Trade Area of the Americas (FTAA), U.S.-Latin American trade has attracted growing political and business interest. Because of its geography and proximity to major production and consumption centers, the U.S. Southwest and its ports along the Gulf of Mexico currently send and receive much of the U.S.-Latin trade, sitting in a privileged position to capture future increased flows. This is placing, now and in the future, greater demands on the transportation system. With international trade theory emphasizing that economic growth depends on the extent to which regions can capitalize on their comparative advantages, the existence and operation of an efficient and effective transportation infrastructure becomes a necessary component of a region’s comparative advantage. In order to assess the effectiveness and efficiency of the transport infrastructure, this investigation addresses the economic and transportation impacts of U.S.-Latin American trade on the U.S. Southwest’s economy and transportation system.6 Over the years, economic and transport literatures have developed a diversity of techniques to measure impacts. The results have provided useful tools capable of estimating the impacts of trade, transportation, and new infrastructure on regional development. This aids in situating future transportation supply and demand across a multimodal infrastructure, comprising roads and highways, inland waterways and sea lanes, railroads, and air corridors. Theory underlying these studies has had practical applications in helping to determine whether or not new investment in transportation is warranted amid competing demands for public and private investment. Though current economic and transportation impact methodologies help decide whether or not to fund a project, possibly arriving at conclusions on how much to build, they do not investigate the transportation process itself. With a focus on measurement of aggregate demand, the current state-of-the-art does little to compute cumulative impacts along a set infrastructure; it does not reveal factors affecting transport both internal (e.g., congestion) and external (e.g., regulation) to the process. How these process factors affect the attitudes and decisions of transport users is also missing from formal impact analysis. National research programs that compute impacts from national accounts data overlook the questions of process, such as how freight moves, what it encounters, and how this affects a transportation system’s safety, reliability, effectiveness, and efficiency.
6 According to the U.S. Department of Transportation designation, the Southwest region refers to the five-state region comprising the states of Arizona, Louisiana, New Mexico, Oklahoma, and Texas.

2
Ports as Gateways for Addressing Foreign Trade For international waterborne commerce, seaports are the natural gateways of foreign trade. Port impact studies have emerged as an area of applied research that can bridge trade with wider regional economic impacts.7 Port impact studies concentrate on measuring a port’s direct, indirect, and induced impacts of port activity. Traditionally, port impact studies use direct surveys of port communities and rely on national accounting systems for calculating trade volumes, industry purchases and sales, and industry employment, coded by the Standard Industrial Classification Code (SIC) and the Standard Transportation Commodity Code (STCC). However, a major limitation for the purposes of analyzing the impact of foreign trade lies in the generic nature of the input-output system of measurement, which uses sectoral multipliers among industries or commodities to produce general impacts that hold little information on the transportation process. Port impact studies generate impacts in terms of jobs, regional output, taxes paid to the government, investment, and commodity flows. The port impact methodology that may most effectively capture impacts of international trade is that derived by Barney Warf and Joseph Cox. 8 Applied to the Port of New York/New Jersey, Warf and Cox applied a commodity-based port impact model to measure the total change in economic activity at a port deriving from changes in the port’s cargo volume and commodity mix, using an 89-sector input-output model for estimating impacts of 225 commodities in three sectors (bulk, breakbulk, and containerized). With Latin America cargo volumes and values as input data, this modeling system could be used to show the demand for labor, materials, and vessels that Latin American imports/exports have on U.S. ports. Latin American data related to the quantity and quality of trade in bulk, breakbulk, and container categories are available. However, with just three sectors of directly collected data, the method relies on U.S. Bureau of Census Regional Input-Output Modeling Service tables for an additional 86 industrial sectors in order to compute regional economic impacts. Because the directly collected data generalizes a specific commodity’s impact to bulk, breakbulk, and containerized categories, this methodology does not reveal the differential impacts that a diverse commodity mix may have on a regional economy. Though ports are the natural gateways for understanding regional trade impacts, the current methodologies are not equipped to understand the process of trade and transportation. A different level of analysis is required, one that shifts scrutiny from economic impacts to an understanding of process.
7 For a review of port impact studies, their methodologies and limitations, see Leigh B. Boske and John Cuttino, The Impacts of U.S.-Latin American Trade on the Southwest’s Economy and Transportation System: An Assessment of Impact Methodologies (Austin, Texas: Lyndon B. Johnson School of Public Affairs, The University of Texas at Austin, 2001). Key citations in the port impact studies literature are included in the select bibliography. 8 Barney Warf and Joseph Cox in “The changing economic impacts of the port of New York,” Maritime Policy and Management, vol. 16, no. 1 (1989).

3
Firms not Nations Compete Michael Porter’s insight that “firms, not nations, compete in international markets,” shifts analysis away from aggregate impacts and toward a study of the firm and how trade takes place along a commodity’s supply chain.9 A focus on process aids policymakers inasmuch as it helps to determine what makes firms successful in foreign trade. The delineation of firm impacts does more to reveal the role of transportation than impacts aggregated to the level of industry sector. In his work on firm competitiveness, Porter maintains that “competitive advantage is created and sustained through a highly localized process. Differences in national economic structure, values, cultures, institutions, and histories contribute profoundly to competitive success.”10 For Porter, analysis of firm competitiveness requires a focus on specific industry and industry segments. In the spirit of Porter, it is the story of the trading process that is important in determining cumulative transportation and economic impacts; this leads to a departure from location-specific methodologies to one that views trade through a dynamic process along a firm’s supply chain. The result is a shift from aggregate demand to individual firm demand and its output, the shipment of freight. Clearly, the business literature is adapting to rapid change in processes of technological diffusion and globalization. Logistics and supply chain management have emerged from origins in business consulting to take on added academic importance as the construct of logistics and supply chains helps to frame analysis of trade and competitiveness. 11 Applied to an analysis of the impacts of transport and trade, it follows that the firm and how it ships freight underlie the study of process. The Corridor as Unit of Analysis In order to follow a shipment and measure the economic and transportation impacts of U.S.-Latin American trade, this study adopts the trade corridor as the unit of analysis. A basic definition of a trade corridor is the geographical area over which significant amounts of trade flow from one territory to another. Transportation and logistics services are important components of a trade corridor. It is at this level of analysis where investigation addresses how trade actually takes place, requiring case studies of particular shipments, where one can assess what happens. This study applies case studies of coffee and steel exports from Latin America to the U.S. Southwest. It is only by tracing freight shipments along a trade corridor that cumulative impacts can be revealed. Before a trade corridor can be understood, it is necessary to understand the logistics framework within which trade occurs. A trade corridor possesses a distinct logistics network.
9 Michael E. Porter, The Competitive Advantage of Nations (New York: The Free Press, 1990), p. 33. 10 Ibid., p. 19. 11 For the state of the art in the academic literature, see Handbook of Logistics and Supply Chain Management, A.M Brewer, K.J. Button and D.A. Hensher eds. (New York: Pergamon Press, 2001).

4
Logistics The logistics of freight movements cover a variety of actors and processes necessary to move raw materials, transport them through transformation into intermediate and final goods when required, and deliver them through a distribution network to the final consumer.12 In business, logistics entails “the managerial responsibility to design and administer a system to control the flow and strategic storage of materials, parts, and finished inventory to the maximum benefit of the enterprise.”13 Donald Wood and Anthony Barone identify a comprehensive logistics framework to include the following: • Customer service
• Demand forecasting
• Documentation flow
• Handling returns
• Inter-plant movements
• Inventory management
• Parts/service support
• Materials handling
• Order processing
• Plant-warehouse site selection
• Production scheduling
• Protective packaging
• Purchasing
• Salvage scrap disposal
• Traffic management
12 The Council of Logistics Management operationally defines logistics as “that part of the supply chain process that plans, implements, and controls the efficient, effective forward and reverse flow and storage of goods, services, and related information between the point of origin and the point of consumption in order to meet customers’ requirements,” Council of Logistics Management web site, available at: www.clm1.org/about/purpose.asp, cited November 10, 2001. 13 Kenneth C. Williamson, Daniel M. Spitzer Jr., and David J. Bloomberg, "Modern logistics systems: Theory and practice," Journal of Business Logistics, vol. 11, no. 2, 1990, p. 67.

5
• Warehouse and distribution center management14
Within a logistics system, an understanding of traffic management brings clearer understanding of economic and transportation impacts of international trade. Traffic management focuses on “freight consolidation, carrier rates and charges, carrier selection, certain documentation, tracing and expediting, loss and damage claims, demurrage and detention, movement of hazardous materials, employee-moving services, and use of private carriage.”15 A successful logistics network, thus trading system, necessarily relies on transportation corridors that offer a broad variety of services. These transport corridors leading to and from economic markets are attractors for determining the extent to which trade will take place. Logistics within Transportation Corridors A transportation corridor helps to delimit the services that drive logistics, transportation, trade and, hence, their impacts on the economy. Extending a logistics framework to the U.S-Latin American trade corridor demonstrates that trade requires a multiplicity of value-added services as a precondition. Introduced by Porter as the value-chain concept, analysis of these value-added services can benefit from a disaggregated identification of “relevant value activities…with discrete technologies and economics.”16 Value is added along a firm’s logistics network as profits accrue from successive points in the production chain. Porter identifies the following five general logistics activities: • Inbound logistics (receiving, storing and disseminating inputs to the product, i.e., materials
handling, warehousing, inventory control, vehicles scheduling, and returns to suppliers);
• Operations (transforming inputs into final goods, machining, packaging, assembly, etc.);
• Outbound logistics (collecting, storing, physically distributing product to buyers);
• Marketing and sales; and,
• Service.17
Transportation and traffic management play fundamental roles in a firm’s logistics, taking place principally in the inbound and outbound logistics stages. The benefits of cumulative impacts of trade and transport are seen as they accrue from the services within a logistics system that comprise not one but many firms. Knowing what these services and service levels are presents strategic information, vital for the efficient functioning of trade corridors. The evolving concepts of the trade and transportation corridor present a good point of departure for analyzing economic impacts of trade. Such an approach can best capture the wide array of issues, actors, and factors influencing trade and 14 Donald F. Wood, Anthony Barone et al., International Logistics (Boston: Kluwer Academic Press, 1995), p. 4. 15 Ibid., p. 217. 16 Michael E. Porter, Competitive Advantage: Creating and Sustaining Superior Performance (New York: Free Press, 1998), pp. 45-48. 17 Ibid., pp. 39-40.

6
transportation. Table 1.1 presents dimensions revealed from a trade corridor analysis of international waterborne commerce between the United States and Latin America. Trade Corridors versus Transportation Corridors Trade and transportation corridors possess various attributes with the distinguishing characteristic that transportation corridors are features of a trade corridor. While trade necessarily takes place along transportation corridors, trade corridors cover a broad geographical area with a variety of services and linkages to labor, capital, and production. Various definitions exist that wrongly equate a trade corridor with a transportation corridor. A transportation corridor may or may not carry regionally significant trade. As stated earlier, a trade corridor can be defined as a geographical area over which significant amounts of trade flow. Such an area has a set of physical and operating characteristics that facilitate “the national and transnational movement of goods, services, people, and information.”18 They include: • A commercial infrastructure comprising distribution and warehousing facilities, foreign trade
zones, a regulatory system for customs and inspection, and trade incentives;
• An integrated regional technological infrastructure with electronic data interchange and trade databases;
• Business and professional know-how and expertise, including custom brokers, freight forwarders, accountants, attorneys, consultants, and academicians;
• Well-developed social, political, and business linkages;
• A physical infrastructure of highways, rail, air, sea, and inland waterway;
• Direct access to multiple markets;19 and,
• Specific legislation and regulations.
A transportation corridor is a route along which trade travels. It is based on geography and traffic flows comprising the links, nodes, and transfer points, which serve outbound and inbound movements. It can be a right-of-way on the surface, air, or subsurface set apart to accommodate major multimodal transportation facilities. It includes arteries that connect truck, rail, sea, and inland waterway via roads and highways, rail lines, air facilities, ports, and waterways. Table 1.2 gives a partial listing of components of a transportation corridor. In and of themselves, transportation corridors do not add value, but their interaction with the adoption of just-in-time (JIT) production and distribution make an efficient transportation corridor an asset and a principal component of a firm's logistics matrix and a region’s comparative advantage. In this sense, a firm's value can be affected by its location along efficiently functioning transport corridors.
18 Wilbur Smith Associates, The CANAMEX Trade Corridor: Economic Opportunities Associated with Transportation Improvements (Columbia, South Carolina, December 1998), p. 1-1. 19 Ibid., p. 1-2.
7
Table 1.1. Dimensions Revealed through Corridor Analysis
Actors Operations Infrastructure Industry Trends Externalities
Stevedores Documentation
Sea/River ports Containerization Damage and loss
Freight forwarders
Consolidated shipments
Inland dry ports Electronic Data Interchange (EDI)
Robbery
Consolidators Vessel-sharing agreements
Highways Consolidation Weather conditions
Bankers Hub-and-spoke operations
Railroads Intermodalism Political risk
Traders Port costs
Air Larger vessels Currency fluctuations
Consignees Voyage costs
Inland waterway Privatization Exchange rates
Carriers (rail, liner, truck, barge)
Inland haul costs (rail/truck/ intermodal)
Intermodal Ocean shipping conferences
Tariffs
Shippers Cargo preference restrictions
Intermodal terminals
Regulation
Inspectors Security
Customs brokers
Congestion
Port authorities
Terminal operators
Labor Unions

8
Table 1.2. Components of a Transportation Corridor
Land Air Water
Motor carriers Airports Marine vessels Railroads/railyards Aviation facilities Barges Warehouses Airplanes Rivers and seas Trucks/truck terminals Ports Intermodal terminals Highways and Roads
Transportation corridors function more effectively for trade if they: • Connect significant end points such as major urban centers, intermodal facilities like ports,
and major commodity producing regions;
• Cover wide areas spatially (hundreds of miles) through which freight is transported;
• Do not rely on one mode such as road or rail and include a multimodal range with access to main highways, rivers, sea lanes, trunk rail lines, and airways;
• Carry regionally significant freight measured in cargo tonnage and truck volumes or twenty-foot-equivalent units (TEUs) and forty-foot-equivalent units (FEUs) for containers;
• Serve intermodal facilities with container and trailer capabilities at airports, seaports, river ports, and inland intermodal terminals (dry ports); and,
• Serve important economic centers such as cities or agriculture or mining regions.20
The concept of transportation corridor has been in use by planners for decades, originating in studies undertaken by the United Nations and World Bank to assess the transportation needs of Africa. In Latin America, the former Brazilian Transportation Planning Company (GEIPOT), a transportation-planning division of the country's ministry of Transportation, adopted this concept.21 GEIPOT understood transport corridors to be places or lanes that make trade possible; they are benefited by a complex array of social and economic services featuring the multimodal trunk systems of transport.22 In economic development parlance, there are three types of transport corridors: funnel corridors, dumb-bell corridors, and developmental corridors. Funnel corridors channel traffic flows through a specified port. Dumb-bell corridors join two productive regions often by bridge or 20 Western Trade Transportation Network, Western Trade Transportation Network (WTTN) Final Report (1997), p. 3-2. 21 Stephen Bender, "General Aspects of Transportation Corridors," (Organization of American States: Washington, D.C., n.d.), p. 1. 22 Empresa Brasileira de Planejamento de Transportes (GEIPOT), Ministério dos Transportes, Corredores Estratégicos de Desenvolvimento, José Glauco Apoliano Andrade Dias coord. (Brasília, February 1999), p. 4.

9
tunnel. A developmental corridor takes advantage of economic concentration seeking to provide high-speed travel and transport within the cluster. Efforts to promote corridors often involve investments that facilitate transport of base commodities. They are often international in scope with a host of institutional issues involved in corridor development and financing.23 In Latin America, the Organization of American States (OAS) has identified the trade corridor as a vital element for planning sustainable development. Stephen Bender, Principal Advisor on Sustainable Development, opined:
Trade corridors are a new class of region. They are not the products, by and large, of planning theory and practice….Rather, they are increasingly the result of decentralized decision making, led by the private sector's understanding of changing, competitive markets, comparative advantages in raw materials, production capabilities and access to markets. The private sector is in a partnership with the public sector, which is divesting itself of those activities which it does poorly or inefficiently….Trade corridors are generating their own set of emerging issues: new models of public administration.24
Bender makes three very important observations on the development of corridors as regions. First, the pooling of public and private sector resources comes about in order to reduce the risks of decisionmaking. The organization of a corridor is not centrally planned by a government entity; it is decentralized and open to a variety of actors representing a mixture of public- and private-sector interests. Second, corridor development can be measured in financial terms easily understandable to business. Economic impact analysis aids in measurement. Third, Bender warns that those corridors with no organizational arrangement will have less influence on the development of alternative transport modes. Moreover, they will quite possibly lose out on rapidly forming global trading relationships and capital, labor and technology shifts. In sum, “Trade corridors are created, not to solve urban development problems, but to seek development opportunities.”25 Corridors identify opportunities. In this sense, adding to Porter’s insight that firms not nations compete, firms seeking to export or import can compete to the extent that their trade corridors are competitive internationally. In the early 1990s, the Transport Division of the United Nations Economic Commission for Latin America and the Caribbean (ECLAC) investigated the process of foreign trade focusing on particular trade corridors. To find ways of making the region more competitive in foreign trade, ECLAC conducted studies of commodity movements of South American exports to determine their competitiveness in international markets. In conducting case studies of Chilean fruit, Colombian textiles, and Argentine fruit, ECLAC traced real impacts of trade and transport through the complete supply chain, including warehousing and processing in destination markets. The impetus comes from the following rationale expressed by ECLAC: “Through a detailed investigation of the exporting experience, we attempt to identify the obstacles that affect
23 Stephen O. Bender, "General Aspects of Trade Corridors," pp. 1-3. 24 Stephen O. Bender, "Trade Corridors: The Emerging Regional Development Planning Unit in Latin America," paper presented for the United Nations Centre for Regional Development, Regional Development Forum for Latin America and the Caribbean "Regional Development Planning: Towards the 21st Century," Santafe de Bogota, Colombia, December 1-3, 1997, p. 3. 25 Ibid., p. 5.

10
the competitiveness of Latin American exports in new and traditional markets and the measures that can improve them.”26 In the study applied to Chilean fruit exports, the objective was to:
…analyze the relationship between export expansion, modes of commercialization, transportation services offered in the region with the end of profiling the current situation and identifying the actors or elements that affect the region…In this way, it is expected to contribute to the elaboration of a strategy oriented to resolve restrictions and limitations that impede the adaptability of Latin American transport systems with the aim of facilitating the cargo flows in competitive conditions and to establish a regional transport system that is sufficiently flexible to permit making use of permanent innovations that these services attempt throughout the world.27
ECLAC's study of the supply chain covered the processes of production, packaging, distribution, commercialization, and professional training. Among ECLAC’s findings involving transportation impacts, the following stand out: • The importance of maintaining temperature on truck to avoid fruit spoilage;
• The time at port significantly affected the quality of fruit and the chance that temperature would rise, thus risking spoilage;
• The temperature of the fruit was determined by the time of day of shipment;
• Maritime services’ focus on standardization made it easier for pooling producers' shipments, since refrigerated containerization allowed for fractional shipping and consolidation;
• Maritime schedules influenced the growing season and harvest and vice versa; and,
• The exporter was the principal actor involved in the transport chain.28
Upon analysis at the firm and shipment level, trade corridor components can be viewed as a system that not only adds value to a region's production, but also to the effective and efficient functioning of the transportation corridor. Inasmuch as nations compete to the degree that their firms compete, competitiveness and economic development will be determined by how well their trade corridors and transport networks compete. This has profound implications on determining impacts of policy. Returning to the logistics literature, Lambert states:
One of the most significant paradigm shifts of modern business management is that individual businesses no longer compete as solely autonomous entities, but rather as
26 La Cadena de Distribuicion y La Competitividad de Las Exportaciones Latinoamericanos-La Fruta de Chile, CEPAL (July 31, 1990), Preface. Translation that of the authors. 27 Ibid. 28 Ibid.

11
supply chains…Instead of brand versus brand or store versus store, it is now suppliers-brand-store versus suppliers-brand-store, or supply chain versus supply chain.29
Applied to an analysis of U.S.-Latin American trade impacts, it is the supply chain that determines what travels, how, and what its impacts will be on regional economies and transportation systems. This can only be addressed through illustrative case study delineating the transport and trading processes. Through case study of business activity, transportation of freight along a corridor can be viewed with attention to the policies that facilitate or impede such carriage. Thus, as Krugman states, policymakers see how “nations matter…because they have governments whose policies affect the movement of goods and factors.”30 A focus on the firm thereby yields policy-relevant information that can enhance a nation’s firms to compete domestically and internationally. Choice of Case Study For purposes of analyzing the impacts of U.S.-Latin American trade, this report analyzes the waterborne trade between the two biggest trading partners in the region, the United States and Brazil. For the U.S. Southwest, to further narrow the study to a tractable size, the U.S. Gulf Port of Houston was selected as the U.S. port of entry/exit. The Port of Houston ranks second in the U.S. in terms of foreign tonnage and is the principal gateway to the U.S. Southwest from the Gulf Coast. In addition, the Port of Houston has carried out several economic impact studies dating back to the 1960s.31 For Brazil, the leading port of Santos was selected, having also been subject to economic impact analysis as Brazil’s most important and historic port for foreign trade.32 Though not directly comparable with the approach developed in this study, past studies serve as useful points of departure in situating local and regional impacts associated with U.S.-Latin American trade. This salience cannot be understated since the FTAA negotiations will take place primarily between U.S. and Brazilian negotiation teams. An analysis of Port of Houston trade data collected by the Port Import Export Reporting Service (PIERS) of the Journal of Commerce Group identified regionally significant commodities trading between Santos and Houston. A regionally significant commodity is consistently traded in sufficient quantity over time so that it generates measurable impacts on other business activity. Further analysis revealed that another Brazilian port, Vitória, along with Santos exported sizeable volumes of coffee and steel products to Houston. Because imported steel and coffee are processed and refined in further stages of production, they meet the test of “regionally significant.” Since these three ports handled both commodities, this study concentrated on the
29 Douglas M. Lambert, “The Supply Chain Management and Logistics Controversy,” in Handbook of Logistics and Supply-Chain Management, ed. by Ann M Brewer, Kenneth .J. Button, and David A. Hensher (New York: Pergamon Press, 2001), p. 100. 30 Paul Krugman, Geography and Trade (Cambridge, Massachusetts: MIT Press, 1991), p. 71. 31 Warren Rose, Catalyst of an Economy: The Economic Impact of the Port of Houston 1958-1963 (Houston, Texas: Center for Research in Business and Economics, University of Houston, August 1965); Martin Associates, The Local and Regional Economic Impacts of the Port of Houston (Lancaster, Pennsylvania, March 29, 1999); and, Marilyn McAdams Sibley, The Port of Houston-A History (Austin, Texas: University of Texas Press, 1968). 32 Jose Ribeiro de Araujo Filho, Santos-O Porto do Café (Rio de Janeiro: Fundacao Instituto Brasileiro de Geografia, 1969).
12
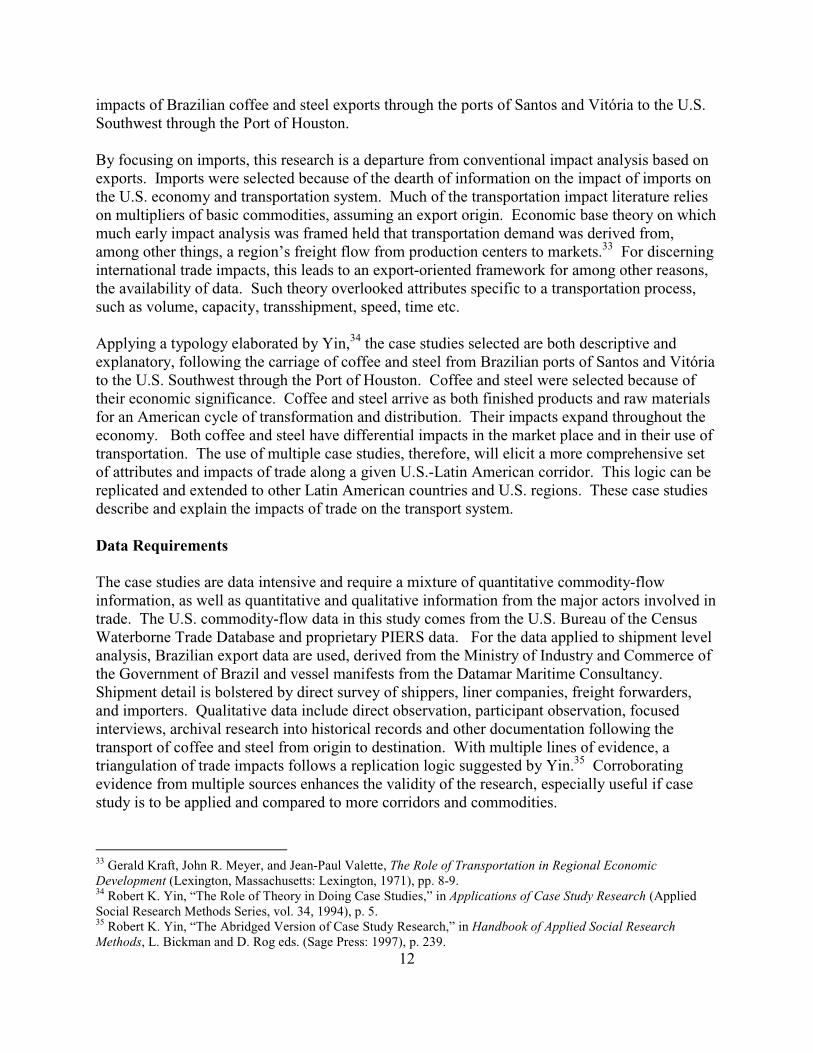
impacts of Brazilian coffee and steel exports through the ports of Santos and Vitória to the U.S. Southwest through the Port of Houston. By focusing on imports, this research is a departure from conventional impact analysis based on exports. Imports were selected because of the dearth of information on the impact of imports on the U.S. economy and transportation system. Much of the transportation impact literature relies on multipliers of basic commodities, assuming an export origin. Economic base theory on which much early impact analysis was framed held that transportation demand was derived from, among other things, a region’s freight flow from production centers to markets.33 For discerning international trade impacts, this leads to an export-oriented framework for among other reasons, the availability of data. Such theory overlooked attributes specific to a transportation process, such as volume, capacity, transshipment, speed, time etc. Applying a typology elaborated by Yin,34 the case studies selected are both descriptive and explanatory, following the carriage of coffee and steel from Brazilian ports of Santos and Vitória to the U.S. Southwest through the Port of Houston. Coffee and steel were selected because of their economic significance. Coffee and steel arrive as both finished products and raw materials for an American cycle of transformation and distribution. Their impacts expand throughout the economy. Both coffee and steel have differential impacts in the market place and in their use of transportation. The use of multiple case studies, therefore, will elicit a more comprehensive set of attributes and impacts of trade along a given U.S.-Latin American corridor. This logic can be replicated and extended to other Latin American countries and U.S. regions. These case studies describe and explain the impacts of trade on the transport system. Data Requirements The case studies are data intensive and require a mixture of quantitative commodity-flow information, as well as quantitative and qualitative information from the major actors involved in trade. The U.S. commodity-flow data in this study comes from the U.S. Bureau of the Census Waterborne Trade Database and proprietary PIERS data. For the data applied to shipment level analysis, Brazilian export data are used, derived from the Ministry of Industry and Commerce of the Government of Brazil and vessel manifests from the Datamar Maritime Consultancy. Shipment detail is bolstered by direct survey of shippers, liner companies, freight forwarders, and importers. Qualitative data include direct observation, participant observation, focused interviews, archival research into historical records and other documentation following the transport of coffee and steel from origin to destination. With multiple lines of evidence, a triangulation of trade impacts follows a replication logic suggested by Yin.35 Corroborating evidence from multiple sources enhances the validity of the research, especially useful if case study is to be applied and compared to more corridors and commodities.
33 Gerald Kraft, John R. Meyer, and Jean-Paul Valette, The Role of Transportation in Regional Economic Development (Lexington, Massachusetts: Lexington, 1971), pp. 8-9. 34 Robert K. Yin, “The Role of Theory in Doing Case Studies,” in Applications of Case Study Research (Applied Social Research Methods Series, vol. 34, 1994), p. 5. 35 Robert K. Yin, “The Abridged Version of Case Study Research,” in Handbook of Applied Social Research Methods, L. Bickman and D. Rog eds. (Sage Press: 1997), p. 239.
13
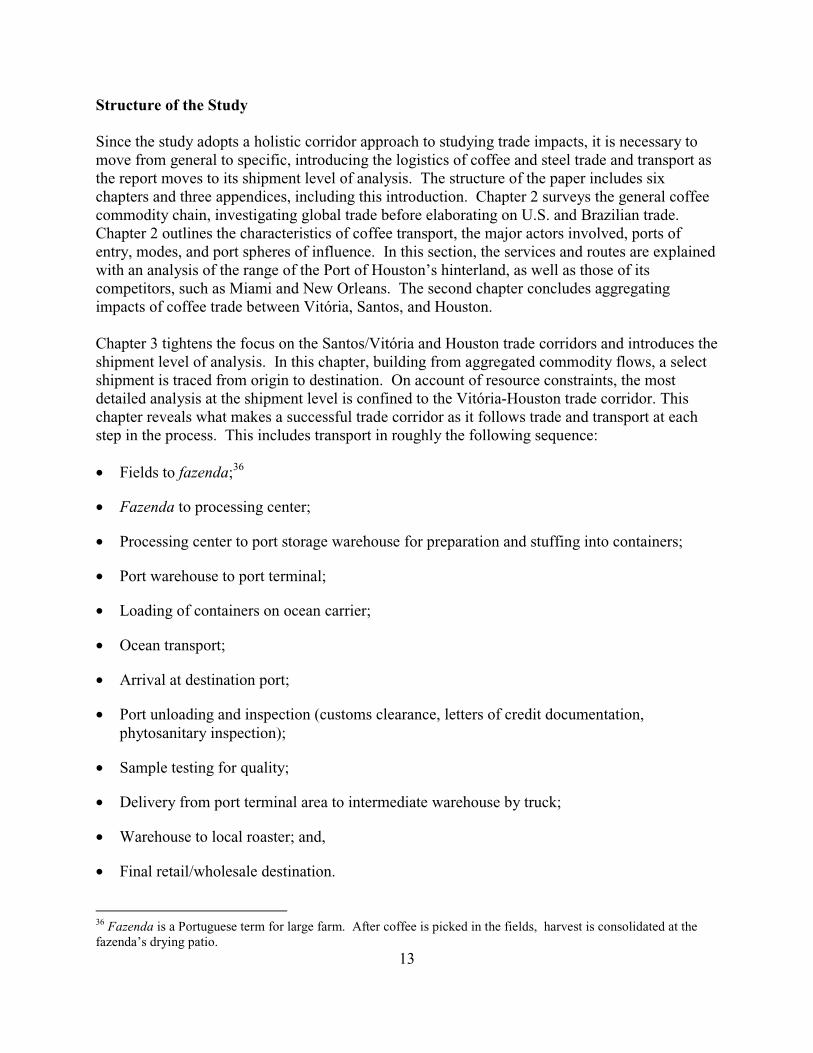
Structure of the Study Since the study adopts a holistic corridor approach to studying trade impacts, it is necessary to move from general to specific, introducing the logistics of coffee and steel trade and transport as the report moves to its shipment level of analysis. The structure of the paper includes six chapters and three appendices, including this introduction. Chapter 2 surveys the general coffee commodity chain, investigating global trade before elaborating on U.S. and Brazilian trade. Chapter 2 outlines the characteristics of coffee transport, the major actors involved, ports of entry, modes, and port spheres of influence. In this section, the services and routes are explained with an analysis of the range of the Port of Houston’s hinterland, as well as those of its competitors, such as Miami and New Orleans. The second chapter concludes aggregating impacts of coffee trade between Vitória, Santos, and Houston. Chapter 3 tightens the focus on the Santos/Vitória and Houston trade corridors and introduces the shipment level of analysis. In this chapter, building from aggregated commodity flows, a select shipment is traced from origin to destination. On account of resource constraints, the most detailed analysis at the shipment level is confined to the Vitória-Houston trade corridor. This chapter reveals what makes a successful trade corridor as it follows trade and transport at each step in the process. This includes transport in roughly the following sequence: • Fields to fazenda;36
• Fazenda to processing center;
• Processing center to port storage warehouse for preparation and stuffing into containers;
• Port warehouse to port terminal;
• Loading of containers on ocean carrier;
• Ocean transport;
• Arrival at destination port;
• Port unloading and inspection (customs clearance, letters of credit documentation, phytosanitary inspection);
• Sample testing for quality;
• Delivery from port terminal area to intermediate warehouse by truck;
• Warehouse to local roaster; and,
• Final retail/wholesale destination.
36 Fazenda is a Portuguese term for large farm. After coffee is picked in the fields, harvest is consolidated at the fazenda’s drying patio.

14
The analysis of process fleshes out important issues influencing the decisionmaking of major actors in addition to making clear the obstacles and localized impacts of coffee transport along an entire transport chain. Chapters 4 and 5 repeat the same structure for steel. After an introduction into the global steel market, chapter 4 focuses on the U.S.-Brazilian steel trade. Special attention is given to the most recent regulatory determinants of trade, such as antidumping litigation and voluntary export restrictions. Because of the relevance of regulation and U.S. steel policy on U.S. steel imports, a supplemental appendix surveys U.S. regulatory steel policy with emphasis on Brazil. With freight flow data, the analysis identifies the Port of Houston’s sphere of influence with regard to imported steel. Chapter 5 traces the impacts of a sample steel shipment from Vitória to Houston. The steel transporting process can be generally broken down into the following stages: • Import of raw materials (mine to mill and port to mill) via rail;
• Mill to port by rail;
• Arrival at dedicated steel terminal at departure port;
• Unloading from railcar to terminal;
• Loading onto breakbulk liner;
• Ocean transport;
• Arrival at destination port;
• Customs clearance, sales documentation-letters of credit, and inspection;
• Unloading at port to port storage area (truck); and,
• Port storage area to client.
Chapter 6 presents the cumulative impacts of corridor specific trade of coffee and steel from Vitória to Houston. It is here where the cumulative impacts at the shipment level are suggested as the starting points for developing a more comprehensive impact methodology that integrates three distinct research literatures, port impact studies, transportation corridors and supply chains. Chapter 6 suggests a framework for deriving economic impacts that uses activity-based freight analysis at the shipment level. These cumulative impacts are shown to yield new insights into the performance, effectiveness, and efficiency of a trade corridor and its transportation component.

15
Chapter 2. The Coffee Commodity Chain and U.S./Brazilian Trade
Characteristics of the Global Coffee Trade Global trade in coffee represents an important item of foreign exchange between countries. With multiple processes involved in the long journey from coffee bean to cup, coffee trade covers numerous value-added services that go along with its cultivation, harvest, transportation, production, and final distribution. In aggregate terms, the global coffee production for 1999-2000 yielded an estimated 107.2 million 60-kilogram (kg) bags or more than 14 billion pounds.37 Add to this the further refinement and production from green bean into roasted or instant soluble coffee and world consumption is estimated at 2.25 billion cups per day. The United States is the leading consumer, accounting for one-fifth of total consumption while Brazil is the largest producer with nearly 25 percent of global production.38 American per capita consumption of coffee amounted to 17.3 gallons in the year 2000 or 1.66 cups per day; though this is a steep drop from 1962 level of 39.3 gallons per capita, coffee consumption nonetheless is the fourth most widely consumed beverage behind soft drinks, milk, and beer.39 Coffee is a crop that will only grow in tropical or subtropical conditions at altitudes of 6,000 feet and below. Arabica, the highest priced and most common type of coffee accounting for 75 percent of world supply, will only grow at altitudes of 1,500-6,000 feet. The other major type is robusta, which can be grown from sea level up to 3,200 feet in hot and wet conditions. An estimated 20 million people work on coffee plantations in more than 80 countries. Coffee cultivation covers 26 million acres of farmland. Production for an average cup of coffee requires approximately 1.4 square feet of cultivation area.40 Before embarking on a description of the coffee trading process, it is necessary to delineate the coffee commodity chain. The commodity chain, as identified by Hopkins and Wallerstein, constitutes a network of labor and production processes which results in a finished commodity.41 This occurs through interactions within a sequence of nodes linked by series of activities relating to acquisition of inputs, transportation, labor, distribution, and production, i.e., Porter’s value chain. Broadly defined, they follow the sequence in stages of cultivation, harvesting, processing, sorting, grading, bagging, shipping, testing (cupping), roasting, and retail. At each stage value is added in some form as the commodity is transformed. Figure 2.1 outlines the coffee commodity chain.
37 The CRB Commodity Yearbook 2000 (New York: John Wiley & Sons, 2000), p. 45. 38 Gregory Dicum and Nina Luttinger, The Coffee Book: Anatomy of an Industry from Crop to the Last Drop (New York: The New Press, 1999), p. ix; and, The CRB Commodity Yearbook 2000, p. 45. 39 Foreign Agricultural Service (FAS), United States Department of Agriculture (USDA), “Coffee Update,” FAS web site, available at: www.fas.usda.gov/htp2/tropical/2000/10-00/Oct00txt.htm., cited October 12, 2001. 40 Dicum and Luttinger, pp. 38-40. 41 Terence Hopkins and Immanuel Wallerstein, “Commodity chains in the world economy prior to 1800,” Review of the Journal of the Fernand Braudel Center 10 (Summer 1986), p. 159.

16
Figure 2.1. The Coffee Commodity Chain
IntermediariesCoops/Traders/Agents
Coffee Growers
Marketing Boards
Coffee Importers and Traders
Exporters
Small Traders and Brokers
Coffee ManufacturersRoasters/Ground/Instant
Coffee Consumers
Source: John M. Talbot, “Where does your coffee dollar go?: The Division of Income and Surplus along the Coffee
Commodity Chain,” Studies in Comparative International Development, Spring 1997, vol. 32, no.1, p. 62.
Figuring into the coffee value chain above are numerous activities located in both producer and consumer countries. The basic processes of cultivation, harvesting, processing, sorting, grading, bagging, shipping, testing (cupping), roasting, and retail each have important impacts on how the trade occurs. Once planted, a typical coffee plant takes three years to mature, producing 2,000 coffee cherries per year. A coffee tree can have a life of up to 30 years. Cold weather, especially frost may spoil a crop. Damage by frost, pests, and disease are clear threats to a particular year’s crop. Generally, coffee cherries ripen in seven to 11 months. After harvesting,
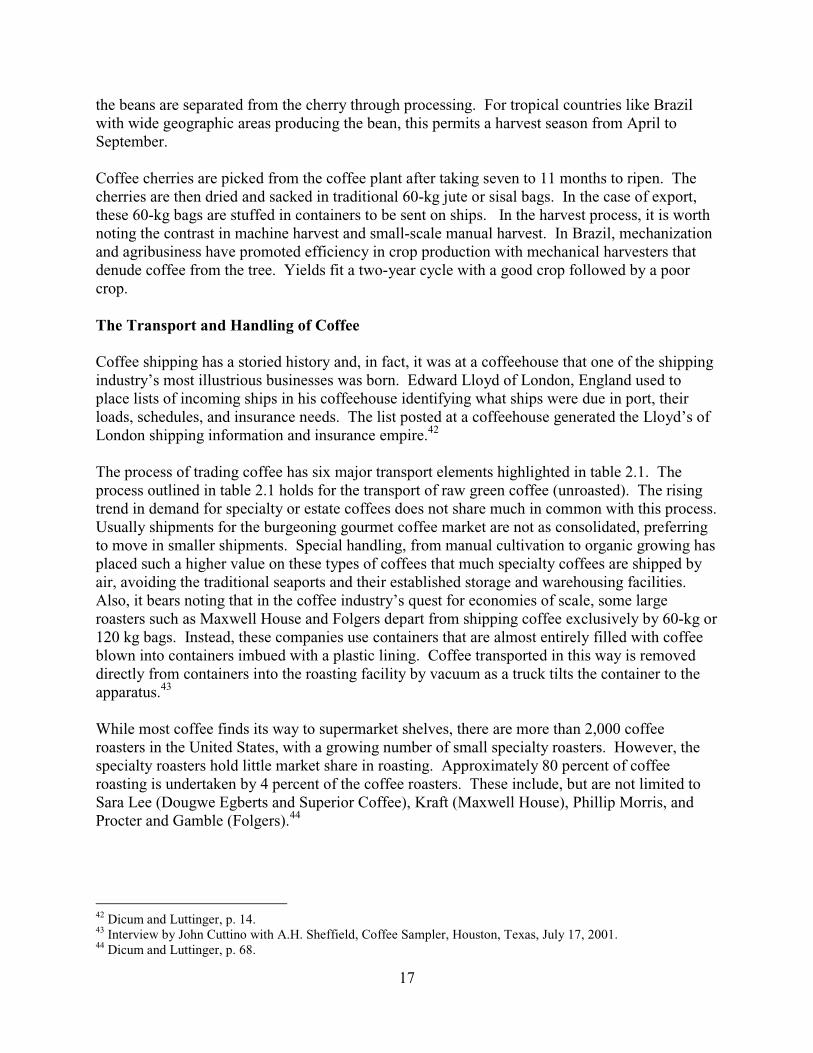
17
the beans are separated from the cherry through processing. For tropical countries like Brazil with wide geographic areas producing the bean, this permits a harvest season from April to September. Coffee cherries are picked from the coffee plant after taking seven to 11 months to ripen. The cherries are then dried and sacked in traditional 60-kg jute or sisal bags. In the case of export, these 60-kg bags are stuffed in containers to be sent on ships. In the harvest process, it is worth noting the contrast in machine harvest and small-scale manual harvest. In Brazil, mechanization and agribusiness have promoted efficiency in crop production with mechanical harvesters that denude coffee from the tree. Yields fit a two-year cycle with a good crop followed by a poor crop. The Transport and Handling of Coffee Coffee shipping has a storied history and, in fact, it was at a coffeehouse that one of the shipping industry’s most illustrious businesses was born. Edward Lloyd of London, England used to place lists of incoming ships in his coffeehouse identifying what ships were due in port, their loads, schedules, and insurance needs. The list posted at a coffeehouse generated the Lloyd’s of London shipping information and insurance empire.42 The process of trading coffee has six major transport elements highlighted in table 2.1. The process outlined in table 2.1 holds for the transport of raw green coffee (unroasted). The rising trend in demand for specialty or estate coffees does not share much in common with this process. Usually shipments for the burgeoning gourmet coffee market are not as consolidated, preferring to move in smaller shipments. Special handling, from manual cultivation to organic growing has placed such a higher value on these types of coffees that much specialty coffees are shipped by air, avoiding the traditional seaports and their established storage and warehousing facilities. Also, it bears noting that in the coffee industry’s quest for economies of scale, some large roasters such as Maxwell House and Folgers depart from shipping coffee exclusively by 60-kg or 120 kg bags. Instead, these companies use containers that are almost entirely filled with coffee blown into containers imbued with a plastic lining. Coffee transported in this way is removed directly from containers into the roasting facility by vacuum as a truck tilts the container to the apparatus.43 While most coffee finds its way to supermarket shelves, there are more than 2,000 coffee roasters in the United States, with a growing number of small specialty roasters. However, the specialty roasters hold little market share in roasting. Approximately 80 percent of coffee roasting is undertaken by 4 percent of the coffee roasters. These include, but are not limited to Sara Lee (Dougwe Egberts and Superior Coffee), Kraft (Maxwell House), Phillip Morris, and Procter and Gamble (Folgers).44
42 Dicum and Luttinger, p. 14. 43 Interview by John Cuttino with A.H. Sheffield, Coffee Sampler, Houston, Texas, July 17, 2001. 44 Dicum and Luttinger, p. 68.
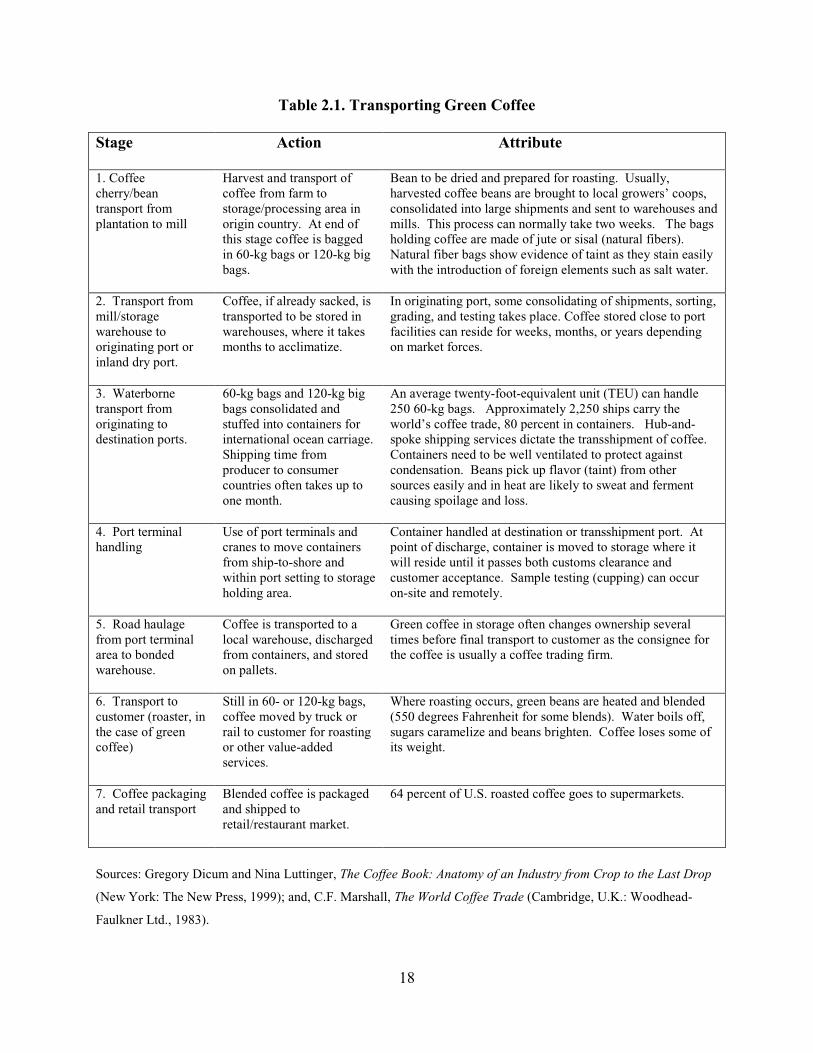
18
Table 2.1. Transporting Green Coffee Stage
Action Attribute
1. Coffee cherry/bean transport from plantation to mill
Harvest and transport of coffee from farm to storage/processing area in origin country. At end of this stage coffee is bagged in 60-kg bags or 120-kg big bags.
Bean to be dried and prepared for roasting. Usually, harvested coffee beans are brought to local growers’ coops, consolidated into large shipments and sent to warehouses and mills. This process can normally take two weeks. The bags holding coffee are made of jute or sisal (natural fibers). Natural fiber bags show evidence of taint as they stain easily with the introduction of foreign elements such as salt water.
2. Transport from mill/storage warehouse to originating port or inland dry port.
Coffee, if already sacked, is transported to be stored in warehouses, where it takes months to acclimatize.
In originating port, some consolidating of shipments, sorting, grading, and testing takes place. Coffee stored close to port facilities can reside for weeks, months, or years depending on market forces.
3. Waterborne transport from originating to destination ports.
60-kg bags and 120-kg big bags consolidated and stuffed into containers for international ocean carriage. Shipping time from producer to consumer countries often takes up to one month.
An average twenty-foot-equivalent unit (TEU) can handle 250 60-kg bags. Approximately 2,250 ships carry the world’s coffee trade, 80 percent in containers. Hub-and-spoke shipping services dictate the transshipment of coffee. Containers need to be well ventilated to protect against condensation. Beans pick up flavor (taint) from other sources easily and in heat are likely to sweat and ferment causing spoilage and loss.
4. Port terminal handling
Use of port terminals and cranes to move containers from ship-to-shore and within port setting to storage holding area.
Container handled at destination or transshipment port. At point of discharge, container is moved to storage where it will reside until it passes both customs clearance and customer acceptance. Sample testing (cupping) can occur on-site and remotely.
5. Road haulage from port terminal area to bonded warehouse.
Coffee is transported to a local warehouse, discharged from containers, and stored on pallets.
Green coffee in storage often changes ownership several times before final transport to customer as the consignee for the coffee is usually a coffee trading firm.
6. Transport to customer (roaster, in the case of green coffee)
Still in 60- or 120-kg bags, coffee moved by truck or rail to customer for roasting or other value-added services.
Where roasting occurs, green beans are heated and blended (550 degrees Fahrenheit for some blends). Water boils off, sugars caramelize and beans brighten. Coffee loses some of its weight.
7. Coffee packaging and retail transport
Blended coffee is packaged and shipped to retail/restaurant market.
64 percent of U.S. roasted coffee goes to supermarkets.
Sources: Gregory Dicum and Nina Luttinger, The Coffee Book: Anatomy of an Industry from Crop to the Last Drop
(New York: The New Press, 1999); and, C.F. Marshall, The World Coffee Trade (Cambridge, U.K.: Woodhead-
Faulkner Ltd., 1983).

19
Table 2.2. Selected Countries’ Share of U.S. Green Coffee Imports (%) Year Brazil Colombia Mexico Guatemala Indonesia
1995 14.5 15.6 18.2 10.3 3.2 1996 10.3 16.8 20.8 9.7 6.9 1997 12.4 16.9 15.6 10.2 7.0 1998 14.1 17.9 13.0 8.2 6.7 Source: The CRB Commodity Yearbook 1999 (New York: John Wiley & Sons, 1999).
Table 2.2 shows leading coffee producers market share of U.S. green coffee imports. Among leading exporting countries, Asian countries have seen a significant rise as evidenced not only by the emergence of Indonesia in table 2.2 but also by Vietnam and India. Brazil, Colombia, and Mexico are leading exporters to the United States. Globally, Brazil is the leading producer with a harvest of 33.7 million bags estimated for the 2000/01 season.45 However, Brazil also consumes 80 percent of its production. With reference to its export market, in 1999 the United States was Brazil’s largest single export market accounting for 22.2 percent of export tonnage. In the year 2000, Germany surpassed the United States as the largest Brazilian export market with 16.7 percent share compared to the U.S. share of 14.3 percent. In order to bolster prices, producer countries have long tried to form cartels. Since the termination of the International Coffee Agreement in 1989, coffee prices have witnessed a dramatic fall. In today’s global marketplace, producer countries have attempted to bolster international prices by withholding or destroying much of their harvest under a global coffee retention program. The ascension of coffee cultivation in Asian countries, such as Vietnam and Indonesia, has led to the retention program having minimal impact. In the case of Brazil, a sizeable portion of the nation’s coffee production is destroyed. Some attempts have been made to use destroyed coffee as fertilizer or fuel. Much, however, is dumped out at sea. U.S.-Brazilian Coffee Trade In the past, coffee accounted for almost all of Brazil’s foreign exchange with which it could purchase imports of goods and services. Though diminished, coffee is still a vitally important commodity, which Brazil uses to secure foreign exchange. The sale of coffee to the United States allows Brazil to buy American products. Thus, Brazil’s coffee exports to the United States indirectly contribute to U.S. exports to Brazil. Brazilian producing regions include the states of Minas Gerais, São Paulo, Espírito Santo, Paraná, and Rondônia (see figure 2.2). The two principal coffee ports are Santos, São Paulo and Vitória, Espírito Santo. In 1997, these ports accounted for 74.5 percent and 17.1 percent of Brazilian coffee exports, respectively.46 Table 2.3 lists the principal producing regions of 45 Foreign Agricultural Service, United States Department of Agriculture, Brazil Coffee Annual 2001, Global Agriculture Information Network Report #BR1021, May 15, 2001. 46 Josef Barat, “A logistica do café do ponto de vista do exportador brasileiro,” available at: www.café.com.br/trabalho/mercado/logistica/5.2.htm, cited February 9, 2001.

20
Brazilian coffee. In 1998, Brazilian coffee production cost 50 cents per pound.47 From producing regions, Brazilian coffee is exclusively transported to port by truck.
Table 2.3. Brazilian Coffee Production in Million 60-kg Bags (July-June)*
State 1996/ 1997
1997/ 1998
1998/ 1999
1999/ 2000
2000/ 2001
2001/ 2002
Minas Gerais
14.2 10.7 18.95 15.4 16 15
SW Minas Gerais
7 5.5 10.75 8.4 9 7.5
MW Minas Gerais
4.2 2.9 4.1 3.5 3 3
SE Minas Gerais
3 2.3 4.1 3.5 4 4.5
Espírito Santo
5.6 (Robusta-3.8)
4 (Robusta-2.8)
5.35 (Robusta-3.2)
4.7 (Robusta-2.7)
7.4 (Robusta-4.8)
9.7 (Robusta-7.5)
São Paulo 3.5 3 4.2 3.7 3.6 3 Paraná 1.5 2.5 3.2 2.8 2.2 0.5 Others 3.2 3.3 3.9 4.2 4.9 5.5 Total 28
(Arabica-22.7) 23.5
(Arabica-19.2) 35.6
(Arabica-30.6) 30.8
(Arabica-25.8) 34.1
(Arabica-26.6) 33.7
(Arabica-23.0) * Amounts are for combined total production of arabicas and robustas; additional information is provided when
available.
Source: Agricultural Trade Office, São Paulo, Brazil, Foreign Agricultural Service, U.S. Department of Agriculture,
in Foreign Agricultural Service, United States Department of Agriculture, Brazil Coffee Annual 2001, Global
Agriculture Information Network Report #BR1021, May 15, 2001, p. 4.
U.S. Brazilian coffee trade has recently been jolted by changes in global production and currency crises. This is clear in the link between the New York price for Brazilian arabica coffee and the Brazilian exchange rate tied to the U.S. dollar. Figure 2.3 demonstrates the inverse relationship between currency and coffee price. Most interesting is the drastic change created by the steep January 1999 devaluation of the Brazilian currency (Real, R$). This makes an immediate improvement in the competitiveness of the Brazilian bean. Figure 2.4 chronicles the recent green coffee imports to the U.S. from Brazil.
47 Dicum and Luttinger, p. 106.

21
Figure 2.2. Map of Brazil
Source: “Political Map of Brazil, 1994,” CIA World Factbook (United States Central Intelligence Agency: 1994),
available online at www.lib.utexas.edu/maps/americas/brazil.jpg, cited June 19, 2002.
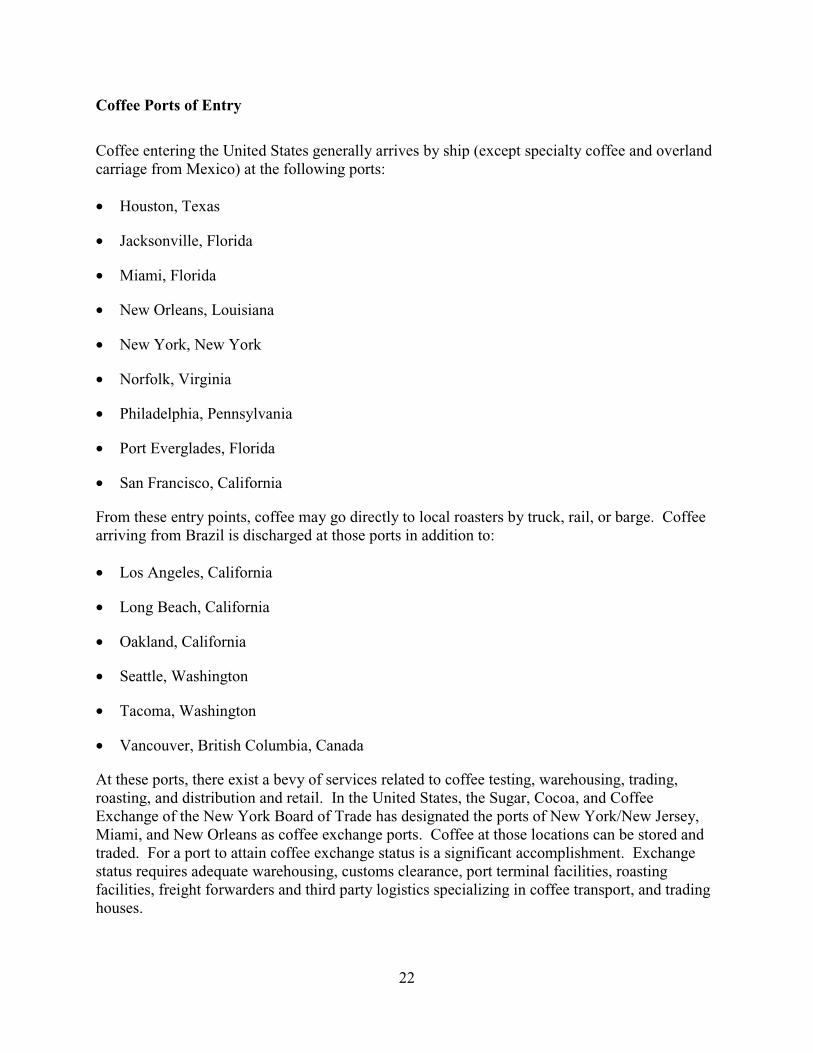
22
Coffee Ports of Entry
Coffee entering the United States generally arrives by ship (except specialty coffee and overland carriage from Mexico) at the following ports: • Houston, Texas
• Jacksonville, Florida
• Miami, Florida
• New Orleans, Louisiana
• New York, New York
• Norfolk, Virginia
• Philadelphia, Pennsylvania
• Port Everglades, Florida
• San Francisco, California
From these entry points, coffee may go directly to local roasters by truck, rail, or barge. Coffee arriving from Brazil is discharged at those ports in addition to: • Los Angeles, California
• Long Beach, California
• Oakland, California
• Seattle, Washington
• Tacoma, Washington
• Vancouver, British Columbia, Canada
At these ports, there exist a bevy of services related to coffee testing, warehousing, trading, roasting, and distribution and retail. In the United States, the Sugar, Cocoa, and Coffee Exchange of the New York Board of Trade has designated the ports of New York/New Jersey, Miami, and New Orleans as coffee exchange ports. Coffee at those locations can be stored and traded. For a port to attain coffee exchange status is a significant accomplishment. Exchange status requires adequate warehousing, customs clearance, port terminal facilities, roasting facilities, freight forwarders and third party logistics specializing in coffee transport, and trading houses.

23
Fig
ure
2.3.
Ave
rage
New
Yor
k P
rice
of
Bra
zilia
n R
obus
ta G
reen
Cof
fee
(cen
ts p
er p
ound
)
050100
150
200
250
Jan-
90 Sep-9
0 May
-91 Ja
n-92 Sep-9
2 May
-93 Ja
n-94 Sep-9
4 May-9
5 Jan-
96 Sep-9
6 May
-97 Ja
n-98 Sep-9
8 May
-99 Ja
n-00 Sep-0
0 May-0
1
Mo
nth
/Yea
r
Cents per pound
S
ourc
e: T
he C
RB
Com
mod
ity Y
earb
ook
(New
Yor
k: J
ohn
Wyl
ie &
Son
s), v
ario
us y
ears
.
23

24
F
igur
e 2.
4. U
.S. G
reen
Cof
fee
Impo
rts
from
Bra
zil
1989
1990
1991
1992
1993
1994
1995
1996
1997
1998
0
1000
2000
3000
4000
5000
6000
# 60
kg
bag
s
Yea
r
So
urce
: The
CR
B C
omm
odity
Yea
rboo
k (N
ew Y
ork:
Joh
n W
ylie
& S
ons)
, var
ious
yea
rs.
24
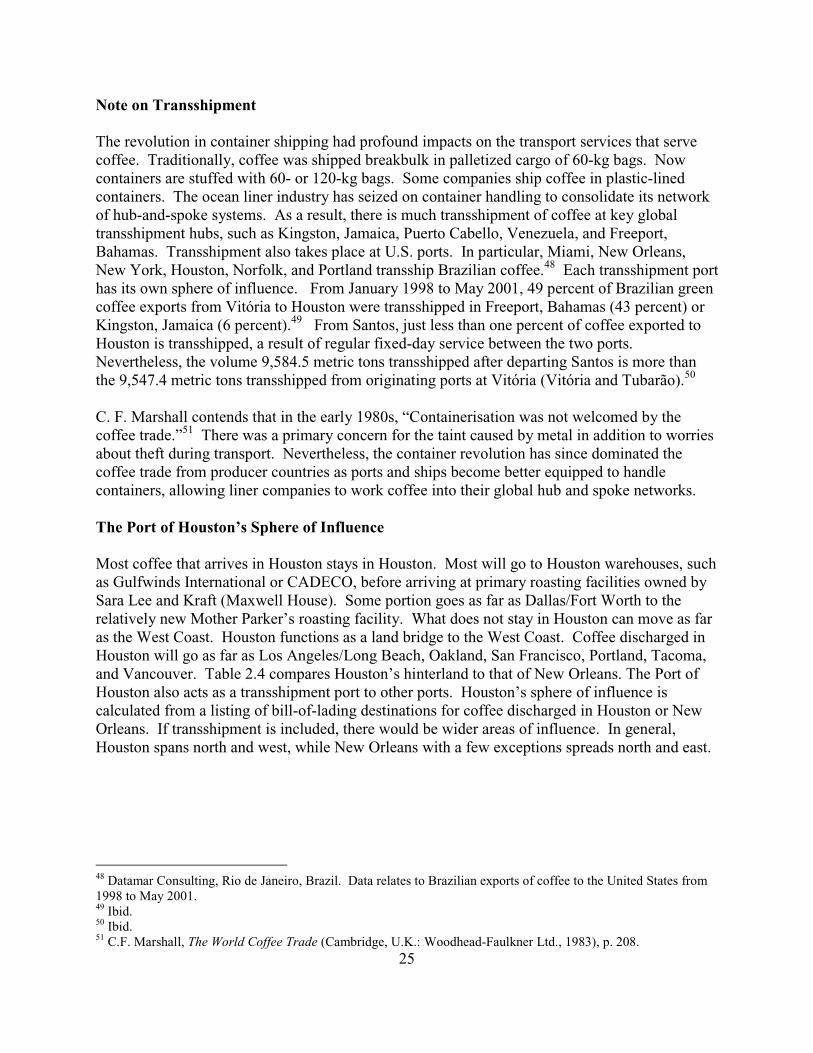
25
Note on Transshipment The revolution in container shipping had profound impacts on the transport services that serve coffee. Traditionally, coffee was shipped breakbulk in palletized cargo of 60-kg bags. Now containers are stuffed with 60- or 120-kg bags. Some companies ship coffee in plastic-lined containers. The ocean liner industry has seized on container handling to consolidate its network of hub-and-spoke systems. As a result, there is much transshipment of coffee at key global transshipment hubs, such as Kingston, Jamaica, Puerto Cabello, Venezuela, and Freeport, Bahamas. Transshipment also takes place at U.S. ports. In particular, Miami, New Orleans, New York, Houston, Norfolk, and Portland transship Brazilian coffee.48 Each transshipment port has its own sphere of influence. From January 1998 to May 2001, 49 percent of Brazilian green coffee exports from Vitória to Houston were transshipped in Freeport, Bahamas (43 percent) or Kingston, Jamaica (6 percent).49 From Santos, just less than one percent of coffee exported to Houston is transshipped, a result of regular fixed-day service between the two ports. Nevertheless, the volume 9,584.5 metric tons transshipped after departing Santos is more than the 9,547.4 metric tons transshipped from originating ports at Vitória (Vitória and Tubarão).50 C. F. Marshall contends that in the early 1980s, “Containerisation was not welcomed by the coffee trade.”51 There was a primary concern for the taint caused by metal in addition to worries about theft during transport. Nevertheless, the container revolution has since dominated the coffee trade from producer countries as ports and ships become better equipped to handle containers, allowing liner companies to work coffee into their global hub and spoke networks. The Port of Houston’s Sphere of Influence Most coffee that arrives in Houston stays in Houston. Most will go to Houston warehouses, such as Gulfwinds International or CADECO, before arriving at primary roasting facilities owned by Sara Lee and Kraft (Maxwell House). Some portion goes as far as Dallas/Fort Worth to the relatively new Mother Parker’s roasting facility. What does not stay in Houston can move as far as the West Coast. Houston functions as a land bridge to the West Coast. Coffee discharged in Houston will go as far as Los Angeles/Long Beach, Oakland, San Francisco, Portland, Tacoma, and Vancouver. Table 2.4 compares Houston’s hinterland to that of New Orleans. The Port of Houston also acts as a transshipment port to other ports. Houston’s sphere of influence is calculated from a listing of bill-of-lading destinations for coffee discharged in Houston or New Orleans. If transshipment is included, there would be wider areas of influence. In general, Houston spans north and west, while New Orleans with a few exceptions spreads north and east.
48 Datamar Consulting, Rio de Janeiro, Brazil. Data relates to Brazilian exports of coffee to the United States from 1998 to May 2001. 49 Ibid. 50 Ibid. 51 C.F. Marshall, The World Coffee Trade (Cambridge, U.K.: Woodhead-Faulkner Ltd., 1983), p. 208.

26
Table 2.4. Coffee Spheres of Influence (Inland Destinations)
Houston52 New Orleans53 Fort Worth, Texas Altamira, Mexico Los Angeles, California Cincinnati, Ohio Long Beach, California Houston, Texas New Orleans, Louisiana Jacksonville, Florida Oakland, California Miami, Florida Portland, Oregon Middletown, Ohio San Francisco, California New York, New York Seattle, Washington Norfolk, Virginia Vancouver, Canada Seattle, Washington Toronto, Canada
Source: Datamar Consultores, Rio de Janeiro, 2001. Summing Up This chapter has been primarily interested in delineating aspects and attributes of global trade important to an understanding of how coffee is traded and transported. The coffee industry is an amalgam of interwoven services as diverse as cupping and customs house brokerage. Ironically, these two examples share the common objective of working toward the liberation or release of coffee cargo from port holding areas. Yet the functions are entirely different. Customs house brokering handles documentation, while cupping deals with quality control and customer acceptance of the product upon arrival. The point here is that these services in the commodity and value chain have economic and transportation impacts. Further analysis will detail each step in the process in more detail relevant to the analysis of transport and trade impacts. This will demand analysis of commodity flows at the shipment level along a specified trade and transportation corridor. This chapter also highlighted global trends in coffee production. Brazil, as the leader in coffee production, leads the coffee market, though its influence is only a fraction of what it once was. Nevertheless, Brazilian coffee is important to the supply of U.S. coffee, approximately 15 percent of imports. Coffee ships through a variety of ports, but relies principally on just a few that benefit from having exchange status or are located near major regional roasters. In the Southwest, Houston and New Orleans are most significant. These ports have spheres of influence that radiate beyond their local market. In the case of Houston, much coffee finds its way to the West Coast. Containerization has made the coffee trade reliant on containers, up to 320 60-kg bags per TEU. Coffee acts as an anchor cargo along sea lanes, amounting to sizeable volumes of ocean shipping traffic. Such transport is increasingly relying on transshipment. U.S. bound cargoes from South America are transshipped at non-U.S. ports such as Puerto Cabello, Venezuela, Kingston, 52 A few small shipments have destinations in New York, Connecticut, and Georgia. 53 Though New Orleans ships some Brazilian coffee to the west, the volumes are not close to those going west from Houston.
27
Jamaica and Freeport, Bahamas. This means that the U.S.-Brazilian trade corridor depends on efficient port function at third nations where transshipment takes place. The next chapter goes into more detail on commodity flow at the shipment level of analysis. Case studies of coffee transport from Brazil to the U.S. through the ports of Santos, Vitória, and Houston are introduced in order to delineate the actual impacts of the transport process.

28
29
Chapter 3. Coffee from Brazil to Houston
Introduced to Brazil in 1727 from Suriname, coffee quickly ascended the hills or serras of São Paulo, Minas Gerais, and Espírito Santo. Historically, coffee was transported by donkey or cart to the coffee port of Santos on a trip lasting up to 30 days. The introduction of rail permitted the expansion of coffee plantations to the highlands and it has come to be grown in Brazil as far away as Rondônia. For satisfying the world’s thirst for the Brazilian bean, coffee is primarily exported from Santos and Vitória, each having a clearly demarcated sphere of influence. Santos serves Paraná, São Paulo, and southern Minas Gerais, while Vitória attracts coffee from Bahia, Espírito Santo, and Minas Gerais. Understanding how trade and transportation take place requires a survey of the coffee supply chain. From farm to exporting port, this study has selected the coffee producing regions of Minas Gerais and Espírito Santo (see figure 2.2), which export from the ports of Vitória and Santos. The coffee supply chain reveals a diversity of actors and institutions that play a role in shepherding green coffee from farm up to the port. They include shippers, exporters, traders, farmers and farming cooperatives, trucking companies, warehousing firms, customs house brokers, customs officials, and testers. This chapter follows coffee at a shipment level of analysis from producing regions in Brazil through exporting ports of Vitória and Santos and into the United States via the Port of Houston. From the point of view of a Brazilian exporter, the transportation logistics of coffee involve five phases that end with maritime transport on the domestic side: • Preparation • Inland transport to the port • Packing or stuffing • Loading and embarkation • Maritime transport54 However, the logistics of coffee continue at the destination country as coffee arrives at destination ports and undergoes a series of movements related to processing and distribution along the supply chain. Upon arrival at the port of entry, the following phases can be added: • Disembarkation and unloading (including intraport moves to staging areas) • Testing for phytosanitary compliance (United States Federal Drug Administration and United
States Department of Agriculture) • Nationalization of cargo via U.S. Customs • Sampling (cupping) for importer • Customer acceptance of cargo and shipment to local warehouse
54 José Dauster Sette, “Problemas de logística na visão do exportador brasileiro,” presentation made at the Twelfth International Seminar of Santos Coffee, 2000, available at: www.acs.org.br/seminar/int_sette.html, cited May 10, 2001.
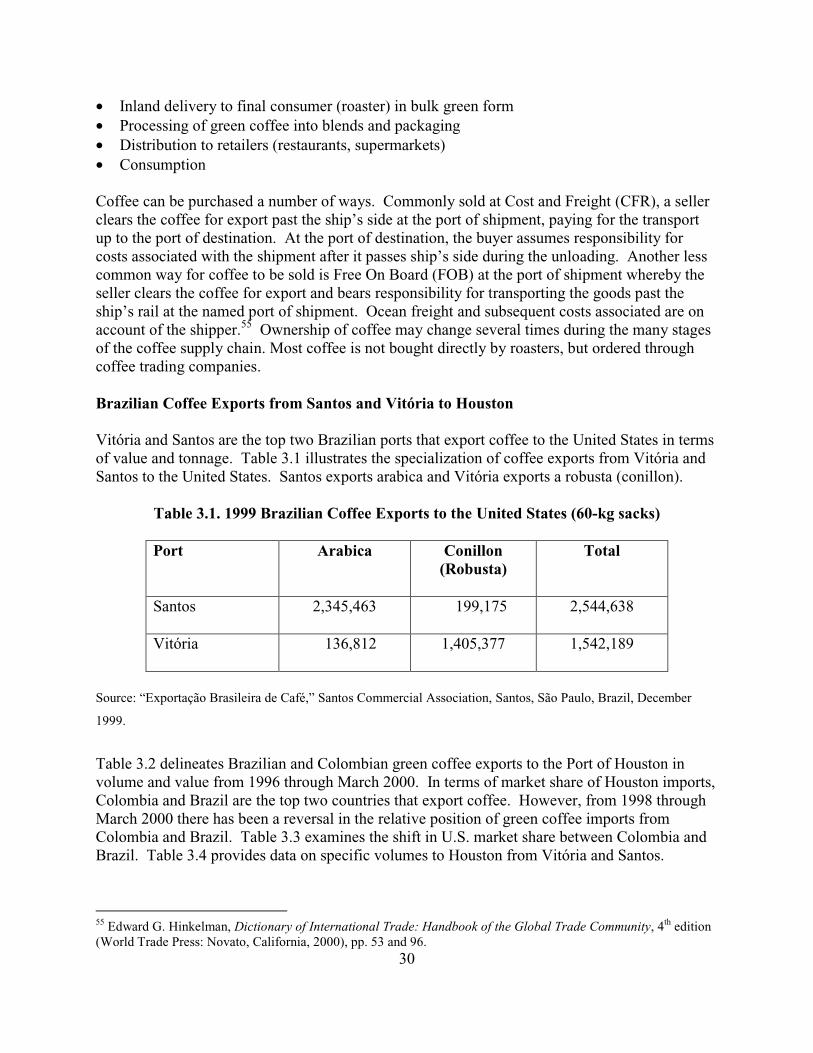
30
• Inland delivery to final consumer (roaster) in bulk green form • Processing of green coffee into blends and packaging • Distribution to retailers (restaurants, supermarkets) • Consumption Coffee can be purchased a number of ways. Commonly sold at Cost and Freight (CFR), a seller clears the coffee for export past the ship’s side at the port of shipment, paying for the transport up to the port of destination. At the port of destination, the buyer assumes responsibility for costs associated with the shipment after it passes ship’s side during the unloading. Another less common way for coffee to be sold is Free On Board (FOB) at the port of shipment whereby the seller clears the coffee for export and bears responsibility for transporting the goods past the ship’s rail at the named port of shipment. Ocean freight and subsequent costs associated are on account of the shipper.55 Ownership of coffee may change several times during the many stages of the coffee supply chain. Most coffee is not bought directly by roasters, but ordered through coffee trading companies. Brazilian Coffee Exports from Santos and Vitória to Houston Vitória and Santos are the top two Brazilian ports that export coffee to the United States in terms of value and tonnage. Table 3.1 illustrates the specialization of coffee exports from Vitória and Santos to the United States. Santos exports arabica and Vitória exports a robusta (conillon).
Table 3.1. 1999 Brazilian Coffee Exports to the United States (60-kg sacks)
Port Arabica Conillon (Robusta)
Total
Santos 2,345,463 199,175 2,544,638
Vitória 136,812 1,405,377 1,542,189
Source: “Exportação Brasileira de Café,” Santos Commercial Association, Santos, São Paulo, Brazil, December
1999.
Table 3.2 delineates Brazilian and Colombian green coffee exports to the Port of Houston in volume and value from 1996 through March 2000. In terms of market share of Houston imports, Colombia and Brazil are the top two countries that export coffee. However, from 1998 through March 2000 there has been a reversal in the relative position of green coffee imports from Colombia and Brazil. Table 3.3 examines the shift in U.S. market share between Colombia and Brazil. Table 3.4 provides data on specific volumes to Houston from Vitória and Santos.
55 Edward G. Hinkelman, Dictionary of International Trade: Handbook of the Global Trade Community, 4th edition (World Trade Press: Novato, California, 2000), pp. 53 and 96.

31
Table 3.2. Houston Coffee Imports from Brazil and Colombia
Year Brazil
Colombia
Volume (thousands of metric tons)
Value (constant US$
millions)
Volume (thousands of metric tons)
Value (constant US$
millions)
1996 15.4
32.2
24.8
65.0
1997 21.0
70.8
21.1
81.3
1998 35.1
80.1
21.5
66.2
1999 50.0
80.1
19.0
46.2
2000 (Jan.-Mar.)
7.6
14.4
4.7
14.0
Source: U.S. Waterborne Trade Atlas, U.S. Bureau of the Census, Washington, DC, various years.
Table 3.3. Market Share of Houston Coffee Imports (% of total)
Year Brazil Colombia Volume Value
Volume Value
1996 24.8
21.9 39.8 44.7
1997 35.8
33.4 36.1 38.4
1998 42.3
38.5 25.8 31.9
1999 48.8
42.6 18.5 24.5
2000 (Jan.-Mar.)
44.3 38.2 27.2 37.2
Source: U.S. Waterborne Trade Atlas, U.S. Bureau of the Census, Washington, DC, various years.
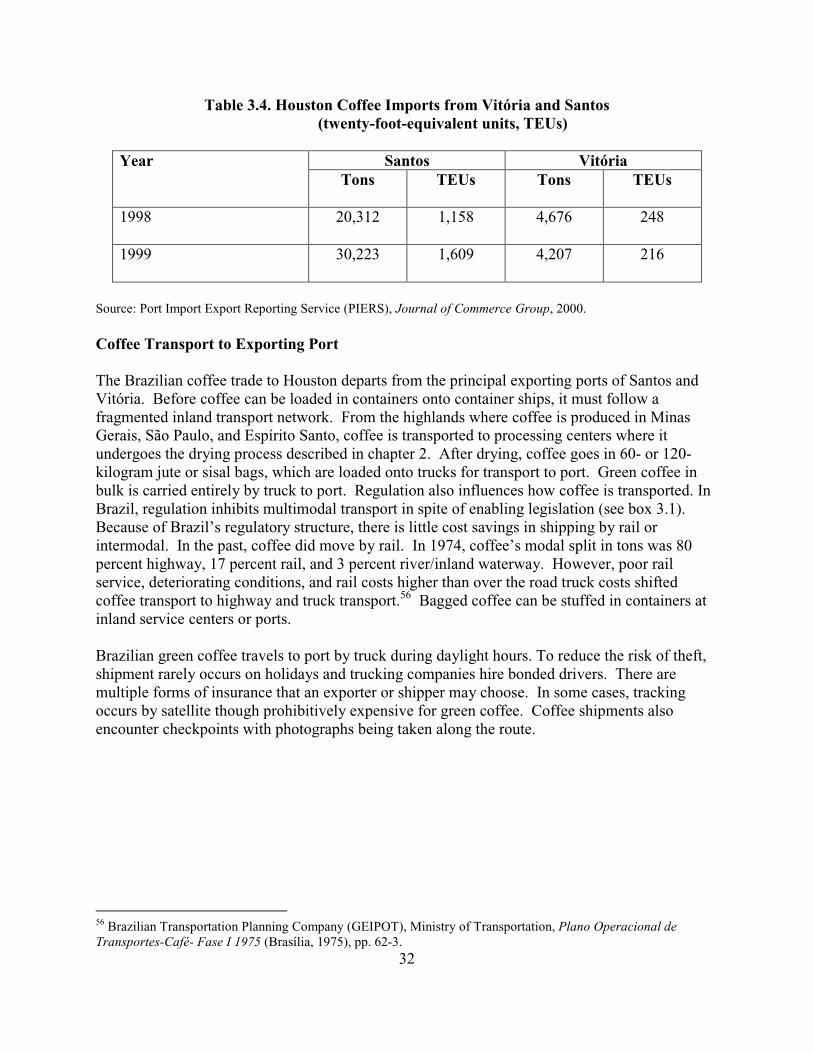
32
Table 3.4. Houston Coffee Imports from Vitória and Santos (twenty-foot-equivalent units, TEUs)
Year Santos Vitória Tons TEUs
Tons TEUs
1998 20,312 1,158
4,676 248
1999 30,223 1,609
4,207 216
Source: Port Import Export Reporting Service (PIERS), Journal of Commerce Group, 2000. Coffee Transport to Exporting Port The Brazilian coffee trade to Houston departs from the principal exporting ports of Santos and Vitória. Before coffee can be loaded in containers onto container ships, it must follow a fragmented inland transport network. From the highlands where coffee is produced in Minas Gerais, São Paulo, and Espírito Santo, coffee is transported to processing centers where it undergoes the drying process described in chapter 2. After drying, coffee goes in 60- or 120-kilogram jute or sisal bags, which are loaded onto trucks for transport to port. Green coffee in bulk is carried entirely by truck to port. Regulation also influences how coffee is transported. In Brazil, regulation inhibits multimodal transport in spite of enabling legislation (see box 3.1). Because of Brazil’s regulatory structure, there is little cost savings in shipping by rail or intermodal. In the past, coffee did move by rail. In 1974, coffee’s modal split in tons was 80 percent highway, 17 percent rail, and 3 percent river/inland waterway. However, poor rail service, deteriorating conditions, and rail costs higher than over the road truck costs shifted coffee transport to highway and truck transport.56 Bagged coffee can be stuffed in containers at inland service centers or ports. Brazilian green coffee travels to port by truck during daylight hours. To reduce the risk of theft, shipment rarely occurs on holidays and trucking companies hire bonded drivers. There are multiple forms of insurance that an exporter or shipper may choose. In some cases, tracking occurs by satellite though prohibitively expensive for green coffee. Coffee shipments also encounter checkpoints with photographs being taken along the route.
56 Brazilian Transportation Planning Company (GEIPOT), Ministry of Transportation, Plano Operacional de Transportes-Café- Fase I 1975 (Brasília, 1975), pp. 62-3.

33
Box 3.1. Impediments to Multimodal Transport in Brazil Limited modal choice has meant that competitiveness focuses on trucking and road haulage transport companies. Coffee shippers, by and large, do not own their own fleet. They seek reliable business relationships with trucking firms in the absence of transport alternatives. In addition to the regulatory bottlenecks, the trucking firms themselves must be weary of a dilapidated highway network. During the 1990s, Brazil privatized much of its transportation network, including some major highways. For the major routes over which coffee travels, this has meant waning or nonexistent investment in new construction and maintenance. Figure 3.1 shows the major links connecting coffee-producing regions to Santos and Vitória. Except for the major arterial highways, which are divided highways, the average Brazilian Interstate Highway (BR) is a two-lane undivided highway. Since the end of the Brazilian Coffee Institute in the 1980s, many services to the coffee industry have relocated outside of Santos. More exporters are locating close to the source, establishing intermediate processing and warehousing facilities in the coffee producing regions. Value-added services such as quality control, customshouse brokering, and trading still occur at ports, but warehousing, container stuffing, and processing are more closely tied to the producing region. This is not the case in Vitória, which boasts the Palacio do Café, a luxurious 15-floor building opened in 1989 to house coffee trading companies and testing facilities. There are warehousing, testing, and quality control facilities at the Port of Vitória. Containerized coffee originally met with skepticism in the global trading community. The bean, which absorbs foreign content very easily, was feared to pick up metal flavor or taint from other products. This
Brazil has tried to remedy its lack of modal choice for transportation. In 1998, the Brazilian Congress passed the Multimodal Transport Operator Law, which would permit a multimodal transport operator to present a single bill of lading offering a door-to-door service across all modes. This law was implemented as of April 13, 2000 and a special commission for registering multimodal transport operators was established in May 2000. What has kept this law from being effective is the value-added sales tax regime (ICMS), which is levied at each transition point in different states. Therefore, a multimodal shipment of coffee in a container would be taxed not only at its origin but also at its transfer point before arriving at final destination. Current ICMS taxes are approximately 17.5 percent of a good’s value. Without changing the tax laws regarding the value-added sales tax or ICMS, there is a disincentive to use multimodal transport. A second major disincentive to multimodal transport surrounds the issue of insurance. In December 2000, a national commission was charged to oversee implementation of the insurance provisions of the Multimodal Transport Operator Law. The multimodal operator bears responsibility for insurance for transport across different modes. However, these issues, still in early implementation, have to be challenged before effective implementation of the Multimodal Transport Operator Law of 1998.
34
fear has been shown to be unfounded, but coffee does require that containers show no signs of chemical treatment and have some form of climate control to regulate moisture and temperature. A twenty-foot equivalent unit (TEU) can carry about 250-60 kg sacks. When a TEU is outfitted with special plastic lining, this amount can exceed 320 sacks. Some major roasters, who use vacuum suction of coffee direct from container to warehouse choose lined containers. Vitória has a sphere of influence attracting coffee produced within a radius of 250 km. This covers producing regions in Minas Gerais, Espírito Santo, and Southern Bahia. The major highways that serve Vitória are Brazilian Highway 101 (BR-101), which runs along the coast connecting the Northeast with the Southeast. It is the Brazilian equivalent of US 1 or Interstate 95. Linking Belo Horizonte, capital of Minas Gerais to Vitória is BR-262 running East-West. BR-259 is another major highway that runs from Vitória in a northwesterly direction. Santos serves a wider ranging region than Vitória extending 1,000 km to areas in northern Paraná, southern Minas Gerais, and the hilly regions of São Paulo. Figure 3.1 shows the major highway routes serving coffee production centers in Paraná, São Paulo, and Minas Gerais. It is worth noting the number of highways that converge on the city of São Paulo. With no effective by-pass, navigating through São Paulo is wrought with delays. From the southeast sector of the city, travel time to Santos is one-and-a half hours. Port Operations at Vitória and Santos Brazil has undergone a port modernization program based on the 1993 Port Modernization Law. The main objective of the 1993 law was to reduce the average stevedore gang size in order to reduce port costs. Until 1993, the size of work gangs was set by the labor unions. With collective bargaining agreements over wages also negotiated between unions, port users, and the port authorities, this meant that the stevedores and port labor unions effectively set the price of doing business in Brazilian ports by determining how many laborers work, who works, how long and for how much compensation. The 1993 law, based on a similar initiative in Belgium, created a third institution to mediate between port users and port workers. The Port Labor Management Organization (Orgão Gestor de Mão de Obra, OGMO) with deliberative powers to set gang size comprises representatives of the labor unions, port users, the government, and port authorities. Nevertheless, until March 2001, OGMO Santos was powerless and the stevedores union set the work gang size. A private port operator at Tecon-Santos Brasil Container Terminal estimates that Santos needs only 3,000 of the 11,000 stevedores registered. Though the legislation is national in scope, its implementation is a local negotiation at each port between stevedores, longshoremen, port users, port authorities, etc. In Vitória, the OGMO distributes jobs to all labor unions except the stevedores union, which still determines how many work in its jurisdiction.57
57 Interview by John Cuttino with Daniel Kneip, Financial Managing Director, Espírito Santo State Port Workers Union, Vitória, Espírito Santo, August 21, 2000.

35
Figure 3.1. Brazilian Interstate Highway Network Serving Coffee Transport
Source: “Principais Rodovias Federais: Região Sudeste,” Ministry of Transportation, Government of Brazil,
Ministry of Transportation web site, available at: http://www.transportes.gov.br, cited June 19, 2002.
36
Taking as an example the collective bargaining agreement between the port users union and the labor unions at the Port of Vitória, negotiations include seven different unions. They are: • Port Operators Union • Longshoremen’s Union • Stevedores Union • Port Workers and Casual Workers Union • Tallyman Union • Watchmen’s Union • Cooper’s Union Pursuant to the collective bargaining agreement, all fees and salaries for each type of port service are negotiated. The OGMO is empowered to choose, by lottery system, the workers who will provide such service. For coffee arriving at the Port of Vitória in containers, one team of longshoremen charge US$27.74 (R$47.15) per day per person to move containers within the port. Stevedores assigned to move full containers are paid US$22.74 (R$38.65) per day. Stuffing the container at the port costs US$6.82 (R$11.59) per ton for one team comprising four men and foreman with a minimum work order of six containers. Crane moves per container cost US$16.31 (R$27.73). If containers are to be consolidated for shipment, labor earns US$7.42 (R$12.62) per TEU. A forklift move of a container runs US$4.95 (R$8.41) per unit, while use of a transteiner costs US$7.42 (R$12.62) per unit. 58 The normal working day comprises four six-hour shifts; (1) the first shift begins at 7:00 am and extends to 1:00 pm, (2) the second shift runs from 1:00 pm to 7:00 pm, (3) the third shift from 7:00 pm to 1:00 am, (4) the fourth shift starts at 1:00 am and continues to 7:00 am. Workers receive normal pay during the first and second shifts on weekdays. After 7:00 pm, workers receive a 50 percent increase in salary on weekdays. On Saturdays, labor receives a 30 percent increase for work on the second shift. The third and fourth shifts receive a 95 percent increase on the normal salary on Saturday. On Sundays and holidays, the increases are 100 percent during the first and second shifts and 200 percent during the third and fourth shifts. Though Vitória operates 24 hours a day, labor costs increase significantly after 7 pm and on weekends and holidays.59 Collective bargaining agreements are contracts that remunerate labor for each service rendered. The strength of port labor unions has made simplification difficult. Of the port costs at Vitória’s container terminal, Terminal Vilha Velha (TVV), cargo handling accounts for 63.5 percent of the port cost.60 Table 3.5 presents the box rate costs at the ports of Santos and Vitória. 58 Port of Vitória Collective Bargaining Agreement (Convenção Coletiva de Trabalho), Vitória, Espírito Santo, April 22, 1999. A currency conversion was made using the commercial exchange rate for April 22, 1999, published in Estado de São Paulo newspaper on April 23, 1999. 59 Port of Vitória Collective Bargaining Agreement. 60 Brazilian Transportation Planning Company (GEIPOT), Serviços Portuários 1999, Brasília, Brazil, available at: www.geipot.gov.br/servicosportuarios, cited November 29, 2000.
37
Brazilian port authorities are sustained by terminal handling charges they pass on to customers. Imbued with important port functions such as channel dredging, the port authorities do not see terminal handling charges as a kind of congestion pricing to act as an incentive or disincentive to shippers. Rather, the terminal handling charge sustains a historic bureaucracy. For ports like Santos with a heavy debt burden, ($250 million), increases in the terminal handling charge are ways to get more own-source funding for their activities. Vitória Vitória attracts coffee within a range of 250 kilometers. It draws from Minas Gerais, Bahia, and Espírito Santo. Espírito Santo grows a rare robusta called conillon, which does not grow well elsewhere in Brazil. Though it has the country’s most modern railway, the Vitória-Minas Railway (Estrada de Ferro Vitória Minas, EFVM) linking Belo Horizonte, Minas Gerais and Vitória, coffee is not transported by rail. Figure 3.1 shows the principal routes serving Vitória from its producer regions. Along the inland route, coffee is often transported in convoys. Among other things, this is done to reduce risk of loss by accident, damage, and theft. Of all factors affecting the inland haul in Brazil, theft may be the most prevalent. In 1997, 40,000 sacks were stolen amounting to losses in the millions of dollars.61 Often working with mechanical efficiency, bandits will steal trucks laden with coffee, employing a forklift to lift the trailer. Green coffee is virtually untraceable when stolen and remixed or labeled. One coffee executive of Café Três Corações, based in Minas Gerais, sends convoys of three trucks from his warehouses inland to the Port of Vitória. This is done under the expectation that, traveling alone, one may be robbed.62 Theft has forged the development of the satellite tracking system. At intermodal expositions and exhibits in South America, leading advertisers are those offering the service of satellite tracking by global positioning satellite. This has added to security and possibility of quick recovery, but it has also increased costs considerably. Coffee shippers benefit from satellite tracking if they hire a trucking service offering the service. At the Port of Vitória, containerized cargo is handled at the quay located in Capuaba, principally at the Vila Velha Terminal’s two berths, operated by the Vale do Rio Doce Company. Some movement occurs along the old quay at the Peiu Terminal’s one berth. Total quay length for these terminals amounts to 1,005 meters with depths of 9-11 meters. Total terminal area is 15 hectares. Outside the Port of Vitória, but within the metropolitan region of Greater Vitória, the Port of Tubarão handles containers at two berths at its Sundry Products Terminal (Terminal de Produtos Diversos, TPD).63
61 Sette, “Problemas de logística.” 62 Interview by John Cuttino with Rogério Azevedo Schiavo, Commercial Adviser, Café Três Corações Comércio e Exportação Ltda., Belo Horizonte, Minas Gerais, August 25, 2000. 63 Vale do Rio Doce Company (Companhia Vale do Rio Doce, CVRD), Serviços de Logística, Belo Horizonte, Minas Gerais, Brazil, n.p., August, 1999.

38
The average coffee shipment to Vitória arrives in trucks and is stuffed at the port. With port labor costs not too different from costs in the interior, the majority of stuffing coffee into containers occurs at the port. In addition to competitive labor rates, the availability of containers is another reason why stuffing occurs at the port. It is more difficult and costly to manage a supply of empty containers in the region served by Vitória than the highly urbanized industrial area of São Paulo served by Santos. Advantages of port stuffing are a closer inspection of the exported product by the exporter. Other services necessary to the export of coffee take place at the port. They include fumigation, weighing, inspection by the Ministry of Agriculture, packaging and sealing, inspection by Customs, transportation to quay, and issuance of final documentation.64 Maritime Freight Costs from Vitória to Houston As of May 2001, the liner services that offer regular scheduled service along the Vitória-Houston corridor are Crowley American Transport, Libra, Mediterranean Shipping Company, and Zim Line. Libra service runs a frequency of 14 days, while the other liner services offer service every seven days. In addition, other liner companies such as Aliança, which offers cabotage service along Brazil’s coast, also can offer service to Houston.65 Freight costs can vary significantly. A May 2001 rate quote for a full TEU shipped from Vitória to Houston cost a total of $2,985 plus an additional northbound surcharge of $155 and a terminal handling cost at Vitória of R$77.51. The components of the cost are: • Base ocean freight $2,900.00 • Documentation fee per Bill of Lading $ 50.00 • Terminal Handling Charge $ 35.06 • Bunker surcharge-Northbound $ 155.00 • Brazilian Terminal Handling Charge R$ 77.5766 An August 2001 estimate from the Greater Houston Coffee Association quoted ocean freight charges for coffee cargo from Brazil to Houston at $2,252 per container.67 It is worth noting that Houston was tied with New Orleans for offering the lowest cost of ocean freight for coffee between Brazil and the United States. Coffee exporters must rely on liner service for their shipment of raw unroasted green coffee. Many newly developed specialty coffees with high value are shipped by air, but the bulk coffee shipped in containers travels by sea. Waterborne commerce is subject to severe fluctuations in the global economy. As a result, many liner companies join in vessel sharing agreements to rationalize their capacity along certain routes. When maintaining a specific service is out of step with demand, liner conferences establish surcharges to accommodate freight imbalances. For 64 Sette, “Problemas de logística.” 65 Port of Houston Authority, Regular Scheduled All-Water Services, Houston, Texas, May 2001, pp. 5-6. 66 Aliança Navegação e Logística, Rate Quote, Aliança web site, available at: www.alianca.com.br [cited May 11, 2001]. 67 Greater Houston Coffee Association, Transport Module release, August 14, 2001, Houston, Texas.

39
example, in the rate quote from Aliança, there was a northbound surcharge. Such a surcharge can occur when there is less demand on the southbound cargo, i.e., Brazilian imports from the United States. Since the Brazilian currency devaluation in January 1999, Brazil’s exports became far more competitive. This is shown in some of the previous tables where Brazil supplants Colombia as leading coffee exporter to the United States. Santos Coffee arriving in Santos must descend 800 meters along the steep Serra del Mar. The hilly terrain strangles the route to and from Santos. On the descent, trucks must use low gear and speeds are very slow. However, on the ascent out of Santos toward the city of São Paulo, a tunnel provides some improvement as the trip is less steep. This is not the only obstacle facing inland transport along the 500 or 1,000 km route coffee may take to reach Santos. There is also the city of São Paulo. The major highways serving São Paulo converge in Greater São Paulo causing great delay. There is no effective bypass of São Paulo for freight coming to Santos from São Paulo’s interior or Southern Minas Gerais. In the case of coffee from Paraná, some coffee from the eastern half of the state may avoid São Paulo, but in general the city cannot be avoided. Historically, South America’s most important port, Santos, has undergone a modernization program focused on container facilities. At Santos, containers can be handled at a number of terminals, principally the Santos Brasil Container Terminal (TECON). Since 1997, Tecon is a public-use container terminal leased by the Santos Brasil S/A. Occupying a privileged position along the left bank of the estuary, it possesses two berths and 510 meters of quay at a depth of 13 meters. Tecon has a terminal area of 36.6 hectares, 19.8 hectares for stacking containers and 1.53 hectares with covered warehousing. Tecon operates five ship-to-shore container gantry cranes, three rail-mounted gantries, and 11 reach stackers. Tecon has highway access and rail access at a distance of 3,000 meters.68 On the right bank of the estuary, Terminal T-37 and Terminals 34/35 are operated by Libra Lines. With an area of 18 hectares, expansion is locked by the port’s major waterfront avenue, which borders the terminal. T-37 has 400 meters of quay, 12 meters depth, and two container berths equipped with three ship-to-shore container gantry cranes, three wheel-mounted gantry cranes. T-34/35 provide two more berths.69 Further up the estuary, the Paulista Steel Company, COSIPA, operates its own private port in the municipality of Cubatão. COSIPA Terminal has one dedicated container berth. It hosts a total area of 19 hectares. COSIPA Terminal does not fall within the jurisdiction of the Santos Port Authority. As a result, COSIPA may employ non-unionized labor and avoid collective bargaining agreements at Santos. The right bank has 22 other general use berths under management of the Santos Port Authority (CODESP) and berths with depths varying from 6.5 meters to 13.5 meters which can handle containers.70 68Containerisation International Yearbook 2001 (London: Informa Group). 69 Ibid. 70 Ibid.

40
Port Costs Table 3.5 illustrates the recent container costs at Santos and Vitória. The decrease in costs is primarily a function of the January 1999 devaluation of the Brazilian currency.
Table 3.5. Santos and Vitória Container Price Comparison (US$) Port/ Terminal
1997 1998 1999
Move Costs*
Port Entry/ Port Exit**
Total Move Costs*
Port Entry/ Port Exit**
Total Move Costs*
Port Entry/ Port Exit**
Total
Santos-T-37 341.20 54.91 396.11
Santos-Tecon
258.01 55.32 313.33 330.60 69.30 399.91 165.43 27.41 192.83
Santos-Right Bank
261.94 52.68 314.62 262.74 48.23 310.98 167.71 27.45 195.16
Vitória- 357.01 90.58 447.60
Vitória-TVV
190.69 96.54 287.23
Vitória-Peiu 172.27 998.36 270.63
Vitória-TPD 172.40 80.87 253.28
* Move costs are all those incurred in the handling of a container until it passes the ship’s rail. They include stevedoring and longshoreman costs. ** Port entry/exit costs are those related to harbor entry and include dockage, tug fees, pilotage, security, and bureaucratic fees related to the harbor call. Source: Brazilian Ministry of Transportation, GEIPOT, Acompanhamento dos Precos e Desempenho Operacional
dos Servicos Portuarios (Brasilia, December 2000), p. 112.
For an idea of how logistics contributes to pricing of Brazilian exports. A coffee exporting association noted the following contributions to coffee costs on a per bag basis. It should also be noted that these do not reflect administrative and ancillary costs. The average cost of a bag of coffee in 1997 was US$189.66; logistics was reflected as 5.3 percent of the average price per 60-kg bag.71
71 Source: “O Fluxo e o Custo da Logística,” available at www.café.com.br/trabalho/ mercado/logistica/7.htm, cited February 9, 2001.

41
Table 3.6. Logistics Costs (1997)
Item Cost per bag US$ Preparation 4.00 Inland freight 2.50 Reconditioning 1.40 Stuffing 0.80 Handling 0.60 Other 0.70 Total 10.00
Source: “O Fluxo e o Custo da Logística,” available at www.café.com.br/trabalho/
mercado/logistica/7.htm, cited February 9, 2001.
Maritime Freights from Santos to Houston Santos is served by a large number of regularly scheduled liner services. They are: Aliança, Columbus Lines, Crowley American Transport, Global Lines, Libra, Lykes Lines, Mediterranean Shipping Co., Ocean Bulk Liner Inc., P&O Nedlloyd Container, TMM, Wallerius/Wilhelmson Line, and Zim Line. These liner services have frequencies from once every seven days to once every 30 days.72 Vessel sharing agreements allocating capacity make it possible for each liner service to offer frequent service on vessels that it does not necessarily own or operate. A May 2001 freight quote from Aliança broke down the following charges for transport of one TEU of green coffee from Santos to Houston: • Base Ocean Freight $ 2,400.00 • Bunker surcharge-Northbound $ 155.00 • Documentation fee per Bill of Lading $ 50.00 • Terminal Handling Charge $ 81.36 • Brazilian Terminal Handling Charge R$ 180.00 Compared to Vitória, the freight charge is less but it is worth noting the higher terminal handling charge (THC) levied by the Santos Port Authority (Companhia das Docas do Estado de São Paulo, CODESP). The THC goes directly to CODESP for its operations and administration. If a port like Santos in financial arrears cannot make payments on its dredging contracts or debt service, it can raise revenues by elevating the THC. This is a deterrent to port activity. Coffee Arrival at Houston From Santos, the maritime voyage takes approximately 21 days depending on the liner service’s route structure (sling). Houston often occupies a place on northbound slings as last off, and last on for southbound for U.S.-Latin American trade. Aliança’s service from Santos calls Salvador,
72 Port of Houston Authority, Regular Scheduled All-Water Services, pp. 5-6.
42
Cartagena, Colombia, Kingston, Jamaica, New Orleans, Houston, Altamira, Mexico, and Veracruz, Mexico.73 Upon coffee’s arrival at the Port of Houston’s Barbour’s Cut Container Terminal, the coffee container is offloaded by container gantry crane to the terminal area. The container is stored on the premises as it is prepared for nationalization into the United States. In 1999, the Port of Houston had a box rate of $185. Once the container is moved to warehousing on the premises, it can undergo weighing, fumigation, sampling, customs clearance, and USDA and FDA inspection. The types of charges occurring on a coffee shipment upon arrival in Houston during August 2001 included: • USDA charge $10-25 • FDA charge $10-25 • Customs entry $75-150 • Wharfage charged by Houston $2.87 per metric ton • Sampling $12 per sample plus airfreight • Inbound Handling $ 0.0775 per bag • Outbound Handling $ 0.0775 per bag • Weighing $ 0.325 per bag • Reconditioning $12 per bag • Cleaning $0.0050 per pound • Blending $0.0075 per pound • Palletizing $0.0015 per pound • Storage $0.31 per bag on average after 15 days grace period • Screening $20 per unit • Fumigation of import container $85 per unit • Segregation of damaged cargo $0.75 per bag • Disposal of damaged coffee $1 per bag74 The documentation and sampling phases are most important to advance coffee from the port to a local warehouse. Import documents are received and processed by freight forwarders to clear customs, USDA and FDA phytosanitary standards. Also, the U.S. Drug Enforcement Administration (DEA) may inspect suspicious cargo. Once cleared through Customs duties and other government inspection, the importer checks the quality of the cargo by sampling before accepting the coffee and hauling it off the port’s premises.75 As explained in chapter 2, several samples of coffee are taken and sent to a laboratory for processing. A sampler opens up a container, extracts samples of green coffee, and sends them via air freight to a laboratory. This operation can take up to three days. Once approved, if the coffee has passed all inspections, it is loaded onto truck and taken to local warehousing or shipped by rail or truck to other parts of the country.
73 Aliança Navegação e Logística, “Transit Time,” Houston, Texas, n.p., n.d.. 74 Greater Houston Coffee Association, Transportation Module, Houston, Texas, August 14, 2001. 75 Interview by John Cuttino with Charlotte McCanless, Bill Potss Company, Houston, Texas, July 17, 2001.

43
As of August 2001, over the road freight charges from Houston to Fort Worth cost $800 per TEU. Coffee traveling farther west uses a combination of truck and rail service. Far west freight charges for transport from Houston to Oakland are $979 per TEU. Transport to Local Roasters in Houston Green coffee is a commodity that must be roasted before moving to retail and sale to the common consumer. In Houston, Sara Lee and Kraft (Maxwell House) have roasting operations. In Fort Worth, Mother Parker’s has roasting operations. There, the origin of the bean is lost in roasting and blending. After blending and packaging, coffee makes its penultimate transport to wholesalers or retailers before finally being served at a restaurant or hotel or being purchased at a supermarket, specialty store, or coffee shop. The Coffee Corridor The economic impact of coffee export to the United States spreads across a vast physical and virtual landscape. The movement of just one container filled with 250 or 320 60-kg bags requires a multitude of actors and services. So far we have presented the services in stages such as production, preparation, transport to port, port handling, maritime transport, arrival at destination port, processing of documents and liberation of cargo, and inland transport to final destination. But to reduce the transport of coffee to several stages limits its observed economic impact. The economic impact of coffee when understood from a trade corridor unit of analysis brings into discussion services that are not necessarily located at the origin or destination of cargo. Yet they are physically an important part of the transportation corridor. These include lab testing facilities, trading houses, customshouse brokers, and freight forwarders, and maritime companies. This chapter has put forth the various stages of coffee movement from the producer regions in Brazil through the Ports of Vitória and Santos across the ocean to the Port of Houston and into the U.S. processing and distribution chain. In order to further delineate the coffee corridor, it becomes necessary to narrow the analysis to tracing one shipment as it works its way through the supply chain. In this way, a clearer picture of cumulative economic impacts is revealed, exposing nonquantifiable benefits and bottlenecks. Tracing a Specific Coffee Shipment In order to best illustrate the trading and transport process, this section follows a specific freight shipment along a complete supply chain. While previous sections of this chapter have described the trading and transport process in general, more exacting impacts and determinants thereof are only visible at the scope of the individual shipment. The selected shipment follows a single container shipment of green coffee from the interior of Minas Gerais and exported through the Port of Vitória to the Port of Houston and beyond.

44
The sample container we are following shipped from Vitória aboard the Libra Buenos Aires on July 4, 2000 arriving in Houston on July 17, 2000.76 The coffee was purchased from the Café Três Corações Company by Kraft, which produces the Maxwell House brand of coffees. It should be noted that most coffee is not purchased directly by coffee roasters, such as Kraft. Rather, coffee trading companies order and purchase the coffee for the major roaster. In the case of the sample shipment, Kraft directly purchased this shipment, making the order from its Tarrytown, New York headquarters, which handles purchasing. From Harvest to Mill Café Três Corações, a top five coffee company, receives its coffee from the rich hillsides of the Serra do Caparão in eastern Minas Gerais near the municipalities of Realeza and Manhuaçu (see figure 3.2).77 Small- and medium-sized producers pick the coffee by hand owing to difficult mountainous terrain. The harvested coffee cherries are then transported by truck to the patio at the farm (fazenda) for open-air drying. Transport costs accrued while on the farm are miniscule amounting to just 0.4 percent of the total cost of the finished blend as measured on a per bag basis. On average, it takes 19 days after harvest for the coffee cherries to have dried and washed. Labor costs at that time per bag amounted to R$48 per bag or US$26.52 using currency exchange rates from July 3, 2000. Labor costs have since fallen dramatically to R$32 per sack in 2002.78 Using currency exchange rates from May 13, 2002, this further reflects a 48 percent drop in labor costs to US$12.70 per bag. At several fazendas, coffee involved in this shipment was bagged into 2,038 sacks and trucked to warehouse and processing facilities in nearby Manhuaçu (see figure 3.2). Transport to Manhuaçu generated costs around R$0.30 per bag (or 17 cents per bag). There, the sacked coffee cherries are unloaded from trucks and emptied into an automated process, which denudes the cherries, leaving only the coffee bean. In this process, coffees of similar quality from nearby fazendas are processed together. For this shipment, the fazenda furthest from the processing facilities at Manhuaçu was just 35 kilometers away. Though Café Três Corações has roasting facilities in Santa Luzia near the state capital of Belo Horizonte, this shipment does not undergo roasting. After separating the beans from the cherries, the Manhuaçu facility with a capacity to blend 3,500 bags per day mixes the beans into a blend, set to exacting standards. Processing costs at Manhuaçu amounted to R$3.00 or US$1.65. For this shipment, just a few workers are needed for unloading the coffee and moving it along the automated process. Before transport to the port, the raw green coffee is sacked into the familiar 60-kg sacks and loaded onto trucks.79 Inland Transport to Port This shipment of 320 sacks was made in tandem with another shipment of 640 sacks. Thus, 960 bags were transported in a convoy of two trucks and a trailer. While trucks can hold 250 bags, a
76 Brazilian vessel manifest data, Datamar Consultores, Rio de Janeiro, 2000. 77 Café Três Corações ceased to operate for export in November 2000. While the company still maintains a strong doemstic presence, export activities have been reorganized under Atlântica Café. 78 Email from Marcelo Mares Esposito, Sales Manager, Café Atlântica, Belo Horizonte, Minas Gerais, “Survey Questionnaire,” to John Cuttino, May 29, 2002. 79 Ibid.
45
trailer can carry 450 bags. Accompanying the three trucks, each with one driver, is an escort car of two guards. The journey is made during daylight hours to a stuffing terminal located at the Port of Vitória. The distance is 250 kilometers and follows the major federal highway connecting Belo Horizonte and Vitória, BR-262. With an average speed of 50 kilometers, the trip takes approximately five hours traveling slowly over steep terrain. While robbery is not as significant on this route as on others, poor road conditions and physical geography do present obstacles and slow the trip. The freight cost for transporting the sacked coffee in three vehicles, an escort car, plus insurance is R$1.62 or US$0.90 per bag.80 Arrival at Port and Port-related Activity When the convoy arrives at the port stuffing terminal, the bags are unloaded and subsequently stuffed into containers. These containers are then transported via an intraport rail link directly to the maritime carrier. Three hundred and twenty bags constituting a volume of 19.2 metric tons were stuffed into one container that was then loaded onto the Libra Buenos Aires. Café Três Corações sold this order to Kraft, with facilities in Houston. Selling Free on Board named port of shipment (FOB) means that Kraft assumed the ocean freight and all costs once loaded onto the Libra Buenos Aires. Sold FOB, this shipment was sold for approximately R$156.39 per bag, valuing the coffee at R$50,044.80.81 Waterborne Transport from Vitória to Houston Containerized coffee travels by ocean liner. Liner services offer frequent direct service from Vitória to Houston. A standard containerized shipment of coffee is a twenty-foot equivalent unit container holding 320 60 kg sacks of green coffee. The sample container followed here shipped out of Vitória on board the Libra Buenos Aires on July 4, 2000 bound for Houston. The Libra Buenos Aires sailed along the following rotation during voyage V-34N82:
• Vitória, Brazil • Puerto Cabello, Venezuela • Veracruz, Mexico • Altamira, Mexico • Houston, Texas • New Orleans, Louisiana
The Libra Buenos Aires arrived at 6:45 am in Houston on Monday, July 17, 2000 docking at Barbour’s Cut container terminal berth 1. It departed Barbour’s Cut at 12:30 am on Wednesday, July 19, 2000. 80 Ibid. 81 Ibid. Using the commercial exchange rate of R$1.81 to the $1.00 on July 3, the sale price for this shipment converts to $27,649.06. It should be noted, however, that coffee orders are made months in advance and final sale price in R$ may be subject to exchange rate variation at the point of sale. Thus, the dollar figure may not be accurate. 82 V-34N is the voyage number for this rotation of the Libra Buenos Aires.

46
The Libra Buenos Aires carried cargoes assigned to TMM, Crowley, Libra, and Lykes. Lykes operates under the management framework of Canadian Pacific Ships. CP Ships Americana consortium includes Libra, Lykes, and TMM. According to Libra’s rate schedule, the tariff for transporting one container of coffee from Vitória to Houston during this time period was $1850.83
Figure 3.2. Transport Route of Sample Coffee Shipment
Source: “Estado de Espírito Santo,” Ministry of Transportation, Government of Brazil, Ministry of Transportation
web site, available at: http://www.transportes.gov.br/bit/estados/iport/mg.htm, cited June 19, 2002.
83 “USA Tariffs,” Libra web site, available at: http://www.libra.com.br, cited April 22, 2002.
47
Arrival at the Port of Houston Barbour’s Cut Terminal The Barbour’s Cut Terminal is located on Morgan’s Point on the northwest shore of Galveston Bay. It hosts six 1,000-foot long container vessel berths at a channel depth of 42 feet. Occupying more than 250 acres, the terminal storage area has space for 21,000 TEUs. A few days before arriving at the Barbour’s Cut terminal, the customshouse broker, Bill Potts Company, Inc., prepares the necessary documentation and arranges for the container to be unloaded. Once the container of coffee is unloaded from the ship. It goes to a holding area at the terminal. There, the customshouse brokers work to clear the container through U.S. Customs and the U.S. Food and Drug Administration (FDA). Both the FDA and Customs assess fees ranging from $10-25 on each shipment of coffee. At the same time the shipment waits to meet Customs and FDA approval, the buyer of the coffee must finally agree to accept the cargo and arrange for payment. In the coffee industry, it is common to use letters of credit for transferring ownership of coffee. Verifying these letters of credit often stalls the process. In fact, delays in relaying information between the banks, customshouse brokers, and the shipper cause the principal delays in the transport process on arrival in the U.S.84 Before the container is trucked out of port, it must also meet the approval of the purchaser. This occurs through the process of sampling. In the case of the sample shipment, the container from Vitória contained Café Três Corações coffee beans shipped to Kraft Food, which roasts coffee in Houston for Maxwell House. When the shipment arrived, a sampler draws coffee from the container. The sampler meets the container at the waterfront and takes a representative sample of two-three pounds of green coffee. Pulling the right hand door of the container open, a sample is drawn from 25 different bags then sent overnight via air freight to the roaster’s laboratories where the coffee is tested. For Kraft, the sample is sent via FEDEX or Airborne Express to labs in New York. Kraft requires that the samples be placed in thick plastic Ziploc bags. Samples are normally tested within two days for certain weight, physical characteristics, and chemical composition. Once the labs notify whether or not the product is up to specifications, the container can be taken from Barbour’s Cut Container Terminal if it has cleared FDA and Customs.85 In August 2001, sampling cost $12 per sample plus airfreight charges. Typically, a container yields three samples. Drayage from Barbour’s Cut to the Intermediate Warehouse Facility While the container is waiting at the Barbour’s Cut Terminal, a wharfage cost of $2.87 per metric ton is assessed, payable to the Port of Houston Authority. For this shipment of 19.2 metric tons, wharfage costs approximately US$55. Local drayage costs for transport from the terminal to the warehouse or roaster are approximately US$300 per TEU from Barbour’s Cut. All Kraft coffee runs through CADECO Industries, a coffee warehousing firm, which also can perform value-added services such as storage, screening, sampling, reconditioning, weighing, cleaning, and blending. One truck transports one TEU from Barbour’s Cut to CADECO, located approximately 25 miles away. Two-person crews can unload a normal container filled with 250-kg bags from the container in less than an hour. Average inturn handling charges are 7.75 cents
84 McCanless interview. 85 Telephone interview by John Cuttino with A.H. Sheffield, Sampler, Houston, Texas, July 17, 2001.
48
per bag. But one of the characteristics of Kraft is that it employs the use of containers imbued with a plastic liner. This accommodates bulk bags amounting to the equivalent of 320 60-kg bags instead of a normal TEU of 250 bags. What makes this appealing is that such a container can arrive with bulk bags and be gravity-fed into a silo. This occurs at CADECO’s facility as the inbound truck tilts the container to the gravity-fed conveyor, which blows the coffee into the silo for storage. While it would take a two-man crew 45 minutes to unload coffee in 60-kg bags, the gravity-fed technique only requires 20 minutes.86 When coffee is to be sent to Kraft for roasting, the coffee is blown back into bulk bags and transported by truck. Costs for transporting from CADECO to Kraft are estimated at US$100.87 Roasting at Kraft Once the coffee has arrived at the Kraft roasting facility in Houston nearby CADECO Industries, the shipment ceases to be traceable. The Brazilian green coffee is stored in silos with other coffees and ultimately blended at Kraft’s roasting facility according to specifications of the products in production. This can include gourmet estate coffees, supermarket brands, restaurant and hotel brands. It is at this point that the shipment is transformed into several different product types possibly arriving in local restaurants, supermarkets, or coffee houses. Kraft turns the sample shipment into the Maxwell House brand of coffees, where it could have made it into many homes in the Houston region or none at all. Conclusions and Intangibles along the Coffee Corridor Using the trade corridor as a unit for analysis, this chapter has delineated the coffee corridor between the United States and Brazil (Houston and Vitória). Following the transport of coffee from origin to destination has revealed a supply chain through which we can quantify cumulative impacts. Later, chapter 6 presents a summary of the cumulative impacts of the sample shipment of coffee and steel. In so doing, nonquantitative determinants of trade and economic impacts are brought more clearly into view. On the Brazilian side, regulation, theft, and an absence of modal choice are some of the most pressing problems. On the United States side, congestion at Barbour’s Cut and documentation delays account for some of the problems. But by and large, the heavy trade in coffee from Brazil to Houston takes place over a successful transportation corridor. What makes it a successful corridor may be the range of value added services that Houston offers for coffee importers. Specialized freight forwarding, frequent liner service, major roasters, rail access to the West Coast, low port costs, specialized warehousing, and sampling services all contribute to the success of the Houston side of the corridor. Among the intangibles found on both sides of the Houston-Brazil trade corridor are port-based organizations dedicated to improvement of the coffee trade and transportation. The Greater Houston Coffee Association (GHCA), founded in August 2000, came into being to market Houston as a coffee destination and eventually seek coffee exchange status from the New York Board of Trade. Currently just New York, Miami, and New Orleans have coffee exchange status. Houston, already a large importer of coffee, could trade its coffee on the exchange if it 86 Ibid. 87 Telephone interview by John Cuttino with Capt. Alistair Macnab, Executive Secretary, Greater Houston Coffee Association, Houston, Texas, June 20, 2002.
49
were granted exchange status. Moreover, the likelihood that services related to coffee would locate in Houston increases if the port gains approval by the NY Board of Trade. However, before being recognized by the NY Board of Trade, Houston would have to improve the business environment for coffee interests and eliminate a tax on coffee. The GHCA successfully promoted a statewide ballot referendum in November 2001, eliminating the Harris County inventory tax on green coffee. This has strengthened Houston’s petition to seek coffee exchange port status, under consideration of the NY Board of Trade by June 2002. Though not quite as specifically organized as the GHCA, an important organization involved in transportation and trade of coffee in Brazil is the Mercosul Atlantic Corridor Consortium. The consortium assembles the major actors involved in the trade and transportation of coffee through its port-based integration roundtables. Integration roundtables, such as those based in Rio de Janeiro, Vitória, and Belo Horizonte address issues related to transport of coffee by bringing together the horizontal integration of the supply chain. In this way, the Mercosul Atlantic Corridor Consortium has been able to explore the possibility of reactivating the rail mode for transport of coffee by entering into negotiations with trucking companies, railroads, port terminal operators, and coffee companies. After decades of neglect, the Mercosul Atlantic Corridor Consortium is trying to attract multimodal coffee transport from the Varginha, Minas Gerais area to Rio de Janeiro making use of a non-unionized port near Rio de Janeiro in Guanabara Bay. If so, it will mark a major new alternative for coffee export. In both the United States and Brazil, at both ends of the trade corridor, active port-based organizations articulate the needs of a corridor and are seen as having beneficial impacts on economic development and the business climate. Such organizations may distinguish more successful trade corridors from less successful ones.

50
51
Chapter 4. The Steel Commodity Chain and U.S./Brazilian Trade
Characteristics of the Global Steel Trade Steel production takes place in a multi-stage process. Taking inputs of iron ore, coke, and coal, steel is created, becoming the input for an array of industries and products. Steel production involves very complex and coordinated processes at the global level, which require much harmonization along production, distribution, and marketing chains. In Europe, integrating steel production, transportation, and consumption fueled efforts to harmonize the continent resulting, ultimately, in the European Union and a common currency. In order to create steel, iron ore is heated in a blast furnace fueled by coal and coke to produce pig iron. The pig iron is then refined to a customer’s chemical specifications by oxidation, which removes impurities. These chemical compound specifications determine what type of steel is created. Finally, steel is rolled into semi-finished or finished product. Production takes place at integrated or non-integrated mills. An integrated mill makes steel starting from the raw iron ore, while the non-integrated mill will take inputs of semi-finished steel as its raw material. Common semi-finished steel products included slabs, blooms, and billets. By a process of hot- and cold-rolling, slabs can be transformed into plates, coils, sheets, and strips. Blooms and billets are rolled into bars, reinforced bars, rails, wires, rods, and tubes. Steel and steel products are listed in the Harmonized Tariff Schedule (HTS) of the United States as codes 72 and 73. In the 19th Century, a steel/railroad partnership greatly contributed to the westward expansion of the United States, resulting in fortunes for those who fabricated steel or provided its inputs. Transportation has played a vital role as integrated steel mills were built close to rivers and coal producing regions, concentrated principally in the midwestern states (Indiana, Kentucky, Ohio, Pennsylvania, and West Virginia). Integrated mills in the United States have high fixed costs since they operate blast furnaces, requiring continuous inputs of iron ore and coke. They have faced competitive pressures from smaller scale mini-mills with electric furnaces, which use semi-finished steel, such as slabs, as primary inputs. Mini-mills avoid the high fixed costs of large blast furnaces and provide customers with greater flexibility to keep low inventory and provide just-in-time delivery. Large integrated mills, on the other hand, were built under production strategies to meet peak demand. The United States presently imports about one-third of its demand for steel. Imports arrive as finished products or as raw material for finishing at U.S. mills. Tables 4.1 and 4.2 list U.S. steel imports by country in quantity and value.

52
Table 4.1. U.S. Steel Imports by Source Country in terms of Quantity (short tons) Country (rank based on 2001 figures)
1996 1997 1998 1999 2000 2001
1. Canada 4,626,656 4,633,383 4,831,995 4,940,501 5,169,564 4,568,279 2. Brazil 2,756,588 2,806,811 2,705,122 3,651,937 3,404,666 2,854,330 3. Mexico 2,836,702 3,154,460 3,111,734 3,545,349 3,175,835 2,833,889 4. South Korea 1,461,038 1,692,703 3,516,698 3,112,957 2,905,665 2,485,074 5. Japan 1,855,853 2,371,724 6,457,694 2,936,958 1,978,267 1,937,826 6. Russia 1,662,535 3,308,099 5,237,131 1,215,864 1,524,272 1,705,051 7. Germany 2,494,880 2,246,889 1,614,225 1,598,418 1,883,111 1,636,206 8. China 558,923 570,233 724,133 914,862 1,690,399 959,803 9. France 1,241,005 1,017,166 1,030,007 1,146,353 941,621 855,459 10. Australia 546,251 437,217 940,981 936,457 813,225 687,561 11. Turkey 271,570 396,253 391,881 251,749 489,988 680,129 12. Netherlands 973,276 768,147 800,587 861,194 864,842 650,166 13. Taiwan 121,338 199,747 499,782 937,276 1,288,485 620,684 14. Italy 499,163 564,162 500,531 341,077 495,603 517,637 15. United Kingdom 866,789 629,907 933,759 582,892 631,509 502,402 16. Spain 361,387 417,808 449,302 478,367 620,671 496,479 17. Belgium 905,244 452,633 421,608 513,855 471,134 460,365 18. South Africa 328,766 296,448 579,292 521,931 565,945 450,953 19. Argentina 106,113 157,690 166,795 484,409 425,117 386,904 20. Venezuela 586,397 390,175 473,823 385,673 388,533 261,671 Total (all countries) 27,734,904 29,490,682 39,771,931 34,102,591 36,380,792 28,723,034 Source: United States International Trade Commission (USITC), “Steel 201 Reports-U.S. Imports of Steel Products,” USITC web site, available at: http://dataweb.usitc.gov/scripts/steel_monthly/ steel_reports.asp?CODE=B1.2&list_name=overall, cited March 14, 2002.
Table 4.2. U.S. Steel Imports by Source Country in terms of Value (thousands of dollars) Country (rank based on 2001 figures)
1996 1997 1998 1999 2000 2001
1. Canada 2,662,357 2,697,032 2,843,960 2,759,365 3,118,869 2,818,652 2. Japan 1,574,577 1,764,825 3,197,544 1,671,820 1,383,874 1,301,638 3. South Korea 752,700 818,294 1,480,968 1,260,043 1,342,677 1,166,496 4. Germany 1,289,328 1,295,122 1,128,448 980,436 1,227,785 1,143,222 5. Mexico 1,038,701 1,173,686 1,163,431 1,167,615 1,234,106 1,043,871 6. Brazil 818,025 838,321 783,992 767,581 889,267 650,552 7. China 292,435 311,878 371,451 390,890 710,241 539,358 8. France 740,352 677,503 680,100 651,292 636,825 522,546 9. United Kingdom 499,494 452,127 618,636 451,996 525,172 440,685 10. Taiwan 204,360 250,793 347,658 477,198 677,647 407,771 11. Italy 376,809 370,634 340,939 272,513 399,537 398,465 12. Russia 512,355 1,023,950 1,408,627 308,880 423,813 360,343 13. Spain 227,051 251,807 293,984 338,048 457,780 348,146 14. Sweden 327,567 322,557 303,493 256,652 282,822 247,805 15. Netherlands 398,297 338,847 322,608 309,985 333,978 246,636 16. Belgium 398,438 290,478 265,385 250,338 269,468 219,887 17. Austria 99,787 119,002 141,578 101,480 178,618 182,180 18. Turkey 102,277 147,680 139,134 73,141 143,342 171,257 19. Australia 161,564 142,341 263,523 196,659 217,970 159,221 20. India 60,489 109,140 149,469 177,160 372,905 151,336 Total (all countries) 13,946,578 14,854,106 18,190,161 14,577,527 17,179,717 13,993,585 Source: United States International Trade Commission (USITC), “Steel 201 Reports-U.S. Imports of Steel Products,” USITC web site, available at: http://dataweb.usitc.gov/scripts/steel_monthly/ steel_reports.asp?CODE=B1.1&list_name=overall, cited March 14, 2002.

53
Tables 4.1 and 4.2 show spikes in steel imports in 1998 and 2000. Most notable are the Russian and Asian economic crises of 1997 and 1998 when domestic demand in those regions dried up and the U.S. market became a target for exports from Asia (Japan and South Korea) and Russia. To a similar extent, the Brazilian currency devaluation in January 1999 made its steel exports more competitive in the world market. Currency crises, macroeconomic conditions in producing countries, and a strong dollar have all contributed to boom years for steel imports to the dismay of large U.S. integrated firms, which in turn have complained that the dumping of steel (selling for export at prices lower than the domestic price in the exporting country) is causing harm to the domestic steel industry. Since the late 1990s, the steel sector, led by the large integrated firms, has sought to protect itself from perceived price predation by foreign imports through a series of measures, resulting in across-the-board tariff protection announced by President George W. Bush in March 2002. A major issue facing steel importers is the degree to which the U.S. protects its steel sector. Appendix A surveys U.S. steel policy with special attention to Brazil. Brazilian Steel Sector The Brazilian steel industry comprises large integrated and semi-integrated mills, which primarily serve domestic needs. Throughout the 1990s, Brazil privatized the mining and steel sectors, which had been state owned. In 1998, Brazil was the eighth-ranked steel producer in the world, yielding 25.8 million metric tons. In the year 2000, Brazilian crude steel production reached 27.9 million metric tons falling to 26.7 million metric tons for the year 2001.88 Table 4.3 illustrates the growing productivity of the Brazilian steel sector.
Table 4.3. World and Brazilian Crude Steel Production (millions of metric tons)
1970 1980 1990 1996 1997 1998
World 595.4 715.6 770.5 750.1 799.0 776.4
Brazil 5.4 15.3 20.6 25.2 26.2 25.8 Brazilian Share of World Production
0.9 2.1 2.7 3.4 3.3 3.3
Brazil’s World Ranking
18th 10th 9th 7th 7th 8th
Source: Brazilian Steel Institute, Anuário Estatístico/1999, p. 2.
Fifteen companies comprise the Brazilian steel-producing industry, located primarily in the Southeast. Companies located in the state of Minas Gerais generate 37.5 percent of the country’s steel production, followed by Rio de Janeiro (23.2 percent), São Paulo (17.9 percent), and Espírito Santo (15.8 percent).89 Steel activity at Brazilian steel mills employed 69,658 persons in
88 Brazilian Steel Institute, “Produção Siderúrgica Brasileira,” Brazilian Steel Institute web site, available at: http://www.ibs.org.br/producao.htm, cited January 30, 2002. 89 Brazilian Steel Institute, Anuário Estatístico/1999, Rio de Janeiro, p. 3.

54
October 2001.90 Table 4.4 presents the downward trend in industry employment levels brought on by steel firms rationalization and privatization. Table 4.5 lists the Brazilian steel companies, location, and operating capacity. Figure 4.1 situates Brazilian steel activity.
Table 4.4. Active Brazilian Labor Force Employed in Steel Activities Year Total Tons Per Worker Year 1992 109,707 220 1993 101,528 250 1994 97,414 266 1995 89,246 283 1996 77,547 336 1997 73,578 375 Source: Brazilian Steel Institute. A chronology of some important moments during the steel sector’s privatization follows: • 1991–The Bank of Brazil and the Vale do Rio Doce Mining Company (Companhia Vale do
Rio Doce, CVRD) used state pension funds to acquire control of USIMINAS.
• 1992–Safra, Real, and Bancesa banks via state funds acquire 40 percent share of Acesita.
• 1993–Vicunha Group (textiles) buys voting control of the National Steel Company, CSN.
• 1993–Mendes Junior leads group of investors to acquire control of Açominas.
• 1993–Control of majority voting stock of COSIPA is sold to Anquila Shareholdings and Brastubos.
• 1996–Acesita acquires voting stock of CST.
• 1996–German company Mahle acquires control of Metal Leve.
• 1997–CVRD is auctioned to Brasil Consortium, led by CSN.91
With privatization and modernization of the Brazilian steel industry in the 1990s, the industry has gained greater international competitiveness. This can be evidenced in the greater
productivity per worker and larger overall output.
90 Brazilian Steel Institute, “Estatítica de Pessoal,” Brazilian Steel Institute web site, available at: http://www.ibs.org.br/pessoal.htm, cited January 30, 2002. 91 “Onze anos de abertura economica e privatizacoes,” Folha de Sao Paulo (February 10, 2002), p. B3-B4.
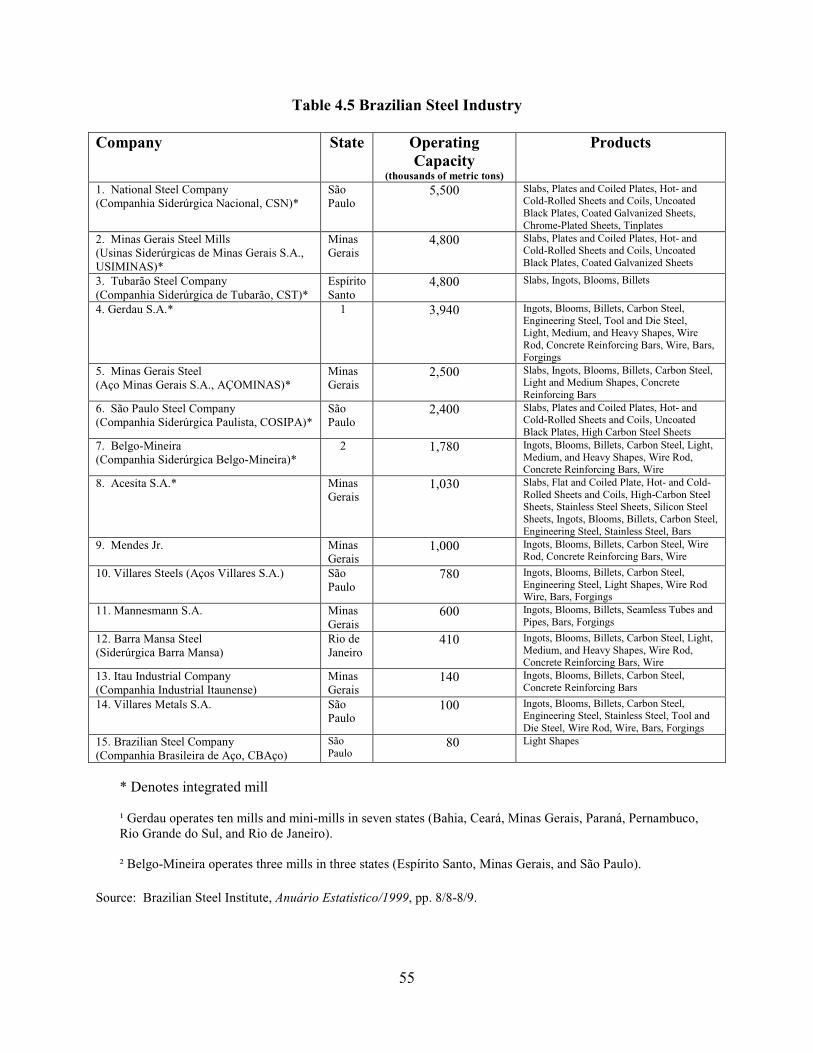
55
Table 4.5 Brazilian Steel Industry Company
State Operating Capacity
(thousands of metric tons)
Products
1. National Steel Company (Companhia Siderúrgica Nacional, CSN)*
São Paulo
5,500 Slabs, Plates and Coiled Plates, Hot- and Cold-Rolled Sheets and Coils, Uncoated Black Plates, Coated Galvanized Sheets, Chrome-Plated Sheets, Tinplates
2. Minas Gerais Steel Mills (Usinas Siderúrgicas de Minas Gerais S.A., USIMINAS)*
Minas Gerais
4,800 Slabs, Plates and Coiled Plates, Hot- and Cold-Rolled Sheets and Coils, Uncoated Black Plates, Coated Galvanized Sheets
3. Tubarão Steel Company (Companhia Siderúrgica de Tubarão, CST)*
Espírito Santo
4,800 Slabs, Ingots, Blooms, Billets
4. Gerdau S.A.* 1 3,940 Ingots, Blooms, Billets, Carbon Steel, Engineering Steel, Tool and Die Steel, Light, Medium, and Heavy Shapes, Wire Rod, Concrete Reinforcing Bars, Wire, Bars, Forgings
5. Minas Gerais Steel (Aço Minas Gerais S.A., AÇOMINAS)*
Minas Gerais
2,500 Slabs, Ingots, Blooms, Billets, Carbon Steel, Light and Medium Shapes, Concrete Reinforcing Bars
6. São Paulo Steel Company (Companhia Siderúrgica Paulista, COSIPA)*
São Paulo
2,400 Slabs, Plates and Coiled Plates, Hot- and Cold-Rolled Sheets and Coils, Uncoated Black Plates, High Carbon Steel Sheets
7. Belgo-Mineira (Companhia Siderúrgica Belgo-Mineira)*
2 1,780 Ingots, Blooms, Billets, Carbon Steel, Light, Medium, and Heavy Shapes, Wire Rod, Concrete Reinforcing Bars, Wire
8. Acesita S.A.* Minas Gerais
1,030 Slabs, Flat and Coiled Plate, Hot- and Cold-Rolled Sheets and Coils, High-Carbon Steel Sheets, Stainless Steel Sheets, Silicon Steel Sheets, Ingots, Blooms, Billets, Carbon Steel, Engineering Steel, Stainless Steel, Bars
9. Mendes Jr. Minas Gerais
1,000 Ingots, Blooms, Billets, Carbon Steel, Wire Rod, Concrete Reinforcing Bars, Wire
10. Villares Steels (Aços Villares S.A.) São Paulo
780 Ingots, Blooms, Billets, Carbon Steel, Engineering Steel, Light Shapes, Wire Rod Wire, Bars, Forgings
11. Mannesmann S.A. Minas Gerais
600 Ingots, Blooms, Billets, Seamless Tubes and Pipes, Bars, Forgings
12. Barra Mansa Steel (Siderúrgica Barra Mansa)
Rio de Janeiro
410 Ingots, Blooms, Billets, Carbon Steel, Light, Medium, and Heavy Shapes, Wire Rod, Concrete Reinforcing Bars, Wire
13. Itau Industrial Company (Companhia Industrial Itaunense)
Minas Gerais
140 Ingots, Blooms, Billets, Carbon Steel, Concrete Reinforcing Bars
14. Villares Metals S.A. São Paulo
100 Ingots, Blooms, Billets, Carbon Steel, Engineering Steel, Stainless Steel, Tool and Die Steel, Wire Rod, Wire, Bars, Forgings
15. Brazilian Steel Company (Companhia Brasileira de Aço, CBAço)
São Paulo
80 Light Shapes
* Denotes integrated mill ¹ Gerdau operates ten mills and mini-mills in seven states (Bahia, Ceará, Minas Gerais, Paraná, Pernambuco, Rio Grande do Sul, and Rio de Janeiro). ² Belgo-Mineira operates three mills in three states (Espírito Santo, Minas Gerais, and São Paulo).
Source: Brazilian Steel Institute, Anuário Estatístico/1999, pp. 8/8-8/9.

56
Transport and Handling of Steel The Brazilian steel industry benefits from rich mineral deposits concentrated in the Minas Gerais state (translates as General Mines). Mills have tended to locate near principal raw inputs of coke, coal, and iron ore. These raw material inputs are either shipped from the mineral regions of Minas Gerais or imported to the steel mill by rail, truck, or ship. There are three basic strategies. Some companies locate at the source of the mineral deposits, such as Acesita. USIMINAS is located in the municipality of Ipatinga, which lies between the ore producing regions and the seaport of Vitόria, from which the company receives its supply of coal and coke. COSIPA and CST apply a third location strategy, where they locate at a seaport with easy access to waterborne commerce. It is no coincidence that CST, by virtue of its location is one of the leading exporters of Brazilian steel to the world.
Table 4.6. CST Export Market Distribution (%)
Year North America South America/ Central America
Asia/Oceania Europe
1995 23.3 9.7 47.0 20.0 1996 50.0 3.8 30.8 15.4 1997 47.0 9.7 22.5 20.8 1998 42.0 8.1 22.6 27.3 1999 59.4 2.6 20.4 17.6
Source: Tubarão Steel Company, Customer Technical Guide 2000, p. 26.
The port complexes at Tubarão and Praia Mole (in Greater Vitória) are fundamental entry and exit points for steel inputs and exports for the steel companies of USIMINAS, ACESITA, and CST. Coke, iron ore, pig iron, and coal are among the inputs that are shipped along the Vitória-Minas Gerais Railway (Estrada de Ferro Vitória-Minas, EFVM). The EFVM provides the sine qua non for supplying inputs and market distribution. It is a highly efficient railway, owned and operated by the Vale do Rio Doce Mining Company (CVRD). The EFVM runs 540 kilometers on one-meter gauge double track from Itabira, site of iron ore loadings, to the Port of Tubarão near Vitória. Along its path are Acesita and USIMINAS with rail access at km numbers 449 and 436, respectively. Single track extensions continue in the direction of Greater Belo Horizonte, the capital city and major industrial center of Minas Gerais State.92 The standard ore unit trains outbound to Vitória consist of 160 railcars hauled by two 3,600 horsepower diesel-electric locomotives. They comprise two 80-car trains carrying different ores, which are coupled.93 CVRD runs 24 such trains each day. The standard general-cargo train, which transports steel products uses 120 railcars, two 2,700 horsepower diesel-electric locomotives, carrying 9,600 gross tons.94 For southbound domestic shipments by rail, Brazil’s legacy of unintegrated railways requires that rail shipments be transferred from narrow gauge 92 Vale do Rio Doce Mining Company, “Vitória a Minas Railroad,” pamphlet, n.p., n.d. 93 Interview by John Cuttino with José Alvanir de Nadai, Serra Industrial and Multimodal Terminal, Vitória, Espírito Santo, August 21, 2000. 94 “Vitória a Minas Railroad.”
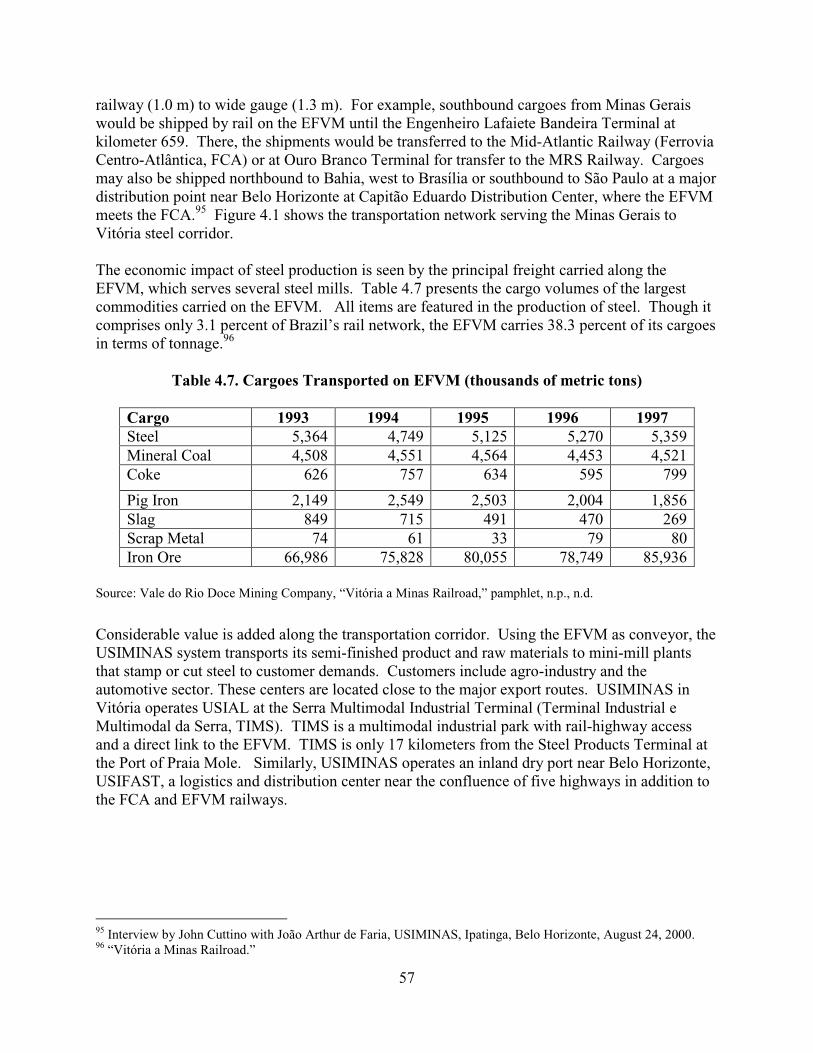
57
railway (1.0 m) to wide gauge (1.3 m). For example, southbound cargoes from Minas Gerais would be shipped by rail on the EFVM until the Engenheiro Lafaiete Bandeira Terminal at kilometer 659. There, the shipments would be transferred to the Mid-Atlantic Railway (Ferrovia Centro-Atlântica, FCA) or at Ouro Branco Terminal for transfer to the MRS Railway. Cargoes may also be shipped northbound to Bahia, west to Brasília or southbound to São Paulo at a major distribution point near Belo Horizonte at Capitão Eduardo Distribution Center, where the EFVM meets the FCA.95 Figure 4.1 shows the transportation network serving the Minas Gerais to Vitória steel corridor. The economic impact of steel production is seen by the principal freight carried along the EFVM, which serves several steel mills. Table 4.7 presents the cargo volumes of the largest commodities carried on the EFVM. All items are featured in the production of steel. Though it comprises only 3.1 percent of Brazil’s rail network, the EFVM carries 38.3 percent of its cargoes in terms of tonnage.96
Table 4.7. Cargoes Transported on EFVM (thousands of metric tons)
Cargo 1993 1994 1995 1996 1997 Steel 5,364 4,749 5,125 5,270 5,359Mineral Coal 4,508 4,551 4,564 4,453 4,521Coke 626 757 634 595 799
Pig Iron 2,149 2,549 2,503 2,004 1,856Slag 849 715 491 470 269Scrap Metal 74 61 33 79 80Iron Ore 66,986 75,828 80,055 78,749 85,936
Source: Vale do Rio Doce Mining Company, “Vitória a Minas Railroad,” pamphlet, n.p., n.d.
Considerable value is added along the transportation corridor. Using the EFVM as conveyor, the USIMINAS system transports its semi-finished product and raw materials to mini-mill plants that stamp or cut steel to customer demands. Customers include agro-industry and the automotive sector. These centers are located close to the major export routes. USIMINAS in Vitória operates USIAL at the Serra Multimodal Industrial Terminal (Terminal Industrial e Multimodal da Serra, TIMS). TIMS is a multimodal industrial park with rail-highway access and a direct link to the EFVM. TIMS is only 17 kilometers from the Steel Products Terminal at the Port of Praia Mole. Similarly, USIMINAS operates an inland dry port near Belo Horizonte, USIFAST, a logistics and distribution center near the confluence of five highways in addition to the FCA and EFVM railways.
95 Interview by John Cuttino with João Arthur de Faria, USIMINAS, Ipatinga, Belo Horizonte, August 24, 2000. 96 “Vitória a Minas Railroad.”
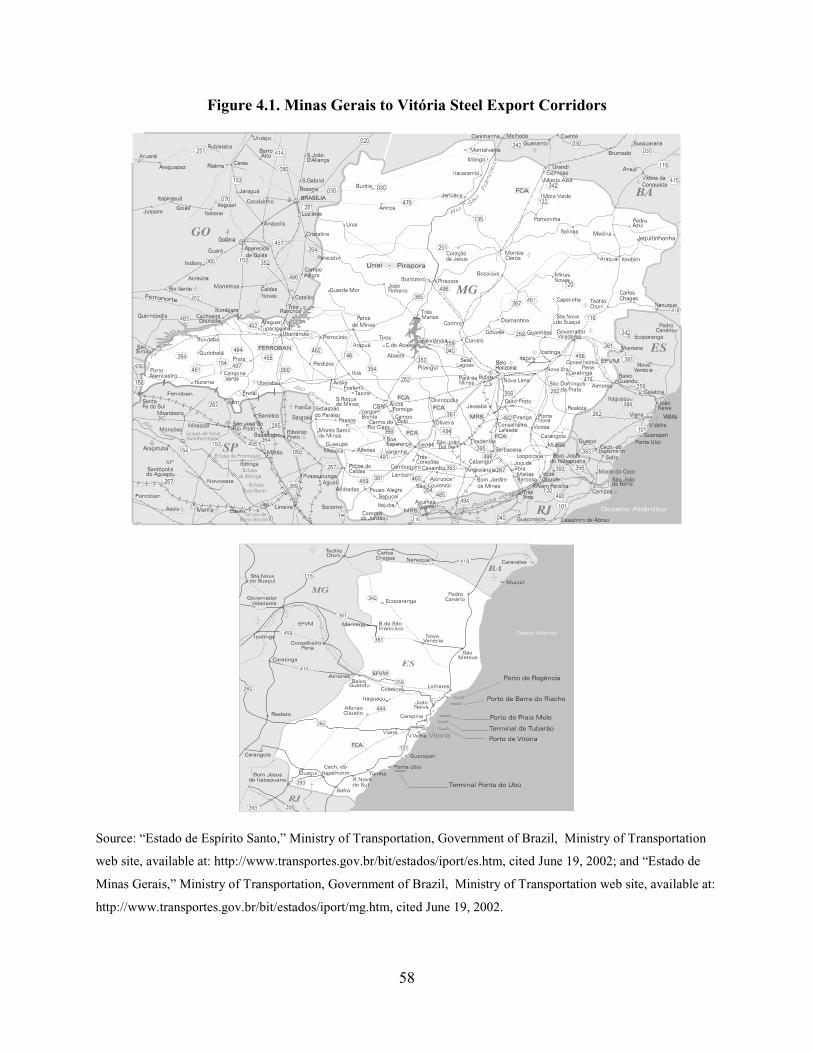
58
Figure 4.1. Minas Gerais to Vitória Steel Export Corridors
Source: “Estado de Espírito Santo,” Ministry of Transportation, Government of Brazil, Ministry of Transportation
web site, available at: http://www.transportes.gov.br/bit/estados/iport/es.htm, cited June 19, 2002; and “Estado de
Minas Gerais,” Ministry of Transportation, Government of Brazil, Ministry of Transportation web site, available at:
http://www.transportes.gov.br/bit/estados/iport/mg.htm, cited June 19, 2002.
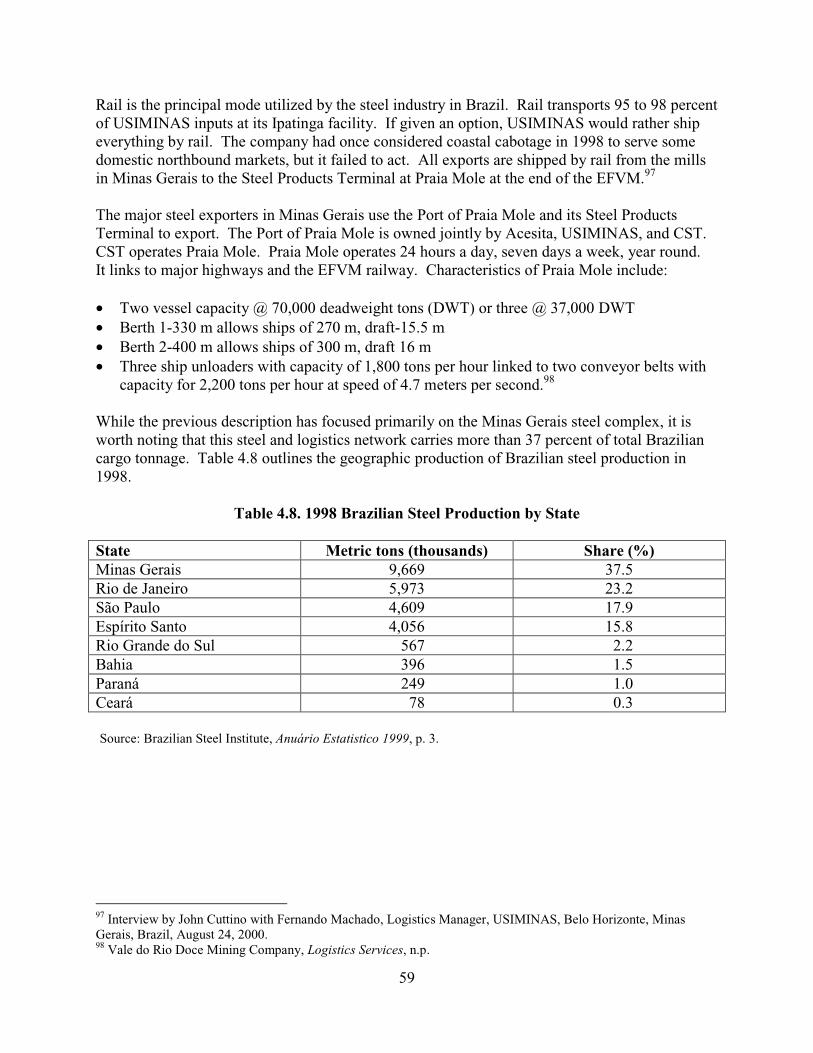
59
Rail is the principal mode utilized by the steel industry in Brazil. Rail transports 95 to 98 percent of USIMINAS inputs at its Ipatinga facility. If given an option, USIMINAS would rather ship everything by rail. The company had once considered coastal cabotage in 1998 to serve some domestic northbound markets, but it failed to act. All exports are shipped by rail from the mills in Minas Gerais to the Steel Products Terminal at Praia Mole at the end of the EFVM.97 The major steel exporters in Minas Gerais use the Port of Praia Mole and its Steel Products Terminal to export. The Port of Praia Mole is owned jointly by Acesita, USIMINAS, and CST. CST operates Praia Mole. Praia Mole operates 24 hours a day, seven days a week, year round. It links to major highways and the EFVM railway. Characteristics of Praia Mole include: • Two vessel capacity @ 70,000 deadweight tons (DWT) or three @ 37,000 DWT • Berth 1-330 m allows ships of 270 m, draft-15.5 m • Berth 2-400 m allows ships of 300 m, draft 16 m • Three ship unloaders with capacity of 1,800 tons per hour linked to two conveyor belts with
capacity for 2,200 tons per hour at speed of 4.7 meters per second.98 While the previous description has focused primarily on the Minas Gerais steel complex, it is worth noting that this steel and logistics network carries more than 37 percent of total Brazilian cargo tonnage. Table 4.8 outlines the geographic production of Brazilian steel production in 1998.
Table 4.8. 1998 Brazilian Steel Production by State State Metric tons (thousands) Share (%) Minas Gerais 9,669 37.5 Rio de Janeiro 5,973 23.2 São Paulo 4,609 17.9 Espírito Santo 4,056 15.8 Rio Grande do Sul 567 2.2 Bahia 396 1.5 Paraná 249 1.0 Ceará 78 0.3 Source: Brazilian Steel Institute, Anuário Estatistico 1999, p. 3.
97 Interview by John Cuttino with Fernando Machado, Logistics Manager, USIMINAS, Belo Horizonte, Minas Gerais, Brazil, August 24, 2000. 98 Vale do Rio Doce Mining Company, Logistics Services, n.p.
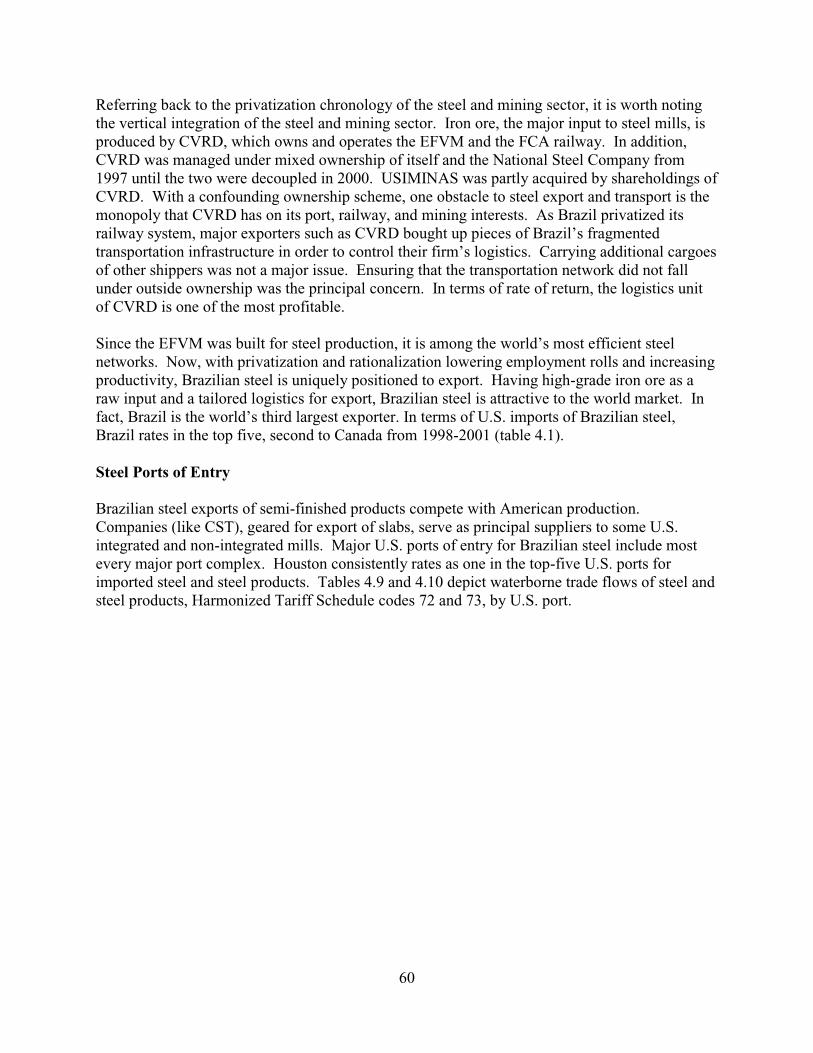
60
Referring back to the privatization chronology of the steel and mining sector, it is worth noting the vertical integration of the steel and mining sector. Iron ore, the major input to steel mills, is produced by CVRD, which owns and operates the EFVM and the FCA railway. In addition, CVRD was managed under mixed ownership of itself and the National Steel Company from 1997 until the two were decoupled in 2000. USIMINAS was partly acquired by shareholdings of CVRD. With a confounding ownership scheme, one obstacle to steel export and transport is the monopoly that CVRD has on its port, railway, and mining interests. As Brazil privatized its railway system, major exporters such as CVRD bought up pieces of Brazil’s fragmented transportation infrastructure in order to control their firm’s logistics. Carrying additional cargoes of other shippers was not a major issue. Ensuring that the transportation network did not fall under outside ownership was the principal concern. In terms of rate of return, the logistics unit of CVRD is one of the most profitable. Since the EFVM was built for steel production, it is among the world’s most efficient steel networks. Now, with privatization and rationalization lowering employment rolls and increasing productivity, Brazilian steel is uniquely positioned to export. Having high-grade iron ore as a raw input and a tailored logistics for export, Brazilian steel is attractive to the world market. In fact, Brazil is the world’s third largest exporter. In terms of U.S. imports of Brazilian steel, Brazil rates in the top five, second to Canada from 1998-2001 (table 4.1). Steel Ports of Entry Brazilian steel exports of semi-finished products compete with American production. Companies (like CST), geared for export of slabs, serve as principal suppliers to some U.S. integrated and non-integrated mills. Major U.S. ports of entry for Brazilian steel include most every major port complex. Houston consistently rates as one in the top-five U.S. ports for imported steel and steel products. Tables 4.9 and 4.10 depict waterborne trade flows of steel and steel products, Harmonized Tariff Schedule codes 72 and 73, by U.S. port.

61
Table 4.9. U.S. Imports of Steel by Port (HTS #72-millions of metric tons)
Ports 1997 1998 19991. New Orleans, Louisiana 1613.6 2764.9 1864.82. Philadelphia, Pennsylvania 619.4 802.2 834.73. Houston, Texas 890.7 1331.9 761.04. Los Angeles, California 579.1 800.9 678.85. Baton Rouge, Louisiana 883.4 607.9 517.26. Baltimore, Maryland 546.7 561.4 482.67. New York, New York 369.2 461.0 426.98. Long Beach, California 445.2 424.8 335.19. Chicago, Illinois 356.7 515.1 325.110. Savannah, Georgia 280.3 322.7 296.611. Detroit, Michigan 368.9 490.1 269.312. Charleston, South Carolina 172.1 239.8 223.013. Cleveland, Ohio 312.7 355.7 200.314. San Joachim River, California 228.4 196.3 188.415. South Louisiana 166.3 254.2 172.816. New Haven, Connecticut 204.0 284.7 156.517. Portland, Oregon 56.9 137.8 131.318. San Juan, Puerto Rico 125.5 119.9 125.019. Camden, New Jersey 221.9 180.4 120.820. Chester, Pennsylvania 93.0 81.5 118.9
Source: U.S. Maritime Administration, U.S. Maritime Trade Database, 2000.
The degree to which the United States relies on steel imports is determined by many factors. Some complex steel products are only produced in a few countries like Korea. Other raw material steel, semifinished slabs, for example, are produced more cheaply in other countries. At any one time, steel producers, distributors, and traders hold a global inventory that is marketed and traded globally. Despite attempts to portray it as such, steel is not a homogeneous commodity. Its diverse product mix sustains a multitude of industries. International orders may be placed with months of lead time before delivery. Other orders may purchase existing inventory. As tables 4.1 and 4.2 show, world exports to the United States fluctuate, depending on macroeconomic factors abroad and industry location and characteristics domestically. To meet demand, the United States must import steel. Even integrated U.S. mills import steel, taking advantage of market conditions. Table 4.9 illustrates the boom year of 1998 for steel imports at the Port of Houston. At Houston, there were year-on-year increases in steel imports of HTS#72 and HTS#73 categories of 50 percent and 25 percent respectively. From 1998 to 1999, the year-on-year change reflected a decrease of 43 percent for HTS#72 and 28 percent for HTS#73.
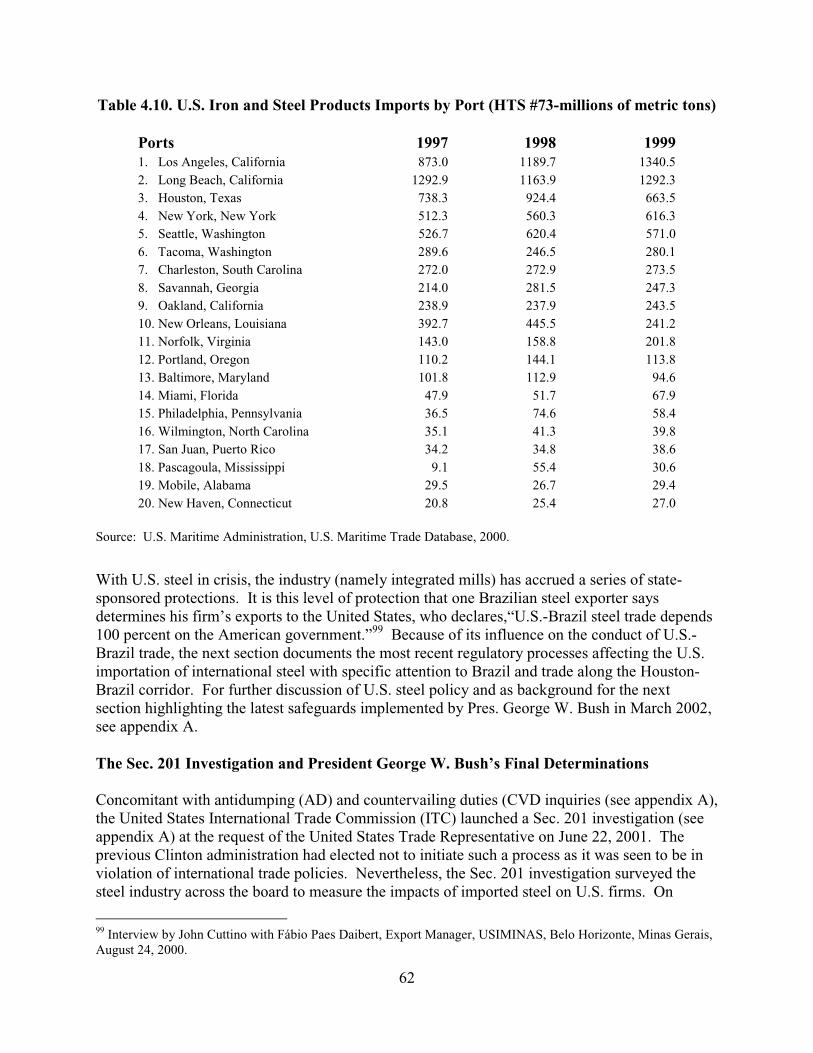
62
Table 4.10. U.S. Iron and Steel Products Imports by Port (HTS #73-millions of metric tons)
Ports 1997 1998 19991. Los Angeles, California 873.0 1189.7 1340.52. Long Beach, California 1292.9 1163.9 1292.33. Houston, Texas 738.3 924.4 663.54. New York, New York 512.3 560.3 616.35. Seattle, Washington 526.7 620.4 571.06. Tacoma, Washington 289.6 246.5 280.17. Charleston, South Carolina 272.0 272.9 273.58. Savannah, Georgia 214.0 281.5 247.39. Oakland, California 238.9 237.9 243.510. New Orleans, Louisiana 392.7 445.5 241.211. Norfolk, Virginia 143.0 158.8 201.812. Portland, Oregon 110.2 144.1 113.813. Baltimore, Maryland 101.8 112.9 94.614. Miami, Florida 47.9 51.7 67.915. Philadelphia, Pennsylvania 36.5 74.6 58.416. Wilmington, North Carolina 35.1 41.3 39.817. San Juan, Puerto Rico 34.2 34.8 38.618. Pascagoula, Mississippi 9.1 55.4 30.619. Mobile, Alabama 29.5 26.7 29.420. New Haven, Connecticut 20.8 25.4 27.0
Source: U.S. Maritime Administration, U.S. Maritime Trade Database, 2000.
With U.S. steel in crisis, the industry (namely integrated mills) has accrued a series of state-sponsored protections. It is this level of protection that one Brazilian steel exporter says determines his firm’s exports to the United States, who declares,“U.S.-Brazil steel trade depends 100 percent on the American government.”99 Because of its influence on the conduct of U.S.-Brazil trade, the next section documents the most recent regulatory processes affecting the U.S. importation of international steel with specific attention to Brazil and trade along the Houston-Brazil corridor. For further discussion of U.S. steel policy and as background for the next section highlighting the latest safeguards implemented by Pres. George W. Bush in March 2002, see appendix A. The Sec. 201 Investigation and President George W. Bush’s Final Determinations Concomitant with antidumping (AD) and countervailing duties (CVD inquiries (see appendix A), the United States International Trade Commission (ITC) launched a Sec. 201 investigation (see appendix A) at the request of the United States Trade Representative on June 22, 2001. The previous Clinton administration had elected not to initiate such a process as it was seen to be in violation of international trade policies. Nevertheless, the Sec. 201 investigation surveyed the steel industry across the board to measure the impacts of imported steel on U.S. firms. On
99 Interview by John Cuttino with Fábio Paes Daibert, Export Manager, USIMINAS, Belo Horizonte, Minas Gerais, August 24, 2000.
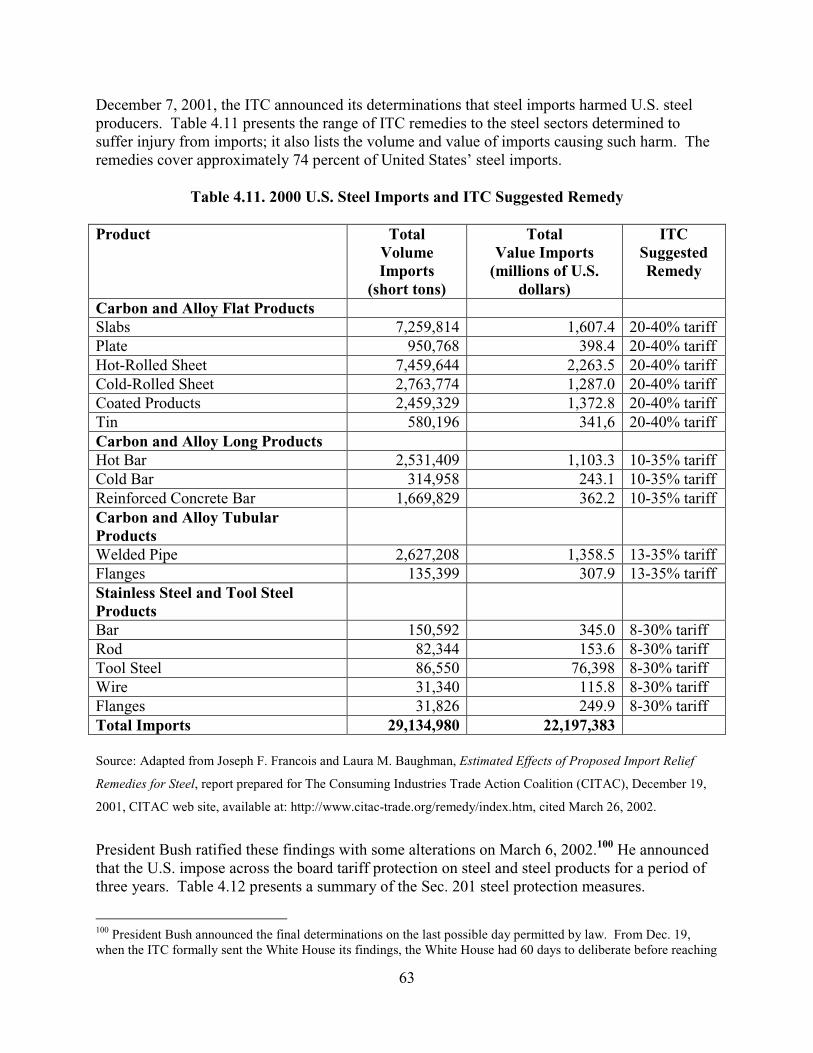
63
December 7, 2001, the ITC announced its determinations that steel imports harmed U.S. steel producers. Table 4.11 presents the range of ITC remedies to the steel sectors determined to suffer injury from imports; it also lists the volume and value of imports causing such harm. The remedies cover approximately 74 percent of United States’ steel imports.
Table 4.11. 2000 U.S. Steel Imports and ITC Suggested Remedy Product Total
Volume Imports
(short tons)
Total Value Imports
(millions of U.S. dollars)
ITC Suggested Remedy
Carbon and Alloy Flat Products Slabs 7,259,814 1,607.4 20-40% tariff Plate 950,768 398.4 20-40% tariff Hot-Rolled Sheet 7,459,644 2,263.5 20-40% tariff Cold-Rolled Sheet 2,763,774 1,287.0 20-40% tariff Coated Products 2,459,329 1,372.8 20-40% tariff Tin 580,196 341,6 20-40% tariff Carbon and Alloy Long Products Hot Bar 2,531,409 1,103.3 10-35% tariff Cold Bar 314,958 243.1 10-35% tariff Reinforced Concrete Bar 1,669,829 362.2 10-35% tariff Carbon and Alloy Tubular Products
Welded Pipe 2,627,208 1,358.5 13-35% tariff Flanges 135,399 307.9 13-35% tariff Stainless Steel and Tool Steel Products
Bar 150,592 345.0 8-30% tariff Rod 82,344 153.6 8-30% tariff Tool Steel 86,550 76,398 8-30% tariff Wire 31,340 115.8 8-30% tariff Flanges 31,826 249.9 8-30% tariff Total Imports 29,134,980 22,197,383 Source: Adapted from Joseph F. Francois and Laura M. Baughman, Estimated Effects of Proposed Import Relief
Remedies for Steel, report prepared for The Consuming Industries Trade Action Coalition (CITAC), December 19,
2001, CITAC web site, available at: http://www.citac-trade.org/remedy/index.htm, cited March 26, 2002.
President Bush ratified these findings with some alterations on March 6, 2002.100 He announced that the U.S. impose across the board tariff protection on steel and steel products for a period of three years. Table 4.12 presents a summary of the Sec. 201 steel protection measures.
100 President Bush announced the final determinations on the last possible day permitted by law. From Dec. 19, when the ITC formally sent the White House its findings, the White House had 60 days to deliberate before reaching
64
Table 4.12. President Bush’s Sec. 201 Final Determinations on Steel Imports
Product Year 1 Year 2 Year 3 Carbon and Alloy Flat Products Slabs 30% tariff on
imports above quota of 4.9 million metric tons
24% tariff on quota of 5.35 million metric tons
18% tariff on quota of 5.81 million metric tons
Plate 30% 24% 18% Hot-Rolled Sheet 30% 24% 18% Cold-Rolled Sheet 30% 24% 18% Coated Products 30% 24% 18% Tin 30% 24% 18% Carbon and Alloy Long Products
Hot Bar 30% 24% 18% Cold Bar 30% 24% 18% Reinforced Concrete Bar 15% 12% 9% Carbon and Alloy Tubular Products
Welded Pipe 15% 12% 9% Flanges 13% 10% 7% Stainless Steel and Tool Steel Products
Bar 15% 12% 9% Rod 15% 12% 9% Wire 8% 7% 6% Flanges 13% 10% 7% Source: Memorandum from President George W. Bush to the Secretary of the Treasury, the Secretary of Commerce,
and the United States Trade Representative, “Action Under Section 203 of the Trade Act,” March 5, 2002, White
House web site, available at: www.whitehouse.gov/news/releases/2002/03/print/20020305-11.html, cited March 14,
2002.
Impact of Sec. 201 Final Determinations on U.S.-Brazilian Trade President Bush’s final determinations entered into effect on March 20, 2002, giving the steel industry protection for at least three years. Notable exemptions from the tariffs include steel imports from Canada and Mexico in addition to developing countries that are members of the World Trade Organization with product specific exceptions. The final determinations exceed the
a final determination. During this period the president can seek additional information from the United States Trade Representative, which he did. This allowed for the extension of final determinations until March 6, 2002.

65
recommendations of the ITC commissioners in the cases of plate, hot- and cold-rolled sheet, slab, tin products, hot- and cold-rolled bar, reinforced concrete bar, welded pipe, and steel wire. In other words, only for flanges, stainless steel bar, and stainless steel rod did the president’s determination of tariff protection equal or arrive at values less than the ITC. As mentioned earlier, steel slab is a primary input for the integrated mills. Though the U.S. Government granted the steel industry across the board protections, imported slabs are very much in demand by the domestic steel industry. For this reason and to accommodate trading partners, the United States established a tariff rate quota exempting steel slabs from certain countries. This was meant to dampen the effects on countries, such as Brazil, which export slab as evidenced by the export activity of CST.101 Table 4.13 establishes the tariff rate quota for slabs.
Table 4.13. U.S. Tariff Rate Quota for Slabs (kilograms) Country Year 1 Year 2 Year 3 Australia 354,652,505 387,490,700 420,328,895 Brazil 2,539,566,320 2,774,711,350 3,009,856,379 European Union 149,460,535 163,299,474 177,138,412 Japan 176,781,635 193,150,304 209,518,974 Russia 1,219,781,062 1,332,723,752 1,445,666,443 Ukraine 135,535,669 148,085,268 160,634,867 All other 323,021,274 352,930,651 382,640,028 Source: Annex –Modifications to the Harmonized Tariff Schedule of the United States, United States Trade
Representative web site, available at: http://www.ustr.gov, cited March 14, 2002.
Brazil is seen as a major exception to the slab tariffs, effectively allocated half of exempted imports from 2.5 to 3.0 million metric tons. Presented in table 4.14, U.S. imports of Brazilian steel witnessed remarkable growth from 1998-2000, followed by a drop in 2001. The increase can be explained by the steep 40-percent devaluation of the Brazilian currency in January 1999. The drop in imports can be attributed in large part to the antidumping and countervailing duties applied during this period or the pending investigations concerning AD and CVD over the same time. With the dollar strengthening against the Brazilian Real (R$), Brazilian imports remain more competitive without U.S. protection. But, with antidumping orders, countervailing duties, and the Sec. 201 safeguards, imports decrease in both volume and value. In value terms, the landed-duty paid value peaked in the year 2000 at $889.3 million. Surprisingly, while import volumes jumped by 35 percent from 1998 to 1999, import values actually decreased by 2.1 percent.102 101 With looming negotiations for a Free Trade Area of the Americas set to begin in October 2002, the United States and Brazil will act as co-chairs for their respective hemispheres. The steel exemption can be seen as a U.S. strategy to diminish the overall impact on Brazil despite wide-ranging protection for the industry. 102 United States International Trade Commission (USITC), “U.S. Imports of Steel Products, Overall Trends for Brazil,” USITC web site, available at: http://dataweb.ustic.gov/scripts/steel_monthly/ steel_reports.asp?CODE=B2.1&CTRYNAME=Brazil, cited March 14, 2002.
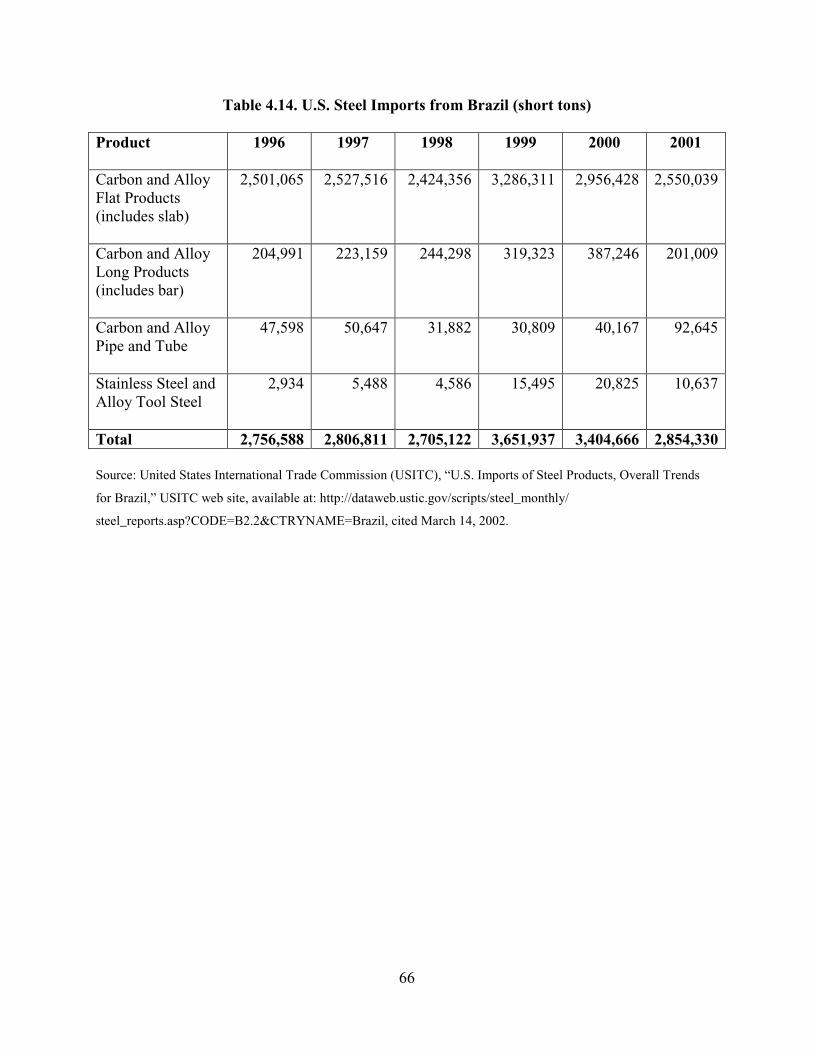
66
Table 4.14. U.S. Steel Imports from Brazil (short tons) Product
1996 1997 1998 1999 2000 2001
Carbon and Alloy Flat Products (includes slab)
2,501,065 2,527,516 2,424,356 3,286,311 2,956,428 2,550,039
Carbon and Alloy Long Products (includes bar)
204,991 223,159 244,298 319,323 387,246 201,009
Carbon and Alloy Pipe and Tube
47,598 50,647 31,882 30,809 40,167 92,645
Stainless Steel and Alloy Tool Steel
2,934 5,488 4,586 15,495 20,825 10,637
Total 2,756,588 2,806,811 2,705,122 3,651,937 3,404,666 2,854,330 Source: United States International Trade Commission (USITC), “U.S. Imports of Steel Products, Overall Trends
for Brazil,” USITC web site, available at: http://dataweb.ustic.gov/scripts/steel_monthly/
steel_reports.asp?CODE=B2.2&CTRYNAME=Brazil, cited March 14, 2002.
67
Chapter 5. Steel Trade from Brazil to Houston
The value and volume of Brazilian steel exports to the United States depend almost entirely on the United States trade policy toward steel. When there are relatively few barriers, the primary ports of entry for steel imports in the United States to be New Orleans, Philadelphia, Houston, Los Angeles and Long Beach, and New York. Most Brazilian steel that enters through Philadelphia and New Orleans is used as input for the midwestern integrated steel mills, which take the semi-finished slabs or hot- and cold-rolled plate to produce more complex steels and steel products. Conversely, steel that enters the Port of Houston is primarily consumed in Houston. There are no integrated mills in the Houston area. The Port of Houston Authority estimates that 80 percent of steel imports terminate in Houston.103 The remainder radiates north and west about 300 miles traveling as far away as Tulsa, Oklahoma or northern points in Mexico. It is estimated that 90 percent of steel imports rely on truck transportation to arrive at a final destination.104 Using the rail connections at the Port of Houston, steel can connect to Monterrey, Mexico via the Tex-Mex Railway owned by Kansas City Southern Railway. From Brazil, operated by the Vale do Rio Doce Mining Company’s Logistics Unit, the Vitória Minas Railway (Estrada de Ferro Vitória Minas, EFVM) is the principle conduit through which steel originating in Minas Gerais arrives at the Port of Vitória. As explained earlier, the Vitória port complex comprises several public and private ports that handle steel and steel products. Foremost among them is the Praia Mole Steel Products Terminal, located near the Tubarão Steel Company (CST). The Praia Mole complex is owned jointly by Acesita, USIMINAS, and CST. CST manages the logistics at the port. Unlike parts of the port complex under the management of the Port Authority of the State of Espírito Santo, the privately held Praia Mole Port is not subject to the collective bargaining agreement between the local trade unions and the Labor Management Organization. This is also the case at the Capuaba Port, which handles steel and is operated by Vale do Rio Doce (CVRD). This chapter is focused on analyzing the impacts of steel trade from Vitória to Houston. Tables 5.1-5.3 illustrate the scale of steel imports along the Brazil-Houston corridor. The primary ports in Brazil that export steel are Vitória, Rio de Janeiro, and Santos. From Vitória, the steel companies of USIMINAS, CST, Belgo Mineira, Acesita, Vallourec and Mannesmann, Açominas, and Gerdau ship to the United States. CST is one of the principal slab suppliers to the world and the specific company, which benefits the most from the tariff rate quota of 2.5 million tons established by President Bush’s Sec. 201 determinations. However, CST does not ship to Houston. The companies that ship from Vitória to Houston are USIMINAS, Belgo Mineira, Acesita, Gerdau, Vallourec and Mannesmann, and Açominas.105 Of these companies, USIMINAS, Belgo-Mineira, Acesita, and Açominas use the Vitória Minas Railway and the Port of Praia Mole.
103 Interview by John Cuttino with John Rydlund, Steel Projects Manager, Port of Houston Authority, Port of Houston. 104 Telephone interview by John Cuttino with Eamonn Mulchrone, Maurice Pincoffs, Inc., Houston, Texas, February 25, 2001. 105 Brazilian vessel manifest data, Port of Praia Mole, Datamar Consultores, Rio de Janeiro, 2001.

68
Table 5.1. Houston Imports from Brazil (millions of dollars)
Harmonized Tariff Schedule Code (HTS)
1996 1997 1998 1999
Machinery (84) 69.53 105.43 146.26 130.85 Spices, Coffee, Tea (09) 32.56 72.12 83.78 80.99 Iron and Steel (72) 68.09 55.27 82.62 50.10 Wood (44) 44.97 69.34 74.44 106.09 Organic Chemicals (29) 71.11 61.96 69.51 69.98 Rubber (40) 13.47 23.71 35.57 35.02 Electrical Machinery (85) 16.52 15.36 28.11 33.99 Iron/Steel Products (73) 25.03 23.44 26.05 24.29 Stone/Plaster/Cement (68) 11.34 12.08 14.52 17.04 Non-railway vehicles (87) 12.29 5.49 12.56 8.47 Special Other (98) 5.72 8.97 11.44 31.53
Source: U.S. Maritime Administration, U.S. Waterborne Trade Database, Washington, D.C., 2000.
Table 5.2. U.S. Iron/Steel Imports from Brazil via Houston (HTS#72)
Year Value (US$ millions) Volume (metric tons) 1996 68.09 164,414 1997 55.27 123,511 1998 82.62 193,352 1999 50.10 141,623 2000 38.65 108,204
Source: U.S. Maritime Administration, U.S. Waterborne Trade Database, Washington, D.C., 2000.
Table 5.3. U.S. Iron/Steel Products Imports from Brazil via Houston (HTS#73)
Year Value (US$ millions) Volume (metric tons) 1996 25.03 35,088 1997 23.44 32,654 1998 26.05 35,305 1999 24.29 33,356 2000 35.53 51,367
Source: U.S. Maritime Administration, U.S. Waterborne Trade Database, Washington, D.C., 2000.

69
While some steel products can be transported in containers, breakbulk carriers are the principal carriers of steel from Vitória to Houston. The steel companies that are located close to the EFVM negotiate contracts with CVRD Logistics based on estimated monthly demand. In its cost structure, the freight rates between the main USIMINAS plant at Ipatinga and Vitória are the result of a negotiation. They are contractually fixed for the duration of the contract. Ninety-nine percent of shipments made by USIMINAS are Cost and Freight (CFR) named port of shipment; insurance is assumed by the client.106 For their international shipments, USIMINAS negotiated a special arrangement with carriers such as GEARBULK, a breakbulk tramp service. By committing to ship a certain volume each month, USIMINAS receives preferential rates. However, because of the domestic market, USIMINAS does not comply with these requirements. In the year 2000, USIMINAS negotiated two prices with GEARBULK. For less than 11 thousand tons, the freight charge to U.S. Gulf ports was $22 per ton. For 11 thousand tons or greater, freights were charged at $18 per ton. GEARBULK scheduled sailings from Vitória every 20-30 days loading at the Praia Mole Steel Products Terminal. GEARBULK Shipping The GEARBULK Shipping Company is a United Kingdom-based maritime company that operates a monthly service along the East Coast of South America to the U.S. Gulf. Its ships that call Vitória and Houston load at the following ports:
• Campana, Argentina; • Puerto Madryn, Argentina; • Paranaguá, Brazil; and, • Praia Mole, Brazil;
Other ports, such in the Port of Vitória port complex can be called on inducement. The northbound sailings arrive in the U.S. Gulf discharging at:
• Port Manatee, Florida; • Gulfport, Mississippi; • New Orleans, Louisiana; • Port Arthur, Texas; • Houston, Texas; and, • Brownsville, Texas.
During the year 2000, GEARBULK sailed 12 different vessels from Praia Mole to Houston. The frequency is shown in table 5.4. When the trade barriers are fewer, USIMINAS can export with a regularity that allows the company to commit to certain volume on a carrier such as GEARBULK. That is not the case today after Sec. 201 safeguards of March 2002.
106 Daibert interview.
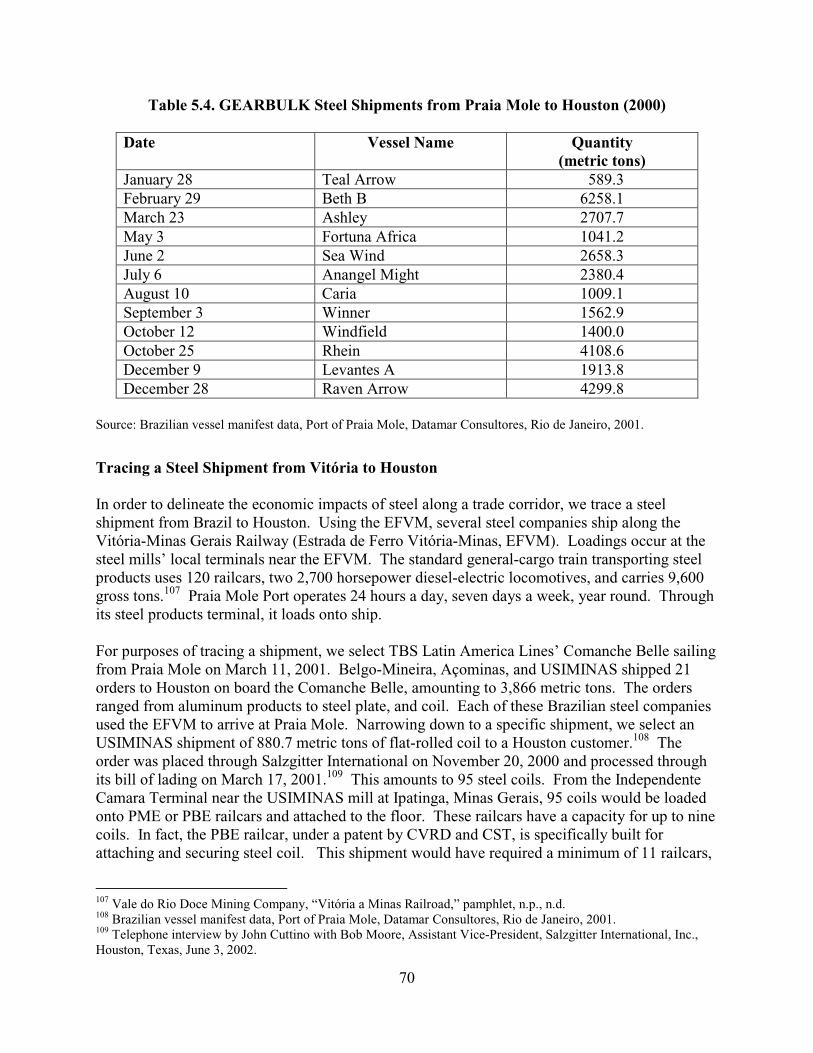
70
Table 5.4. GEARBULK Steel Shipments from Praia Mole to Houston (2000)
Date Vessel Name Quantity (metric tons)
January 28 Teal Arrow 589.3 February 29 Beth B 6258.1 March 23 Ashley 2707.7 May 3 Fortuna Africa 1041.2 June 2 Sea Wind 2658.3 July 6 Anangel Might 2380.4 August 10 Caria 1009.1 September 3 Winner 1562.9 October 12 Windfield 1400.0 October 25 Rhein 4108.6 December 9 Levantes A 1913.8 December 28 Raven Arrow 4299.8
Source: Brazilian vessel manifest data, Port of Praia Mole, Datamar Consultores, Rio de Janeiro, 2001.
Tracing a Steel Shipment from Vitória to Houston In order to delineate the economic impacts of steel along a trade corridor, we trace a steel shipment from Brazil to Houston. Using the EFVM, several steel companies ship along the Vitória-Minas Gerais Railway (Estrada de Ferro Vitória-Minas, EFVM). Loadings occur at the steel mills’ local terminals near the EFVM. The standard general-cargo train transporting steel products uses 120 railcars, two 2,700 horsepower diesel-electric locomotives, and carries 9,600 gross tons.107 Praia Mole Port operates 24 hours a day, seven days a week, year round. Through its steel products terminal, it loads onto ship. For purposes of tracing a shipment, we select TBS Latin America Lines’ Comanche Belle sailing from Praia Mole on March 11, 2001. Belgo-Mineira, Açominas, and USIMINAS shipped 21 orders to Houston on board the Comanche Belle, amounting to 3,866 metric tons. The orders ranged from aluminum products to steel plate, and coil. Each of these Brazilian steel companies used the EFVM to arrive at Praia Mole. Narrowing down to a specific shipment, we select an USIMINAS shipment of 880.7 metric tons of flat-rolled coil to a Houston customer.108 The order was placed through Salzgitter International on November 20, 2000 and processed through its bill of lading on March 17, 2001.109 This amounts to 95 steel coils. From the Independente Camara Terminal near the USIMINAS mill at Ipatinga, Minas Gerais, 95 coils would be loaded onto PME or PBE railcars and attached to the floor. These railcars have a capacity for up to nine coils. In fact, the PBE railcar, under a patent by CVRD and CST, is specifically built for attaching and securing steel coil. This shipment would have required a minimum of 11 railcars,
107 Vale do Rio Doce Mining Company, “Vitória a Minas Railroad,” pamphlet, n.p., n.d. 108 Brazilian vessel manifest data, Port of Praia Mole, Datamar Consultores, Rio de Janeiro, 2001. 109 Telephone interview by John Cuttino with Bob Moore, Assistant Vice-President, Salzgitter International, Inc., Houston, Texas, June 3, 2002.

71
loading at kilometer 436 and arriving at Praia Mole at kilometer 30.110 Figure 5.1 traces this shipment’s transport route along the EFVM.
Figure 5.1. Transport Route of Sample Steel Shipment
Source: “Estado de Espírito Santo,” Ministry of Transportation, Government of Brazil, Ministry of Transportation
web site, available at: http://www.transportes.gov.br/bit/estados/iport/es.htm, cited June 19, 2002.
Arrival in Houston The Comanche Belle sailed from Praia Mole on March 11, 2001, arriving at the Port of Houston on April 5, 2001. About two days out from docking in Houston, the vessel agent will enter into contact with the importer, customs house broker, the Port of Houston Authority, notifying of the ship’s arrival.111 The customs house broker on record for this shipment is Quast and Company.112
110 “Vitória a Minas Railroad.” 111 Moore interview. 112 Brazilian vessel manifest data, Port of Praia Mole, Datamar Consultores, Rio de Janeiro, 2001.

72
Upon arrival at City Dock 8 dock, two or three gangs of eight or nine stevedores unload the ship. Steel unloading costs range from US$4 to US$15 per ton depending on the type of steel. For steel coil, the market rate is approximately $4 per short ton. After discharge, steel is loaded directly from the ship to trucks. With a coil weight of 9.16 metric tons, approximately two coils were loaded onto each truck and transported to a sheltered storage area, 1,000 meters from the dock within the Port of Houston. Because of weight limits restricting trucks to 45,000 pounds, no more than two coils would be loaded onto each truck. These costs are 35 cents per 100 pounds or US$7 per short ton.113 There the steel may remain until picked up by client. The Port of Houston Authority applies a wharfage fee of $2 per short ton, or approximately US$1,940 for this shipment. The trucking company operates the storage area, leasing it from the Port of Houston Authority. The documentation process and customs clearance would take place as the steel shipment waits in sheltered storage. Market rates for customshouse brokering, such as US$125, would be applied in addition to any inspection fees. With multiple end uses, this shipment of steel coil is maintained at the trucking company’s intraport storage area, shipped just-in-time to the end user when needed. This allows the Houston consumer to hold part of its inventory at the Port of Houston. When needed, the trucking company will further deliver the coil to the end user’s plant, 3-4 miles away at an estimated cost of US$100 per truck. A sizeable shipment of 95 steel coils may remain at the port storage area for weeks before being completely consumed and shipped to the local client. Possible end uses for this shipment may have included further transformation via stamping, production of metal gaskets, slitting into narrower parts, or the coil cut to end user specifications.114 Costs The estimated freight costs made before shipment were US$20 per metric ton or US$17,620. Sold on a Cost and Freight (CFR) basis, the insurance on this shipment is on the account of the customer, estimated at one percent of the CFR charge. The actual ocean freight charge for this shipment was US$24 per ton. The imported value declared by the steel importer before mark up was US$325.31. The final declared customs value by the seller to the first unrelated partner was US$345 per ton, making the shipment of 880.7 tons carrying an assessed value of US$303,841.50. It is important to note that the steel was sold in Houston by Salzgitter International. Acting as an agent for USIMINAS steel, Salzgitter International has its own declared value for the steel shipment, which it purchased through letters of credit from USIMINAS. This value gets relayed to Salzgitter headquarters in Dusseldorf, Germany after which Salzgitter applies its mark up from US$325 per ton to US$345 per ton. Impact of U.S. Protectionism In 2001, this shipment of 880.7 metric tons was not assessed any antidumping margins, countervailing duties, or Sec. 201 tariffs. As of March 2002, however, with this shipment falling under Harmonized Tariff Schedule number 721129, both antidumping margins and Sec. 201 tariff protection would be applied. The preliminary antidumping margin ruling against
113 Moore interview. 114 Ibid.
73
USIMINAS for this product was 43.34 percent. The Sec. 201 protection for this product for 2002 is a 30 percent tariff. Thus, the impact of regulation on the 2001 shipment raises the cost from US$345 per ton to US$597 per ton. All tariff protection, antidumping orders, and countervailing duties are assessed on the final declared Customs value, in this case US$345 per ton. For steel importers, there is not much that can be done to remove the Sec. 201 protections. Many products such as flat-rolled steel coil from Brazil fall under Sec. 201, antidumping orders, and countervailing duties. For companies such as USIMINAS, this has meant the total elimination of the United States as an export market. Steel protection has a profound chilling effect. The impacts go beyond Houston and Vitória. USIMINAS must now find another home for this steel. When multiplied by company and country, the U.S. protections put downward price pressure on steel as formerly U.S. steel imports hit the global market. As a result of the falling steel prices, other countries retaliate and construct their own safeguards. The Sec. 201 protections have a duration of three years. In that time period, there is an 18-month review to analyze the effectiveness. Sec. 201 protections cannot be renewed. The impact of U.S. protection on steel masks the Houston sphere of influence. In nondutiable times, Houston carries a 300-mile radius for steel imports. And though a major consumer, steel arriving in Houston can radiate as far as the eastern Rocky Mountains. The possibility of using Houston as a land bridge to Mexico is also reduced by U.S. protection. Particularly damaging for Houston is the negative impact that Sec. 201 has on the array of value-added services that might be added to steel. A raw unfinished steel import destined for Mexico, for example, could arrive in Houston and undergo an intermediate value-added process, whereby the steel is cut, stamped, etc. and then sent on to northern Mexico via the rail links. Houston, with a diversity of these value-added services, loses out on this market altogether because the shipment would be assessed the penalties, tariffs, and duties even though the shipment was not destined for the United States. Another transportation issue at the Port of Houston concerning steel involves the damage that occurs during port handling. Specialty steels are rendered almost valueless if they suffer indentations. Steel coils, for example, when hoisted from ship to a flatbed truck and braced, are most susceptible to dents. Similarly, the move from truck to yard presents the danger of damage. The creation and designation of a dedicated and covered steel products terminal at City Dock #8 has been suggested as one way to improve the transport and handling of steel and reduce the costs associated with damage. The Economic Impact of Steel in Houston The economic impact of steel goes beyond its transport and handling at the port. In Harris County alone, the U.S. Bureau of Labor Statistics counts 246,328 steel consuming jobs. These are calculated from employment figures for industries that consume steel using the Standard Industrial Classification Code (SIC). In contrast, there are just 1,321 steel producing jobs in Harris County. For every steel producing job, there are 186 steel consuming jobs. The steel consuming jobs are found in the following industries:

74
• SIC 34-fabricated metal products; • SIC 35- industrial machinery and equipment; • SIC 361- electrical distribution; • SIC 37- transport equipment; • SIC 362- electrical industrial apparatus; • SIC 363- household appliances; • SIC 364- electrical lighting and wiring equipment; • SIC 301- tires; • SIC 291- petroleum refining; • SIC 28- chemicals and related; • SIC 15-17 minus SIC 152- non-residential construction.115
The steel producing industries under SIC 331 include blast furnaces and manufacturers of basic steel products. Steel Corridor Conclusions The major issue affecting the trading of steel along the Houston-Vitória corridor is the policy taken by the U.S. Government on steel imports. Chapter 4 and appendix A discussed the recent tariffs applied to Brazilian steel. Most steel from Brazil remains unaffected. In fact, the tariff rate quota on slabs can be seen positively from the point of view of the Tubarão Steel Company, which exports slabs. The Tubarão Steel Company is essentially guaranteed a market share on slabs that will be exempt from the quota. In Houston the impact is different; Houston does not import slabs. The numerous steel consuming industries will face higher prices for domestically produced steel, resulting in a possible contraction of orders and reduction of production and, subsequently, the numbers of jobs needed to sustain that production. The sample shipment traced on Comanche Belle faces the dual impact of antidumping and Sec. 201. In Brazil, the shipment of steel benefits from a highly developed and streamlined transportation network that was developed originally for the exclusive use of steel and mining. Now, the same railway is used for shipping grains, soy, and assorted sundry cargoes. During the harvest seasons, steel shipments can suffer delays from non-steel blockages of rail bridges and terminals. However, the location of USIMINAS and other Brazilian steel and the dedicated steel products terminal at Praia Mole make the inbound transport of steel very efficient. Upon arrival at Houston, the two identifiable issues that most plague transport of steel involves the handling of steel and the lack of true modal choice among shippers. Volume demands preclude rail from being an option for the small shipper. Damage that is induced during the various phases of transport occurring at the port (ship to dock, dock to truck, truck to holding yard, and holding yard to truck) create higher costs for shippers. For example a dent the size of a quarter on a conventional piece of steel coil causes thousands of dollars of damage. Some of these deleterious impacts can be mitigated with a dedicated steel products terminal in Houston as is the case in Vitória at Praia Mole.
115 Consuming Industries Trade Action Coalition (CITAC), CITAC web site, available at: www.citac-trade.org/map/htm/Texas.htm, cited March 26, 2002.
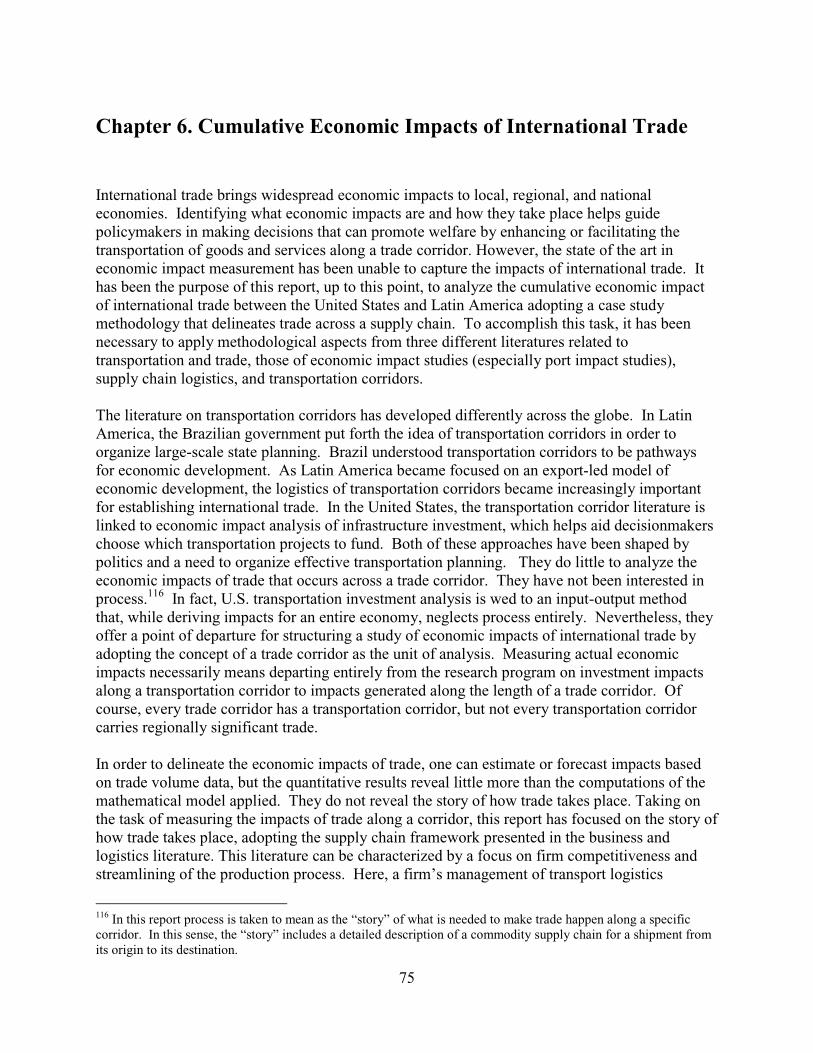
75
Chapter 6. Cumulative Economic Impacts of International Trade
International trade brings widespread economic impacts to local, regional, and national economies. Identifying what economic impacts are and how they take place helps guide policymakers in making decisions that can promote welfare by enhancing or facilitating the transportation of goods and services along a trade corridor. However, the state of the art in economic impact measurement has been unable to capture the impacts of international trade. It has been the purpose of this report, up to this point, to analyze the cumulative economic impact of international trade between the United States and Latin America adopting a case study methodology that delineates trade across a supply chain. To accomplish this task, it has been necessary to apply methodological aspects from three different literatures related to transportation and trade, those of economic impact studies (especially port impact studies), supply chain logistics, and transportation corridors. The literature on transportation corridors has developed differently across the globe. In Latin America, the Brazilian government put forth the idea of transportation corridors in order to organize large-scale state planning. Brazil understood transportation corridors to be pathways for economic development. As Latin America became focused on an export-led model of economic development, the logistics of transportation corridors became increasingly important for establishing international trade. In the United States, the transportation corridor literature is linked to economic impact analysis of infrastructure investment, which helps aid decisionmakers choose which transportation projects to fund. Both of these approaches have been shaped by politics and a need to organize effective transportation planning. They do little to analyze the economic impacts of trade that occurs across a trade corridor. They have not been interested in process.116 In fact, U.S. transportation investment analysis is wed to an input-output method that, while deriving impacts for an entire economy, neglects process entirely. Nevertheless, they offer a point of departure for structuring a study of economic impacts of international trade by adopting the concept of a trade corridor as the unit of analysis. Measuring actual economic impacts necessarily means departing entirely from the research program on investment impacts along a transportation corridor to impacts generated along the length of a trade corridor. Of course, every trade corridor has a transportation corridor, but not every transportation corridor carries regionally significant trade. In order to delineate the economic impacts of trade, one can estimate or forecast impacts based on trade volume data, but the quantitative results reveal little more than the computations of the mathematical model applied. They do not reveal the story of how trade takes place. Taking on the task of measuring the impacts of trade along a corridor, this report has focused on the story of how trade takes place, adopting the supply chain framework presented in the business and logistics literature. This literature can be characterized by a focus on firm competitiveness and streamlining of the production process. Here, a firm’s management of transport logistics
116 In this report process is taken to mean as the “story” of what is needed to make trade happen along a specific corridor. In this sense, the “story” includes a detailed description of a commodity supply chain for a shipment from its origin to its destination.

76
activities is fundamental for competing in trade. In the focus on firm logistics, the supply chain literature identifies the stages in the trading process and may even list direct economic impacts in terms of expenditures that must occur for trade to take place. Supply chain research, written for a business and management audience, has not been interested in measuring the economic impacts of trade along a corridor. The supply chain, though, is a conduit for unlocking trade impacts along a corridor. The third category of research literature and the one that most closely follows the object of study addresses port economic impacts. For the purposes of this report and the first-year report that laid the foundation, we have concentrated on port economic impact studies since ports are the gateways for waterborne foreign trade. In so doing, we have necessarily confined our analysis to waterborne trade. Not without its own problems, port economic impact studies are limited to a specific location even though all trade takes place with some given origin(s) and destination(s). Port impact studies have been designed primarily to establish export impacts, neglecting the impact of imports. Moreover, the predominant methodology is a mixture of direct survey of port-related activities and input-output analysis. This practice of taking direct survey data and feeding it into regionally and nationally derived equilibrium models at the county, state, and industry levels turns a blind eye to process of how trade actually takes place. Port impact studies are capable of measuring the impacts of foreign trade as they can compute direct inputs of trade volumes, direct and indirect industry expenditures, and regional spending from the U.S. Bureau of the Census. The results are featured in terms of jobs, value added, and taxes paid. We are cognizant of the fact that port impact studies not only try to measure direct impacts, but also indirect and induced. Indirect and induced effects rely on use of multipliers. A major reason this report restricts itself to determining direct economic impacts is because it is likely that a commodity moving through its supply chain along a trade corridor will encounter different multipliers at each different stage. For example, the personal spending that accrues from labor wages will bring different multipliers in Brazil and the United States; the average breadbasket of goods and services differs across cultures and geographical locations. This report follows the U.S. Maritime Administration Port Economic Impact Toolkit definition of direct impacts as those that reflect “the expenditures of the businesses directly associated with the movement of waterborne cargo.” The cumulative impacts, thus, become the sum of all direct impacts. Yet, unlike MARAD’s methodology, we capture direct effects of cargo movements along the entire trade corridor from origin to destination. It should also be noted that the MARAD methodology as presently derived is not capable of specifying the direct effects of a particular commodity or whether or not its impacts are of an import or export origin. While it is able to delineate the impacts of different types of cargo, such as containerized, breakbulk, dry bulk, and liquid bulk, coffee and steel would be lumped into the general aggregated figures for containerized and breakbulk cargoes respectively. In appendices B and C, we present the output from the MARAD Port Economic Impact Toolkit for volumes equivalent to the sample shipments we have traced in chapters 3 and 5. In the previous chapters, this report began to analyze the impacts of U.S.-Latin America trade by following the movement of specific commodities along a trade corridor with a defined origin and destination. Justified by its sustained volumes over time, this report selected case studies of

77
coffee and steel transported from Brazil to the United States. After some necessary background on the global/U.S./Brazilian trade in coffee and steel, this report further narrowed analysis to specific port pairs to measure the impacts at the firm level. The ports of Santos and Vitória were selected as the import origin for trade arriving at the Port of Houston. After a general introduction of the commodity trade of steel and coffee, the report traced the shipment of steel and coffee in terms of the supply chain needed to facilitate that trade. So far this report has not specified exactly the cumulative impacts of trade. Recalling Porter’s insight that firms not nations compete, we further narrowed our analysis to tracing individual shipments that embarked from Vitória, Espírito Santo to Houston, Texas. Here we are able to measure the direct impacts for two shipments. For coffee, a typical shipment of one full container of raw green coffee was traced from the fazendas that supply the Café Três Corações Company through the Port of Vitória to the Port of Houston and the Kraft roasting facility in Houston. For steel, this report followed USIMINAS’s supply chain and its shipment of steel coil from an interior steel mill in Minas Gerais to Houston via the Praia Mole port at Vitória. Figures 6.1 and 6.2 illustrate and quantify the cumulative economic impacts of a coffee and steel shipment, respectively. The rest of this chapter illustrates and compares the results of the shipment level analysis bringing together the case studies of coffee and steel. The focus on the process or the story of how trade takes place reveals the diversity of value-added services and actors involved in trade. In so doing, this report begins to fill a void in the transportation and economic impact literatures by revealing how. Understanding the process has illustrated some immeasurable economic impacts and determinants of trade, entirely missing from current impact methodologies. For example, regulation and U.S. steel import policy has a significant impact on the U.S-Brazilian steel trade. For that reason, chapters 4 and 5 and appendix A present the regulatory process and U.S. steel policy. The previously unobserved bottleneck for foreign trade of steel is revealed. Were it not for a description of process, the transportation impacts of regulation would be neglected. The Results Figures 6.1 and 6.2 summarize the economic impacts of our case study shipments of coffee and steel. Tracing the carriage of freight from origin to destination reveals several dimensions that had been previously neglected in conventional economic impact analysis. Table 6.1 reproduces table 1.1 from chapter 1, introducing some of the areas where a corridor-based approach may be informative. A discussion of these elements follows, drawing from real life examples of the case studies of coffee and steel and, specifically, the shipments traced.

78
Figure 6.1. Shipment Level Impacts along the U.S.-Brazil Coffee Corridor for the Year 2000/01
Sources: Port of Vitória Collective Bargaining Agreement (Convenção Coletiva de Trabalho), Vitória, Espírito
Santo, April 22, 1999; “USA Tariffs,” Libra web site, available at: www.libra.com.br, cited April 22, 2002; Email
from Marcelo Mares Esposito, Sales Manager, Café Atlântica, Belo Horizonte, Minas Gerais, “Survey
Questionnaire,” to John Cuttino, May 29, 2002.
Stage 1: By hand, coffee is harvested in eastern Minas Gerais highlands (Serra do Caparão) and transported to a central drying patio at the fazenda. The harvest, which produced this shipment, yielded 2,038 60-kilogram sacks. Small trucks and pickup trucks used to transport the harvest to the drying patio. Average drying period is 19 days.
Stage 2: After drying, coffee cherries are bagged in 60-kg sacks and trucked from several fazendas no farther than 35 km to a processing center at Manhuaçu, Minas Gerais, 250 km from Vitória. Coffee sacks are emptied into a pile with coffees of similar quality. In an automated process, coffee beans are separated from the cherries, washed, blended, and rebagged into 60-kg sacks.
Stage 3: Three-hundred twenty 60-kg sacks are transported to Vitória along with an additional order of 640 sacks in a convoy of 2 trucks, 1 trailer, and an escort guard. Labor includes three truck drivers and two escort guards. Transport covers a distance of 250 km in five hours at a speed of 50 km per hour over steep and mountainous terrain on BR-262.
Stage 4: Arrival at container stuffing terminal and warehouse on premises of Port Authority of Espírito Santo. 320 sacks filled into one container and sent by intraport rail link to container terminal to be loaded on Libra Buenos Aires. Labor: A team of 4 laborers and a foreman stuff container. Paid by production, each laborer earns R$34.78 per day plus R$0.23 per bag. Costs: Stuffing- R$11.59 per ton. For 19.2 ton shipment- R$222.53 or $130.
Port of Vitória-based Activity
Brazilian Inland-based Activity
Stage 5: Loading from yard to ship on Libra Buenos Aires. Labor: One team of longshoreman move containers in port. Stevedores load container onto ship. Costs: Crane moves- R$27.73, intraport forklift move- R$8.41, transteiner move- R$12.62. Three moves total R$48.76 or $28.68 plus terminal handling charge.
Stage 6: Maritime Transport to the Port of Houston- Libra Beunos Aires departs TVV on July 4, 2000 with a duration of 13 days. Costs: $1850 freight charge of Libra tariff for container from Vitória to Houston. Voyage from Vitória follows route Puerto Cabello, Venezuela, Veracruz, Mexico, Altamira, Mexico, Houston, Texas, and New Orleans, Louisiana.
Total Brazil Outbound Economic/Transportation Impacts: Stage 1: Labor costs estimated at R$48 per sack, transport costs- 63 centavos per sack. Stage 2: Transport costs estimated at 30 centavos per sack. Processing costs amount to R$3 per sack. Stage 3: Over the road freight charges including insurance and security cost R$1.62 per bag. Stage 4: Container stuffing costs $130. Stage 5: Handling costs $28.68 plus terminal handling charge. Stage 6: Ocean freight charges estimated at $1,850 for transport from Vitória to Houston.

79
Figure 6.1, continued
Sources: Interview by John Cuttino with Carlos de Aldecoa, President, CADECO, Houston, Texas, February 25,
2002; Telephone interview by John Cuttino with Capt. Alistair Macnab, Executive Secretary, Greater Houston
Coffee Association, Houston, Texas, June 20, 2002; Greater Houston Coffee Association, Transportation Module,
Houston, Texas, August 14, 2001; and Marine Exchange of the West Gulf, “July 2000 Vessel Log,” Houston, Texas.
Stage 7: Arrival of the Libra Buenos Aires at the Port of Houston at 6:45 am Monday, July 17, 2000. Ship unloading container at Barbour’s Cut Berth #2, stevedores unload container to terminal yard, intraport move to storage area. Costs: TEU move- $185, inbound handling- $24.80, wharfage- $55.10 Ship-to-shore gantry crane for unloading move, intraport forklift move to storage area.
Total U.S. Inbound Economic/Transportation Impacts: Costs for a TEU move, $185; inbound handling, $24.80; wharfage, $55.10. Ship-to-shore gantry crane for unloading move, intraport forklift move to storage area.
Stage 8: Processing at Port of Houston- awaiting clearances and documentation for U.S. Food and Drug Administration, U.S. Department of Agriculture, Customs, and sampling. Labor involves partial involvement of one freight forwarder/customs house broker to facilitate documentation. One sampler enters port terminal area to extract coffee sample for testing at out-of-state laboratory. Costs include USDA and FDA charges of $10-$25 per TEU, Customs entry $75-$150 per TEU, and $12 per sample plus airfreight. Further activities involve notification of client, transportation of documents, electronic data interchange for exchange of documents, letters of credit, clearances etc.
Port of Houston-based Activity
Stage 9: Activity: Drayage from port terminal to CADECO bonded warehouse, unloading of sacks at warehouse. 320-60 kg sacks are unloaded from container and stacked on pallets inside warehouse. Labor: One trucker, two laborers to unload, one forklift operator to move sacks Costs: $100-$225 per TEU Transportation Consumed: One container on one truck travels 25 miles from Barbour’s Cut to CADECO warehouse for storage.
Stage 10: Drayage to roaster, loading of truck, delivery to Kraft.
United States Inland-based Activity
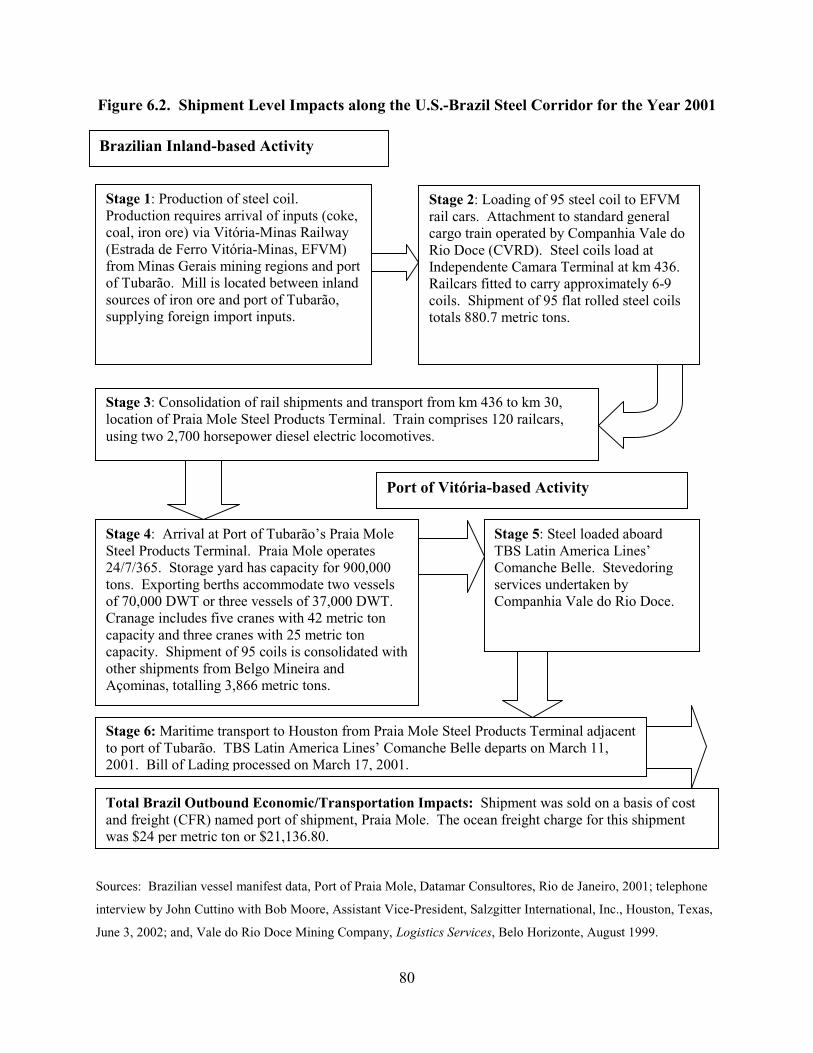
80
Figure 6.2. Shipment Level Impacts along the U.S.-Brazil Steel Corridor for the Year 2001
Sources: Brazilian vessel manifest data, Port of Praia Mole, Datamar Consultores, Rio de Janeiro, 2001; telephone
interview by John Cuttino with Bob Moore, Assistant Vice-President, Salzgitter International, Inc., Houston, Texas,
June 3, 2002; and, Vale do Rio Doce Mining Company, Logistics Services, Belo Horizonte, August 1999.
Stage 1: Production of steel coil. Production requires arrival of inputs (coke, coal, iron ore) via Vitória-Minas Railway (Estrada de Ferro Vitória-Minas, EFVM) from Minas Gerais mining regions and port of Tubarão. Mill is located between inland sources of iron ore and port of Tubarão, supplying foreign import inputs.
Stage 2: Loading of 95 steel coil to EFVM rail cars. Attachment to standard general cargo train operated by Companhia Vale do Rio Doce (CVRD). Steel coils load at Independente Camara Terminal at km 436. Railcars fitted to carry approximately 6-9 coils. Shipment of 95 flat rolled steel coils totals 880.7 metric tons.
Stage 3: Consolidation of rail shipments and transport from km 436 to km 30, location of Praia Mole Steel Products Terminal. Train comprises 120 railcars, using two 2,700 horsepower diesel electric locomotives.
Stage 4: Arrival at Port of Tubarão’s Praia Mole Steel Products Terminal. Praia Mole operates 24/7/365. Storage yard has capacity for 900,000 tons. Exporting berths accommodate two vessels of 70,000 DWT or three vessels of 37,000 DWT. Cranage includes five cranes with 42 metric ton capacity and three cranes with 25 metric ton capacity. Shipment of 95 coils is consolidated with other shipments from Belgo Mineira and Açominas, totalling 3,866 metric tons.
Port of Vitória-based Activity
Brazilian Inland-based Activity
Stage 5: Steel loaded aboard TBS Latin America Lines’ Comanche Belle. Stevedoring services undertaken by Companhia Vale do Rio Doce.
Stage 6: Maritime transport to Houston from Praia Mole Steel Products Terminal adjacent to port of Tubarão. TBS Latin America Lines’ Comanche Belle departs on March 11, 2001. Bill of Lading processed on March 17, 2001.
Total Brazil Outbound Economic/Transportation Impacts: Shipment was sold on a basis of cost and freight (CFR) named port of shipment, Praia Mole. The ocean freight charge for this shipment was $24 per metric ton or $21,136.80.

81
Figure 6.2, continued
Sources: Telephone interview by John Cuttino with Bob Moore, Assistant Vice-President, Salzgitter International,
Inc., Houston, Texas, June 3, 2002; interview by John Cuttino with Capt. Alistair Macnab, President, Greater
Houston Port Bureau, Houston, Texas, May 12, 2001; and Marine Exchange of the West Gulf, “March 2001 Vessel
Log,” Houston, Texas.
Stage 7: Comanche Belle arrives at the Port of Houston on March 11, 2001. Two or three gangs of eight or nine stevedores meet the ship. Steel coil is unloaded directly onto truck. With coil weight of approximately 9.16 metric tons, two coils are loaded per truck. Costs to unload steel are 35 cents per 100 pounds or $7 per short ton, making this shipment cost $6,796.
Total U.S. Inbound Economic/Transportation Impacts: Steel unloading costs, $7 per short ton or $6,796 total. This cost represents 2.2 percent of the final declared customs cost.
Stage 8: Steel coils are transported, two to a truck, by a local trucking company, which operates its own storage facility within the port premises. Documentation process, letters of credit, and customs clearance occur while steel stays within port. This shipment uses Quast and Company as customs house broker. Final declared customs value is $345 per metric ton, making this shipment valued at $303,841.50. If subject to duties or tariffs, these charges added to final declared customs value.
Port of Houston-based Activity
Stage 9: Steel coils transported on “just-in-time” basis to steel distributor as needed. Steel transported 3-4 miles to steel company. A shipment of 95 steel coil may remain in storage area for weeks before being totally consumed.
Stage 10: Steel processed into semifinished or finished products, fit to customers’ specifications. End uses may include further stamping, cutting for production of metal gaskets.
United States Inland-based Activity
82
Table 6.1. Dimensions Revealed through Corridor Analysis
Actors Operations Infrastructure Industry Trends Externalities
Stevedores Documentation
Sea/River ports Containerization Damage and loss
Freight forwarders
Consolidated shipments
Inland dry ports Electronic Data Interchange (EDI)
Robbery
Consolidators Vessel-sharing agreements
Highways Consolidation Weather conditions
Bankers Hub-and-spoke operations
Railroads Intermodalism Political risk
Traders Port costs
Air Larger vessels Currency fluctuations
Consignees Voyage costs
Inland waterway Privatization Exchange rates
Carriers (rail, liner, truck, barge)
Inland haul costs (rail/truck/ intermodal)
Intermodal Ocean shipping conferences
Tariffs
Shippers Cargo preference restrictions
Intermodal terminals
Regulation
Inspectors Security
Customs brokers
Congestion
Port authorities
Terminal operators
Labor Unions

83
Actors This study has identified the large diversity of actors that make trade and its physical movement happen. Among those of note in our case studies are the following. Freight forwarders and customs brokers Most involved in the process from beginning to end are the freight forwarders and customs house brokers. These are the primary handlers of documentation, seeing to it that the cargoes pass customs and inspection by relevant authorities. Moreover, they handle bills of lading, letters of credit and expedite final processing of sale. Stevedores Stevedores carry out the loading and unloading of ships. At the Brazilian public terminals that handled the coffee shipment, they hold great power, which has been slowly diminished over time. Nevertheless, the stevedores unions remain the most influential labor unions at the port, with the power to paralyze port operations through strike actions. At the Brazilian private terminals that handled steel, stevedores are not subject to the rules of collective bargaining and the local labor management board, OGMO. At Houston, stevedores are less costly than their counterparts in Los Angeles or New York. This makes Houston attracting for luring cargo. Stevedores remain, however, general workers and are not trained or allocated for specific cargo handling. For example, steel suffers damage by inefficient stevedoring. Indentations, scrapes, and cuts caused by mishandling might be improved with stevedoring that had undergone steel handling training. Traders Many actors in the trading process are not necessarily located at the port or even in the port city. Trading companies in Brazil, Europe, or the United States are vital for consummating and processing the sales that generate trade and transport. In our case studies, the traders included Salzgitter International and its headquarters in Dusseldorf, Germany. The coffee trading company, Kraft, has its sales offices in Tarrytown, NY. Moreover, the Brazilian coffee company was based in Belo Horizonte, Minas Gerais with direct links to the New York Board of Trade. Carriers To transport coffee inland transport was the exclusive domain of the trucking company (accompanied by escort security in Brazil). In contrast, the inland transport of steel entirely used rail. At Houston steel was destined for a local consumer so only trucks were used. At Vitória, coffee did arrive by rail though it could. The ocean carriage of coffee and steel also differed greatly. Containerized coffee went by regularly scheduled liner service. The liner service participates in a consortium comprising three liner companies. As a result, the shipping market can be consolidated and the carriers can ration their vessels. For steel, the shipping arrangements

84
are made with a tramp shipper. During good economic times when there is no dumping or protectionism, nearly monthly tramp service runs between Brazil and the U.S. Gulf from Vitória. Port-based organizations In both Brazil and the United States, there was the strong role played by port-based organizations. In Vitória, the Mercosul Atlantic Corridor Consortium acted as a facilitator for coffee and steel organizing the trade and transport interests of the corridor. Recent activity of the Mercosul Atlantic Corridor has been dedicated to lowering transport costs by introducing rail transport of coffee from Varginha, Minas Gerais to Rio de Janeiro as a an alternative to shipping out of Santos or Vitória. In the United States, the Greater Houston Coffee Association (GHCA) was formed by local transportation providers, coffee importers, roasters, warehousing firms, freight forwarders and customs house brokers, and public and private port interests to encourage and develop the local coffee industry. Foremost on their list of objectives was the elimination of the annual inventory tax levied on coffee stored in Harris County at year end. This required passage of a statewide ballot referendum. In November 2001 the referendum passed and the inventory tax was eliminated. Now the GHCA is seeking recognition as a coffee exchange port from the New York Board of Trade. Though Brazil is not a country that is a member of the coffee exchange, receiving exchange status is an international endorsement that the local area possesses a wide variety of value-added services related to the import, processing, distribution, and trade of coffee for which Brazilian exporters will no doubt benefit. What makes these port-based organizations effective may shed light on what makes a corridor effective and efficient. Both organizations on either side of the Atlantic attempt to organize over an entire trade corridor. They represent the horizontal integration of the supply chain. By organizing along a corridor, they have been able to identify trade opportunities and galvanize a port community’s interest in securing specific goals. In the case of the GHCA, they needed to win a statewide referendum. In the case of the Mercosul Consortium, their discussions take place directly between shippers and transport providers. In either case, the state is not the major actor; the trade and transportation interests take the lead. Operations Documentation Documentation covers import and export, taking place at numerous stages while the shipment is in transit. While freight forwarders may act very expeditiously, they are often held up by the lack of customer response in relaying letters of credit and purchase and sale information. Electronic data interchange has facilitated processing greatly but some innovations have yet to be used at the Port of Houston. For example, many freight forwarders and liner companies offer detailed tracking services. By and large, these services have yet to be used by coffee shippers or customers.
85
Consolidated shipments Consolidated shipments are most evident in both the shipment of coffee and steel. Coffee is consolidated at several different points, harvest, processing, inland transport to port, and stuffing into containers at port. Similarly, steel is consolidated from many companies onto CVRD’s unit trains on the EFVM that run to the Port of Tubarão. At the Port of Houston, consolidation occurs at intraport storage sites or nearby warehouses. Facilitating consolidation are various warehousing, processing, and storage facilities along the corridor. These are often the last stops before a shipment reaches its final destination. Vessel-sharing agreements Vessel sharing agreements are evident in the carriage of coffee, specifically when involving the regularly scheduled services of liner companies. The sample coffee shipment was carried on the Libra Buenos Aires even though the owner of the cargo was the Lykes Lines. On its East Coast of South America to the U.S. Gulf Coast route, Lykes, Libra, and TMM form the Americana Ships consortium, a subsidiary of CP Ships. This arrangement allows for the rational allocation of fleet size and frequency. Hub-and-spoke operations Vessel manifests from Brazil do not list the vessel onto which a shipment has been transshipped. For this reason, the trace shipments followed use vessels that make direct calls at both Houston and Vitória. Nevertheless, transshipment is most prevalent along the coffee corridor. Transported in containers, coffee follows the liner services hub-and-spoke systems. From Santos and Vitória, the Caribbean hubs of Kingston, Jamaica and Freeport, Bahamas receive and transship a large quantity of coffee destined for Houston. These hub-and-spoke operations make the ports of Kingston and Freeport a vital element in the Houston-Brazil trade corridor. In light of recent emphasis on port security and efficient operations, the importance of accompanying the developments in these ports is fundamental to an understanding of the corridor. Unfortunately, our corridor analysis was unable to follow shipment past the first ship of loading. Port costs In Brazil, there is increased downward pressure on port costs owing to the recent trends to privatize and modernize ports. The most significant change now shifts the role of setting gang size from the stevedores unions to an intermediary agency, OGMO. Yet, the stevedores unions in Santos and Vitória still effectively set the gang size. In the collective bargaining agreement under which the coffee shipment fell, port costs are calculated by each individual service provided. For steel shipments, port costs are streamlined, entirely private. The Companhia Siderúrgica de Tubarão operates the Praia Mole Steel Terminal under joint ownership with USIMINAS and Açominas. CVRD runs its rail all the way to the terminal.
86
Voyage costs (ocean freight) Ocean carriers adjust rates seasonally to accommodate the shifts in shipping lanes brought on by the global economy. For coffee, the cost of shipping a container of raw green coffee to a U.S. Gulf port can range from $1,850 to $2,800 FOB. What explains this range? Coffee is an important anchor commodity for liner companies, but liner companies price according to demand for capacity in both directions. If there are insufficient cargoes in one direction, then a surcharge will be applied to the more active trade lane. In the case of Brazil, after the devaluation of its currency in January 1999 and the increasing strengthening of the United States Dollar against the Brazilian Real northbound volumes subsidized southbound cargo. In order to make up for decreased import demand, liner companies charge surcharges to accommodate imbalances along the trade lane. In the case of steel, GEARBULK offered regular monthly service to Minas Gerais steel shippers. In order to have monthly service, shippers like USIMINAS committed a minimum volume to ship per month. As a result, USIMINAS received favorable rates. Many times, though, the quota was not met in which case USIMINAS was still bound by its agreement with GEARBULK. In the year 2001, GEARBULK’s monthly service stops, no doubt owing to the antidumping measures and countervailing duties applied by the United States. This paper traced a shipment on another carrier, TBS Latin America Lines. Here we see base ocean freight amounting to a small percentage (2.2 percent) of the total declared customs value at port of arrival. Inland haul costs The inland haul costs for coffee occur in distinct episodes. Until final transport to the port, the costs are insignificant. But when the coffee is shipped to the port, it is transported with a considerable amount of security in order to avoid theft. Cargo travels in convoys of three trucks and one escort guard vehicle. The particular convoy traced in chapter 3 amounted to three full containers at 320 sacks. The total cost for transporting 960 sacks from the processing center to the port was R$1,555.20 or just over 1 percent of the final traded value as reported on a per bag basis. For steel, inland haul costs are incorporated in the price charge cost and freight (CF). Infrastructure The transportation corridors studied comprise railroads, highways, sea-lanes, seaports, warehouses, and intermodal terminals. Each mode has distinctive attributes and brings with it differential impacts. For example, the deteriorating highways in Brazil are a common problem faced by shippers who wish to export. Many roads have been privatized adding further to costs by way of tolls. Highways, in particular, fall prey to robbery. Not at all a factor for steel, which uses rail, highway robbery plagues coffee shipments. For this reason, transportation adds security and travels in convoy. Though this particular shipment did no avail its use, Brazilian shippers often keep track of their cargoes through satellite accompaniment, photos, or radio contact throughout the course of transit.

87
Ironically, the infrastructure dynamics between the United States and Brazil along its corridors are exact opposites. Whereas Barbour’s Cut operates a modern highly efficient container terminal at the Port of Houston, the container facilities at the Port of Vitória lack the size and modernity of Houston. In the case of steel though, the export corridor that ends at the Port of Tubarão encompasses a highly efficient intermodal network. Operated by CVRD, the EFVM is among the most effective and modern freight railroads in the world. The dedicated steel facility helps shippers consolidate steel shipments. Brazilian steel production has been engineered around its transportation logistics from its beginning. In Houston steel facilities are lacking and could be much improved. Externalities Externalities such as damage/loss and highway robbery are not the only ones that affect Houston-Vitória trade and thus United States-Brazil trade corridor. Political risk and political uncertainty influence trade. Currency fluctuations, in part, as a result of political risk cause reversals in trade balances. During the period of this study, the Real gradually weakened against the United States Dollar as the Brazilian government carried out a monetary policy based on an exchange rate range pegged to the dollar. While Brazilian labor contracts and basic market basket costs did not change with the gradual devaluations, the competitiveness of Brazilian exports changed a great deal. Overnight, Brazilian exports including coffee and steel became more attractive to U.S. importers. This has adverse affects on causing instability on the trading lanes. As more cargoes move northbound, Brazil does not concomitantly increase its imports. With the Real weakened, imports wane. Regulation The externality that most affects the U.S.-Brazil steel corridor is U.S. regulation. As argued in chapters 4 and 5 and presented in appendix A, U.S. steel policy determines whether or not U.S. consuming industries will buy and import Brazilian steel. The sample shipment followed had a final declared customs value of $345 per metric ton. In June 2002, were that same shipment to be made today at a similar declared value, the final price passed on to the consumer would have been $597 per metric ton. The shipment would fall under a preliminary antidumping measure of 44 percent as ruled on by the United States International Trade Commission. In addition to the antidumping margin, the Sec. 201 safeguards announced by Pres. George W. Bush in March 2002 would impose another 30 percent blanket protection on the item based on its final declared value. While most antidumping and countervailing duty petitions are product specific, Pres. Bush’s Sec. 201 safeguards grant across-the-board protection to the entire steel-producing sector. It has the chilling effect of ending all steel trade with Brazil. Notwithstanding the exceptions for steel slab, a company such as USIMINAS, whose shipment we traced, will cease to act in markets like Houston for years. The indirect results of these regulatory practices are two-fold. First, U.S. consuming industries suffer by the much higher price of domestically produced steel. Secondly, the affected countries will create their own protectionist measures to aggressively punish the United States and also counter a global drop in steel prices. Eliminating the United States as a target steel market will

88
decrease the global price of steel. Steel producers will search out new markets outside the United States. With a greater supply on the open market, the price of steel plummets and countries may be forced to act in defense of their own industry. Regulation also affects economies such as Houston where an agglomeration of value-added services are located. For example, the Sec. 201 protection totally negates any advantage that could be gained from importing steel for the sole purposes of adding value before shipping to Mexico. Access to northern Mexico via rail has made this kind of activity attractive to steel distributors. Houston receives semifinished steel. It undergoes a technical value-added service unavailable in Mexico. Subsequently, it ships out to Mexico. Sec. 201 protection would not permit such steel to escape protection. Even though the final client is not directly competing with the domestic industry, this type of operation is precluded from taking place. The number of jobs affected by steel protection will be measurable in predominantly steel consuming regions such as those served by the port of Houston. Directions for Further Research To our knowledge, no one has attempted to integrate the concepts of trade corridors, supply chain, and economic impacts to measure the cumulative impacts of trade. Integrating aspects of these three methodologies is necessary because each of these methodologies has their own deficiencies for measuring economic impacts. By and large transport corridors focus on investments. Supply chains are not confined to specific corridors nor do they measure economic impacts. Port economic impact studies are confined to a specific location but they reveal little of the actual process aside from a description or list of expenditures (see appendices B and C). One future area for research may involve looking into how conventional port economic impact methodologies can be adapted to follow a shipment from origin through destination. Though the data requirements are formidable, the port-to-port data can be obtained from vessel manifests, bills of lading, or customs declarations. However, vessel manifests need to be reconfigured to include the advent of transshipment. We cannot trace a shipment from just the vessel manifest of export origin alone. Many have called for the public release of port-to-port data. Owing to proprietary nature of such data, little progress has been made. Domestically, perhaps an annual Waybill freight sample can be reengineered in order to provide the data needs for input-output analysis of foreign waterborne trade. In any case, the problems still arise that process, management, and the human element are neglected. Case studies will continue to have more than intrinsic value as they reveal factors affecting impacts and impacts of process. If an institution such as the United Nations could establish a multinational methodology for accompanying freight carriage along a supply chain, perhaps such a data set created could build directly from input-output methods currently in use today. Thus we could quantify the economic impacts of a corridor.

89
Appendix A. U.S. Steel Policy and Implications on U.S.-Brazilian Steel Trade
General Characteristics of U.S. Steel Policy Steel and dumping have been inseparable ever since Title VIII of the Revenue Act of 1916 (known as the United States Antidumping Act of 1916) facing the threat of Canadian predation in the steel industry. Globally endorsed antidumping provisions in the 1994 Uruguay Round of the General Agreement on Tariffs and Trade (GATT) continue to be a vehicle for the U.S. steel industry to defend itself from traded imports at less than fair value prices. To do so, the U.S. industry must experience material injury or the threat thereof. If determinations by the U.S. Department of Commerce (DOC) and the United States International Trade Commission (ITC) return affirmative, then an antidumping duty may be levied against the dumped product. Protectionism for the steel industry has oscillated from antidumping duties to voluntary export restrictions (VERs) or voluntary restraint agreements (VRAs). An antidumping or countervailing duty is applied after two rounds of investigations and two kinds of findings: 1) pricing less than fair value; and, 2) material injury (damages) to domestic industry or the threat thereof. The DOC and the ITC make preliminary and final determinations on the extent of dumping based on independent investigations. If during the preliminary determination, the DOC finds that there are affirmative dumping findings, temporary dumping duties are applied for the duration of the investigation's final phase. Upon final affirmative determination from the ITC and DOC, duties are applied against the product in question. Antidumping duties and countervailing duties are itemized measures and fall only on the product in question. Because the burden of proof need only demonstrate less than fair value pricing and a low threshold of the threat to domestic industry, affirmative antidumping petitions are quite easy to achieve. Until the Uruguay Round established a five-year sunset provision, antidumping duties, as well as countervailing duty orders, have tended to have a permanent character. Countervailing duties are measures to protect against a foreign government’s subsidy of industry or legacies thereof, which give an advantage to their countries’ firms in the conduct of international trade. Many countries, such as Brazil, invested heavily in the steel sector, and as these countries privatize the steel sector, the residual effects of subsidization endure. Even if there is no current subsidization, countervailing duties may be applied on account of legacies of subsidization. There are six major mechanisms used to protect the domestic steel industry. They are: 1) unfair trade remedies; 2) Sec. 201 of the 1974 Trade Act-the so-called escape clause to provide temporary relief to injured industry; 3) voluntary restraint agreements (VRAs) or voluntary export restraints (VERs)-used interchangeably in this text; 4) Sec. 406 Market Disruption State Trading Companies; 5) Sec. 301 Unfair Foreign Trade Practices; and, 6) Sec. 232 National Security.117 117 Michael O. Moore, "The Waning Influence of Big Steel," in The Political Economy of American Trade Policy, ed. Anne O. Krueger (Chicago: University of Chicago Press, 1996), p. 88.

90
Many antidumping petitions have been filed by the steel industry. According to table A.1, from 1990 to 1998, more than 50 percent of all antidumping and countervailing duty petitions have been filed on behalf of the steel industry. From 1980 to 1998, more than 40 percent come from steel. Almost half of all antidumping (AD) and countervailing duties (CVD) petitions result in negotiated settlements and are either suspended or withdrawn. Prusa has argued that the proliferation of antidumping and countervailing duties allows the steel industry to achieve cooperative levels of profits.118 A 1993 study found that the United States negotiated VRAs or VERs in 348 of 774 (45 percent) of antidumping and countervailing duty cases filed between 1980 and 1988. Steel accounts for 95 percent of VERs negotiated by the U.S. government.119
Table A.1. Iron & Steel Antidumping (AD) and Countervailing Duty (CVD) Petitions as Share of Total AD and CVD Petitions
1980-84 1985-89 1990-94 1995-98 Total
Iron & Steel 36.8 34.1 51.7 50 41.9
Source: Sela Antenna in the United States Bulletin: Trade Remedy Laws- Defense or Protection? Ed. No. 52. 2nd
Quarter 1999, SELA web site, available at: http://lanic.utexas.edu/project/sela/eng-antenna/engant52.htm, cited
March 7, 2000; and United States International Trade Commission, Department of Commerce, Certain Hot-Rolled
Steel Products from Brazil, Japan, and Russia (Washington, D.C., November 1998).
Japan and Europe negotiated the first modern steel VERs with the United States in 1968. They were implemented in 1969 and renewed in 1972. However, the market witnessed a production shift to higher-value steel products. Foreign countries avoided dumping and the impact of VERs by expanding trade in the downstream steel products or diverting trade through third countries.120 This resulted in a new wave of antidumping petitions in the mid 1970s, which overwhelmed the nation's bureaucracy. The Trigger Price Mechanism In 1977, President Jimmy Carter established a trigger pricing mechanism (TPM) whereby any steel imports coming in below a certain price would automatically prompt dumping investigations by the U.S. government. The TPM was a response of the Department of the Treasury to mitigate the workload caused by floods of antidumping and countervailing duty petitions. The TPM would self-initiate a government investigation, theoretically saving domestic
118 Thomas J. Prusa, "Why are so many antidumping petitions withdrawn?" Journal of International Economics, vol. 33, 1992, pp. 333-54. 119 J. Michael Finger and Tracy Murray, "Antidumping and Countervailing Duty Enforcement in the U.S.," in Antidumping, ed. J. Michael Finger (Ann Arbor, Michigan: University of Michigan Press, 1993), pp. 246 and 249. 120 Barry Eichengreen, Charles W. Perry, and Philip Caldwell, "International Competition in the Products of U.S. Basic Industries," in The United States in the World Economy (Chicago: University of Chicago Press, 1988), pp. 322-23.

91
firms from having to file petitions. The TPM was based on benchmark prices of the most efficient nation. In the case of steel, the TPM was Japan's cost. The TPM for steel was Japan's constructed cost comprising the direct costs plus a 10 percent charge for indirect costs or overhead plus an 8 percent charge for profit.121 The Carter administration implemented the TPM from mid-1978 to mid-1979. However, it failed to deter a surge in imports from the European countries. In fact, because Japan was the benchmark for pricing, it overestimated transportation costs among other factors in the calculation of the constructed value. A subsequent new TPM was developed in 1980 and implemented at year-end. But this did not stop a flood of antidumping measures in 1981. More than 100 AD and CVD cases were filed against European mills.122 The United States negotiated VERs with Europe but the deconcentrated world steel market made it possible at that time for developing countries to grab market share. Developing countries’ market share of United States steel demand rose from 4 percent in 1981 to 10 percent in 1984.123 It should be noted that many countries dump when the U.S. dollar is strong or when the dumping country’s currency is weak or has experienced devaluation. The U.S. Government's use of the TPMs ended in 1982. The 1984 Steel Importation Act On January 24, 1984, Bethlehem Steel Corp. and the United Steelworkers of America petitioned for the U.S. government to invoke the Sec. 201 escape clause of the 1974 Trade Act, which allowed for temporary relief for a damaged industry. Indeed, the ITC recommended relief in June 1984, relying on the subjective testimony of industry experts.124 As Grossman demonstrated, secular trends including technological improvements, labor saving changes, faster growth in other sectors, and decline in demand account for the most striking causes of steel industry job loss. Moreover, a large part of the total effect of import competition on employment since 1976 can be attributed to the appreciation of the dollar in world markets.125 President Ronald Reagan decided not to activate Sec. 201. Rather, he pressed forward on a comprehensive steel import program outlined on September 18, 1984. It is the kind of protection that domestic steel had been wanting ever since flooding the ITC and DOC with petitions. The steel import program allowed the United States Trade Representative (USTR) to negotiate VERs for a five-year period. The Steel Import Stabilization Act-Title VIII of the Trade Act of 1984 resulted in rapid agreements with 14 countries within a year.126 The VERs affected finished steel products targeting those higher value items that had escaped previous agreements.
121 Steel Imports and the Administration of the Antidumping Laws, Hearing Before a Subcommittee on Government Operations, House of Representatives, 96th Congress, Dec. 20, 1979 (Washington, D.C., 1980), p. 8. 122 Thomas R. Howell, William A. Noellert, Jesse G. Kreier, and Alan W. Wolff, Steel and the State:Government Intervention and Steel's Structural Crisis-Introduction (Westview Press, 1988), excerpted on Dewey Ballantine LLP web site, available at: http://www.dbtrade.com/publications/181947a.htm, cited April 28, 2000. 123 Ibid. 124 Gene M. Grossman, "Imports as a Cause of Injury: The Case of the U.S. Steel Industry," Journal of International Economics, vol 20. ,1986, pp. 201-23. 125 Ibid., pp. 215-21. 126 Plight of American Steelworkers Whose Jobs Have Been Adversely Impacted by Imported Steel. Hearing before a Subcommittee of the Committee on Government Operations, House of Representatives, 99th Congress, April 25, 1986, Washington, D.C., 1986, p. 41.

92
Figure A.1 demonstrates the success of the VER policy in reducing steel imports. After the initial bump in imports in 1985, a steady downward trend is in evidence until 1990 when imports attain a relatively stable level. In 1989, President George H.W. Bush granted the last two-and-a-half-year extension of the VERs to the steel industry. However, the Bush administration was phasing out the VERs in preparation for the Uruguay Round. No new countries were added into VER agreements. In an attempt to leverage the use of VERs, countries could have a one percent increase in their steel quotas if they reduced trade distorting practices.127 The VER agreements expired in March 1992.128 By the end of summer 1992, 80 new antidumping cases had been filed by steel as the industry fell back to its tried and true strategy.129 Dumping and Brazilian Steel: The 1998 Petitions By the mid-1990s, the United States steel industry had modernized and rationalized, retaining 80 percent of the domestic market with improved productivity. However, after the 1997-98 Russian and Asian economic crises, the U.S. market became target for exporters to dump excess production that could not be sold domestically because of reduced demand. Previously, 95 percent of Asian consumption was consumed internally.130 Similar currency meltdowns in Russia heightened the importance of the United States as a destination for steel dumping. A product shift moved Russian and Asian exports to the United States. On September 30, 1998, 12 steel companies and two unions filed antidumping and countervailing duty petitions against Brazil, Japan, and Russia. They were: • Bethlehem Steel Corp (Bethlehem, Pennsylvania) • U.S. Steel Group (Pittsburgh, Pennsylvania) • Ispat Inland Steel (E. Chicago, Indiana) • LTV Steel (Cleveland, Ohio) • National Steel Corp. (Mishawaka, Indiana) • California Steel Industries (Fontana, California) • Gallatin Steel (Ghent, Kentucky) • Geneva Steel (Vineyard, Utah) • Gulf States Steel (Gadsden, Alabama) • IPSCO Steel, Inc. (Muscatine, Iowa) • Steel Dynamics (Butler, Indiana) • Weirton Steel Corp. (Weirton, West Virginia) • Independent Steelworkers Union (Weirton, West Virginia)
127 Moore, "The Waning Influence of Big Steel," in The Political Economy of American Trade Policy, p. 113. 128 Alan W. Wolff, "The Positive Contribution of Antidumping to a Liberal World Trading System-Oct. 9, 1999," Dewey Ballantine LLP web site, available at: http://www.dbtrade.com/publications/bretton_woods.htm, cited April 28, 2000. 129 Greg Mastel, Antidumping Laws and the U.S. Economy (Armonk, New York: M.E. Sharpe, Economic Strategy Institute, 1998), p. 52. 130 Alan W. Wolff, "The Escape Clause and Antidumping-Remarks before American Enterprise Institute- July 19, 1999," Dewey Ballantine LLP web site, available at: http://www.dbtrade.com/publications/ the_escape_clause_and_antidumping.htm, cited April 28, 2000.

93
F
igur
e A
.1. B
razi
lian
Stee
l Im
port
s to
the
Uni
ted
Stat
es
0
0.050.1
0.150.2
0.250.3
1970
1971
1972
1973
1974
1975
1976
1977
1978
1979
1980
1981
1982
1983
1984
1985
1986
1987
1988
1989
1990
1991
1992
1993
Yea
r
Percent
So
urce
: B
razi
lian
Stee
l Ins
titut
e. B
razi
lian
Stee
l Ins
titut
e w
eb s
ite, a
vaila
ble
at: w
ww
.ibs.
org.
br.
93

94
• United Steelworkers of America (Pittsburgh, Pennsylvania)131
This use of antidumping measures conforms to the findings of Staiger and Wolak that antidumping protection is applied when foreign demand is soft.132 From September 1997 to August 1998, Brazilian imports accounted for 5 percent of the hot-rolled market, while Japan and Russia accounted for market shares of 20.2 percent and 31.8 percent, respectively.133 On October 21, 1998, the ITC held hearings whereby it made affirmative preliminary rulings against Brazilian steel. The ITC found that there was dumping and an indication of material injury. Used as evidence are lower prices charged by Brazilian firms for hot-rolled steel in table A.2.
Table A.2. U.S. and Brazil Prices of Hot-Rolled Steel Per Ton (US$)
Year Brazil United
States 1998 312.01 344.85 1997 321.93 355.62 1996 328.50 349.83 1995 382.66 376.54
Source: United States International Trade Commission, Certain Hot-Rolled Steel Products from Brazil, Japan, and
Russia-Investigations Nos. 701-TA-384 (Preliminary) and 731-TA-806-808 (Preliminary), Publication 3142,
Washington, D.C., November 1998.
On November 13, 1998, the ITC voted AD margins of 41.56 to 67 percent based on the constructed value-to-price comparison. In January 1999, final determinations ordered AD duties of 50 to 70 percent on Brazilian hot-rolled steel plus countervailing duties of 6 to 9 percent. Among the reasons for the affirmative findings, the ITC cited the increased volume and market share of imports, the excess production capacity in exporting countries, antidumping measures levied by other countries (Mexico had filed against Brazil), declining prices, and adverse trends in the financial conditions of domestic industry.134 The final rulings in January 1999 prompted the Brazilian government to reluctantly negotiate VERs with the United States. On June 7, 1999, Brazil and the United States negotiated a settlement. However, the Congress rejected the USTR-brokered deal on June 22, 1999. Finally, on July 7, 1999 the United States reached final agreements with the Government of Brazil and Brazilian steel producers to halt the dumping and subsidy orders on Brazilian hot-rolled steel in exchange for restrictions on imports and a hike of the import price. The agreement suspends the 131 United States International Trade Commission (ITC), Department of Commerce (DOC), Certain Hot-Rolled Steel Products from Brazil, Japan, and Russia-Investigations Nos. 701-TA-384 (Preliminary) and 731-TA-806-808 (Preliminary), Publication 3142, Washington, D.C., November 1998, pp. 1-2. 132 Robert W. Staiger and Frank A. Wolak, "The Effects of Domestic Antidumping Law in the Presence of Foreign Monopoly," Journal of International Economics, May 1992. 133 ITC, DOC, Certain Hot-Rolled Steel Products from Brazil, Japan, and Russia, p. 10. 134 Ibid., pp. 15-18.

95
investigations, which had determined that Brazilian government was subsidizing and dumping. Details of the agreement limited Brazilian hot-rolled imports to a quota of 295,000 metric tons per year beginning October 1, 1999. This amounted to a 28 percent reduction over previous annual levels.135 The agreement also required Brazilian producers to sell to the United States at a minimum price of $327 per metric ton. This averted future antidumping and countervailing duty orders from the ITC. The DOC had already announced the final determination of dumping margins and CVDs.136 The 1998 hot-rolled petitions ended initially in a voluntary suspension agreement. However, a review of compliance to the agreement was undertaken on September 6, 2000. Final DOC determinations announced on February 5, 2002 found that Brazil violated the suspension agreement, i.e., that Brazil sold at prices above the referenced price or did not reduce the 85 percent of the dumping margin for each dumped product entered in the investigation. This finding ended the suspension agreement signed in July 1999 and instructed the U.S. Customs Service to collect the following antidumping duties from Brazilian steel producers:
• CSN 42.27 percent • USIMINAS 43.40 percent • COSIPA 42.12 percent • All others 42.12 percent.137
The 1999 Cold-Rolled Petitions
On June 2, 1999, the familiar set of frequent filers initiated another AD and CVD process against Brazil and eleven other countries (Argentina, Japan, China, Indonesia, Russia, Slovakia, South Africa, Taiwan, Thailand, Turkey, and Venezuela). These petitioners include: • Bethlehem Steel • Gallatin Steel • Gulf States Steel • Ispat Inland Inc. • LTV Steel Company • National Steel Corporation • Steel Dynamics, Inc. • U.S. Steel Group • Weirton Steel Corp. • United Steelworkers of America
135 United States International Trade Commission, "Commerce Secretary William M. Daley Announces Agreements Substantially Reducing Imports of Brazilian Steel," ITC web site, available at: http://www.ita.doc.gov/media/ 0707BRAZIL2.html, cited March 28, 2000. 136 Ibid. 137 U.S. International Trade Administration (USITA), U.S. Department of Commerce, Office of Public Affairs, “Fact Sheet-Final Results of the Antidumping Duty Administrative Review and Termination of the Suspension Agreement of Certain Hot-Rolled Flat-Rolled Carbon Quality Steel Products from Brazil,” USITA web site, available at: http://www.ita.doc.gov/media/factsheet/hotflatroll-steel_020602.htm, cited March 14, 2002.

96
• Independent Steelworkers of America Interestingly, previous litigant, Geneva Steel, had gone bankrupt and closed in February 1999. Gulf States Steel would not last the investigative process, closing its doors in July 1999. On June 21, the investigations began and the ITC made a preliminary determination of affirmative dumping and material injury on July 16, 1999. The DOC made its preliminary determinations of CVD and AD on September 27, 1999 and November 1, 1999, respectively. Finally on January 19, 2000 the DOC announced its final determinations on CVD and AD. It set the following antidumping and countervailing duty margins:
Brazil AD Margins
• CSN 63.80 percent • USIMINAS 46.68 percent • COSIPA 46.68 percent • Others 46.68 percent
Brazil CVD Margins
• USIMINAS 10.60 percent • CSN 7.14 percent • Others 9.21 percent138
This decision affected 305,000 metric tons traded from 1996 to 1998, which had a value of $200 million. The announcement of the antidumping petition on cold-rolled steel products has had an impact on the exports of COSIPA. In January 2000, COSIPA Export Marketing Director Manuel Alvarez remarked on the absence of COSIPA from the U.S. market since the cold-rolled antidumping petition was filed in June 1999. COSIPA only filled remaining back orders from November 1998 during the second half of 1999.139 After the January 19 DOC announcement, the DOC placed temporary AD and CVD orders on Brazilian cold-rolled steel. The measures would be made permanent when the final ITC ruling was handed down. However, in an unfamiliar twist, the ITC voted 5-1 against the petitioners on March 4, 2000 issuing the final determinations on March 14. The decision stated:
an industry in the United States is not materially injured or threatened with material injury, and the establishment of an industry in the United States is not materially retarded,
138 Fact Sheet on Antidumping and Countervailing Duty Investigations: Certain Cold-Rolled Flat-Rolled Carbon-Quality Steel Products from Argentina, Brazil, the People's Republic of China, Indonesia, Japan, the Russian Federation, Slovakia, South Africa, Taiwan, Thailand, Turkey, and Venezuela, Dewey Ballantine LLP web site, available at: http://www.dbtrade.com/carbon_steel/cr_final.htm, cited April 1, 2000. 139 Malu Gaspar, "EUA vão sobretaxar aço por dumping," Folha de São Paulo (São Paulo, January 20, 2000), p. 2-5.

97
by reason of imports from Brazil of certain cold-rolled steel products, that have been found by the Department of Commerce to be subsidized by the Government of Brazil, and by reason of imports of certain cold-rolled steel products from Argentina, Brazil…that have been found by the Department of Commerce to be sold in the United States at less than fair value.140
Immediate reaction from Brazil showed favor with the ruling. "The decision is definitive. It will permit the export of cold-rolled steel without any surcharge and even represents a precedent for future cases," declared José Alfredo Graça Lima, Undersecretary for Foreign Trade and Economic Integration.141
140 United States International Trade Commission, "Certain Cold-Rolled Steel Products from Argentina, Brazil, Japan, Russia, South Africa, and Thailand," ITC web site, available at: http://www.usitc.gov/sec/10315x3.htm, cited April 1, 2000. 141 "Cai acusação de dumping contra o aço brasileiro," Folha de São Paulo (March 4, 2000), p. 2-3.

98
Box A.1. U.S. Protectionism
♦ HR 975–passed House of Representatives 289-141, killed in Senate. The bill sought to "impose quotas, tariff surcharges, or negotiate voluntary export restraint agreements in order to ensure that the volume of specified imported steel products during any month does not exceed the average volume of imported steel for the 36 month period preceding July 1997." HR 975 required the publication of import info, country of origin, port of entry, quantity, value, producer, and exporting country. Enforcement of the regulations is charged to the Sec, of Treasury and DOC, which can charge fees to carry out regulations. ♦ HR 412/Senate Bill 261–conforms Sec. 201 injury standards to WTO rules and establishes a steel import permit system to provide real time import data. ♦ Senate Bill 61–returns trade case duties to injured U.S. firms and workers. ♦ HR 327–authorizes additional retroactive application of AD duties ♦ HR 502–imposes 3 month moratorium on steel imports from 4 major countries ♦ HR 506/S. 395–imposes quotas to return steel imports to pre-crisis levels. ♦ Aug. 16, 1999–Pres. Clinton signed legislation establishing a billion dollar loan program form United States steel companies.142
By escaping legislation, President Bill Clinton promoted WTO rules, steering steel producers to loan bailouts or the AD and CVD process. This is clear in a statement of administrative policy (SAP) attached to HR 975. Clearly the administration would veto HR 975. The SAP reads: Quotas imposed outside the WTO consistent processes contained in our trade laws (section 201 safeguards laws or the quota suspension agreement provision in our antidumping and countervailing duties laws) violate our international trade obligations. These quotas would not
142 "President Signs Bill to help Steel Industry," Congressman William J. Coyne, 14th District Pennsylvania web site, available at: http://www.house.gov/coyne/nlf99_steel.htm, cited April 28, 2000.
99
be based on a determination of whether the imports are causing or threatening serious injury, or whether unfair trade or subsidization is invoked as required by the WTO.143 Prelude to Section 201 Investigations
Continuing with a tried and true strategy, U.S. steel companies filed countervailing duty petitions on August 31, 2001 against imports of carbon and alloy steel wire rod from Brazil, Canada, Germany, Trinidad and Tobago, and Turkey. On September 24, 2001, the U.S. Department of Commerce initiated antidumping and countervailing duty investigations on imports of wire rod from Brazil, Canada, Germany, and Trinidad and Tobago, AD investigations of the same against Egypt, Indonesia, Moldova, Mexico, and South Africa, with CVD cases only against Turkey. Petitioners in the wire rod cases included North Star Steel of Texas, Co-Steel Raritan, GS Industries, and Keystone Consolidated Industries, with support from Nucor Corporation.144 Preliminary rulings found that Brazil did not benefit from dumping or counteravailable subsidies. On September 28, 2001, a petition was filed by U.S. producers of cold-rolled steel for comprehensive antidumping and countervailing duty investigations on imports of cold-rolled steel. The petitioners were Bethelehem Steel Corp., United States Steel Corp., LTV Steel Company, Steel Dynamics, Inc., National Steel Corp., Nucor Corp., WCI Steel, Inc., and Weirton Steel Corp. They seek the following investigations:
• Antidumping–Australia, Belgium, Germany, India, Japan, the
Netherlands, New Zealand, China, Russia, South Africa, Spain, Sweden, Taiwan, Thailand, Turkey, and Venezuela.
• Antidumping and Countervailing Duty–Argentina, Brazil, France, and Korea.
On February 26, 2002, the Department of Commerce announced the ITA’s preliminary determination against infringing countries. In Brazil’s case the finding would impose duties on USIMINAS (12.58 percent), CSN (8.22 percent), and the others (11.9%).145 The traditional vehicle of antidumping and countervailing duty investigations litigated on behalf of the U.S. steel companies by the following law firms:
• Dewey Ballantine LLP • Skadden, Arps, Slate, Meagher and Flom LLP • Schagrin Associates
143 Isenberg-O'Lauglin, "Tensions in the Steel Trade: Thumbs Up." 144 U.S. International Trade Administration (USITA), U.S. Department of Commerce, Office of Public Affairs, “Fact Sheet-Preliminary Determinations in the Countervailing Duty Investigations on Carbon and Certain Alloy Steel Wire Rod from Brazil, Canda, Germany, Trinidad and Tobago, and Turkey,” USITA web site, available at: http://www.ita.doc.gov/media/factsheet/steelwirerod_020602.htm, cited March 14, 2002. 145 U.S. International Trade Administration (USITA), U.S. Department of Commerce, Office of Public Affairs, “Fact Sheet-Preliminary Determinations in the Countervailing Duty Investigations on Certain Cold-Rolled Carbon Steel Flat Products from Argentina, Brazil, France, and Korea,” USITA web site, available at: http://www.ita.doc.gov/media/factsheet/coldrolledpre4countries_022702.htm, cited March 14, 2002.

100
• Wiley Rein and Felding • Thompson Coburn
In partnership with the Brazilian Embassy in Washington, D.C., the Brazilian defendants have retained the law firm of Wilkie, Farr, and Gallagher. It is worth noting that the frequency of filing by U.S. petitioners has created a specialization among law firms. The costs are marginal to launch one more petition as the same arguments abound.

101
Appendix B. Economic Impacts of One TEU for Texas Region (MARAD Port Economic Impact Kit)
General Industry Effects Economic Component: Output Employment Income Gross State Product (000 $) (jobs) (000$) (000$) I. TOTAL EFFECTS (Direct and Indirect/Induced)* 1. Agriculture(Private) 0.0 0.0 0.0 0.0 2. Agri. Serv., Forestry, & Fish 0.0 0.0 0.0 0.0 3. Mining 0.0 0.0 0.0 0.0 4. Construction 0.0 0.0 0.0 0.0 5. Manufacturing 0.0 0.0 0.0 0.0 6. Transport. & Public Utilities 0.4 0.0 0.1 0.2 7. Wholesale 0.0 0.0 0.0 0.0 8. Retail Trade 0.0 0.0 0.0 0.0 9. Finance, Ins., & Real Estate 0.1 0.0 0.0 0.1 10. Services 0.1 0.0 0.0 0.1 Private Subtotal 0.7 0.0 0.2 0.4
11. Government (Public) 0.0 0.0 0.0 0.0
Total Effects (Private and Public) 0.7 0.0 0.2 0.4
II. DISTRIBUTION OF EFFECTS/MULTIPLIER 1. Direct Effects 0.4 0.0 0.1 0.2 2. Indirect and Induced Effects 0.3 0.0 0.1 0.2 3. Total Effects 0.7 0.0 0.2 0.4 4. Multipliers (3/1) 1.882 1.886 1.906 2.051
III. COMPOSITION OF GROSS STATE PRODUCT 1. Wages--Net of Taxes 0.2 2. Taxes a. Local 0.1 b. State 0.0 c. Federal 0.0 General 0.0 Social Security 0.0 3. Profits, dividends, rents, and other 0.1 4. Total Gross State Product (1+2+3) 0.4
EFFECTS PER MILLION DOLLARS OF INITIAL EXPENDITURE Employment (Jobs) 21.7 Income 625,685.8 State Taxes 26,899.3 Local Taxes 49,107.9 Gross State Product 1,067,179.7
Note: Detail may not sum to totals due to rounding. *Terms: Direct Effects --the proportion of direct port-related spending on goods and services produced in the specified region. Indirect Effects--the value of goods and services needed to support the provision of those direct economic effects. Induced Effects--the value of goods and sevices needed by households that provide the direct and indirect labor.

102
Direct Effects Agriculture 0.0 0.0 0.0 0.0 Dairy Farm Products 0.00 0.0 0.0 0.0 Eggs 0.00 0.0 0.0 0.0 Meat Animals 0.00 0.0 0.0 0.0 Misc. Livestock 0.00 0.0 0.0 0.0 Wool 0.00 0.0 0.0 0.0 Cotton 0.00 0.0 0.0 0.0 Tobacco 0.00 0.0 0.0 0.0 Grains & Misc. Crops 0.00 0.0 0.0 0.0 Feed Crops 0.00 0.0 0.0 0.0 Fruits & Nuts 0.00 0.0 0.0 0.0 Vegetables 0.00 0.0 0.0 0.0 Greenhouse & Nursery Products 0.00 0.0 0.0 0.0 Sugar Beets & Cane 0.00 0.0 0.0 0.0 Flaxseed, Peanuts, Soybean, Sunflower 0.00 0.0 0.0 0.0 Agricultural Services, Forestry and Fish 0.0 0.0 0.0 0.0 Agri. Services (07) 0.00 0.0 0.0 0.0 Forestry (08) 0.00 0.0 0.0 0.0 Fishing, Hunting, & Trapping (09) 0.00 0.0 0.0 0.0 Mining 0.0 0.0 0.0 0.0 Coal Mining (12) 0.00 0.0 0.0 0.0 Oil & Gas Extraction (13) 0.00 0.0 0.0 0.0 Nonmetal Min.-Ex. Fuels (14) 0.00 0.0 0.0 0.0 Metal Mining (10) 0.00 0.0 0.0 0.0 Construction 0.0 0.0 0.0 0.0 General Bldg. Contractors (15) 0.00 0.0 0.0 0.0 Heavy Const. Contractors (16) 0.00 0.0 0.0 0.0 Special Trade Contractors (17) 0.00 0.0 0.0 0.0 Manufacturing 0.0 0.0 0.0 0.0 Printing & Publishing (27) 0.00 0.0 0.0 0.0 Chemicals & Allied Prod. (28) 0.00 0.0 0.0 0.0 Petroleum & Coal Prod. (29) 0.02 0.0 0.0 0.0 Rubber & Misc. Plastics (30) 0.00 0.0 0.0 0.0 Leather & Leather Prod. (31) 0.00 0.0 0.0 0.0 Stone, Clay, & Glass (32) 0.00 0.0 0.0 0.0 Primary Metal Prod. (33) 0.00 0.0 0.0 0.0 Fabricated Metal Prod. (34) 0.00 0.0 0.0 0.0 Machinery, Except Elec. (35) 0.00 0.0 0.0 0.0 Electric & Elec. Equip. (36) 0.00 0.0 0.0 0.0 Transportation Equipment (37) 0.00 0.0 0.0 0.0
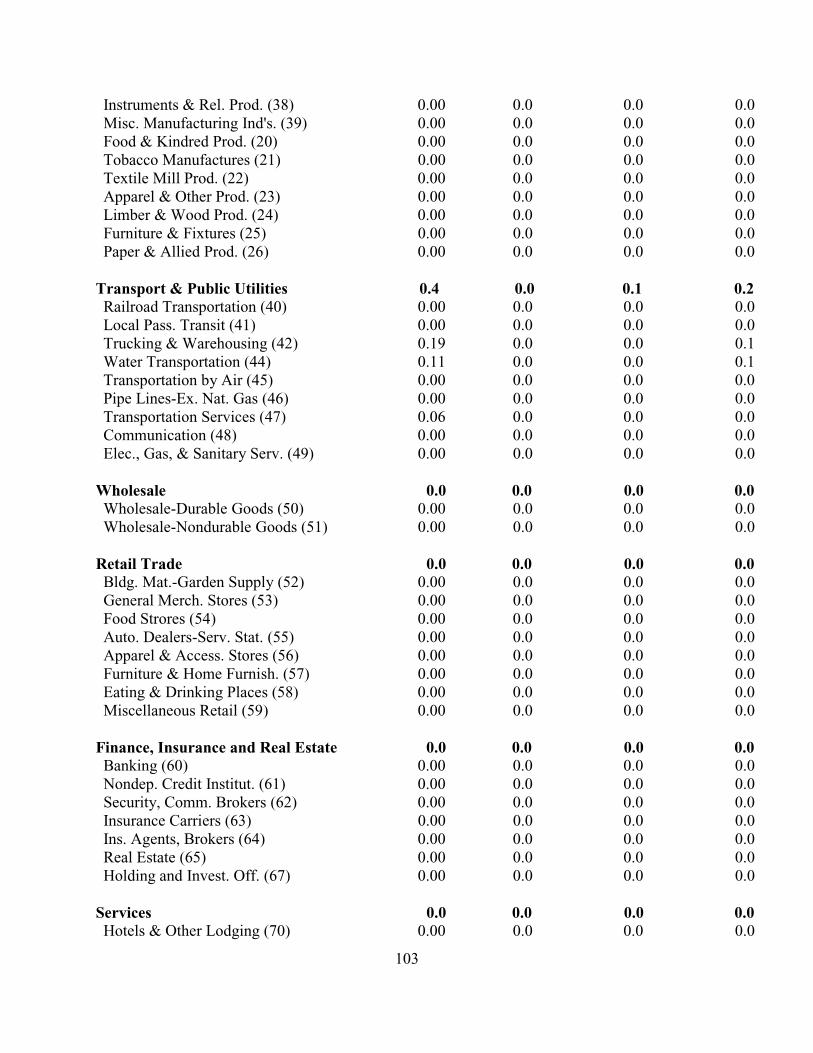
103
Instruments & Rel. Prod. (38) 0.00 0.0 0.0 0.0 Misc. Manufacturing Ind's. (39) 0.00 0.0 0.0 0.0 Food & Kindred Prod. (20) 0.00 0.0 0.0 0.0 Tobacco Manufactures (21) 0.00 0.0 0.0 0.0 Textile Mill Prod. (22) 0.00 0.0 0.0 0.0 Apparel & Other Prod. (23) 0.00 0.0 0.0 0.0 Limber & Wood Prod. (24) 0.00 0.0 0.0 0.0 Furniture & Fixtures (25) 0.00 0.0 0.0 0.0 Paper & Allied Prod. (26) 0.00 0.0 0.0 0.0 Transport & Public Utilities 0.4 0.0 0.1 0.2 Railroad Transportation (40) 0.00 0.0 0.0 0.0 Local Pass. Transit (41) 0.00 0.0 0.0 0.0 Trucking & Warehousing (42) 0.19 0.0 0.0 0.1 Water Transportation (44) 0.11 0.0 0.0 0.1 Transportation by Air (45) 0.00 0.0 0.0 0.0 Pipe Lines-Ex. Nat. Gas (46) 0.00 0.0 0.0 0.0 Transportation Services (47) 0.06 0.0 0.0 0.0 Communication (48) 0.00 0.0 0.0 0.0 Elec., Gas, & Sanitary Serv. (49) 0.00 0.0 0.0 0.0 Wholesale 0.0 0.0 0.0 0.0 Wholesale-Durable Goods (50) 0.00 0.0 0.0 0.0 Wholesale-Nondurable Goods (51) 0.00 0.0 0.0 0.0 Retail Trade 0.0 0.0 0.0 0.0 Bldg. Mat.-Garden Supply (52) 0.00 0.0 0.0 0.0 General Merch. Stores (53) 0.00 0.0 0.0 0.0 Food Strores (54) 0.00 0.0 0.0 0.0 Auto. Dealers-Serv. Stat. (55) 0.00 0.0 0.0 0.0 Apparel & Access. Stores (56) 0.00 0.0 0.0 0.0 Furniture & Home Furnish. (57) 0.00 0.0 0.0 0.0 Eating & Drinking Places (58) 0.00 0.0 0.0 0.0 Miscellaneous Retail (59) 0.00 0.0 0.0 0.0 Finance, Insurance and Real Estate 0.0 0.0 0.0 0.0 Banking (60) 0.00 0.0 0.0 0.0 Nondep. Credit Institut. (61) 0.00 0.0 0.0 0.0 Security, Comm. Brokers (62) 0.00 0.0 0.0 0.0 Insurance Carriers (63) 0.00 0.0 0.0 0.0 Ins. Agents, Brokers (64) 0.00 0.0 0.0 0.0 Real Estate (65) 0.00 0.0 0.0 0.0 Holding and Invest. Off. (67) 0.00 0.0 0.0 0.0 Services 0.0 0.0 0.0 0.0 Hotels & Other Lodging (70) 0.00 0.0 0.0 0.0

104
Personal Services (72) 0.00 0.0 0.0 0.0 Business Services (73) 0.00 0.0 0.0 0.0 Auto Repair, Serv., Garages (75) 0.00 0.0 0.0 0.0 Misc. Repair Services (76) 0.00 0.0 0.0 0.0 Motion Pictures (78) 0.00 0.0 0.0 0.0 Amusement & Recreation (79) 0.00 0.0 0.0 0.0 Health Services (80) 0.00 0.0 0.0 0.0 Legal Services (81) 0.00 0.0 0.0 0.0 Educational Services (82) 0.00 0.0 0.0 0.0 Social Services (83) 0.00 0.0 0.0 0.0 Museums, Gardens & Mem. Orgs. (84, 86) 0.00 0.0 0.0 0.0 Engineer. & Manage. Serv. (87) 0.00 0.0 0.0 0.0 Private Households (88) 0.00 0.0 0.0 0.0 Micscellaneous Services (89) 0.00 0.0 0.0 0.0 Government 0.0 0.0 0.0 0.0 Total 0.4 0.0 0.1 0.2 Note: Detail may not sum to totals due to rounding. Two Digit SIC Industry Indirect Effects Agriculture 0.0 0.0 0.0 0.0 Dairy Farm Products 0.0 0.0 0.0 0.0 Eggs 0.0 0.0 0.0 0.0 Meat Animals 0.0 0.0 0.0 0.0 Misc. Livestock 0.0 0.0 0.0 0.0 Wool 0.0 0.0 0.0 0.0 Cotton 0.0 0.0 0.0 0.0 Tobacco 0.0 0.0 0.0 0.0 Grains & Misc. Crops 0.0 0.0 0.0 0.0 Feed Crops 0.0 0.0 0.0 0.0 Fruits & Nuts 0.0 0.0 0.0 0.0 Vegetables 0.0 0.0 0.0 0.0 Greenhouse & Nursery Products 0.0 0.0 0.0 0.0 Sugar Beets & Cane 0.0 0.0 0.0 0.0 Flaxseed, Peanuts, Soybean, Sunflower 0.0 0.0 0.0 0.0 Agricultural Services, Forestry & Fish 0.0 0.0 0.0 0.0 Agri. Services (07) 0.0 0.0 0.0 0.0 Forestry (08) 0.0 0.0 0.0 0.0 Fishing, Hunting, & Trapping (09) 0.0 0.0 0.0 0.0 Mining 0.0 0.0 0.0 0.0 Coal Mining (12) 0.0 0.0 0.0 0.0 Oil & Gas Extraction (13) 0.0 0.0 0.0 0.0
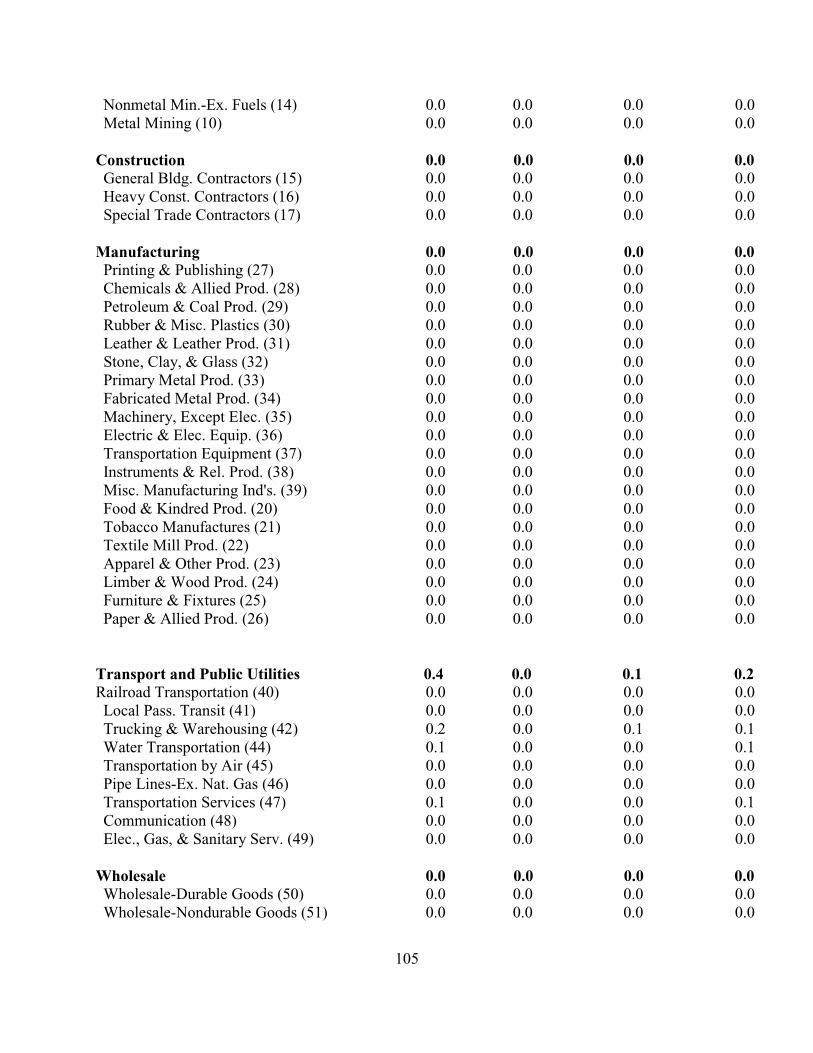
105
Nonmetal Min.-Ex. Fuels (14) 0.0 0.0 0.0 0.0 Metal Mining (10) 0.0 0.0 0.0 0.0 Construction 0.0 0.0 0.0 0.0 General Bldg. Contractors (15) 0.0 0.0 0.0 0.0 Heavy Const. Contractors (16) 0.0 0.0 0.0 0.0 Special Trade Contractors (17) 0.0 0.0 0.0 0.0 Manufacturing 0.0 0.0 0.0 0.0 Printing & Publishing (27) 0.0 0.0 0.0 0.0 Chemicals & Allied Prod. (28) 0.0 0.0 0.0 0.0 Petroleum & Coal Prod. (29) 0.0 0.0 0.0 0.0 Rubber & Misc. Plastics (30) 0.0 0.0 0.0 0.0 Leather & Leather Prod. (31) 0.0 0.0 0.0 0.0 Stone, Clay, & Glass (32) 0.0 0.0 0.0 0.0 Primary Metal Prod. (33) 0.0 0.0 0.0 0.0 Fabricated Metal Prod. (34) 0.0 0.0 0.0 0.0 Machinery, Except Elec. (35) 0.0 0.0 0.0 0.0 Electric & Elec. Equip. (36) 0.0 0.0 0.0 0.0 Transportation Equipment (37) 0.0 0.0 0.0 0.0 Instruments & Rel. Prod. (38) 0.0 0.0 0.0 0.0 Misc. Manufacturing Ind's. (39) 0.0 0.0 0.0 0.0 Food & Kindred Prod. (20) 0.0 0.0 0.0 0.0 Tobacco Manufactures (21) 0.0 0.0 0.0 0.0 Textile Mill Prod. (22) 0.0 0.0 0.0 0.0 Apparel & Other Prod. (23) 0.0 0.0 0.0 0.0 Limber & Wood Prod. (24) 0.0 0.0 0.0 0.0 Furniture & Fixtures (25) 0.0 0.0 0.0 0.0 Paper & Allied Prod. (26) 0.0 0.0 0.0 0.0 Transport and Public Utilities 0.4 0.0 0.1 0.2 Railroad Transportation (40) 0.0 0.0 0.0 0.0 Local Pass. Transit (41) 0.0 0.0 0.0 0.0 Trucking & Warehousing (42) 0.2 0.0 0.1 0.1 Water Transportation (44) 0.1 0.0 0.0 0.1 Transportation by Air (45) 0.0 0.0 0.0 0.0 Pipe Lines-Ex. Nat. Gas (46) 0.0 0.0 0.0 0.0 Transportation Services (47) 0.1 0.0 0.0 0.1 Communication (48) 0.0 0.0 0.0 0.0 Elec., Gas, & Sanitary Serv. (49) 0.0 0.0 0.0 0.0 Wholesale 0.0 0.0 0.0 0.0 Wholesale-Durable Goods (50) 0.0 0.0 0.0 0.0 Wholesale-Nondurable Goods (51) 0.0 0.0 0.0 0.0
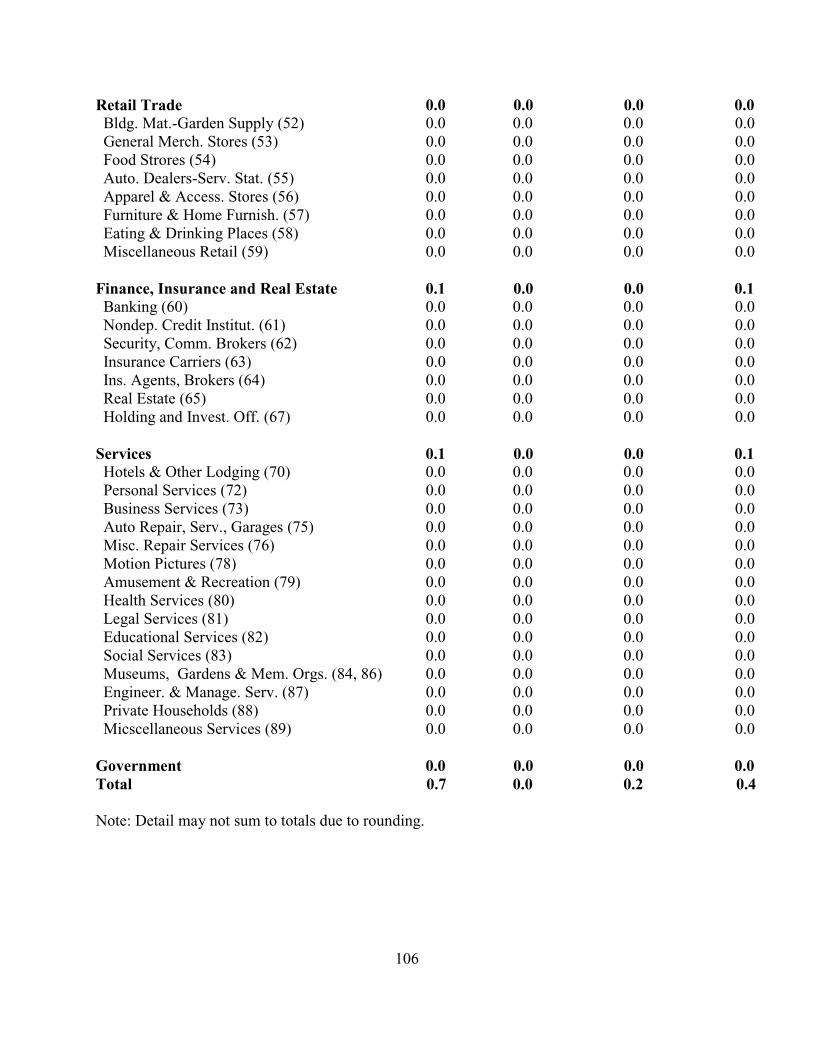
106
Retail Trade 0.0 0.0 0.0 0.0 Bldg. Mat.-Garden Supply (52) 0.0 0.0 0.0 0.0 General Merch. Stores (53) 0.0 0.0 0.0 0.0 Food Strores (54) 0.0 0.0 0.0 0.0 Auto. Dealers-Serv. Stat. (55) 0.0 0.0 0.0 0.0 Apparel & Access. Stores (56) 0.0 0.0 0.0 0.0 Furniture & Home Furnish. (57) 0.0 0.0 0.0 0.0 Eating & Drinking Places (58) 0.0 0.0 0.0 0.0 Miscellaneous Retail (59) 0.0 0.0 0.0 0.0 Finance, Insurance and Real Estate 0.1 0.0 0.0 0.1 Banking (60) 0.0 0.0 0.0 0.0 Nondep. Credit Institut. (61) 0.0 0.0 0.0 0.0 Security, Comm. Brokers (62) 0.0 0.0 0.0 0.0 Insurance Carriers (63) 0.0 0.0 0.0 0.0 Ins. Agents, Brokers (64) 0.0 0.0 0.0 0.0 Real Estate (65) 0.0 0.0 0.0 0.0 Holding and Invest. Off. (67) 0.0 0.0 0.0 0.0 Services 0.1 0.0 0.0 0.1 Hotels & Other Lodging (70) 0.0 0.0 0.0 0.0 Personal Services (72) 0.0 0.0 0.0 0.0 Business Services (73) 0.0 0.0 0.0 0.0 Auto Repair, Serv., Garages (75) 0.0 0.0 0.0 0.0 Misc. Repair Services (76) 0.0 0.0 0.0 0.0 Motion Pictures (78) 0.0 0.0 0.0 0.0 Amusement & Recreation (79) 0.0 0.0 0.0 0.0 Health Services (80) 0.0 0.0 0.0 0.0 Legal Services (81) 0.0 0.0 0.0 0.0 Educational Services (82) 0.0 0.0 0.0 0.0 Social Services (83) 0.0 0.0 0.0 0.0 Museums, Gardens & Mem. Orgs. (84, 86) 0.0 0.0 0.0 0.0 Engineer. & Manage. Serv. (87) 0.0 0.0 0.0 0.0 Private Households (88) 0.0 0.0 0.0 0.0 Micscellaneous Services (89) 0.0 0.0 0.0 0.0 Government 0.0 0.0 0.0 0.0 Total 0.7 0.0 0.2 0.4 Note: Detail may not sum to totals due to rounding.
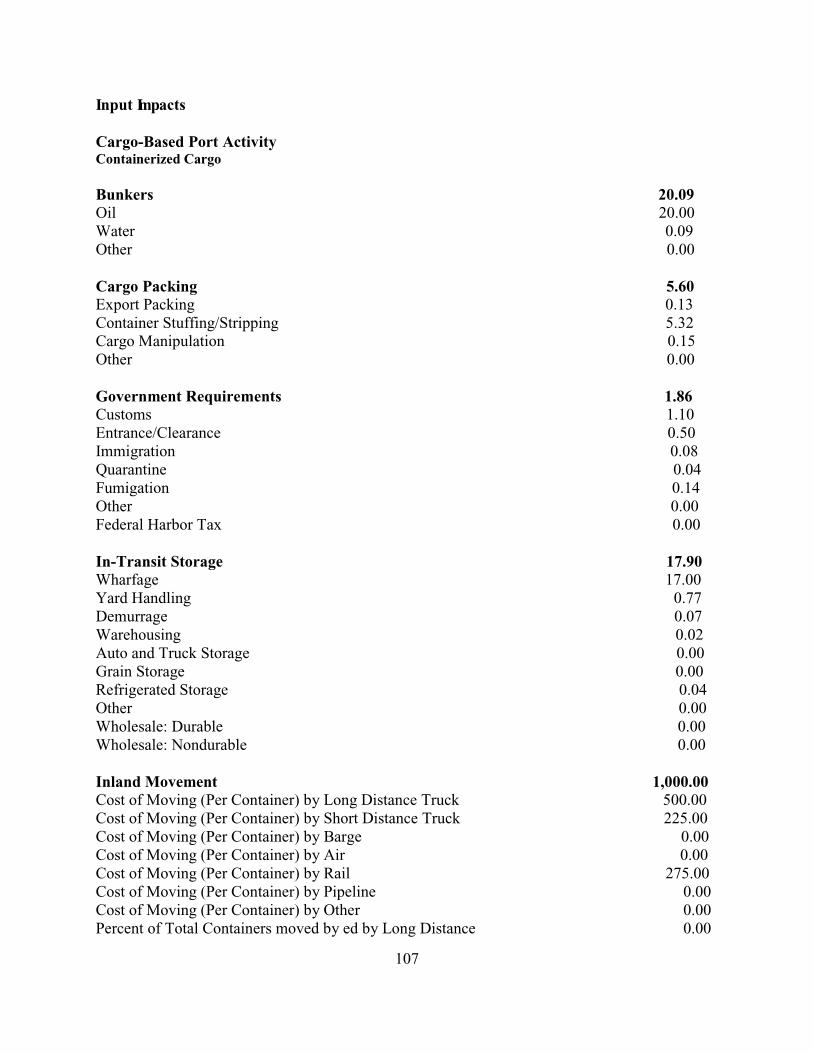
107
Input Impacts Cargo-Based Port Activity Containerized Cargo Bunkers 20.09 Oil 20.00 Water 0.09 Other 0.00 Cargo Packing 5.60 Export Packing 0.13 Container Stuffing/Stripping 5.32 Cargo Manipulation 0.15 Other 0.00 Government Requirements 1.86 Customs 1.10 Entrance/Clearance 0.50 Immigration 0.08 Quarantine 0.04 Fumigation 0.14 Other 0.00 Federal Harbor Tax 0.00 In-Transit Storage 17.90 Wharfage 17.00 Yard Handling 0.77 Demurrage 0.07 Warehousing 0.02 Auto and Truck Storage 0.00 Grain Storage 0.00 Refrigerated Storage 0.04 Other 0.00 Wholesale: Durable 0.00 Wholesale: Nondurable 0.00 Inland Movement 1,000.00 Cost of Moving (Per Container) by Long Distance Truck 500.00 Cost of Moving (Per Container) by Short Distance Truck 225.00 Cost of Moving (Per Container) by Barge 0.00 Cost of Moving (Per Container) by Air 0.00 Cost of Moving (Per Container) by Rail 275.00 Cost of Moving (Per Container) by Pipeline 0.00 Cost of Moving (Per Container) by Other 0.00 Percent of Total Containers moved by ed by Long Distance 0.00

108
Percent of Total Containers moved by ed by Short Distance 100.00 Percent of Total Containers moved by ed by Barge 0.00 Percent of Total Containers moved by ed by Air 0.00 Percent of Total Containers moved by ed by Rail 0.00 Percent of Total Containers moved by ed by Pipeline 0.00 Percent of Total Containers moved by ed by Other 0.00 Loading/Discharging 96.03 Stevedoring 93.68 Clerking and checking 0.88 Watching 0.11Cleaning/Fitting 0.00 Equipment Rental 1.10 Agency Fee 0.26 Other 0.00 Service 11.33 Tugs 2.85 Pilots 3.74 Line Handling 1.47 Launch 0.64 Radio/Radar 0.04 Surveyage 0.13 Dockage 2.46Lighterage 0.00 Other 0.00 Supplies 1.22 Chandler/Provisions 0.92 Laundry 0.04 Medical 0.24 Waste 0.02 Security 0.00 Other 0.00 Crew Leave Spending 0.00 Total Cost per Container (in TEUs) 379.03 Total Number of Containers (in TEUs) 1.00
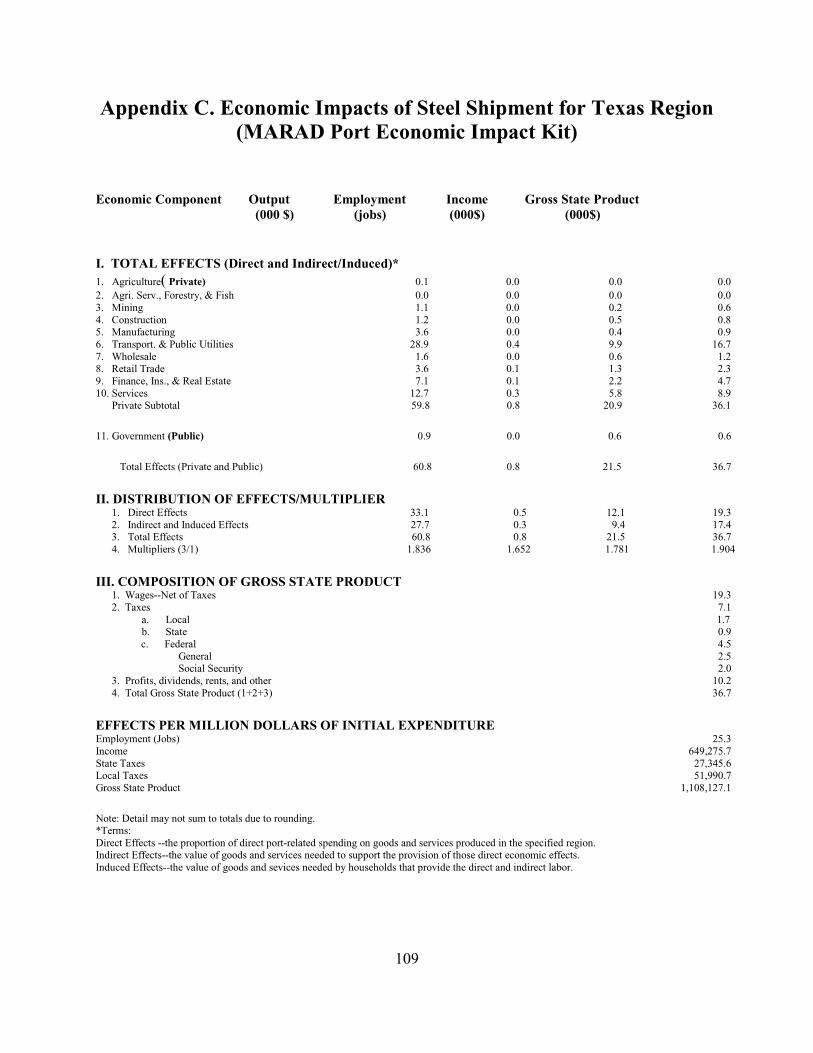
109
Appendix C. Economic Impacts of Steel Shipment for Texas Region (MARAD Port Economic Impact Kit)
Economic Component Output Employment Income Gross State Product (000 $) (jobs) (000$) (000$) I. TOTAL EFFECTS (Direct and Indirect/Induced)* 1. Agriculture( Private) 0.1 0.0 0.0 0.0 2. Agri. Serv., Forestry, & Fish 0.0 0.0 0.0 0.0 3. Mining 1.1 0.0 0.2 0.6 4. Construction 1.2 0.0 0.5 0.8 5. Manufacturing 3.6 0.0 0.4 0.9 6. Transport. & Public Utilities 28.9 0.4 9.9 16.7 7. Wholesale 1.6 0.0 0.6 1.2 8. Retail Trade 3.6 0.1 1.3 2.3 9. Finance, Ins., & Real Estate 7.1 0.1 2.2 4.7 10. Services 12.7 0.3 5.8 8.9 Private Subtotal 59.8 0.8 20.9 36.1
11. Government (Public) 0.9 0.0 0.6 0.6
Total Effects (Private and Public) 60.8 0.8 21.5 36.7
II. DISTRIBUTION OF EFFECTS/MULTIPLIER 1. Direct Effects 33.1 0.5 12.1 19.3 2. Indirect and Induced Effects 27.7 0.3 9.4 17.4 3. Total Effects 60.8 0.8 21.5 36.7 4. Multipliers (3/1) 1.836 1.652 1.781 1.904
III. COMPOSITION OF GROSS STATE PRODUCT 1. Wages--Net of Taxes 19.3 2. Taxes 7.1
a. Local 1.7 b. State 0.9
c. Federal 4.5 General 2.5 Social Security 2.0 3. Profits, dividends, rents, and other 10.2 4. Total Gross State Product (1+2+3) 36.7
EFFECTS PER MILLION DOLLARS OF INITIAL EXPENDITURE Employment (Jobs) 25.3 Income 649,275.7 State Taxes 27,345.6 Local Taxes 51,990.7 Gross State Product 1,108,127.1
Note: Detail may not sum to totals due to rounding. *Terms: Direct Effects --the proportion of direct port-related spending on goods and services produced in the specified region. Indirect Effects--the value of goods and services needed to support the provision of those direct economic effects. Induced Effects--the value of goods and sevices needed by households that provide the direct and indirect labor.
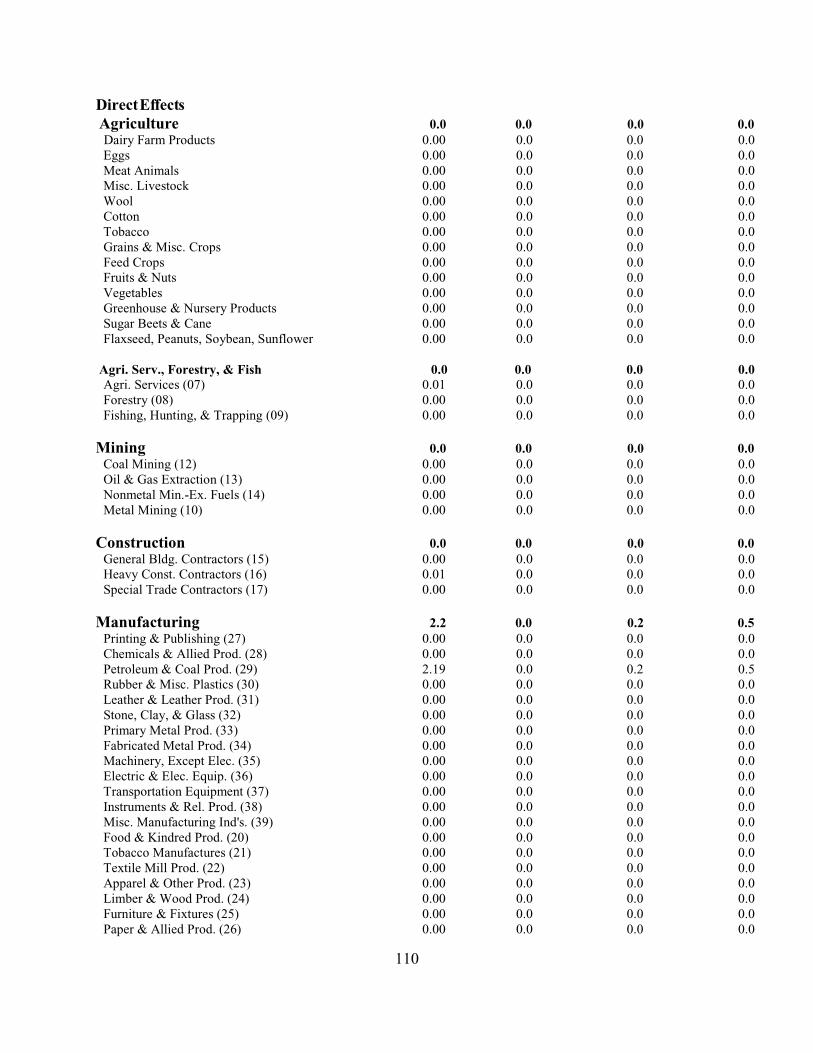
110
Direct Effects Agriculture 0.0 0.0 0.0 0.0 Dairy Farm Products 0.00 0.0 0.0 0.0 Eggs 0.00 0.0 0.0 0.0 Meat Animals 0.00 0.0 0.0 0.0 Misc. Livestock 0.00 0.0 0.0 0.0 Wool 0.00 0.0 0.0 0.0 Cotton 0.00 0.0 0.0 0.0 Tobacco 0.00 0.0 0.0 0.0 Grains & Misc. Crops 0.00 0.0 0.0 0.0 Feed Crops 0.00 0.0 0.0 0.0 Fruits & Nuts 0.00 0.0 0.0 0.0 Vegetables 0.00 0.0 0.0 0.0 Greenhouse & Nursery Products 0.00 0.0 0.0 0.0 Sugar Beets & Cane 0.00 0.0 0.0 0.0 Flaxseed, Peanuts, Soybean, Sunflower 0.00 0.0 0.0 0.0 Agri. Serv., Forestry, & Fish 0.0 0.0 0.0 0.0 Agri. Services (07) 0.01 0.0 0.0 0.0 Forestry (08) 0.00 0.0 0.0 0.0 Fishing, Hunting, & Trapping (09) 0.00 0.0 0.0 0.0 Mining 0.0 0.0 0.0 0.0 Coal Mining (12) 0.00 0.0 0.0 0.0 Oil & Gas Extraction (13) 0.00 0.0 0.0 0.0 Nonmetal Min.-Ex. Fuels (14) 0.00 0.0 0.0 0.0 Metal Mining (10) 0.00 0.0 0.0 0.0 Construction 0.0 0.0 0.0 0.0 General Bldg. Contractors (15) 0.00 0.0 0.0 0.0 Heavy Const. Contractors (16) 0.01 0.0 0.0 0.0 Special Trade Contractors (17) 0.00 0.0 0.0 0.0 Manufacturing 2.2 0.0 0.2 0.5 Printing & Publishing (27) 0.00 0.0 0.0 0.0 Chemicals & Allied Prod. (28) 0.00 0.0 0.0 0.0 Petroleum & Coal Prod. (29) 2.19 0.0 0.2 0.5 Rubber & Misc. Plastics (30) 0.00 0.0 0.0 0.0 Leather & Leather Prod. (31) 0.00 0.0 0.0 0.0 Stone, Clay, & Glass (32) 0.00 0.0 0.0 0.0 Primary Metal Prod. (33) 0.00 0.0 0.0 0.0 Fabricated Metal Prod. (34) 0.00 0.0 0.0 0.0 Machinery, Except Elec. (35) 0.00 0.0 0.0 0.0 Electric & Elec. Equip. (36) 0.00 0.0 0.0 0.0 Transportation Equipment (37) 0.00 0.0 0.0 0.0 Instruments & Rel. Prod. (38) 0.00 0.0 0.0 0.0 Misc. Manufacturing Ind's. (39) 0.00 0.0 0.0 0.0 Food & Kindred Prod. (20) 0.00 0.0 0.0 0.0 Tobacco Manufactures (21) 0.00 0.0 0.0 0.0 Textile Mill Prod. (22) 0.00 0.0 0.0 0.0 Apparel & Other Prod. (23) 0.00 0.0 0.0 0.0 Limber & Wood Prod. (24) 0.00 0.0 0.0 0.0 Furniture & Fixtures (25) 0.00 0.0 0.0 0.0 Paper & Allied Prod. (26) 0.00 0.0 0.0 0.0

111
Transport & Public Utilities 24.1 0.3 8.6 13.8 Railroad Transportation (40) 0.00 0.0 0.0 0.0 Local Pass. Transit (41) 0.00 0.0 0.0 0.0 Trucking & Warehousing (42) 10.88 0.1 2.9 4.1 Water Transportation (44) 10.69 0.2 4.6 7.6 Transportation by Air (45) 0.00 0.0 0.0 0.0 Pipe Lines-Ex. Nat. Gas (46) 0.00 0.0 0.0 0.0 Transportation Services (47) 2.43 0.0 1.1 2.0 Communication (48) 0.01 0.0 0.0 0.0 Elec., Gas, & Sanitary Serv. (49) 0.08 0.0 0.0 0.1 Wholesale 0.2 0.0 0.1 0.2 Wholesale-Durable Goods (50) 0.00 0.0 0.0 0.0 Wholesale-Nondurable Goods (51) 0.25 0.0 0.1 0.2 Retail Trade 0.0 0.0 0.0 0.0 Bldg. Mat.-Garden Supply (52) 0.00 0.0 0.0 0.0 General Merch. Stores (53) 0.00 0.0 0.0 0.0 Food Strores (54) 0.00 0.0 0.0 0.0 Auto. Dealers-Serv. Stat. (55) 0.00 0.0 0.0 0.0 Apparel & Access. Stores (56) 0.00 0.0 0.0 0.0 Furniture & Home Furnish. (57) 0.00 0.0 0.0 0.0 Eating & Drinking Places (58) 0.01 0.0 0.0 0.0 Miscellaneous Retail (59) 0.00 0.0 0.0 0.0 Finance, Insurance, & Real Estate 0.0 0.0 0.0 0.0 Banking (60) 0.00 0.0 0.0 0.0 Nondep. Credit Institut. (61) 0.00 0.0 0.0 0.0 Security, Comm. Brokers (62) 0.00 0.0 0.0 0.0 Insurance Carriers (63) 0.00 0.0 0.0 0.0 Ins. Agents, Brokers (64) 0.00 0.0 0.0 0.0 Real Estate (65) 0.00 0.0 0.0 0.0 Holding and Invest. Off. (67) 0.00 0.0 0.0 0.0 Services 5.9 0.2 2.7 4.3 Hotels & Other Lodging (70) 0.00 0.0 0.0 0.0 Personal Services (72) 0.01 0.0 0.0 0.0 Business Services (73) 5.82 0.2 2.7 4.2 Auto Repair, Serv., Garages (75) 0.00 0.0 0.0 0.0 Misc. Repair Services (76) 0.00 0.0 0.0 0.0 Motion Pictures (78) 0.00 0.0 0.0 0.0 Amusement & Recreation (79) 0.00 0.0 0.0 0.0 Health Services (80) 0.04 0.0 0.0 0.0 Legal Services (81) 0.00 0.0 0.0 0.0 Educational Services (82) 0.00 0.0 0.0 0.0 Social Services (83) 0.00 0.0 0.0 0.0 Museums, Gardens & Mem. Orgs. (84, 86) 0.00 0.0 0.0 0.0 Engineer. & Manage. Serv. (87) 0.00 0.0 0.0 0.0 Private Households (88) 0.00 0.0 0.0 0.0 Miscellaneous Services (89) 0.00 0.0 0.0 0.0 Government 0.6 0.0 0.4 0.5 Total 33.1 0.5 12.1 19.3
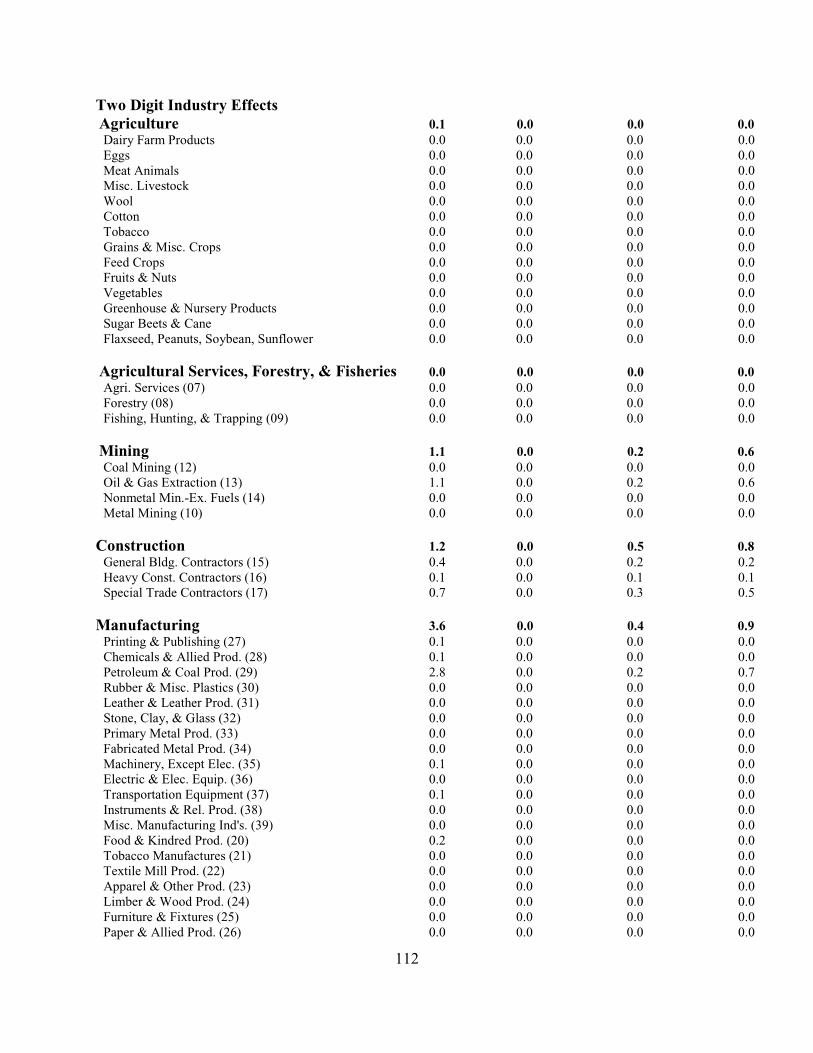
112
Two Digit Industry Effects Agriculture 0.1 0.0 0.0 0.0 Dairy Farm Products 0.0 0.0 0.0 0.0 Eggs 0.0 0.0 0.0 0.0 Meat Animals 0.0 0.0 0.0 0.0 Misc. Livestock 0.0 0.0 0.0 0.0 Wool 0.0 0.0 0.0 0.0 Cotton 0.0 0.0 0.0 0.0 Tobacco 0.0 0.0 0.0 0.0 Grains & Misc. Crops 0.0 0.0 0.0 0.0 Feed Crops 0.0 0.0 0.0 0.0 Fruits & Nuts 0.0 0.0 0.0 0.0 Vegetables 0.0 0.0 0.0 0.0 Greenhouse & Nursery Products 0.0 0.0 0.0 0.0 Sugar Beets & Cane 0.0 0.0 0.0 0.0 Flaxseed, Peanuts, Soybean, Sunflower 0.0 0.0 0.0 0.0 Agricultural Services, Forestry, & Fisheries 0.0 0.0 0.0 0.0 Agri. Services (07) 0.0 0.0 0.0 0.0 Forestry (08) 0.0 0.0 0.0 0.0 Fishing, Hunting, & Trapping (09) 0.0 0.0 0.0 0.0 Mining 1.1 0.0 0.2 0.6 Coal Mining (12) 0.0 0.0 0.0 0.0 Oil & Gas Extraction (13) 1.1 0.0 0.2 0.6 Nonmetal Min.-Ex. Fuels (14) 0.0 0.0 0.0 0.0 Metal Mining (10) 0.0 0.0 0.0 0.0 Construction 1.2 0.0 0.5 0.8 General Bldg. Contractors (15) 0.4 0.0 0.2 0.2 Heavy Const. Contractors (16) 0.1 0.0 0.1 0.1 Special Trade Contractors (17) 0.7 0.0 0.3 0.5 Manufacturing 3.6 0.0 0.4 0.9 Printing & Publishing (27) 0.1 0.0 0.0 0.0 Chemicals & Allied Prod. (28) 0.1 0.0 0.0 0.0 Petroleum & Coal Prod. (29) 2.8 0.0 0.2 0.7 Rubber & Misc. Plastics (30) 0.0 0.0 0.0 0.0 Leather & Leather Prod. (31) 0.0 0.0 0.0 0.0 Stone, Clay, & Glass (32) 0.0 0.0 0.0 0.0 Primary Metal Prod. (33) 0.0 0.0 0.0 0.0 Fabricated Metal Prod. (34) 0.0 0.0 0.0 0.0 Machinery, Except Elec. (35) 0.1 0.0 0.0 0.0 Electric & Elec. Equip. (36) 0.0 0.0 0.0 0.0 Transportation Equipment (37) 0.1 0.0 0.0 0.0 Instruments & Rel. Prod. (38) 0.0 0.0 0.0 0.0 Misc. Manufacturing Ind's. (39) 0.0 0.0 0.0 0.0 Food & Kindred Prod. (20) 0.2 0.0 0.0 0.0 Tobacco Manufactures (21) 0.0 0.0 0.0 0.0 Textile Mill Prod. (22) 0.0 0.0 0.0 0.0 Apparel & Other Prod. (23) 0.0 0.0 0.0 0.0 Limber & Wood Prod. (24) 0.0 0.0 0.0 0.0 Furniture & Fixtures (25) 0.0 0.0 0.0 0.0 Paper & Allied Prod. (26) 0.0 0.0 0.0 0.0
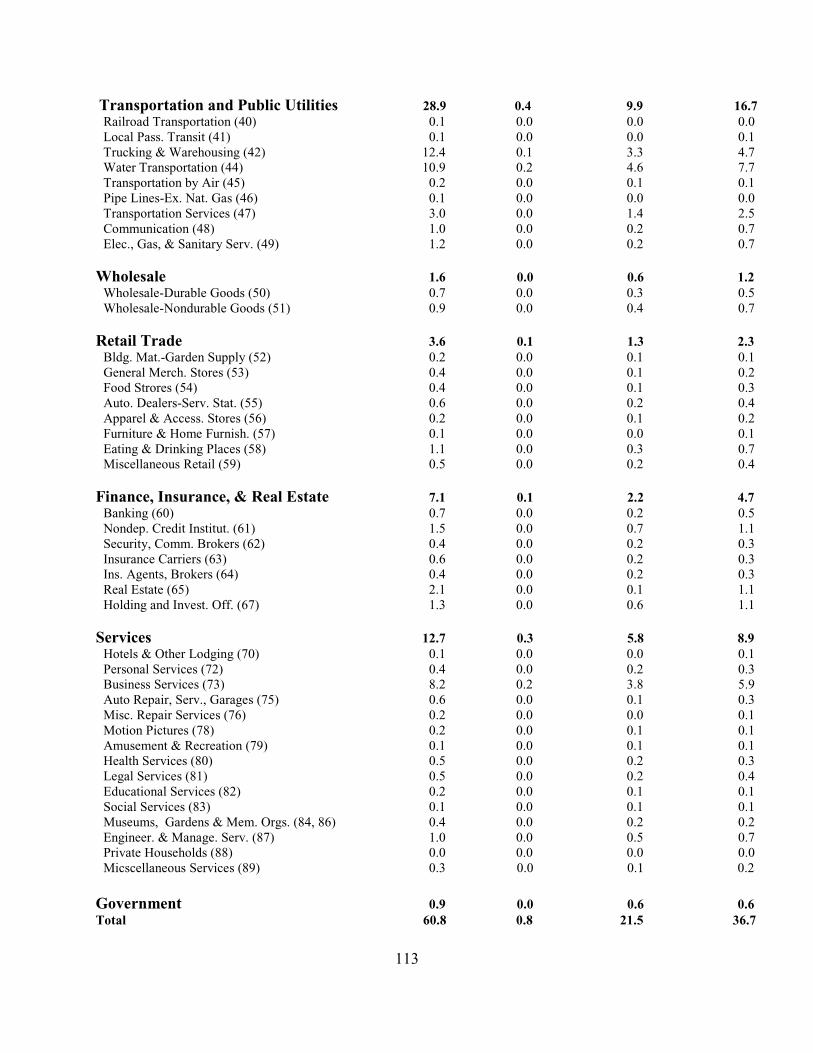
113
Transportation and Public Utilities 28.9 0.4 9.9 16.7 Railroad Transportation (40) 0.1 0.0 0.0 0.0 Local Pass. Transit (41) 0.1 0.0 0.0 0.1 Trucking & Warehousing (42) 12.4 0.1 3.3 4.7 Water Transportation (44) 10.9 0.2 4.6 7.7 Transportation by Air (45) 0.2 0.0 0.1 0.1 Pipe Lines-Ex. Nat. Gas (46) 0.1 0.0 0.0 0.0 Transportation Services (47) 3.0 0.0 1.4 2.5 Communication (48) 1.0 0.0 0.2 0.7 Elec., Gas, & Sanitary Serv. (49) 1.2 0.0 0.2 0.7 Wholesale 1.6 0.0 0.6 1.2 Wholesale-Durable Goods (50) 0.7 0.0 0.3 0.5 Wholesale-Nondurable Goods (51) 0.9 0.0 0.4 0.7 Retail Trade 3.6 0.1 1.3 2.3 Bldg. Mat.-Garden Supply (52) 0.2 0.0 0.1 0.1 General Merch. Stores (53) 0.4 0.0 0.1 0.2 Food Strores (54) 0.4 0.0 0.1 0.3 Auto. Dealers-Serv. Stat. (55) 0.6 0.0 0.2 0.4 Apparel & Access. Stores (56) 0.2 0.0 0.1 0.2 Furniture & Home Furnish. (57) 0.1 0.0 0.0 0.1 Eating & Drinking Places (58) 1.1 0.0 0.3 0.7 Miscellaneous Retail (59) 0.5 0.0 0.2 0.4 Finance, Insurance, & Real Estate 7.1 0.1 2.2 4.7 Banking (60) 0.7 0.0 0.2 0.5 Nondep. Credit Institut. (61) 1.5 0.0 0.7 1.1 Security, Comm. Brokers (62) 0.4 0.0 0.2 0.3 Insurance Carriers (63) 0.6 0.0 0.2 0.3 Ins. Agents, Brokers (64) 0.4 0.0 0.2 0.3 Real Estate (65) 2.1 0.0 0.1 1.1 Holding and Invest. Off. (67) 1.3 0.0 0.6 1.1 Services 12.7 0.3 5.8 8.9 Hotels & Other Lodging (70) 0.1 0.0 0.0 0.1 Personal Services (72) 0.4 0.0 0.2 0.3 Business Services (73) 8.2 0.2 3.8 5.9 Auto Repair, Serv., Garages (75) 0.6 0.0 0.1 0.3 Misc. Repair Services (76) 0.2 0.0 0.0 0.1 Motion Pictures (78) 0.2 0.0 0.1 0.1 Amusement & Recreation (79) 0.1 0.0 0.1 0.1 Health Services (80) 0.5 0.0 0.2 0.3 Legal Services (81) 0.5 0.0 0.2 0.4 Educational Services (82) 0.2 0.0 0.1 0.1 Social Services (83) 0.1 0.0 0.1 0.1 Museums, Gardens & Mem. Orgs. (84, 86) 0.4 0.0 0.2 0.2 Engineer. & Manage. Serv. (87) 1.0 0.0 0.5 0.7 Private Households (88) 0.0 0.0 0.0 0.0 Micscellaneous Services (89) 0.3 0.0 0.1 0.2 Government 0.9 0.0 0.6 0.6 Total 60.8 0.8 21.5 36.7

114
Input Impacts Cargo-Based Port Activity Break Bulk 60,539.09 Bunkers 2.50 Oil 2.50 Water 0.00 Other 0.00 Cargo Packing 0.02 Export Packing 0.02 Container Stuffing/Stripping 0.00 Cargo Manipulation 0.00 Other 0.00 Government Requirements 0.93 Customs 0.60 Entrance/Clearance 0.25 Immigration 0.03 Quarantine 0.04 Fumigation 0.01 Other 0.00 Federal Harbor Tax 0.00 In-Transit Storage 3.40 Wharfage 2.05 Yard Handling 0.00 Demurrage 0.85 Warehousing 0.50 Auto and Truck Storage 0.00 Grain Storage 0.00 Refrigerated Storage 0.00 Other 0.00 Wholesale: Durable 0.00 Wholesale: Nondurable 0.00 Inland Movement 38.25 Cost of Moving (Per Ton) by Long Distance Truck 25.00 Cost of Moving (Per Ton) by Short Distance Truck 10.00 Cost of Moving (Per Ton) by Barge 0.00 Cost of Moving (Per Ton) by Air 0.00 Cost of Moving (Per Ton) by Rail 3.25 Cost of Moving (Per Ton) by Pipeline 0.00 Cost of Moving (Per Ton) by Other 0.00 Percent of Total Tonnage moved by Long Distance Truck 0.00 Percent of Total Tonnage moved by Short Distance Truck 100.00 Percent of Total Tonnage moved by Barge 0.00 Percent of Total Tonnage moved by Air 0.00 Percent of Total Tonnage moved by Rail 0.00 Percent of Total Tonnage moved by Pipeline 0.00 Percent of Total Tonnage moved by Other 0.00 Loading/Discharging 9.07 Stevedoring 9.00 Clerking and checking 0.04
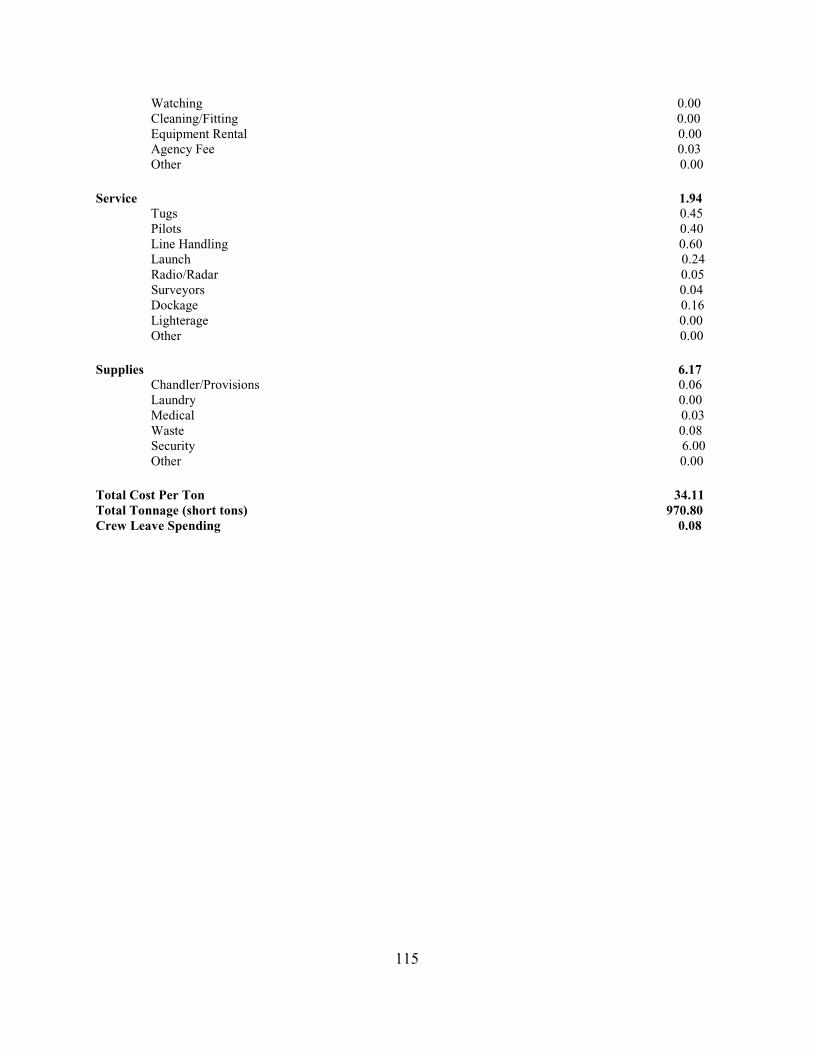
115
Watching 0.00 Cleaning/Fitting 0.00 Equipment Rental 0.00 Agency Fee 0.03 Other 0.00 Service 1.94 Tugs 0.45 Pilots 0.40 Line Handling 0.60 Launch 0.24 Radio/Radar 0.05 Surveyors 0.04 Dockage 0.16 Lighterage 0.00 Other 0.00 Supplies 6.17 Chandler/Provisions 0.06 Laundry 0.00 Medical 0.03 Waste 0.08 Security 6.00 Other 0.00 Total Cost Per Ton 34.11 Total Tonnage (short tons) 970.80 Crew Leave Spending 0.08

116

117
Select Bibliography
Antidumping. J. Michael Finger ed. Ann Arbor, Michigan: University of Michigan Press, 1993. Barat, Josef. “A logistica do café do ponto de vista do exportador brasileiro,” available at: www.café.com.br/trabalho/mercado/logistica, cited February 9, 2001. Benacchio, Marco, Claudio Ferrari, Hercules E. Haralambides, and Enrico Musso. “On the Economic Impact of Ports: Local vs. National Costs and Benefits.” Paper presented at Forum for Maritime Logistics Operators, Genoa, Italy, June 8-10, 2000. Bender, Stephen. “General Aspects of Trade Corridors,” Washington, D.C.: Organization of American States, n.d. ———. “Trade Corridors: The Emerging Regional Development Planning Unit in Latin America.” Paper presented for “Regional Development Planning: Towards the 21st Century,” United Nations Centre for Regional Development, Santafe de Bogota, Colombia, December 1-3, 1997. Boske, Leigh B. and John C. Cuttino. The Impacts of U.S.-Latin American Trade on the Southwest’s Economy and Transportation System: An Assessment of Impact Methodologies. Austin, Texas: Lyndon B. Johnson School of Public Affairs, 2001. Brazilian Steel Institute. Anuário Estatístico/1999. Rio de Janeiro, 1999. Brodsky, David A. and Gary P. Simpson. “International Transport Costs and Latin American Exports to the United States.” International Journal of Transport Economics, vol. Vi, no. 3 (December 1979): 279-92. Castro, José Villaverde, and Pablo Coto-Millán. “Port Economic Impact: Methodologies and Application to the Port of Santander.” International Journal of Transport Economics, vol. xxv, no. 2 (June 1998): 159-79. Chang, Semoon. “In Defense of Port Economic Impact Studies.” Transportation Journal, vol. 17, no. 3 (spring 1978): 79-84. Coeck, C., T. Notteboom, A. Verbeke, and W. Winkelmans. “The Unreliability of Maritime Trade Statistics: An Extension of Results.” International Journal of Transport Economics, vol. xxii, no. 2 (June 1995): 217-224. Companhia Vale do Rio Doce. Serviços de Logística. Belo Horizonte, Minas Gerais, Brazil, August 1999. Containerisation International Yearbook 2001. London, Informa Group, 2001.
118
The CRB Commodity Yearbook. New York: John Wiley & Sons, 2000. Datamar Consultores. Brazilian vessel manifest data: coffee and steel 1998-2001, ports of Vitória, Santos, and Praia Mole. Rio de Janeiro, 2001. Davis, H. Craig. “Regional Port Impact Studies: A Critique and Suggested Methodology.” Transportation Journal, vol. 23, no. 2 (winter 1983): 61-71. De Araujo Filho, Jose Ribeiro. Santos-O Porto de Café. Rio de Janeiro: Fundação Instituto Brasileira de Geografia, 1969. De Lombaerde, P. “The Unreliability of Maritime Trade Statistics.” International Journal of Transport Economics, vol. xxi, no. 1 (February 1994): 93-97. De Salvo, Joseph S. “Measuring the Direct Impacts of a Port.” Transportation Journal, vol. 33, no. 4 (summer 1994): 33-42. De Salvo, Joseph S., and Debra L. Fuller. “The Role of Price Elasticities of Demand in the Economic Impact of a Port.” The Review of Regional Studies, vol. 25 (1995): 13-35. Dicum, Gregory and Nina Luttinger. The Coffee Book: Anatomy of an Industry from Crop to the Last Drop. New York: The Free Press, 1999. Empresa Brasileira de Planejamento de Transportes (GEIPOT). Corredores Estratégicos de Desenvolvimento. José Glauco Apoliano Andrade Dias coord. Brasília: Ministério dos Transportes, February 1999. ———. Plano Operacional de Transportes-Café- Fase I 1975. Brasília, Brazil, 1975. Fundação Getúlio Vargas. Influênica Econômica do Porto de Santos. Wolfgang Schoeps and Walter Delazaro eds. São Paulo: Livraria Agir Editora, 1980. Gentle, Neil. “The distribution of benefits of waterfront reform.” Maritime Policy and Management, vol. 23, no. 3 (1996): 301-19. Goss, R.O. “Economic policies and seaports: 1. The economic functions of seaports.” Maritime Policy and Management, vol. 17, no. 3 (1990): 207-19. Gripaios, Peter. “Ports and their influence on local economies - a UK perspective.” The Dock and Harbour Authority, vol. 79, no. 894 (March/April 1999): 235-37. Gripaios, Peter, and Rose Gripaios. “The impact of a port on its local economy: the case of Plymouth.” Maritime Policy and Management, vol. 22, no. 1 (1995): 13-23.
119
Grossman, Gene M. “Imports as a Cause of Injury: The Case of the U.S. Steel Industry,” Journal of International Economics, vol. 20 (1986): 201-23. Han, Xiaoli and Bingsong Fan. “Measuring Transportation in the U.S. Economy.” Journal of Transportation and Statistics, vol. 1, no. 1 (January 1998): 93-102. Handbook of Logistics and Supply Chain Management. A.M. Brewer, K.J. Button, and D.A. Hensher eds. New York: Pergamon Press, 2001. Haralambides, Hercules E. “The Economic Impact of Shipping on the National Economy.” Paper presented at the International Association of Maritime Economists Conference, Vancouver, Canada, 1996. Hinkelman, Edward G. Dictionary of International Trade: Handbook of the Global Trade Community. Novato, California: World Trade Press, 2000. Hopkins, Terence and Immanuel Wallerstein. “Commodity chains in the world economy prior to 1800,” Review of the Journal of the Fernand Braudel Center 10 (Summer 1986). Kaliski, John G., Stephen C. Smith, and Glen E. Weisbrod. “Major Corridor Investment- Benefit Analysis System.” Paper prepared for Seventh Tranportation Research Board on the Application of Transportation Planning Methods, February 23, 1999. Kraft, Gerald, John R. Meyer, and Jean-Paul Valette. The Role of Transportation in Regional Economic Development. Lexington, Massachusetts: Lexington, 1971. Krugman, Paul. Geography and Trade. Cambridge, Massachusetts: MIT Press, 1991. Leontief, Wassily, C. Gray, and R. Kleinberg. “The Growth of Maritime Traffic and the Future of World Ports.” International Journal of Transport Economics, vol. Vi, no. 3 (December 1979): 245-62. Maritime Transportation in Latin America and the Caribbean. Policy Research Project Report 138. Leigh B. Boske coord. Austin, Texas: Lyndon B. Johnson School of Public Affairs, The University of Texas at Austin, 2001. Martin Associates. The Local and Regional Economic Impacts of the Port of Houston. Lancaster, Pennsylvania: March 29, 1999. Marshall, C.F. The World Coffee Trade. Cambridge, United Kingdom: Woodhead-Faulkner Ltd., 1983. Mastel, Greg. Antidumping Laws and the U.S. Economy. Armonk, New York: M.E. Sharpe, Economic Strategy Institute, 1998.
120
Prusa, Thomas. “Why are so many antidumping petitions withdrawn?” Journal of International Economics, vol. 33 (1992): 333-54. The Political Economy of American Trade Policy. Anne O. Krueger ed. Chicago, Illinois: University of Chicago Press, 1996. Port of Houston Authority. Regular Scheduled All-Water Services. Houston, Texas, May 2001. Port Import Export Reporting Service (PIERS), Journal of Commerce, Port of Houston trade statistics for 1998/99 compiled from Port of Houston Authority. Porter, Michael E. The Competitive Advantage of Nations. New York: The Free Press, 1990. Rose, Warren. Catalyst of an Economy: The Economic Impact of the Port of Houston 1958-1963. Houston, Texas: Center for Research in Business and Economics, University of Houston, August 1965. Sanchez-Robles, Blanca. “The Role of Infrastructure Investment in Development: Some Macroeconomic Considerations.” International Journal of Economics, vol. xxv, no. 2 (June 1998): 113-36. Sette, José Dauster. “Problemas de logística na visão do exportador brasileiro.” Paper presented at the Twelfth International Seminar of Santos Coffee, 2000, Santos, São Paulo, Brazil, 2000. Sibley, Marilyn McAdams. The Port of Houston-A History. Austin, Texas: University of Texas Press, 1968. Staiger, Robert W. and Frank A. Wolak, “The Effect of Antidumping Law in the Presence of Foreign Monopoly,” Journal of International Economics. May 1992. Talbot, John M. “Where does your coffee dollar go?: The Division of Income and Surplus along the Coffee Commodity Chain,” Studies in Comparative International Development, vol. 32, no. 1 (Spring 1997). United Nations Economic Commission for Latin America and the Caribbean. La Cadena de Distribuicion y La Competitividad de Las Exportaciones Latinoamericanos-La Fruta de Chile. Santiago, Chile: July 31, 1990. The United States in the World Economy. Chicago, Illinois: University of Chicago Press, 1988. U.S. Department of Agriculture, Foreign Agricultural Service. Brazil Coffee Annual 2001, Global Agricultural Information Network Report #BR1021. Washington, D.C., May 15, 2001. U.S. Department of Commerce, United States Maritime Administration, Economic Impact of the U.S. Port Industry: An Input-Output Analysis, vol. I (Port Authority of New York/New Jersey Planning and Development Department, August 1978).

121
U.S. Department of Commerce, Maritime Administration, Office of Port and Intermodal Development. Port Economic Impact Kit. Prepared by Arthur D. Little, Inc. Washington, D.C., September 1979. U.S. Department of Transportation (USDOT), United States Maritime Administration. MARAD Port Economic Impact Kit: Volume I-Handbook for Undertaking Port Economic Impact Assessments (Rutgers University: December 2000), report prepared by the Economic Advisory Service of the Rutgers University Center for Urban Policy Research and Anne Strauss-Wieder, Inc. ———. Waterborne Trade Database. Washington, D.C., 2000. Van Den Bergh, Jeroen C.J.M. “Economy-wide Effects of Freight Transport in a Spatial General Equilibrium Setting.” International Journal of Transport Economics, vol. xxiv, no. 1 (February 1997): 101-21. Verbeke, A., and K. Debisschop. “A Note on the Use of Port Economic Impact Studies for Large Scale Port Projects.” International Journal of Transport Economics, vol. xxiii, no. 3 (October 1996): 247-66. Voight, Fritz and Hermann Witte. “Analysis of the Growth and Structural Effects Induced by a Transportation System.” International Journal of Transport Economics, vol. viii, no. 1 (April 1981): 47-58. Warf, Barney, and Joseph Cox. “The changing economic impacts of the port of New York.” Maritime Policy and Management, vol. 16, no. 1 (1989): 3-11. Waters, Robert C. “Port Economic Impact Studies: Practice and Assessment.” Transportation Journal, vol. 16, no. 3 (spring 1977): 14-18. Weisbrod, Glen and Frederick Treyz. “Productivity and Accessibility: Bridging Project- Specific and Macroeconomic Analyses of Transportation Investments.” Journal of Transportation and Statistics, vo. 1, no. 3 (1998). Weisbrod, Glen and Burton Weisbrod. “Assessing the Economic Impact of Transportation Projects: How to match the appropriate technique to your project.” Paper presented at the 76th Annual Meeting of the Transportation Research Board, January 12-16, 1997, Washington, D.C. ———.“Measuring the Economic Impacts of Projects and Programs.” Boston: Economic Development Research Group, April 1997. Western Transportation Trade Network (WTTN), WTTN Final Report, 1997.

122
Williamson, Kenneth C., Daniel M Spitzer Jr., and David J. Bloomberg, “Modern logistics systems: theory and practice,” Journal of Business Logistics, vol. 11, no. 2 (1990). Wood, Donald F., Anthony Barone et al., International Logistics. Boston: Kluwer Academic Press, 1995. Yin, Robert K. “The Abridged Version of Case Study Research,” in Handbook of Applied Social Research Methods, L. Bickman and D. Rog eds. (Sage Press: 1997). ———. “The Role of Theory in Doing Case Studies,” in Applications of Case Study Research (Applied Social Research Methods Series, vol. 34, 1994). Yochum, Gilbert R., and Vinod B. Agarwal. “Economic Impact of a Port on a Regional Economy: Note.” Growth and Change, no. 2 (summer 1987): 74-87. ———. “Static and changing port economic impacts.” Maritime Policy and Management, vol. 15, no. 2 (1998): 157-71.