the implications of differential trends in mortality for social security policy john bound, arline...
TRANSCRIPT

THE IMPLICATIONS OF DIFFERENTIAL TRENDS IN MORTALITY FOR SOCIAL SECURITY POLICY
John Bound, Arline Geronimus, Javier Rodriguez,
University of Michigan
Timothy Waidmann
Urban Institute

Background• Life expectancy in the U.S. has risen substantially since the
Social Security Program was enacted into law.• Life expectancy at 25 rose from 69 to 80 between 1940 and 2010.
• Evidence also suggests elderly morbidity has improved.
• Under these circumstances, it would seem natural to raise the Social Security Retirement ages.
• However there is also evidence that gains in life expectancy and morbidity have not been equally shared. • Researches have consistently found evidence that the gains have been
concentrated amongst advantaged members of the population (e.g. Waldron, 2007).

Life Expectancy At Birth, By Years Of Education At Age 25 For White Females, 1990–2008.
Olshansky S J et al. Health Aff 2012;31:1803-1813
©2012 by Project HOPE - The People-to-People Health Foundation, Inc.

Change in Life Expectancy at Age 25Non-Hispanic White
Women, LTHSNon-Hispanic White
Men, LTHS
1990 54.5 47.0
2008 49.2 43.6
Difference -5.3 -3.4
Source: Olshansky et al.

What is going on?• Short of a war or a major epidemic drops in life
expectancy of 3 to 5 years in a developed country are virtually unprecedented.
• Point of this project was to re-examine the evidence. Is Olshansky et al.’s finding robust.

Data
• Deaths: National Vital Statistics System, Multiple Cause of Death files, 1990, 2000 & 2010
• Population: IPUMS US Census data• Decennial census, 1940-2000• American Community Survey, 2001-2010
• This is same data used by Olshansky et al.

Can we replicate basic finding?• Olshansky et al. included all age groups, making
adjustments to take account of known problems with age specific mortality rates amongst the elderly.
• We will calculate survival curves for men and women between the age of 25 and 85.
• If life expectancy dropped for those with less than a high school education, survival curves should shift in.

Survival after age 25, by level of education
Source: Authors’ calculations from NVSS & Census data
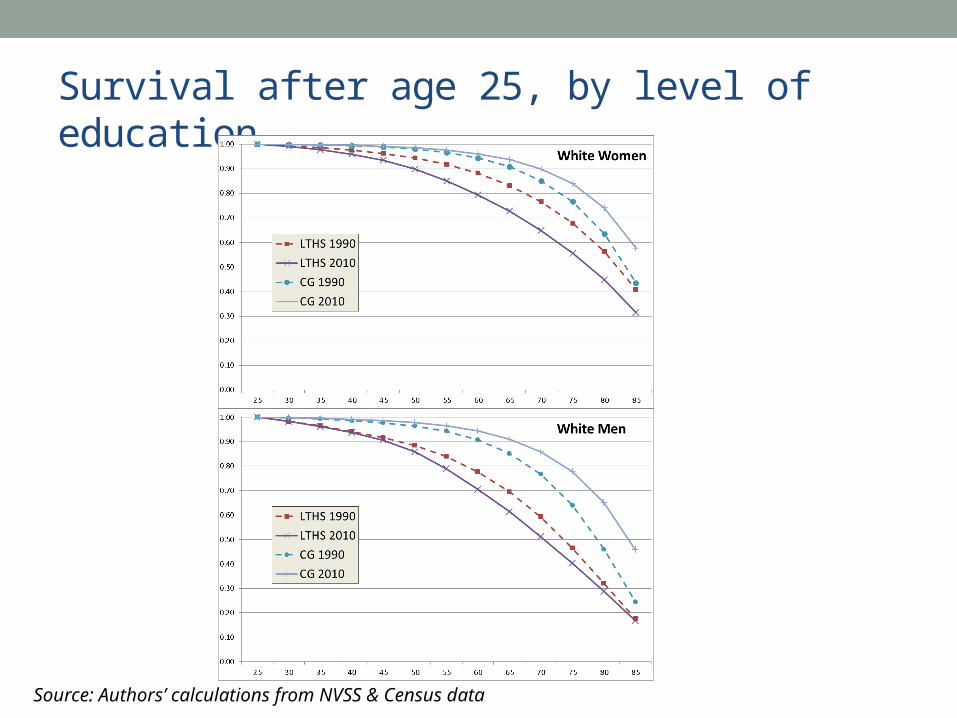
Survival after age 25, by level of education
Source: Authors’ calculations from NVSS & Census data

• Using Educational Attainment Levels we replicated Olshansky et al.
• But, the fraction of the US population graduating from high school rose dramatically of the 20th century. As a result, high school drop outs are becoming a more and more select group.

Change in High School Graduation Rates, by Birth Cohort
1905
1908
1911
1914
1917
1920
1923
1926
1929
1932
1935
1938
1941
1944
1947
1950
1953
1956
1959
1962
1965
1968
1971
1974
1977
1980
1983
0%
10%
20%
30%
40%
50%
60%
70%
80%
90%
100%
White WomenWhite MenBlack WomenBlack Men
Birth Year
Per
cen
t C
om
ple
tin
g 1
2th
Gra
de
Source: Authors’ calculations using IPUMS Census data

What if we use educational rank• Given the dramatic rise in the fraction of the population
finishing high school, stratifying by rank in the educational distribution would seem to be a plausible alternative to using education levels.
• We stratified by gender and race, distinguishing between those in the bottom 25 percent and top 75 percent of their gender and race specific cohorts.
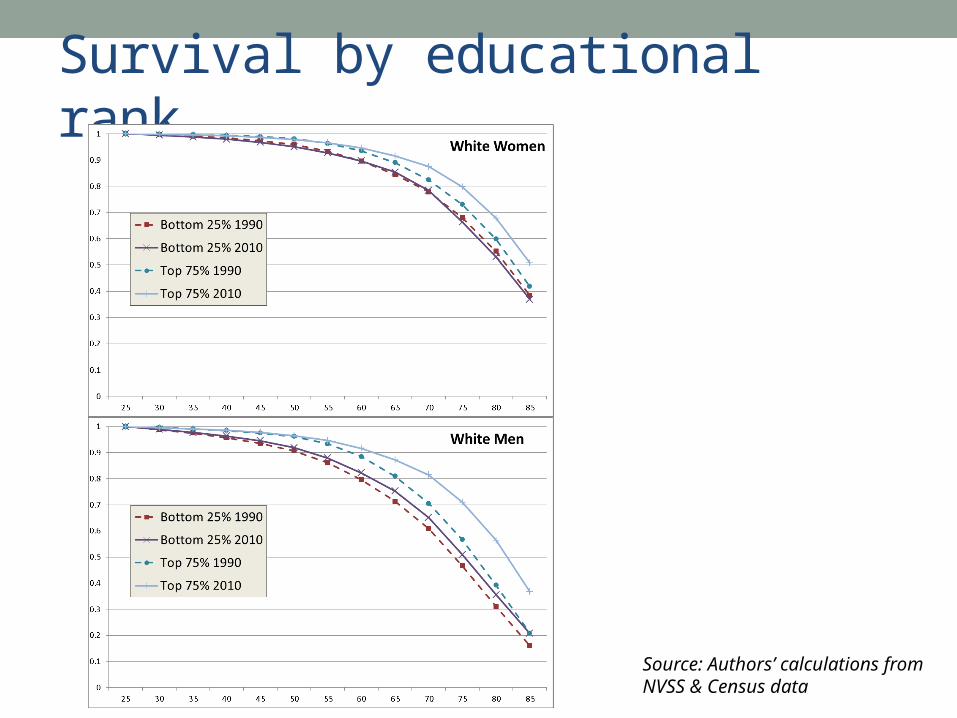
Survival by educational rank
Source: Authors’ calculations from NVSS & Census data

Change in Survival Probabilities to 65 and 85, by educational rank
White WomenBottom 25% Top 75%
1990 0.844 0.384 0.890 0.4182010 0.854 0.369 0.915 0.508Change +0.010 -0.014 +0.025 +0.090
White MenBottom 25% Top 75%
1990 0.713 0.160 0.810 0.2092010 0.753 0.208 0.872 0.368Change +0.040 +0.047 +0.062 +0.159

Results• For white women, little change amongst the bottom 25
percent. Significant gains for the top 75 percent.
• For white men, gains for both, but larger gains for those in the top 75 percent.
• When stratifying by quartile, one finds evidence of increased dispersion of life expectancy, but no evidence of any drop for the bottom quartile.

Problems with Education Data in Vital Statistics
• Preceding statistics require matching education levels between census surveys and death certificates. This is not straightforward• Coding changes over time in both sources, never identical• In 2010 death certificates, two alternative coding schemes used• Many death records missing, sometimes for entire states• Need imputations to get complete counts from both sources• Even when not missing, evidence of misreporting of education by
next of kin to funeral director (Rostron et al., 2010)• National Longitudinal Morality Study: 28% of death certificate reports do
not match earlier CPS self-reports in linked data. • 20% of LTHS reported as HS Graduates (or more) on death certificate• 6% of HS graduates (or more) reported as LTHS• More mis-reporting for non-whites

Alternative Approach• Look at over all survival curves.
• If a segment of the population is dying at younger ages, while others are living longer, one should see two closely related patterns.
1. There should be a spreading out of the distribution of the age at death, with more dying at young ages
at the same time that more are dying at older ages.
2. The probability a person reaches the age of 45 or 65 should drop, while the probability they reach 75 or 85 should rise.
No need to use data on education for this.

Distribution of Life Table Age at Death
Source: Published NCHS Life Tables

(Period) Life Table Survival Curves
Source: Authors’ calculations from NVSS & Census data

(Period) Life Table Survival Curves
Source: Authors’ calculations from NVSS & Census data

Dispersion of life expectancy (post 25)
Source: Authors’ calculations from NVSS & Census data

Results• Distribution of age at death appears to be shifting out for
black and white men and women.
• Survival curves shift out for black and white men and women.

An Alternative Way to Look at Data
• Using the same data, we can calculate the probability a 25 year old makes it to 65, 75 or 85.

Survival to age 65,75 and 8565 75 85 65 75 85 65 75 85 65 75 85
Non-Hispanic Black Women
Non-Hispanic Black Men
Non-Hispanic White Women
Non-Hispanic White Men
0.00
0.10
0.20
0.30
0.40
0.50
0.60
0.70
0.80
0.90
1.00
0.041
0.063
0.055
0.105
0.126
0.086
0.008
0.025
0.044
0.030
0.079
0.102
1990 2010
Surv
ival
Pro
babi
lity
(fro
m 2
5)
Results• For whites, there is not much change in the chances a 25
year old reaches 65. Roughly 11% of white women and 20% of white men who reach it to 25 do not reach it to 65.
• The chances Black men and women make it to 65 is substantially less than it is for their white counterparts, but here we see improvements.
• Improvements at 75 are uniformly larger than improvements at 65. For whites improvements at 85 are larger still.

Summary1. If we use levels of educational attainment we replicate
Olshansky et al.’s findings. Survival prospects worsened for white high school drop outs.
2. If we stratify education by rank in the distribution, contrasting the bottom quartile to the top three quartiles, we find evidence of an increased dispersion of survival prospects, but no evidence that survival prospects for the bottom quartile of the education distribution is getting worse.
3. Examining survival curves for White and Black men and women, we find little evidence of any increased dispersion of survival prospects.
4. 2 and 3 together suggest a compression of mortality within but not between education groups.