the importance of proper crystal-chemical and geometrical
TRANSCRIPT

research papers
150 doi:10.1107/S205251921300376X Acta Cryst. (2013). B69, 150–162
Acta Crystallographica Section B
Structural Science,Crystal Engineeringand Materials
ISSN 2052-5192
The importance of proper crystal-chemical andgeometrical reasoning demonstrated using layeredsingle and double hydroxides
Ian G. Richardson
School of Civil Engineering, University of Leeds,
Leeds LS2 9JT, England
Correspondence e-mail:
Atomistic modelling techniques and Rietveld refinement of X-
ray powder diffraction data are widely used but often result in
crystal structures that are not realistic, presumably because
the authors neglect to check the crystal-chemical plausibility
of their structure. The purpose of this paper is to reinforce the
importance and utility of proper crystal-chemical and
geometrical reasoning in structural studies. It is achieved by
using such reasoning to generate new yet fundamental
information about layered double hydroxides (LDH), a large,
much-studied family of compounds. LDH phases are derived
from layered single hydroxides by the substitution of a
fraction (x) of the divalent cations by trivalent. Equations are
derived that enable calculation of x from the a parameter of
the unit cell and vice versa, which can be expected to be of
widespread utility as a sanity test for extant and future
structure determinations and computer simulation studies.
The phase at x = 0 is shown to be an � form of divalent metal
hydroxide rather than the � polymorph. Crystal-chemically
sensible model structures are provided for �-Zn(OH)2 and Ni-
and Mg-based carbonate LDH phases that have any trivalent
cation and any value of x, including x = 0 [i.e. for �-
M(OH)2�mH2O phases].
Received 10 December 2012
Accepted 7 February 2013
1. Introduction
Gibbs et al. (2009) stated recently that ‘ . . . if mineralogists and
geochemists persist in their study of minerals, their properties
and relationships within the framework of empirical parameters
like ionic radii, bond strength and electrostatic potential and
forces and do not include first-principles quantum mechanical
calculations and the study of ED distributions, then it (is)
questionable whether our understanding of the crystal chem-
istry and the properties of minerals in their natural environ-
ments will advance much beyond that of (the) last century’ (ED
= electron density). Their view is no doubt correct, but
unfortunately the proper use of crystal-chemical and geome-
trical reasoning – the approach of the ‘last century’ – is being
neglected increasingly, with the result that much effort is
wasted on unrealistic crystal structures. Such neglect is well
illustrated by an atomistic modelling study published recently
by Pellenq et al. (2009) in the Proceedings of the National
Academy of Sciences. Pellenq et al. claim to have developed a
‘realistic molecular model’ for calcium silicate hydrate that is
the main binding phase in most concrete (known as ‘C—S—
H’), which is an important subject given that concrete is used
on a vast scale (approximately 7 billion m3 per year worldwide;
Gartner, 2004). Their model – which is derived from the
structure of 14 A tobermorite – has been used in a number of
derivative works (e.g. Ji et al., 2012) and the paper is already
well cited. Yet inspection of their equilibrium structure reveals

that it is unrealistic in light of what is known about the crystal
chemistry of calcium silicates. In particular, a large proportion
of the Ca—O distances in their model are either shorter than
the minimum that is calculated from known structures of
calcium silicate hydrates and related phases, or longer than the
maximum distance, and more than half the Ca atoms in the
model (which has 99 unique Ca atoms) are coordinated to
fewer than six O atoms (their model has Ca in five-, four- and
even threefold coordination: inspection of the structures of 34
crystalline calcium silicate hydrates and related phases – with
a total of 132 unique Ca atoms – shows that six- and sevenfold
are the ‘natural’ coordination for calcium cations in these
phases, with none coordinated to fewer than six O atoms). The
problem that Pellenq et al. attempted to address is a difficult
one because C—S—H is compositionally and structurally very
variable (Richardson, 2008); nevertheless, that is no excuse for
the publication of a structure that is so unrealistic. The now-
routine use of Rietveld refinement of X-ray powder diffrac-
tion (XRD) data can have similar consequences if scant
consideration is given to the crystal-chemical plausibility of
the resulting structure. The purpose of this paper is to rein-
force the importance and utility of proper crystal-chemical
and geometrical reasoning. It is achieved by using such
reasoning to generate new yet fundamental information about
layered double hydroxides (LDH), a large, much-studied
family of compounds, members of which are involved in a
diverse range of applications – including in catalysis and
medicine and as anion exchangers (Cavani et al., 1991) – and
that are also important in the built environment (Taylor,
1997). Much has been written about LDH phases – including
some highly cited review articles (e.g. Cavani et al., 1991;
Braterman et al., 2004; Evans & Slade, 2006; Forano et al.,
2006; Mills, Christy, Genin et al., 2012) – and so it is perhaps
surprising to find that such a large and important family of
compounds could be studied so extensively for over half a
century without crystal-chemical and geometrical arguments
being pursued more effectively. This paper provides such a
treatment, which also necessitates a consideration of aspects
of the crystal chemistry of layered divalent metal hydroxides
because LDH phases are derived from them by the substitu-
tion of a fraction (x) of the divalent cations by trivalent
cations. It is shown that it is possible to calculate x from the a
parameter of the unit cell and vice versa, whichever is known
with most confidence. The fact that x can be calculated from
the a parameter provides a sanity test for the results of extant
and future computer-simulation studies and crystal structure
determinations using Rietveld analysis of powder XRD
patterns. Model structures are provided that are crystal-
chemically sensible for Ni- and Mg-based LDH phases that
have any value of x (that is consistent with experiment),
seemingly any trivalent cation, and that have carbonate as the
charge-balancing interlayer ion. The models address for LDH
phases the point raised by Woodley & Catlow (2008) that the
challenge posed by crystal-structure prediction is ‘ . . . one of
obtaining approximate models for unit-cell structures which
may then be subsequently refined by methods using lattice
energy or electronic structure techniques’.
The procedure developed in this paper to calculate x from a
simply involves consideration of the geometry of the metal–
oxygen octahedra in the main layer of LDH phases and the
determination of values for ionic radii that are sufficiently
precise for bond-length calculations. The required information
for both is obtained by extensive collation and analysis of
literature data.
2. Geometrical relationships in the octahedral layer ofsingle and double hydroxides
The � polymorphs of divalent metal hydroxides have the CdI2-
type structure, which is trigonal, space group P32=m1 (No.
164). It is a eutactic structure (O’Keeffe, 1977) that consists of
a hexagonal array of pseudo-close packed anions with octa-
hedral sites between the anions that are alternately empty or
occupied by metal cations and as a consequence it is layered.
The main layer in the �-M(OH)2 phases consists of edge-
sharing octahedra that have O atoms of hydroxyl ions at the
vertices and a divalent metal cation at the centre. The edges of
each octahedron are shared with six neighbours and each
hydroxyl ion is shared by three octahedra, so the layers are
electroneutral. Some geometrical relationships in the octahe-
dron are illustrated in Fig. 1. A black circle labelled ‘M’
represents the site occupied by the metal cation, which is at
the centre of the octahedron. The circles at its vertices
represent O-atom sites that form the top and bottom of the
octahedral layer. Both sets are shown but for clarity only the
lower three circles are shaded and labelled ‘O’. These three
sites form the triangular base of a squashed tetrahedron with
the cation site, M. The base of the tetrahedron is an equilateral
triangle and the length of a side of this triangle is equal to the a
parameter of the unit cell. The distance between metal cations,
d(M—M), is the same as the distance between oxygen sites
research papers
Acta Cryst. (2013). B69, 150–162 Ian G. Richardson � Layered single and double hydroxides 151
Figure 1Geometry of an octahedron in the main layer of layered single anddouble hydroxides. The original projection was viewed along b with c upthe page but for illustrative purposes it has been rotated around the c axisby � 25� and tilted down by � 10�. The circles labelled ‘O’ represent theO atoms of hydroxyl ions at the vertices of the octahedron and the circlelabelled ‘M’ is the metal ion at the centre.

that are in the same basal plane, d(O—O)SP (i.e. that form
either the top or bottom of the octahedral layer) and it is
therefore also equal to the a parameter of the unit cell. It can
be seen from inspection of Fig. 1 that d(O—O)SP and so d(M—
M) is related to the distance between the metal ion and the O
atoms of the hydroxyl ions, d(M—O), by equation (1)
(Brindley & Kao, 1984)
a ¼ dðO�OÞSP¼ d M�Mð Þ ¼ 2 sin
�
2
� �d M�Oð Þ; ð1Þ
where � is the angle between two oxygen sites and the metal
site when the two O atoms are in the same basal plane (i.e. /
OMO on Fig. 1; / OMN ¼ �=2). The distance between
oxygen sites that are in opposite basal planes, d(O—O)OP, is
only the same as between those in the same basal plane if � =
90�, i.e. for a regular octahedron, as shown by equation (2)
dðO�OÞOP¼ 2 sin
180� �
2
� �d M�Oð Þ: ð2Þ
If the ions are considered to be packed as hard spheres, the
cation in the CdI2-type structure must be ‘in contact’ (West,
1984) with the anions and so for �-M(OH)2 phases the
distance between the divalent metal cation and the O atoms of
the hydroxyl ions, d(M—O), is equal to the sum of the
effective ionic radii
dðM�OÞ ¼ r M2þ� �
þ r OH�ð Þ: ð3Þ
So
a ¼ dðM�MÞ ¼ 2 sin�
2
� �r M2þ� �
þ r OH�ð Þ� �
: ð4Þ
Since it is a eutactic structure the O atoms of the hydroxyl ions
are not in contact with one another and so
dðO�OÞ 6¼ 2r OH�ð Þ; the same is more obviously also true for
the metal cations, i.e. dðM�MÞ 6¼ 2r M2þð Þ.
The distance between the two planes of O atoms that form
the octahedral layer, h(oct) – i.e. the thickness of the main
layer – is twice the distance from the metal ion to the plane of
O atoms, i.e. 2 � d(M—P) in Fig. 1. It is evident from
inspection of Fig. 1 that h(oct) and d(M—O) are related by
equation (5) (Brindley & Kao, 1984)
h octð Þ ¼ 2 1�4
3sin2 �
2
� �� �1=2
dðM�OÞ: ð5Þ
Substituting for d(M—O) from equation (3) gives
h octð Þ ¼ 2 1�4
3sin2 �
2
� �� �1=2
r M2þ� �
þ r OH�ð Þ� �
: ð6Þ
For a regular octahedron, the bond angle � is 90� and so the a
parameter is given by equation (7), d M�Oð Þ ¼ a=21=2, and
h octð Þ ¼ 23
� �1=2a
a ¼ dðM�MÞ ¼ 21=2 r M2þ� �
þ r OH�ð Þ� �
: ð7Þ
research papers
152 Ian G. Richardson � Layered single and double hydroxides Acta Cryst. (2013). B69, 150–162
Figure 2Distances in divalent metal hydroxides that have the CdI2-type structure. (a) Experimentally determined values of d(M—M) against d(M—O). (b)d(M—O) determined by experiment against the value calculated using ionic radii. (c) h(oct) against r(M). The data are for Mg(OH)2 (Catti et al., 1995;Cerny et al., 1995; Chakoumakos et al., 1997; Desgranges et al., 1996; Isetti, 1965; Zigan & Rothbauer, 1967), Ni(OH)2 (Kazimirov et al., 2010), Co(OH)2
(Pertlik, 1999), Fe(OH)2 (Parise et al., 2000), Mn(OH)2 (Christensen & Ollivier, 1972), Cd(OH)2 (Bertrand & Dusausoy, 1970), Ca(OH)2 (Busing &Levy, 1957) and Zn(OH)2 (Baneyeva & Popova, 1969). There are two data points for �-Zn(OH)2: one calculated from Baneyeva & Popova’s structurethat is labelled ‘Zn cBan’ and a second from this work that is labelled ‘Zn c1’.

Fig. 2(a) is a plot of experimentally determined values of
d(M—M) against d(M—O) for the eight �-M(OH)2 phases.
The dotted line is for a regular octahedron (i.e. � = 90�;
2 sin �=2ð Þ ¼ 21=2) and so it is clear that the octahedron is close
to ideal in only one of the structures, �-Zn(OH)2. There is a
good linear relationship for the other seven phases, which
indicates that they have a value for � that is approximately the
same. From equation (1) the slope of the regression line is
equal to 2 sin �=2ð Þ ¼ 1:513 and so � = 98.3� (� 0.7) and the
octahedron is as a consequence squashed in those seven
structures. Brindley & Kao (1984) presented a similar figure
but used values of d(M—O) that were calculated using ionic
radii rather than those determined by experiment. The data
point for �-Zn(OH)2 is clearly anomalous (the structure is
from Baneyeva & Popova, 1969) and whilst an approximate
value for its a parameter can be calculated using equation (4)
(using � = 98.3� and the effective ionic radii of the Zn2+ and
OH� ions), the value of a is actually very sensitive to the value
of � for the level of precision that is necessary and an accurate
value for the effective radius of the O atom of the hydroxyl ion
is also needed.
3. Determination of the effective radius of the O atomof the hydroxyl ion in divalent metal hydroxides
Ionic radii vary with valence and coordination number and the
relevant values for �-M(OH)2 phases are those for the diva-
lent metal ion in sixfold coordination and the O atom of the
hydroxyl ion in fourfold. The values used in this work are
Shannon’s (1976) effective ionic radii (i.e. from the column
labelled ‘IR’ in Table 1 of Shannon, 1976). The hydroxyl ion is
non-spherosymmetrical (Oswald & Asper, 1977) and so
Shannon’s value of 1.35 A for r(OH�(IV)) corresponds to the
radius of the O atom. Since the exact shape of the hydroxyl ion
will vary (it is often referred to as ‘egg-shaped’ e.g. Zigan &
Rothbauer, 1967; Brindley & Kao, 1984) Shannon’s value will
not be appropriate for all bond-length calculations. The value
of r(OH�(IV)) for the �-M(OH)2 phases can be determined
by comparing the values of d(M—O) determined by experi-
ment with those calculated using equation (3). The data for the
eight �-M(OH)2 phases are plotted in Fig. 2(b), which shows
that there is almost perfect agreement between the calculated
and experimentally determined values of d(M—O) when a
value of 1.370 A is used for r(OH–(IV)) (when the Zn
hydroxide is excluded): the dotted line in the figure represents
perfect agreement, the crosses show the positions of the data
points when r(OH�(IV)) = 1.370 A is used in the calculation
and the full line is the linear regression fit with r(OH�(IV)) =
1.370 A. The dashed line shows the position of the fit when
Shannon’s (1976) value for r(OH�(IV)) is used (i.e. 1.35 A),
which is clearly not appropriate.
4. Crystal structure of b-Zn(OH)2
The data point in Figs. 2(a) and (b) for Baneyeva and Popova’s
structure for �-Zn(OH)2 is clearly anomalous, suggesting
strongly that there is a problem with the structure, as noted
previously by Pertlik (1999) [Pertlik noticed that the z para-
meter for the O1 atom in the asymmetric unit for �-Zn(OH)2
is much larger than for other divalent metal hydroxides]. The
experimental data reported by Baneyeva and Popova are not
very precise (the d spacings are given to just two decimal
places), but it is nevertheless straightforward to improve on
their crystal structure simply by making it consistent with the
other �-M(OH)2 phases. Inspection of their data (that are
reproduced in Table 1, column dexp) shows that d001 = 4.69 A
and d110 = 1.59 A, and so c = 4.69 A and a = 2 � d110 = 3.18 A.
Substitution of a = 3.18 A, r(Zn2+(VI)) = 0.74 A (from
Shannon, 1976) and r(OH�(IV)) = 1.370 A (from Fig. 2b) into
equation (4) gives � = 97.80�, which is similar to the values for
the other phases. Substitution of � = 97.80� and r(OH�(IV)) =
1.370 A into equation (6) gives a value for the thickness of the
main layer that is similar to the values for the other �-M(OH)2
phases, as shown in Fig. 2(c). The z parameter for the O1 atom
is calculated using equation (8) and the calculated value is
again consistent with those of the other phases
zO1 ¼h octð Þ
2c: ð8Þ
Various crystal structure data and calculated d spacings for the
proposed model structure are given in Table 1. Comparison
with Baneyeva and Popova’s structure show that it gives an
research papers
Acta Cryst. (2013). B69, 150–162 Ian G. Richardson � Layered single and double hydroxides 153
Table 1XRD and crystal structure data for �-Zn(OH)2.
The experimental X-ray data, dexp, are from Baneyeva & Popova (1969). Thed-spacings calculated from Baneyeva and Popova’s structure and the structurederived in this work are given in the columns dcBan and dc1, respectively. Thespace group is P32=m1 (No. 164) and the atom positions (x/a, y/b, z/c) in theasymmetric unit of both structures are Zn1: 0, 0, 0 and O1: 1
3 ;23 ; zO1. The
position of the H1 atom is 13 ;
23 ; zH1. The value of zO1 – which is calculated using
equation (8) – is given in the table (it is different for the two structures). Vcell
and Voct are the volumes of the unit cell and the Zn—O octahedron,respectively.
No. hkl dexp (A) dcBan (A) dc1 (A)
1 001 4.69 4.71 4.692 010 2.73 2.77 2.753 011 2.35 2.39 2.374 002 2.31 2.36 2.355 012 1.77 1.79 1.796 110 1.59 1.60 1.597 111 1.50 1.51 1.518 020 1.38 1.38 1.389 021 1.32 1.33 1.3210 022 1.19 1.19 1.1911 014 1.07 1.08 1.0812 023 1.03 1.04 1.0313 121 1.01 1.02 1.02
Baneyeva This work
a (A) 3.194 3.180c (A) 4.714 4.690Vcell (A3) 41.648 41.073zO1 0.28 0.2217zH1 – 0.4349Voct (A3) 15.548 12.141d(Zn—O) (A) 2.268 2.110h(oct) (A) 2.641 2.080� (�) 89.52 97.80

improved match with the X-ray diffraction data and that the
Zn—O distance is the same as that calculated using the
effective ionic radii instead of being much longer, so the
proposed structure is crystal-chemically more sensible. Bane-
yeva and Popova did not locate the H1 atom but a value for
zH1 is given here for completeness. It is calculated using
equation (9), which requires knowledge of the oxygen–
hydrogen distance, d(O—H), which is set here at 1 A – a value
similar to those determined by neutron diffraction for
Mg(OH)2 and Ca(OH)2 – but it of course needs to be deter-
mined by experiment.
zH1 ¼ zO1 þd O�Hð Þ
cð9Þ
A schematic polyhedral representation of the new model
structure for �-Zn(OH)2 is shown in Fig. 3(a).
5. Layered double hydroxides
As noted in x1, LDH phases are derived from layered divalent
metal hydroxides by the substitution of a fraction (x) of the
divalent cations (M2+) by trivalent cations (M3+). This creates
a +1 charge on the main layer and this positive charge is
balanced by anions (An�) in the interlayer region, which also
contains water molecules. An� can be single anions (such as
Cl� or OH�), trigonal planar anions (CO2�3 , NO�3 ), tetrahedral
anions (SO2�4 , CrO2�
4 ), octahedral anions ([Fe(CN)6]4�) or
alumino-silicate sheets (Drits & Bookin, 2001). Regarding
octahedral anions, interesting work has been reported recently
on phases with Sb(OH)6 octahedra in the interlayer (Bonac-
corsi et al., 2007; Mills, Christy, Kampf et al., 2012; Mills, Kampf
et al., 2012). Whilst the interlayers of most LDH phases
contain a single layer of anions and water molecules, more
complex interlayer structures do occur (Evans & Slade, 2006;
Mills, Christy, Genin et al., 2012); for example, double layers of
water molecules and anions, such as in Mg–Al sulfate LDH
phases (Brindley & Kikkawa, 1980), and double layers of
cations and anions, such as sodium and sulfate ions (Drits et
al., 1987), as in motukoreaite (Rius & Plana, 1986), magne-
sium and sulfate ions, as in mountkeithite (Hudson & Bussell,
1981), or calcium and sulfate ions, as in wermlandite (Rius &
Allmann, 1984).
The general formula for LDH phases is
M2þð1�xÞM
3þx OHð Þ2
h iAn�ð Þx=n�mH2O: ð10Þ
This formula is based on one main-layer cation; the contents of
the main layer are within the square brackets. The number of
water molecules per cation, m, is variable. The maximum value
of m is given in equation (11) for monatomic anions or planar
oxyanions that lie perpendicular to the c axis, where N is the
number of interlayer sites that are occupied by the anion, n is
the charge on the anion and the square symbol represents the
fraction of interlayer sites that are not occupied; as an
example, Taylor (1973) suggested a maximum value of 0.125
for the fraction of vacant interlayer sites in the pyroaurite
polytypes (i.e. Mg—Fe—CO3 LDH phases).
m ¼ 1�Nx
n� ð11Þ
The mean effective ionic radius for the cation (�rr Mð Þ) in
LDH phases is reduced because of the replacement of a
fraction (x) of the main-layer divalent cations by smaller
trivalent cations. �rr Mð Þ is calculated using equation (12)
�rr Mð Þ ¼ 1� xð Þr M2þ� �
þ xr M3þ� �
¼ r M2þ� �
� x r M2þ� �
� r M3þ� �� �
: ð12Þ
Equation (12) appears in many discussions in the literature
concerning LDH phases – and is usually referenced to
Brindley & Kikkawa (1979) – but unfortunately the right-hand
side is often incorrectly equated with d(M—O) (e.g. in Leroux
et al., 2001; Intissar et al., 2003; Forano et al., 2006), including in
two highly cited reviews (Cavani et al., 1991; Evans & Slade,
2006); the error is the omission of r(OH�) from the equation
[cf. equation (3)].
research papers
154 Ian G. Richardson � Layered single and double hydroxides Acta Cryst. (2013). B69, 150–162
Figure 3Polyhedral structure representations. (a) The model structure for �-Zn(OH)2 developed during this work. (b) M(OH)2�H2O, i.e. �-M(OH)2.(c) An LDH phase with x = 0.333. The spheres represent M2+ (grey), M3+
(blue), O2� (red), C4+ (black), H+ (pink) and the O atoms of watermolecules (brown). Lattice parameters and atomic coordinates are givenin Table 1 for the �-Zn(OH)2 and Tables 2 and 3 for the model LDHphases. All structures are drawn to the same scale (a scale bar is inset inFig. 3a). The structures are all viewed along b with c up the page. A unitcell for �-Zn(OH)2 is outlined in Fig. 3(a): the length of the vertical line isc and the horizontal line is a cos (30). For the LDH phases, the layerspacing, c0, and the thickness of the main layer, h(oct), i.e. the distancebetween the two planes of O atoms that form the octahedral layer, areindicated in Fig. 3(b).

Substitution of r Mð Þ for r Mð Þ in equation (4) gives
a ¼ dðM�MÞ ¼ 2 sin�
2
� ��rr Mð Þ þ r OH�ð Þð Þ: ð13Þ
So
a ¼ 2 sin�
2
� �r M2þ� �
� x r M2þ� �
� r M3þ� �� �
þ r OH�ð Þ� �
:
ð14Þ
Expanding and rearranging equation (14) gives
a ¼ 2 sin�
2
� �r M2þ� �
þ r OH�ð Þ� �
� 2 sin�
2
� �r M2þ� �
� r M3þ� �� �
x: ð15Þ
The first part of the right-hand side of equation (15) is equal to
the a parameter of an M(OH)2-type phase, aMðOHÞ2[cf. equa-
tion (4)], and so the a parameter for the layered double
hydroxide, aLDH, can be expressed as
aLDH ¼ aMðOHÞ2� 2 sin
�
2
� �r M2þ� �
� r M3þ� �� �
x: ð16Þ
Equation (16) is essentially a statement of Vegard’s Law, i.e.
that in a solid solution series there is a linear relation between
the lattice constant and composition (Vegard, 1921; West,
1984; Denton & Ashcroft, 1991); deviations from Vegard’s
Law are discussed by West (1984). Equation (16) has a
negative slope
�a
�x¼ �2 sin
�
2
� �r M2þ� �
� r M3þ� �� �
: ð17Þ
For regular octahedra � = 90� and substituting this into
equation (14) gives
a ¼ 21=2 r M2þ� �
� x r M2þ� �
� r M3þ� �� �
þ r OH�ð Þ� �
: ð18Þ
Therefore
a ¼ 21=2dðM�OÞ: ð19Þ
Substitution of � = 90� into equation (17) gives
�a
�x¼ �
ffiffiffi2p
r M2þ� �
� r M3þ� �� �
: ð20Þ
It is these two equations [(18)/(19) and (20)] that are widely
reported in the literature when discussing the relationship
between the composition of LDH phases, x, and the a para-
meter of the unit cell; for example, in papers concerned with
Mg–Al LDH phases (Brindley & Kikkawa, 1979), Ni–Al
(Brindley & Kikkawa, 1979), Zn–Al (Thevenot et al., 1989),
Mg–Ga (Lopez-Salinas et al., 1997), Co–Al (Leroux et al.,
2001), Mg–Al,Fe (Rozov et al., 2010), and in the review articles
by Cavani et al. (1991), Drits & Bookin (2001), and Evans &
Slade (2006); there is a typographical error in Evans and
Slade’s version of equation (19). Whilst the metal–oxygen
octahedra in LDH phases are widely understood to be squa-
shed – as in the layered single hydroxides – the discussions in
the literature regarding the relationship between x and a have
nevertheless not progressed since Brindley & Kikkawa’s
(1979) seminal paper, i.e. the equations that are reported are
always for regular octahedra [equations (18)/(19) and (20)]. It
is not a surprise therefore that there have been few practical
attempts to link x and a. Kooli et al. (1996) did calculate x from
the a parameter for a series of Mg–Al LDH phases but they
used an empirical relationship [the values of x and a in their
Table 2 are not consistent with the use of equation (19) and
the same group published a figure in a later paper that
includes a linear regression fit; Kaneyoshi & Jones, 1999]. The
calculation of x from a and vice versa using the geometrical
approach requires the use of equation (16), and so accurate
values are needed for � and aMðOHÞ2together with a satisfac-
tory explanation for the value of the latter. As established
earlier for the single hydroxides, the calculation of aMðOHÞ2also
requires an accurate value for the effective radius of the O
atom of the hydroxyl ion, r(OH�(IV)) [i.e. for use in equation
(15)], which is not necessarily the same in LDH phases as for
the single hydroxides; for example, it will be affected by the
strength of hydrogen bonding, which is different in single and
double hydroxides.
6. Determination of aM(OH)2 and a for layered doublehydroxides
LDH phases with variable composition (i.e. variable x) but
fixed types of di- and trivalent cations have been studied very
widely. The first workers to relate the value of the a parameter
extrapolated to x = 0 to the values for the corresponding �-
M(OH)2 phases seem to have been Brindley & Kikkawa
(1979) for Mg–Al and Ni–Al LDH systems and Miyata (1980)
for Mg–Al. Brindley and Kikkawa considered that agreement
was good for �-Mg(OH)2 (which occurs naturally as brucite) –
as did Miyata – but not particularly good for �-Ni(OH)2
(theophrastite). They noted that only a small change in the
slope of the plot of a against x would have a large effect on the
extrapolated value for the lattice parameter of the M(OH)2
phase and thus considered that any lack of agreement between
the extrapolated value for the a parameter and that measured
directly for �-M(OH)2 phases is due to experimental errors.
This explanation has been widely accepted (e.g. Drits &
Bookin, 2001). Carteret et al. (2011) did state that ‘the x = 0
compound is not the �-Ni(OH)2 phase’ in a recent study of Ni–
Al and Ni–Fe LDH preparations but they did not provide an
alternative explanation. Their data are included with those of
other workers in Fig. 4(a), which is a plot of a against x for a
range of Ni–Al (open circle) and Ni–Fe (filled circles) LDH
research papers
Acta Cryst. (2013). B69, 150–162 Ian G. Richardson � Layered single and double hydroxides 155
Table 2The positions of the atoms in the asymmetric unit of a model structure forlayered double hydroxide phases.
The space group is R32=m (No. 166, hexagonal axes). The ‘x’ in the occupancy(Occ.) column refers to the fraction of M3+ ions in the formula rather than tothe axial vector.
Label Atom Position x/a y/b z/c Occ.
M1 M2+ 3a 0 0 0 1� xM2 M3+ 3a 0 0 0 xO1 O 6c 0 0 zO1 1H1 H 6c 0 0 zH1 1O2 O 18h xO2 – xO2
12
16
C1 C 6c 0 0 16
x4
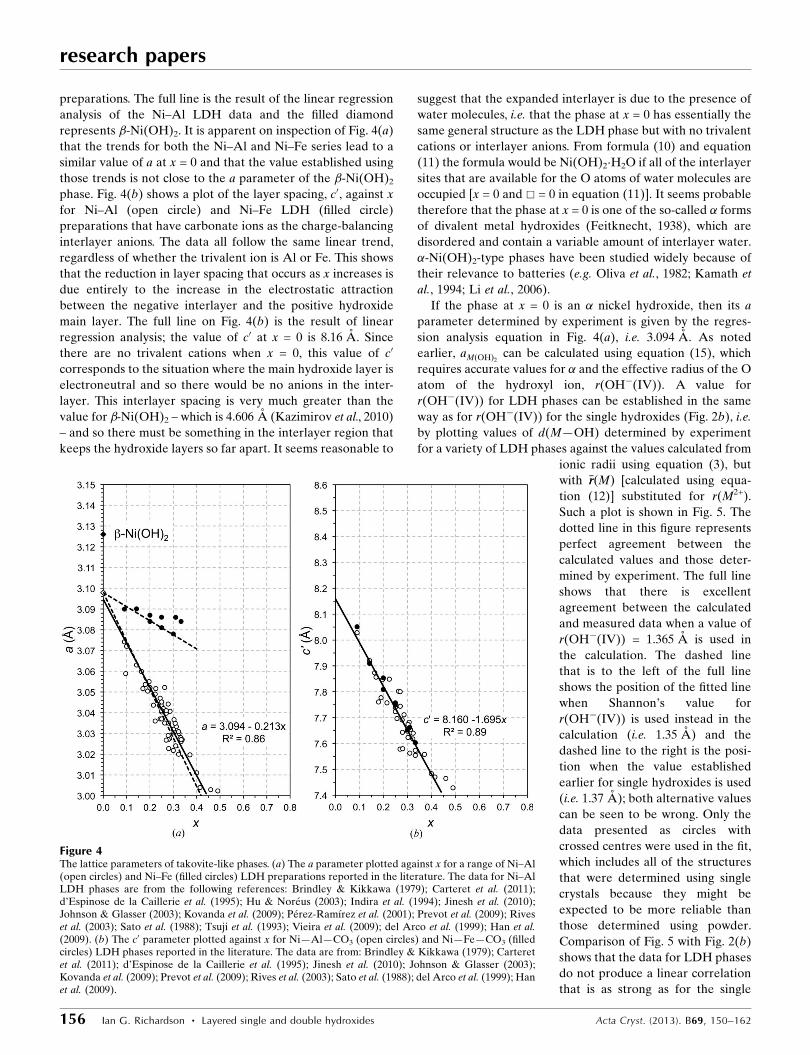
preparations. The full line is the result of the linear regression
analysis of the Ni–Al LDH data and the filled diamond
represents �-Ni(OH)2. It is apparent on inspection of Fig. 4(a)
that the trends for both the Ni–Al and Ni–Fe series lead to a
similar value of a at x = 0 and that the value established using
those trends is not close to the a parameter of the �-Ni(OH)2
phase. Fig. 4(b) shows a plot of the layer spacing, c0, against x
for Ni–Al (open circle) and Ni–Fe LDH (filled circle)
preparations that have carbonate ions as the charge-balancing
interlayer anions. The data all follow the same linear trend,
regardless of whether the trivalent ion is Al or Fe. This shows
that the reduction in layer spacing that occurs as x increases is
due entirely to the increase in the electrostatic attraction
between the negative interlayer and the positive hydroxide
main layer. The full line on Fig. 4(b) is the result of linear
regression analysis; the value of c0 at x = 0 is 8.16 A. Since
there are no trivalent cations when x = 0, this value of c0
corresponds to the situation where the main hydroxide layer is
electroneutral and so there would be no anions in the inter-
layer. This interlayer spacing is very much greater than the
value for �-Ni(OH)2 – which is 4.606 A (Kazimirov et al., 2010)
– and so there must be something in the interlayer region that
keeps the hydroxide layers so far apart. It seems reasonable to
suggest that the expanded interlayer is due to the presence of
water molecules, i.e. that the phase at x = 0 has essentially the
same general structure as the LDH phase but with no trivalent
cations or interlayer anions. From formula (10) and equation
(11) the formula would be Ni(OH)2�H2O if all of the interlayer
sites that are available for the O atoms of water molecules are
occupied [x = 0 and & = 0 in equation (11)]. It seems probable
therefore that the phase at x = 0 is one of the so-called � forms
of divalent metal hydroxides (Feitknecht, 1938), which are
disordered and contain a variable amount of interlayer water.
�-Ni(OH)2-type phases have been studied widely because of
their relevance to batteries (e.g. Oliva et al., 1982; Kamath et
al., 1994; Li et al., 2006).
If the phase at x = 0 is an � nickel hydroxide, then its a
parameter determined by experiment is given by the regres-
sion analysis equation in Fig. 4(a), i.e. 3.094 A. As noted
earlier, aMðOHÞ2can be calculated using equation (15), which
requires accurate values for � and the effective radius of the O
atom of the hydroxyl ion, r(OH�(IV)). A value for
r(OH�(IV)) for LDH phases can be established in the same
way as for r(OH�(IV)) for the single hydroxides (Fig. 2b), i.e.
by plotting values of d(M—OH) determined by experiment
for a variety of LDH phases against the values calculated from
ionic radii using equation (3), but
with �rr Mð Þ [calculated using equa-
tion (12)] substituted for r(M2+).
Such a plot is shown in Fig. 5. The
dotted line in this figure represents
perfect agreement between the
calculated values and those deter-
mined by experiment. The full line
shows that there is excellent
agreement between the calculated
and measured data when a value of
r(OH�(IV)) = 1.365 A is used in
the calculation. The dashed line
that is to the left of the full line
shows the position of the fitted line
when Shannon’s value for
r(OH�(IV)) is used instead in the
calculation (i.e. 1.35 A) and the
dashed line to the right is the posi-
tion when the value established
earlier for single hydroxides is used
(i.e. 1.37 A); both alternative values
can be seen to be wrong. Only the
data presented as circles with
crossed centres were used in the fit,
which includes all of the structures
that were determined using single
crystals because they might be
expected to be more reliable than
those determined using powder.
Comparison of Fig. 5 with Fig. 2(b)
shows that the data for LDH phases
do not produce a linear correlation
that is as strong as for the single
research papers
156 Ian G. Richardson � Layered single and double hydroxides Acta Cryst. (2013). B69, 150–162
Figure 4The lattice parameters of takovite-like phases. (a) The a parameter plotted against x for a range of Ni–Al(open circles) and Ni–Fe (filled circles) LDH preparations reported in the literature. The data for Ni–AlLDH phases are from the following references: Brindley & Kikkawa (1979); Carteret et al. (2011);d’Espinose de la Caillerie et al. (1995); Hu & Noreus (2003); Indira et al. (1994); Jinesh et al. (2010);Johnson & Glasser (2003); Kovanda et al. (2009); Perez-Ramırez et al. (2001); Prevot et al. (2009); Riveset al. (2003); Sato et al. (1988); Tsuji et al. (1993); Vieira et al. (2009); del Arco et al. (1999); Han et al.(2009). (b) The c0 parameter plotted against x for Ni—Al—CO3 (open circles) and Ni—Fe—CO3 (filledcircles) LDH phases reported in the literature. The data are from: Brindley & Kikkawa (1979); Carteretet al. (2011); d’Espinose de la Caillerie et al. (1995); Jinesh et al. (2010); Johnson & Glasser (2003);Kovanda et al. (2009); Prevot et al. (2009); Rives et al. (2003); Sato et al. (1988); del Arco et al. (1999); Hanet al. (2009).

hydroxides and this would seem to suggest that some of the
structure determinations for LDH phases ought to be revis-
ited. The values of d(M—OH)expt for the structures of the
outlying data points should be considered unreliable, or
alternatively the reported compositions of the samples are
wrong, which would result in mistakes in the calculation of
d(M—OH)calc. It is evident that the calculation used here can
be used as a sanity test for structure determinations of LDH
phases.
Substitution of the value established here for r(OH�(IV))
(i.e. 1.365 A) together with the ionic radius for Ni2+(VI) (from
Table 1 of Shannon, 1976) into equation (15) allows a value for
� to be derived by adjusting it to give the best match with the
linear regression line for Ni—Al—CO3 LDH data in Fig. 4(a).
The result is shown by the dashed line on Fig. 4(a) that falls
close to the regression line (which is the full line); the value of
� obtained in this way is 97.83�. The a parameter for this �-
Ni(OH)2 phase is obtained by substituting r(OH�(IV)) =
1.365 A and � = 97.83� into equation (4). This gives
aMðOHÞ2¼ 3:098 A (represented by an open diamond in Fig.
4a), which is very close to the value from the regression
analysis of the Ni–Al data (i.e. 3.094 A). The upper dashed
line in Fig. 4(a) is the line calculated for Ni—Fe—CO3 LDH
phases using the same values for r(OH�(IV)) and �, i.e.
repeating the calculation but exchanging r(Fe3+(HS)(VI)) for
r(Al3+(VI)) (values from Shannon, 1976). It is evident that this
simple calculation has resulted in excellent agreement with
experimental data for both Ni—Al—CO3 and Ni—Fe—CO3
LDH preparations. The value of � appears to be independent
of the type of trivalent cation.
Some of the data points for the Ni—Fe—CO3 LDH
preparations are above the upper dashed line in Fig. 4(a),
which suggests that there is a problem with those data:
perhaps an error in the composition, the a parameter or both.
The value of x could be wrong either because the composition
of the initial mix used in the synthesis procedure was simply
assumed to apply to the solid and was not checked, or because
of incorrect interpretation of the bulk analysis if the
preparation contained more than one phase. Since second
phases in LDH preparations can be amorphous or crystalline
it may be necessary to measure the actual composition of the
LDH crystals, for example by microanalysis in a transmission
electron microscope. Errors can occur in the measurement of
the a parameter, particularly where the (110) peak on the X-
ray diffraction pattern is broadened due to a small average
crystal size [a is calculated from the d-spacing of the (110)
peak, a = 2 � d110], which is of course why the proven link
between a and x given in this paper provides an important
check.
Fig. 6(a) is a plot of the a parameter against x for a range of
Mg–Al (open circle) and Mg–Ga (filled circle) LDH
preparations reported in the literature; the data for the Mg–Al
LDH involve a variety of interlayer anions (i.e. OH�, CO2�3 ,
NO�3 , Cl�). The full lines are the result of the linear regression
analyses of both sets of data; since the solid solution occurs
over a limited range of x (the reason for this limited range is
discussed by Brindley & Kikkawa, 1979) the fit for the Mg–Al
data is for 0.2 x 0.35. The figure includes points for the �polymorph of magnesium hydroxide (i.e. brucite, filled
diamond) and a theoretical � form (open diamond), in this
case a proposed hydrated form, Mg(OH)2�H2O. A solid
solution end-member with this composition was actually
suggested over 40 years ago by Taylor (1969) in a study of the
Mg–Fe LDH phases pyroaurite and ‘sjogrenite’ (sjogrenite has
been discredited recently as a separate mineral species: it is
the 2H polytype of pyroaurite (Mills, Christy, Genin et al.,
2012). The a parameter for the �-Mg(OH)2 phase, which is
calculated as above for the Ni-based system, is the same as the
value from the regression analysis of both sets of data. The
dashed lines represent the values of a calculated using equa-
tion (15); the value of � is in this case 97.41�. It is clear that the
research papers
Acta Cryst. (2013). B69, 150–162 Ian G. Richardson � Layered single and double hydroxides 157
Figure 5d(M—OH) determined by experiment for a variety of LDH phasesplotted against the value calculated using ionic radii. The circles with full-line circumferences represent the data from structures that weredetermined using single crystals and the dotted-line circles are forstructures determined using powder data. The lines are explained in thetext. The data are from the following references: (1) For single crystals:Allmann (1968, 1969) (pyroaurite and ‘sjogrenite’); Arakcheeva et al.(1996) (quintinite-2H-3c); Braithwaite et al. (1994) (iowaite); Cooper &Hawthorne (1996) (shigaite); Huminicki & Hawthorne (2003)(nikischerite); Krivovichev et al. (2010a) (quintinite-2H-3c); Krivovichevet al. (2010b) (quintinite-1M); Merlino & Orlandi (2001) (zaccagnaite);Pastor-Rodriguez & Taylor (1971) (coalingite); Rius & Allmann (1984)(wermlandite); Rius & Plana (1986) (motukoreaite); Zhitova et al. (2010)(quintinite-2H); (2) for powder where the data are used in the fit: Bellottoet al. (1996) (Mg–Al); Constantino et al. (1998) (Mg–Al); Ennadi et al.(2000) (Zn–Al); Lombardo et al. (2005) (Zn–Al–Cl); Lozano et al. (2012)(Zn–Al, zaccagnaite-3R); Manohara & Vishnu Kamath (2010) (Co–Ga,Mg–Ga); Manohara et al. (2011) (Mg–Fe); Mills et al. (2011) (Mg–Cr,barbertonite); Radha et al. (2007a) (Zn–Al); Roussel et al. (2000) (Zn–Cr); Witzke & Raade (2000) (Zn–Al, zincwoodwardite); (3) powder dataoutliers: Lombardo et al. (2005) (Zn–Al–CO3); Manohara & VishnuKamath (2010) (Ni–Ga); Mills et al. (2011) (Mg–Cr, stichtite); Radha et al.(2011) (Zn–Al–SO3, Zn–Al–IO3); Radha et al. (2007b) (Co–Al, Mg–Al).

calculated lines are strikingly similar to
those from the regression analysis of the
experimental data, which supports
strongly the geometrical approach devel-
oped in this paper, together with the
values determined for r(OH�(IV)) and
the bond angle �. The same value of � is
again appropriate with either trivalent
ion, in agreement with the observation for
the Ni-based systems; i.e. the extent to
which the metal–oxygen octahedra are
squashed is independent of the type of
trivalent ion in both Ni- and Mg-based
systems. The exact positions of the
calculated (i.e. dashed) lines on Figs. 4(a)
and 6(a) are affected by the values of both
r(OH�(IV)) and the bond angle �, which
is the reason why a value for r(OH�(IV))
was determined using Fig. 5. The positions
of the lines as shown were as a conse-
quence established simply by adjusting
the value of �, and they are in fact rather
sensitive to it. This is illustrated in Fig.
6(b), which shows the Mg–Al data from
Fig. 6(a) together with two dotted lines
that represent the best value of �� 0.5%,
which corresponds to a difference in � of
only 1� (i.e. the dotted lines are for � =
96.92 and 97.89�).
Fig. 6(c) is a plot of the layer spacing, c0,
against x for the Mg–Al (open circle) and
Mg–Ga (filled circle) LDH preparations
where the charge-balancing interlayer
anions are carbonate ions. As for the Ni-
based preparations, the data all follow the
same linear trend, regardless of whether
the trivalent ion is Al or Ga. This again
shows that the reduction in layer spacing
that occurs as x increases is due entirely to
the increase in the electrostatic attraction
between the negative interlayer and the
positive hydroxide main layer. The linear
regression analysis – which is shown by
the full line – indicates a value of c0 =
8.51 A at x = 0. Again, as with the Ni-
based system, it is proposed here that this
value corresponds to the layer spacing of
an � magnesium hydroxide that will have
the formula Mg(OH)2�H2O if all of the
interlayer sites that are available for the
O atoms of water molecules are occupied.
7. Substitution by two different typesof trivalent cations
It is evident from the foregoing discussion
that for a given value of x the replacement
research papers
158 Ian G. Richardson � Layered single and double hydroxides Acta Cryst. (2013). B69, 150–162
Figure 6The lattice parameters of hydrotalcite-like phases. (a) The a parameter plotted against x for arange of Mg–Al (open circles) and Mg–Ga (filled circles) LDH preparations reported in theliterature; the data for the Mg–Al LDH involve a variety of interlayer anions (i.e. OH�, CO2�
3 ,NO�3 , Cl�) and are from: Mg–Al: Bellotto et al. (1996); Bırjega et al. (2005); Brindley & Kikkawa(1979); Budhysutanto et al. (2011); Gastuche et al. (1967); Han et al. (1998); Jinesh et al. (2010);Kaneyoshi & Jones (1999); Kukkadapu et al. (1997); Mascolo & Marino (1980); Miyata (1980);Pausch et al. (1986); Rao et al. (1998); Sato et al. (1988); Shen et al. (1994); Valente et al. (2011); Xu& Zeng (2001); Yun & Pinnavaia (1995); Mg–Ga: Bellotto et al. (1996); Lopez-Salinas et al. (1997).(b) The Mg–Al data from Fig. 6(a) together with two dotted lines that represent the best value of� � 0.5%. This corresponds to a difference in � of only 1�, i.e. the dotted lines are for � = 96.92and 97.89�. (c) The c0 parameter plotted against x for a range of Mg–Al–CO3 (open circles) andMg–Ga–CO3 (filled circles) LDH preparations reported in the literature. Data are from: Mg–Al:Bellotto et al. (1996); Bırjega et al. (2005); Brindley & Kikkawa (1979); Budhysutanto et al. (2011);Gastuche et al. (1967); Iyi et al. (2007); Iyi & Sasaki (2008); Jinesh et al. (2010); Miyata (1980);Pausch et al. (1986); Rao et al. (1998); Sato et al. (1988); Shen et al. (1994); Valente et al. (2011);Yun & Pinnavaia (1995); Mg–Ga: Bellotto et al. (1996); Lopez-Salinas et al. (1997). (d) The aparameter plotted against x for Mg–Al,Fe LDH preparations. The lines are explained in the text.The data are from Rozov et al. (2010) (open circle), Manohara et al. (2011) (open square) andMeng et al. (2004) (filled square).

of aluminium by another trivalent ion would result in a
different a parameter but the same value of c. The treatment is
easily modified to allow for the incorporation of more than
one type of trivalent ion, for example a mixture of Al3+ and
Fe3+. �rr Mð Þ is simply calculated using equation (21) instead of
equation (12)
�rr Mð Þ ¼ 1� xð Þr M2þ� �
þ x 1� yð Þr M3þA
� �þ yr M3þ
B
� � ; ð21Þ
where x is still the fraction of cations that are trivalent, and y is
the fraction of those trivalent ions that are of a second type; so
M3þA would be one type, say Al3+, and M3þ
B the other, say Fe3+.
Equation (15) is thus modified to equation (22)
a ¼ 2 sin�
2
� �rðM2þ
Þ þ rðOH�Þ� �
� 2 sin�
2
� �ðrðM2þ
Þ
� ð1� yÞrðM3þA Þ � yrðM3þ
B ÞÞx ð22Þ
and so
aLDH ¼ aMðOHÞ2� 2 sin
�
2
� ��r M2þ� �
� 1� yð Þr M3þA
� �� yr M3þ
B
� ��x: ð23Þ
It was established earlier that the trivalent cation has no effect
on the value of �, which is determined entirely by the type of
divalent cation and there is no reason to suppose that the
situation is any different in systems that have two types of
trivalent ion. Rozov et al. (2010) report data for Mg-based
LDH preparations that have bulk x ’ 0.25 and varying
amounts of Al3+ and Fe3+; their data are presented in Fig. 6(d)
(open circle). The dashed lines on the figure represent equa-
tion (23) using Rozov et al.’s values of y (with y set as the
fraction of trivalent ions that are Fe3+) and the value for � that
was determined earlier for Mg-based preparations (i.e.
97.41�). The top dashed line corresponds to y = 1 in equations
(22) or (23) (i.e. no Al) and the lines below it are at y intervals
of approximately 0.1. The bottom dashed line is the same as
the dashed line in Fig. 6(a) (i.e. no Fe, y = 0). Inspection of Fig.
6(d) shows that Rozov et al.’s data points for 0 y 0.5 are
very close to the values calculated using equation (23), but the
points for 0.6 y 1 are not close (the difference between the
experimental and theoretical positions are indicated by
arrows). For comparison, there are two other data points
plotted for Al-free preparations, which – in contrast to Rozov
et al.’s data – are close to the theoretical position. Those data
are from Meng et al. (2004) (filled square) and Manohara et al.
(2011) (open square). The fact that Rozov et al.’s data for 0
y 0.5 and Meng et al.’s and Manohara et al.’s for y = 1 are
consistent with the calculated values is further support for the
utility of the treatment described in this paper, and suggests
that the compositions for Rozov et al.’s samples with 0.6 y
1 are possibly in error. It is possible that this could be due to
the presence of an undetected second phase since Rozov et al.
determined the composition of their solids using a bulk
technique. As noted earlier, since second phases present in
LDH preparations can be amorphous as well as crystalline it
would be useful to check the composition of the LDH crystals
by microanalysis in a transmission electron microscope.
The evidence presented in Fig. 6(d) suggests that there is a
problem with the chemical composition assumed by Allmann
(1968) for pyroaurite, i.e. x = 0.25. In that study the a para-
meter is reported to be 3.113 A, which thus corresponds to a
position on the figure above the highest point of Rozov et al.’s
data. The composition assumed by Allmann would therefore
appear to be in error with a value for x of 0.18 more likely. The
evidence also indicates that the a parameter reported by
Ingram & Taylor (1967) for pyroaurite is also likely to be
incorrect (3.13 A, which is much too high).
8. Model crystal structures for layered doublehydroxides
The crystal-chemical treatment described in this paper and the
extent of the data collated in Figs. 4 and 6 mean that model
structures that are crystal-chemically sensible can be provided
for Ni- and Mg-based LDH phases that have any value of x
(that is consistent with experiment), seemingly any trivalent
cation, and that have carbonate as the charge-balancing
interlayer ion; i.e. phases that have the general formula (24),
where M2+ is Ni2+ or Mg2+. In principle, the same approach is
possible for other divalent metals, but there are currently
insufficient data available in the literature to allow prediction
of the c parameter
M2þð1�xÞM
3þx ðOHÞ2
h iðCO3Þx=2 � 1�
3x
2�
� �H2O: ð24Þ
Natural and synthetic LDH phases usually occur in structures
that involve either a two- or three-layer stacking sequence of
the layers. Bookin and Drits showed that there are three
possible two-layer polytypes, each of which has hexagonal
stacking of the layers (denoted 2H1, 2H2 and 2H3), and a total
of nine three-layer polytypes, of which two have rhombohe-
dral symmetry (3R1 and 3R2); the other seven three-layer
polytypes have hexagonal symmetry (denoted 3H1 to 3H7;
Bookin & Drits, 1993; Bookin et al., 1993; Drits & Bookin,
2001). Detailed discussion of the different polytypes and
notation can be found in Bookin & Drits (1993), Drits &
Bookin (2001), Evans & Slade (2006) and Mills, Christy, Genin
et al. (2012). LDH minerals are known in both 2H and 3R
forms; for example ‘manasseite’ and ‘sjogrenite’ are the 2H1
polytypes of hydrotalcite and pyroaurite respectively, which
are 3R1 polytypes (Mills, Christy, Genin et al., 2012). Synthetic
LDH phases are usually 3R1, which is the polytype structure
that is used here.
The positions of the atoms in the asymmetric unit of such a
model structure are given in Table 2. The structure is based on
Allmann & Jepsen’s (1969) structure for hydrotalcite (space
group R32=m, No. 166, hexagonal axes), although many other
derivative structures have been published that involve various
cations and interlayer anions (e.g. Bellotto et al., 1996;
Constantino et al., 1998; de Roy et al., 2001; Radha et al.,
2007a,b; Johnsen et al., 2010; Manohara et al., 2011; Mills et al.,
2011). O1 is the O atom of the octahedral layer and O2
belongs to the interlayer anion or water molecule. The H
atoms of interlayer water are not included. The values of z/c
research papers
Acta Cryst. (2013). B69, 150–162 Ian G. Richardson � Layered single and double hydroxides 159

for the O1 and H1 atoms (i.e. zO1 and zH1) depend on the
fraction of M3+ ions (i.e. on ‘x’) and are calculated using
equations (25) and (9), respectively; equation (9) requires
knowledge of the oxygen–hydrogen bond distance, d(O—H).
For the purpose of these model structures d(O—H) is set at
1 A and xO2 at 18. z/c is the distance from the metal ion to the
planes of O atoms (i.e. the distance M—P on Fig. 1)
zO1 ¼h octð Þ
2cþ
1
3: ð25Þ
h(oct) is the thickness of the main layer and is calculated using
equation (6), but with r Mð Þ substituted for r M2þ� �
; h(oct) is
indicated in Fig. 3(b). �rr Mð Þ is calculated using equation (12) if
there is one type of trivalent cation, or equation (21) if there
are two types.
The a parameter for a model structure is calculated using
equations (15) or (22) – depending on whether there is one
type of trivalent cation or two – using Shannon’s values for
r(Mn+(VI)) and those determined in this paper for
r(OH�(IV)) and �; i.e. � is 97.83� for Ni-based phases and
97.41� for Mg-based, and r(OH�) is 1.365 A for both. The c
parameter is calculated using the relevant regression analysis
equation that is given in Figs. 4(b) or 6(c) (i.e. for a three-layer
polytype c = 3 � c0). As examples, Table 3 gives crystal-
structure data for model structures that have x = 0 and 13, i.e.
M(OH)2�H2O and [M2þ2=3M3þ
1=3(OH)2](CO3)1/6�12H2O], where
M2+ is Ni2+ or Mg2+ and M3+ is Al3+. h(inter) is the interlayer
separation, h(inter) = c0 � h(oct). Vcell and Voct are the
volumes of the unit cell and the M—O octahedron respec-
tively. Mr is the formula mass. Dc is the maximum calculated
density (which can be calculated for any permitted composi-
tion); vacant interlayer sites would of course result in lower
values. The structures are illustrated in Figs. 3(b) and (c),
which are specifically for the Ni-based phases but the Mg-
based look essentially the same at the scale used. For illus-
trative purposes the carbonate ions are shown ordered
(associated with the Al ions).
Table 3 includes a model structure for an � form of
Ni(OH)2. The interlayer has water molecules but no anions
and all of the oxygen sites in the interlayer are occupied: the
composition is Ni(OH)2�H2O and the calculated density is
2.71 g cm�3. If one third of the oxygen sites in the interlayer
were vacant, the composition would obviously be [Ni(OH)2]�-
2/3H2O, and the density would be 2.56 g cm�3. This is essen-
tially the same value that was reported by Bode et al. (1966) as
the measured density of an �-nickel hydroxide that had the
same composition. Bode et al. proposed a structure that gave a
similar calculated density but inspection reveals that it is
unrealistic because the Ni—O distance is much too long
[2.23 A, which implies a value of 1.54 A for r(OH�), which is
implausible] and the octahedra are not squashed (� is 87.31�).
9. Summary
The importance and utility of proper crystal-chemical and
geometrical reasoning in structural studies has been demon-
strated through the consideration of layered single and double
hydroxides. The approach has yielded new yet fundamental
information on LDH phases and it is evident that their crystal
chemistry is much more straightforward than is apparent from
the literature. Equations have been derived that enable
calculation of the composition (x) from the a parameter of the
unit cell of LDH phases and vice versa, which can be used as a
sanity test for extant and future structure determinations and
computer simulation studies. Improved values have been
determined for the effective radius of the O atom of the
hydroxyl ion in both layered single and double hydroxides.
The phase at x = 0 on a–x and c0–x plots for LDH phases is
shown to be an �-M(OH)2 phase rather than the � polymorph.
The extent to which the metal–oxygen octahedra in the main
layer of LDH phases are squashed is shown to be independent
of the type of trivalent ion, which also has no substantial effect
on the reduction in the layer spacing that occurs as x increases.
Model structures that are crystal-chemically sensible are given
for Mg- and Ni-based LDH phases – including �-M(OH)2
phases – and also for �-Zn(OH)2.
Note added in proof: A single-crystal structure determina-
tion for takovite was published subsequent to the submission
of the manuscript for this paper (Mills, Whitfield, Kampf et al.,
2012). The structure is very similar to the model structure that
research papers
160 Ian G. Richardson � Layered single and double hydroxides Acta Cryst. (2013). B69, 150–162
Table 3Crystal-structure data for takovite- and hydrotalcite-like phases.
In all cases xO2 = 18 and Z = 3; other details are given in the text.
Ni(OH)2�H2O [Ni0.667Al0.333(OH)2](CO3)0.167�0.5H2O Mg(OH)2�H2O [Mg0.667Al0.333(OH)2](CO3)0.167�0.5H2Ox ¼ 0 x ¼ 0:333 x ¼ 0 x ¼ 0:333
a (A) 3.098 3.020 3.133 3.040c (A) 24.480 22.785 25.539 22.705Vcell (A3) 203.47 179.97 217.10 181.72zO1 0.3747 0.3766 0.3739 0.3777zH1 0.4155 0.4205 0.4131 0.4217Voct (A3) 11.214 10.389 11.743 10.750d(M—O) (A) 2.055 2.003 2.085 2.024h(oct) (A) 2.024 1.973 2.074 2.013h(inter) (A) 6.136 5.622 6.439 5.555Mr (g mol�1) 110.72 101.15 76.335 78.221Dc (g cm�3) 2.711 2.800 1.752 2.144Wt% H2O 32.54 26.72 47.20 34.55

is given in Table 3 for the takovite-like phase with x = 0.333
and it has a value for the O—M—O angle � (97.86�) that is
strikingly close to the value determined in Fig. 4(a) (97.83�),
which is further support for the approach developed in this
paper.
References
Allmann, R. (1968). Acta Cryst. B24, 972–977.Allmann, R. (1969). Neues Jahrb. Miner. Monat. pp. 552–558.Allmann, R. & Jepsen, H. P. (1969). Neues Jahrb. Miner. Monatsh. pp.
544–551.Arakcheeva, A. V., Pushcharovskii, D. Yu., Rastsvetaeva, R. K.,
Atencio, D. & Lubman, G. U. (1996). Crystallogr. Rep. 41, 972–981.del Arco, M., Malet, P., Trujillano, R. & Rives, V. (1999). Chem. Mater.
11, 624–633.Baneyeva, M. I. & Popova, S. V. (1969). Geochem. Int. 6, 807–809.Bellotto, M., Rebours, B., Clause, O., Lynch, J., Bazin, D. & Elkaım, E.
(1996). J. Phys. Chem. 100, 8527–8534.Bertrand, G. & Dusausoy, Y. (1970). C. R. Acad. Sci. 270, 612�615.Bırjega, R., Pavel, O., Costentin, G., Che, M. & Angelescu, E. (2005).
Appl. Catal. A, 288, 185–193.Bode, H., Dehmelt, K. & Witte, J. (1966). Electrochim. Acta, 11, 1079–
1087.Bonaccorsi, E., Merlino, S. & Orlandi, P. (2007). Am. Mineral. 92,
198–203.Bookin, A. S., Cherkashin, V. I. & Drits, V. A. (1993). Clays Clay
Miner. 41, 558–564.Bookin, A. S. & Drits, V. A. (1993). Clays Clay Miner. 41, 551–557.Braithwaite, R. S. W., Dunn, P. J., Pritchard, R. G. & Paar, W. H.
(1994). Mineral. Mag. 58, 79–85.Braterman, P. S., Xu, Z. P. & Yarberry, F. (2004). Handbook of
Layered Materials, edited by S. A. Auerbach, K. A. Carrado & P. K.Dutta, pp. 373–474. New York: Marcel Dekker.
Brindley, G. W. & Kao, C. (1984). Phys. Chem. Miner. 10, 187–191.Brindley, G. W. & Kikkawa, S. (1979). Am. Mineral. 64, 836–843.Brindley, G. W. & Kikkawa, S. (1980). Clays Clay Miner. 28, 8784–
8791.Budhysutanto, W., van Agterveld, D., Schomaker, E., Rossenaar, B.,
van Rosmalen, G. & Kramer, H. (2011). Appl. Clay Sci. 52, 374–380.
Busing, W. R. & Levy, H. A. (1957). J. Chem. Phys. 26, 563–568.Carteret, C., Gregoire, B. & Ruby, C. (2011). Solid State Sci. 13, 146–
150.Catti, M., Ferraris, G., Hull, S. & Pavese, A. (1995). Phys. Chem.
Miner. 22, 200–206.Cavani, F., Trifiro, F. & Vaccari, A. (1991). Catal. Today, 11, 173–301.Cerny, R., Valvoda, V. & Chladek, M. (1995). J. Appl. Cryst. 28, 247–
253.Chakoumakos, B. C., Loong, C. & Schultz, A. J. (1997). J. Phys. Chem.
B, 101, 9458–9462.Christensen, A. & Ollivier, G. (1972). Solid State Commun. 10, 609–
614.Cooper, M. A. & Hawthorne, F. C. (1996). Can. Mineral. 34, 91–96.Constantino, U., Marmottini, F., Nocchetti, M. & Vivani, R. (1998).
Eur. J. Inorg. Chem. pp. 1439–1446.Denton, A. R. & Ashcroft, N. W. (1991). Phys. Rev. A, 43, 3161–3164.Desgranges, L., Calvarin, G. & Chevrier, G. (1996). Acta Cryst. B52,
82–86.Drits, V. A. & Bookin, A. S. (2001). Layered Double Hydroxides:
Present and Future, edited by V. Rives, Ch. 2, pp. 41–100. NewYork: Nova Science Publishers, Inc.
Drits, V. A., Sokolova, T. N., Sokolova, G. V. & Cherkashin, V. I.(1987). Clays Clay Mineral. 35, 401–417.
Ennadi, A., Legrouri, A., De Roy, A. & Besse, J. (2000). J. Solid StateChem. 152, 568–572.
d’Espinose de la Caillerie, J., Kermarec, M. & Clause, O. (1995). J.Am. Chem. Soc. 117, 11471–11481.
Evans, D. G. & Slade, R. C. T. (2006). Struct. Bond. 119, 1–87.Feitknecht, W. (1938). Helv. Chim. Acta, 21, 766–784.Forano, C., Hibino, T., Leroux, F. & Taviot-Gueho, C. (2006).
Handbook of Clay Science: Developments in Clay Science, editedby F. Bergaya, B. K. G. Theng & G. Lagaly, Vol. 1, Ch. 13.1, pp.1021–1095. Elsevier, Amsterdam.
Gartner, E. (2004). Cem. Concr. Res. 34, 1489–1498.Gastuche, M. C., Brown, G. & Mortland, M. M. (1967). Clay Miner. 7,
177–192.Gibbs, G., Wallace, A., Cox, D., Downs, R., Ross, N. & Rosso, K.
(2009). Am. Mineral. 94, 1085–1102.Han, S., Hou, W., Zhang, C., Sun, D., Huang, X. & Wang, G. (1998). J.
Chem. Soc. Faraday Trans. 94, 915–918.Han, Y., Li, H., Ma, X. & Liu, Z. (2009). Solid State Sci. 11, 2149–2155.Hu, W. & Noreus, D. (2003). Chem. Mater. 15, 974–978.Hudson, D. R. & Bussell, M. (1981). Mineral. Mag. 44, 345–350.Huminicki, D. M. & Hawthorne, F. C. (2003). Can. Mineral. 41, 79–82.Indira, L., Dixit, M. & Kamath, P. (1994). J. Power Sources, 52, 93–97.Ingram, L. & Taylor, H. F. W. (1967). Mineral. Mag. 36, 465–479.Intissar, M., Jumas, J., Besse, J. & Leroux, F. (2003). Chem. Mater. 15,
4625–4632.Isetti, G. (1965). Period. Mineral. 34, 327–335.Iyi, N., Fujii, K., Okamoto, K. & Sasaki, T. (2007). Appl. Clay Sci. 35,
218–227.Iyi, N. & Sasaki, T. (2008). J. Colloid Interface Sci. 322, 237–245.Ji, Q., Pellenq, R. J. & Van Vliet, K. J. (2012). Comput. Mater. Sci. 53,
234–240.Jinesh, C., Antonyraj, C. A. & Kannan, S. (2010). Appl. Clay Sci. 48,
243–249.Johnsen, R. E., Krumeich, F. & Norby, P. (2010). J. Appl. Cryst. 43,
434–447.Johnson, C. A. & Glasser, F. P. (2003). Clays Clay Miner. 51, 1–8.Kamath, P. V., Dixit, M., Indira, L., Shukla, A. K., Kumar, V. G. &
Munichandraiah, N. (1994). J. Electrochem. Soc. 141, 2956–2959.Kaneyoshi, M. & Jones, W. (1999). J. Mater. Chem. 9, 805–811.Kazimirov, V., Smirnov, M., Bourgeois, L., Guerlou-Demourgues, L.,
Servant, L., Balagurov, A., Natkaniec, I., Khasanova, N. & Antipov,E. (2010). Solid State Ionics, 181, 1764–1770.
Kooli, F., Chisem, I. C., Vucelic, M. & Jones, W. (1996). Chem. Mater.8, 1969–1977.
Kovanda, F., Rojka, T., Bezdicka, P., Jiratova, K., Obalova, L.,Pacultova, K., Bastl, Z. & Grygar, T. (2009). J. Solid State Chem.182, 27–36.
Krivovichev, S. V., Yakovenchuk, V. N., Zhitova, E. S., Zolotarev,A. A., Pakhomovsky, Y. A. & Ivanyuk, G. Yu. (2010a). Mineral.Mag. 74, 821–832.
Krivovichev, S. V., Yakovenchuk, V. N., Zhitova, E. S., Zolotarev,A. A., Pakhomovsky, Y. A. & Ivanyuk, G. Yu. (2010b). Mineral.Mag. 74, 833–840.
Kukkadapu, R. K., Witkowski, M. S. & Amonette, J. E. (1997). Chem.Mater. 9, 417–419.
Leroux, F., Moujahid, E. M., Taviot-Gueho, C. & Besse, J. (2001).Solid State Sci. 3, 81–92.
Li, H., Ma, J., Evans, D. G., Zhou, T., Li, F. & Duan, X. (2006). Chem.Mater. 18, 4405–4414.
Lombardo, G. M., Pappalardo, G. C., Punzo, F., Costantino, F.,Costantino, U. & Sisani, M. (2005). Eur. J. Inorg. Chem. pp. 5026–5034.
Lopez-Salinas, E., Garcıa-Sanchez, M., Montoya, J. A., Acosta, D. R.,Abasolo, J. A. & Schifter, I. (1997). Langmuir, 13, 4748–4753.
Lozano, R. P., Rossi, C., La Iglesia, A. & Matesanz, E. (2012). Am.Mineral. 97, 513–523.
Manohara, G. V., Prasanna, S. V. & Kamath, P. V. (2011). Eur. J.Inorg. Chem. pp. 2624–2630.
Manohara, G. V. & Vishnu Kamath, P. (2010). Bull. Mater. Sci. 33,325–331.
research papers
Acta Cryst. (2013). B69, 150–162 Ian G. Richardson � Layered single and double hydroxides 161

Mascolo, G. & Marino, O. (1980). Mineral. Mag. 43, 619–621.Meng, W., Li, F., Evans, D. G. & Duan, X. (2004). Mater. Res. Bull. 39,
1185–1193.Merlino, S. & Orlandi, P. (2001). Am. Mineral. 86, 1293–1301.Mills, S. J., Christy, A. G., Genin, J.-M. R., Kameda, T. & Colombo, F.
(2012). Mineral. Mag. 76, 1289–1336.Mills, S. J., Christy, A. G., Kampf, A. R., Housley, R. M., Favreau, G.,
Boulliard, J.-C. & Bourgoin, V. (2012). Mineral. Mag. 76, 1337–1345.
Mills, S. J., Kampf, A. R., Housley, R. M., Favreau, G., Pasero, M.,Biagioni, C., Merlino, S., Berbain, C. & Orlandi, P. (2012). Mineral.Mag. 76, 1347–1354.
Mills, S. J., Whitfield, P. S., Kampf, A. R., Wilson, S. A., Dipple, G. M.,Raudsepp, M. & Favreau, G. (2012). J. Geosci. 57, 273–279.
Mills, S. J., Whitfield, P. S., Wilson, S. A., Woodhouse, J. N., Dipple, G.M., Raudsepp, M. & Francis, C. A. (2011). Am. Mineral. 96, 179–187.
Miyata, S. (1980). Clays Clay Miner. 28, 50–56.O’Keeffe, M. (1977). Acta Cryst. A33, 924–927.Oliva, P., Leonardi, J., Laurent, J. F., Delmas, C. & Braconnier, J. J.
(1982). J. Power Sources, 8, 229–255.Oswald, H. R. & Asper, R. (1977). Preparation and Crystal Growth of
Materials with Layered Structures, edited by R. M. A. Leith, pp. 71–140. Dordrecht: D. Reidel Publishing Co.
Parise, J. B., Marshall, W. G., Smith, R. I., Lutz, H. D. & Moller, H.(2000). Am. Mineral. 85, 189–193.
Pastor-Rodriguez, J. & Taylor, H. F. W. (1971). Mineral. Mag. 38, 286–294.
Pausch, I., Lohse, H.-H., Schurmann, K. & Allmann, R. (1986). ClaysClay Mineral. 34, 507–510.
Pellenq, R. J., Kushima, A., Shahsavari, R., Van Vliet, K. J., Buehler,M. J., Yip, S. & Ulm, F. J. (2009). Proc. Natl Acad. Sci. USA, 106,16102–16107.
Perez-Ramırez, J., Mul, G. & Moulijn, J. (2001). Vib. Spectrosc. 27,75–88.
Pertlik, F. (1999). Monatsh. Chem. 130, 1083–1088.Prevot, V., Caperaa, N., Taviot-Gueho, C. & Forano, C. (2009). Cryst.
Growth Des. 9, 3649–3654.Radha, A. V., Kamath, P. V. & Shivakumara, C. (2007a). J. Phys.
Chem. B, 111, 3411–3418.Radha, A. V., Kamath, P. V. & Shivakumara, C. (2007b). Acta Cryst.
B63, 243–250.Radha, S., Prasanna, S. V. & Kamath, P. V. (2011). Cryst. Growth Des.
11, 2287–2293.
Rao, K. K., Gravelle, M., Valente, J. S. & Figueras, F. (1998). J. Catal.173, 115–121.
Richardson, I. G. (2008). Cem. Concr. Res. 38, 137–158.Rius, J. & Allmann, R. (1984). Z. Kristallogr. 168, 133–144.Rius, J. & Plana, F. (1986). Neues Jahrb. Miner. Monatsh. pp. 263–272.Rives, V., Prieto, O., Dubey, A. & Kannan, S. (2003). J. Catal. 220,
161–171.Roussel, H., Briois, V., Elkaim, E., de Roy, A. & Besse, J. P. (2000). J.
Phys. Chem. B, 104, 5915–5923.Roy, A. de, Forano, C. & Besse, J. P. (2001). Layered Double
Hydroxides: Present and Future, edited by V. Rives, Ch. 1, pp. 1–39.New York: Nova Science Publishers, Inc.
Rozov, K., Berner, U., Taviot-Gueho, C., Leroux, F., Renaudin, G.,Kulik, D. & Diamond, L. (2010). Cem. Concr. Res. 40, 1248–1254.
Sato, T., Fujita, H., Endo, T. & Shimada, M. (1988). React. Solid. 5,219–228.
Shannon, R. D. (1976). Acta Cryst. A32, 751–767.Shen, J., Kobe, J. M., Chen, Y. & Dumesic, J. A. (1994). Langmuir, 10,
3902–3908.Taylor, H. F. W. (1969). Mineral. Mag. 37, 338–342.Taylor, H. F. W. (1973). Mineral. Mag. 39, 377–389.Taylor, H. F. W. (1997). Cement Chemistry, 2nd ed. London: ICE
Publishing.Thevenot, F., Szymanski, R. & Chaumette, P. (1989). Clays Clay
Miner. 37, 396–402.Tsuji, M., Mao, G., Yoshida, T. & Tamaura, Y. (1993). J. Mater. Res. 8,
1137–1142.Valente, J. S., Pfeiffer, H., Lima, E., Prince, J. & Flores, J. (2011). J.
Catal. 279, 196–204.Vegard, L. (1921). Z. Phys. 5, 17–26.Vieira, A. C., Moreira, R. L. & Dias, A. (2009). J. Phys. Chem. C, 113,
13358–13368.West, A. R. (1984). Solid-State Chemistry and its Applications.
Chichester: Wiley.Witzke, T. & Raade, G. (2000). Neues Jahrb. Mineral. Monatsh. 10,
455–465.Woodley, S. M. & Catlow, R. (2008). Nature Mater. 7, 937–946.Xu, Z. P. & Zeng, H. C. (2001). J. Phys. Chem. B, 105, 1743–1749.Yun, S. K. & Pinnavaia, T. J. (1995). Chem. Mater. 7, 348–354.Zhitova, E. S., Yakovenchuk, V. N., Krivovichev, S. V., Zolotarev,
A. A., Pakhomovsky, Y. A. & Ivanyuk, G. Y. (2010). Mineral. Mag.74, 841–848.
Zigan, F. & Rothbauer, R. (1967). Neues Jahrb. Miner. Monatsh. 4–5,137–143.
research papers
162 Ian G. Richardson � Layered single and double hydroxides Acta Cryst. (2013). B69, 150–162