the importance of unconformity- bounded … · the importance of unconformity- bounded sequences in...
TRANSCRIPT

The Importance of Unconformity- Bounded Sequences in Flood
StratigraphyGORDON E. DAVISON
ABSTRACT
The Genesis Flood was a tectono-sedimentary event. Globally- controlled tectonic activity disrupted the otherwise continuous deposition of the Flood, forming unconformities. Unconformities are understood as erosive horizons which can extend laterally into correlative conformities.It is explained that an unconformity does represent a boundary with chronostratigraphic significance, since it marks the boundary between an older package of rocks below and a younger package above. Inter-regional or world-wide unconformities separate unconformity-bounded stratigraphic sequences called megasequences (MSQs). Megasequences are defined as regionally extensive rock-stratigraphic tracts of genetically related depositional units, of equal or higher rank than group, and bounded by unconformities (or their correlative conformities) of inter-regional extent.The importance of MSQs in Flood stratigraphy is that they indicate globally- controlled activity of tectonic and/or other mechanisms which controlled sedimentation during the Flood. It is suggested that this concept be adopted for interpreting Flood geology for several reasons, including the fact that MSQs are defined by physical boundaries (unconformities), and are thus lithostratigraphic (as opposed to time stratigraphic [evolutionary]). Each sequence refers to a cluster of strata of varying but continuous (relative) age, that is, continuous deposition (within the sequence/depocentre). It is suggested that MSQs can be used to substitute for the current geological (evolutionary) time system, as they represent more coherent subdivisions of geologic time within a single tectonic domain during the Flood. MSQs from South Africa and eight other regions around the world are described and tentatively correlated, to set up an example-correlated stratigraphic framework for interpretation of Flood stratigraphy.
INTRODUCTION
The Genesis Flood was a tectono-sedimentary event: ‘on that day all the springs of the great deep burst forth, and the floodgates of the heavens were opened.’ (Genesis 7:11)1
The springs of the great deep bursting forth describes what is geologically termed as tectonic activity. Tectonic activity (including volcanism) during the Flood would disrupt what would otherwise be continuous deposition of sediments, forming unconformities, which mark the boundaries of stratigraphic sequences. This paper will discuss the concept
of stratigraphic sequences, the nature of unconformities in space and time, and how these unconformities and the stratigraphic sequences they bound can be correlated to create a possible stratigraphic framework for interpreting Flood geology. Note that the term ‘stratigraphic’ (in this case) refers only to surface-accumulated rocks (sedimentary or not) and not to subsurface-emplaced rocks (that is, igneous intrusions).2
One of the motives of this paper is to develop a system in which to describe the depositional history of the Genesis Flood without being dependent on the evolutionary geologic timescale. This is especially true with the preconceived
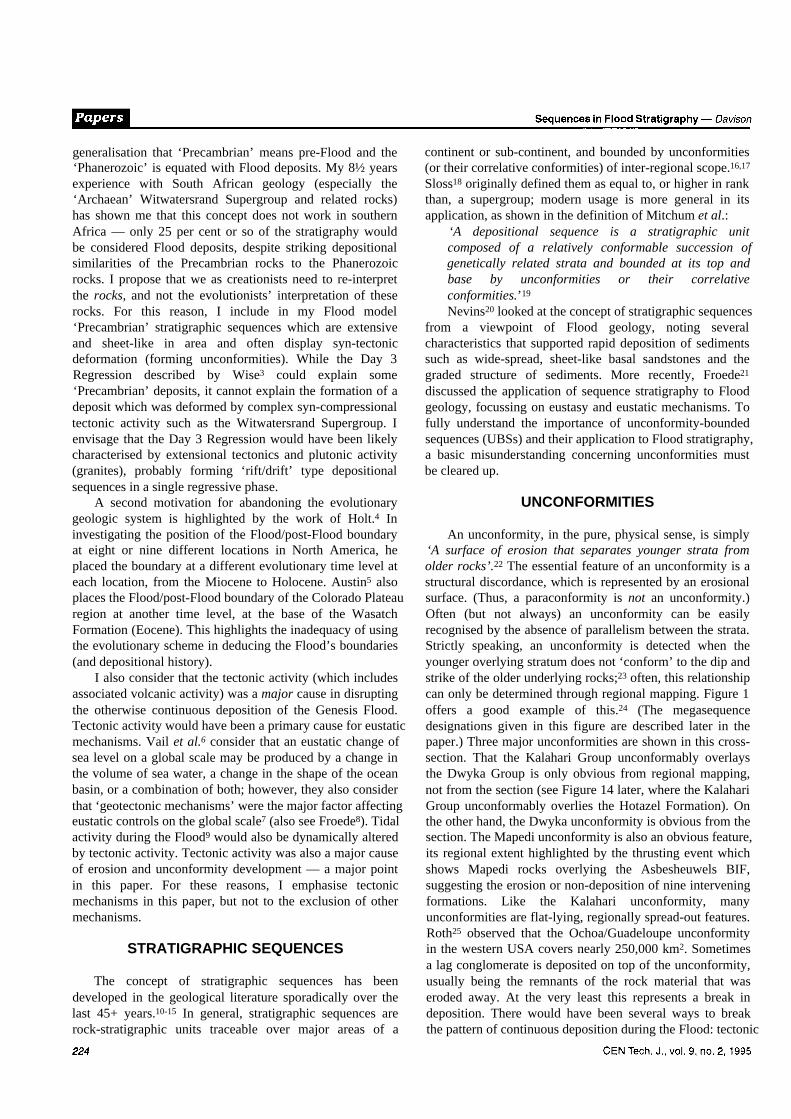
generalisation that ‘Precambrian’ means pre-Flood and the ‘Phanerozoic’ is equated with Flood deposits. My 8½ years experience with South African geology (especially the ‘Archaean’ Witwatersrand Supergroup and related rocks) has shown me that this concept does not work in southern Africa — only 25 per cent or so of the stratigraphy would be considered Flood deposits, despite striking depositional similarities of the Precambrian rocks to the Phanerozoic rocks. I propose that we as creationists need to re-interpret the rocks, and not the evolutionists’ interpretation of these rocks. For this reason, I include in my Flood model ‘Precambrian’ stratigraphic sequences which are extensive and sheet-like in area and often display syn-tectonic deformation (forming unconformities). While the Day 3 Regression described by Wise3 could explain some ‘Precambrian’ deposits, it cannot explain the formation of a deposit which was deformed by complex syn-compressional tectonic activity such as the Witwatersrand Supergroup. I envisage that the Day 3 Regression would have been likely characterised by extensional tectonics and plutonic activity (granites), probably forming ‘rift/drift’ type depositional sequences in a single regressive phase.
A second motivation for abandoning the evolutionary geologic system is highlighted by the work of Holt.4 In investigating the position of the Flood/post-Flood boundary at eight or nine different locations in North America, he placed the boundary at a different evolutionary time level at each location, from the Miocene to Holocene. Austin5 also places the Flood/post-Flood boundary of the Colorado Plateau region at another time level, at the base of the Wasatch Formation (Eocene). This highlights the inadequacy of using the evolutionary scheme in deducing the Flood’s boundaries (and depositional history).
I also consider that the tectonic activity (which includes associated volcanic activity) was a major cause in disrupting the otherwise continuous deposition of the Genesis Flood. Tectonic activity would have been a primary cause for eustatic mechanisms. Vail et al.6 consider that an eustatic change of sea level on a global scale may be produced by a change in the volume of sea water, a change in the shape of the ocean basin, or a combination of both; however, they also consider that ‘geotectonic mechanisms’ were the major factor affecting eustatic controls on the global scale7 (also see Froede8). Tidal activity during the Flood9 would also be dynamically altered by tectonic activity. Tectonic activity was also a major cause of erosion and unconformity development — a major point in this paper. For these reasons, I emphasise tectonic mechanisms in this paper, but not to the exclusion of other mechanisms.
STRATIGRAPHIC SEQUENCES
The concept of stratigraphic sequences has been developed in the geological literature sporadically over the last 45+ years.10-15 In general, stratigraphic sequences are rock-stratigraphic units traceable over major areas of a
continent or sub-continent, and bounded by unconformities (or their correlative conformities) of inter-regional scope.16,17 Sloss18 originally defined them as equal to, or higher in rank than, a supergroup; modern usage is more general in its application, as shown in the definition of Mitchum et al.:
‘A depositional sequence is a stratigraphic unit composed of a relatively conformable succession of genetically related strata and bounded at its top and base by unconformities or their correlative conformities.’19
Nevins20 looked at the concept of stratigraphic sequences from a viewpoint of Flood geology, noting several characteristics that supported rapid deposition of sediments such as wide-spread, sheet-like basal sandstones and the graded structure of sediments. More recently, Froede21 discussed the application of sequence stratigraphy to Flood geology, focussing on eustasy and eustatic mechanisms. To fully understand the importance of unconformity-bounded sequences (UBSs) and their application to Flood stratigraphy, a basic misunderstanding concerning unconformities must be cleared up.
UNCONFORMITIES
An unconformity, in the pure, physical sense, is simply ‘A surface of erosion that separates younger strata from older rocks’.22 The essential feature of an unconformity is a structural discordance, which is represented by an erosional surface. (Thus, a paraconformity is not an unconformity.) Often (but not always) an unconformity can be easily recognised by the absence of parallelism between the strata. Strictly speaking, an unconformity is detected when the younger overlying stratum does not ‘conform’ to the dip and strike of the older underlying rocks;23 often, this relationship can only be determined through regional mapping. Figure 1 offers a good example of this.24 (The megasequence designations given in this figure are described later in the paper.) Three major unconformities are shown in this cross- section. That the Kalahari Group unconformably overlays the Dwyka Group is only obvious from regional mapping, not from the section (see Figure 14 later, where the Kalahari Group unconformably overlies the Hotazel Formation). On the other hand, the Dwyka unconformity is obvious from the section. The Mapedi unconformity is also an obvious feature, its regional extent highlighted by the thrusting event which shows Mapedi rocks overlying the Asbesheuwels BIF, suggesting the erosion or non-deposition of nine intervening formations. Like the Kalahari unconformity, many unconformities are flat-lying, regionally spread-out features. Roth25 observed that the Ochoa/Guadeloupe unconformity in the western USA covers nearly 250,000 km2. Sometimes a lag conglomerate is deposited on top of the unconformity, usually being the remnants of the rock material that was eroded away. At the very least this represents a break in deposition. There would have been several ways to break the pattern of continuous deposition during the Flood: tectonic

movement of the bedrock being deposited on (regional and local), volcanism (related to tectonic activity), massive lunar tides26 (periodic event), eustatic mechanisms, etc. Thus unconformities would indicate the occurrence of one or more of these events which occurred in real time during the Genesis Flood. For example, tectonic movements would cause regional uplift of depositional tracts, which would then be differentially eroded away by hydraulic forces (see Figure 4 later).
This leads to the point that unconformities do have a time significance; this is one of the most contentious issues regarding unconformities because of the huge time gaps inferred for them by uniformitarian geologists. Roth27 noted that there was no evidence for such large time gaps in most cases. Time gaps of millions of years would have produced gullies, canyons, valleys, etc., which are rarely seen in the rock record (see Figure 2). In the few cases where these features are observed, Roth argues that the ‘presence of erosion is not an argument against rapid action. Erosion can occur very rapidly under catastrophic flood conditions.’28 For example, the Dwyka unconformity of South Africa (which covers approximately 600,000 km2)29 cut canyons and valleys of various sizes on its northern flanks.
The larger ‘Dwyka valleys’ are usually formed in areas where faulting and less resistant rock occur in the pre-Dwyka rocks (for example, Hotazel valley — see Figure 1); this combination would have aided the erosion started by the hydraulic action of the Genesis Flood. Roth concluded that as the flat and sub-parallel unconformities seen in the rock record are different from the eroding surfaces of our present earth, unconformities seem to suggest less time — which is readily reconciled with catastrophic models, for example, the Genesis Flood which proposes rapid deposition of these layers and would have bevelled sediments and left flat-lying unconformities. Thus, interpretation of unconformities as representing long periods of non-deposition is solely based on uniformitarian philosophy (for instance, how does one tell the difference between a depositional tract that has been eroded away and non-deposition?).
The other highly debated time issue regarding unconformities is their use as chronostratigraphic markers. While unconformities are not strictly isochronous, neither are they generally diachronous. Diachronous rock units cut across time lines (isochrons); unconformities cut off time lines. Figure 3 demonstrates this. The proximal and distal edges of the lower basin are eroded between times (3) and
Figure 1. Cross-section from the Northern Cape manganese field (South Africa) showing three major unconformities. See text for explanation. (After Beukes and Smit,24 Figure 9.)

(5), forming an unconformity surface. Note that the unconformity cuts off the isochrons (3), (4) and (5), and no sediment deposited during these times is preserved beyond the unconformity. The unconformity is younger than time (3) since it cuts off that isochron; it is older than time (5) since that is the last isochron it cuts off. Thus the unconformity is heterochronous (other times),31 as it represents a variable period of time.32 Since the isochrons do not travel through the unconformity, it is not diachronous. Anotherobservation is that the upper- bounding unconformity of the lower sequence is ‘active’, since it represents the limit of erosion that affected the sequence. With the resumption of sedimentation in the upper sequence, the upper- bounding unconformity of the lower sequence becomes part of the lower-boundingunconformity of the upper sequence. At this point, the unconformity becomes the top of the platform (‘bedrock’) on which the sediments of the upper sequence are deposited and thus become ‘passive’. The time significance of this is that the entire unconformity is no younger than time (5), the oldest time sediments were deposited, despite the intersection of younger isochrons with the unconformity. The basal portion of the upper sequence is time- transgressive from the depocentre out to the proximal and distal portions of the basin. The basal portion of the sequence is diachronous, extending from time (5) in the depocentre to time (9) at the distal end of the basin. But the lower bounding unconformity is not diachronous, as no sediments younger than time (5) are preserved below the unconformity.
Thus an unconformity does represent a chronostratigraphic boundary between an older package of rocks below and a younger package above.33,34 At any one location along the unconformity, the rocks below the unconformity are always
older than the rocks above it. Diachronous unconformities are rare, if they exist at all, and certainly would be restricted to inter-regional and world-wide unconformities because of the large areal extent necessary to form one (a possible example of a diachronous unconformity is discussed later in this paper). There will be no attempt to resolve this issue in this paper, but one point is offered for thought: one must not mistake the diachronous contacts of the unconformity-
Sequences in Flood Stratigraphy — Davison
Figure 2. Development of unconformities based on present-day erosional patterns:–(A) Pattern of continuous deposition.(B) Erosion.(C) Resumption of sedimentation. The old erosion surface is still visible.(D) A second cycle of erosion and deposition further complicates the pattern.(E) The normal pattern seen in the actual rock record.One would expect significant erosion below each unconformity if extensive time was involved in depositing the UBSs. Hypothetical diagram from Roth,25 Figure 4.

bounded sequence for a diachronous unconformity.35 The deposition of basal transgressive sands are diachronous in nature, but require a pre-existing surface to be deposited on. It is physically impossible to erode and deposit sediment at the same time at the same locality, even under catastrophic conditions; thus locally diachronous unconformities are not possible.
In summary, unconformities indicate geologic events which alter sedimentary patterns of deposition which occur in real time; the geometry of these unconformities would also be influenced by these events. Vail et al.36 recognised the time significance of unconformities on an inter-regional scale, as they are related to cycles of global eustasy (and other mechanisms), which are records of geotectonic and other large-scale processes that reflect major events of geologic history.Applied to the Genesis Flood, interregional unconformities would indicate the occurrence of geologic events which were globally controlled at different times during the Flood. With this principle, the broad time significance attached to inter-regional unconformities can be ‘quantified’. Exact ages or the length of the time gap need not be known. It may be possible to correlate inter-regionalunconformities on a world-wide basis to aid in interpreting the depositional history of the Genesis Flood.
CORRELATIVE CONFORMITIES
Klein37 noted (as have many creationists38) that many unconformities at some point grade laterally into conformable strata in the depocentre, and the discontinuity disappears. Klein defines the continuous bedding plane extending from the lateral disappearance of an unconformity as a correlative conformity, and uses it as part of a stratigraphic sequence boundary. The correlative conformity can be considered as part of the unconformity with a ‘zero’ time break; that is, the isochron runs exactly parallel to the ‘unconformity’. (Correlative conformities may be diachronous in some cases.) A simplistic example of the formation of a correlative conformity is shown in Figure 4. Sediment flow from the left has deposited three cycles of sediments. At time (4), tectonic movement causes an uplift to the left of the basin; hydraulic forces from the sediment flow erode away previous deposits, creating an unconformity.
Tectonic activity stops at the beginning of time (5), allowing accommodation space for the deposition of cycle (5). Cycle (5) unconformably overlays cycles (1)–(4) on the left side, while conformably overlying cycle (4) on the right side. The unconformity becomes a correlative conformity in the middle. Inter-regional unconformities will have very small (areal) correlative conformities, while local unconformities will have larger correlative conformities.
UNCONFORMITY-BOUNDED SEQUENCES
The importance of UBSs in Flood stratigraphy is that they indicate regionally (or globally)-controlled tectonic or
other activity which controlled sedimentation during the Flood. Mitchum et al.39 rated depositional sequences (UBSs) useful in establishing a comprehensive stratigraphic framework because the unit is determined by the physical relations of the strata themselves.
It is suggested that UBSs of inter-regional scope can be used to substitute for the current geological (evolutionary) time system as they represent more coherent subdivisions of geologic time within a single tectonic domain during the Flood.40 The significance of this is that it may be possible to correlate unconformity-bounded sequences whose bounding unconformities are inter-regional or world-wide. Both
Figure 3. Wheeler diagram showing time relationship of unconformities and UBSs. Note that the time-lines intersecting the unconformities from below are earlier (older) than the time-lines intersecting the unconformities from above, and that time-lines do not pass through the unconformities. (From Winter,30 Figure 1).

Morton41 and Ager42 documented the trend in the geologic record in which certain types of lithologies are more prominently deposited during certain geologic periods. Ager called this the ‘Phenomenon of the Persistence of Facies’43 without offering any explanation as to why this occurs. One of Morton’s conclusions was ‘that since global systems of rock deposition exist, the deposition of the geologic column must be globally controlled.’44 Sloss, in his classic paper, recognised six inter-regional unconformities on the North
Figure 4. Example of the formation of a correlative conformity (see text for details).
American craton and described six sequences between them (the Sauk, Tippecanoe, Kaskaskia, Absaroka, Zuni and Tejas sequences).45 In a later paper, Sloss demonstrated synchronous depositional patterns on both the North American craton and the Russian Platform, suggesting that the depositional patterns are controlled by ‘some more complex global mechanism’.46 It is suggested that this global mechanism was the global processes of the Flood (for example, the ‘breaking up of the great deep’ —
tectonic activity with associated volcanism). The hypothesis put forth here is that at certain discrete points in time during the Flood, sedimentation was disrupted on a global level and interregional or world-wide unconformities were produced, thus forming UBSs of inter-regional scope which should be correlatable on a global scale. It is suggested that this concept be adopted for interpreting Flood geology for the following reasons:(1) UBSs are defined by physical
boundaries (unconformities), that is, they are lithostratigraphic (as opposed to time stratigraphic [evolutionary]);
(2) each sequence represents the spatial and temporal distribution of a complete depositional ‘cycle’, that is, a geologic history;47,48 and
(3) each sequence refers to a cluster of strata of varying but continuous (relative) age, that is, relatively continuous deposition (within the sequence/depocentre).49,50 Nevins51 made several general
observations of Sloss’s sequences which would support their use as Flood stratigraphic units:–(1) The basal sandstones and
conglomerates are sheet-like and wide- spread, indicating that flood conditions once prevailed. There is no modern example of these sandstones.
(2) The sandstone strata generally differentially truncate preceding strata.
(3) Many sequences have graded structure (coarse to fine, clastic to chemical); reverse grading is also possible.
(4) The bounding unconformities are also wide-spread.
These general observations hold true with most UBSs seen around the world, thus making the study and correlation of UBSs a good tool for the development of a stratigraphic framework for, and the depositional history of, the Genesis Flood.

SEQUENCE HIERARCHY AND MEGASEQUENCES
In order to stratigraphically correlate these UBSs, a hierarchy of sequences is necessary to aid proper correlation. A plethora of terms have been proposed or used in the relevant literature,52 but nothing has been officially defined.
A suggested hierarchy is set out here for further discussion:–
MegasequenceSequence (super- and sub-)
(Lithostratigraphic Ranks)The term Megasequence (abbreviated MSQ) has been
previously defined in terms of Flood stratigraphy by Austin and Wise, and is reserved for the top classification within this suggested hierarchy. They define a megasequence as:
‘a regionally extensive package of sediments bounded above and below by unconformities of inter-regional extent. It is typical (but not universal) that a megasequence is a fining upward, coarse-to-fine sequence of clastics capped by carbonates. It is also typical that megasequences include a package of formations of group status or above.’53
There are several problems with this definition, mainly with the restrictive terminology. Primarily, the description of a megasequence as ‘a fining upward . . . sequence . . . capped by carbonates' is impossible to apply in southern Africa as carbonate rocks are relatively rare (especially inland). The one megasequence with extensive carbonates has them at the bottom of the megasequence. It is suggested that this statement not be included in the definition (especially since it is ‘not universal’). Additionally, the term ‘sediments’ excludes volcanic rocks, which are stratigraphic and can be included in a megasequence. I would like to offer the following definition of a megasequence for consideration:
‘A megasequence is a regionally extensive rock- stratigraphic tract of genetically related depositional units, of equal or higher rank than group, bounded by unconformities (or their correlative conformities) of inter-regional extent.’The term ‘rock-stratigraphic tract’ is used rather than
sediments, as it is inclusive of all surface-accumulated rocks: sedimentary, volcanic, or other. I have included the term ‘genetically’ because of the importance of the general related origin of rocks within the megasequence package: a set of related mechanisms occurred during a period of the Flood which led to the depositional pattern observed. This is an important part of the usefulness of megasequences — the interpretation of the depositional history of that part of the Flood. The term ‘rank’ is used rather than ‘status’ because the term ‘group’ is a lithostratigraphic rank. While some megasequences will be bounded entirely by unconformities, some megasequences will be bounded by unconformities with correlative conformities; thus the inclusion of the term in the definition.
The term sequence has also been defined by Austin and Wise in terms of Flood stratigraphy:
‘A sequence is a package of sediments bounded aboveand below by unconformities.’54
Again, the term ‘sediments’ is restrictive; additionally, I would like to embellish the definition with some terms from the Mitchum et al.55 definition of depositional sequence to emphasise the usefulness of sequences in establishing a stratigraphic framework56 for a region (as previously discussed). I would like to offer the following definition of a sequence (in the context of Flood stratigraphy) for consideration:
‘A sequence is a rock-stratigraphic tract composed of a relatively conformable succession of depositional units bounded by unconformities or their correlative conformities.’Unconformities of local to sub-regional extent can occur
within a sequence, thus the requirement that the rocks only be relatively conformable (that is, it is likely that these rocks would be conformable in the depocentre). The requirement that the rocks be genetically related has been dropped to allow the grouping of ‘non-related’ formations into a UBS; this type of sequence may stand alone outside of a megasequence, and more than likely to be only of local to regional extent. However, it is typical in most cases that a sequence of rocks will be genetically related. The prefixes super- and sub- can be used with the term sequence to expand the hierarchy.
Below the rank of sequence no further hierarchy is suggested with regard to units with chronostratigraphic significance. It is suggested that the appropriate lithostratigraphic ranks be used in subdividing a sequence (other than ‘subsequence’). The term ‘cycle’ has been used in other schemes, but it is a very over-used term, and used on a variety of scales; it has been recommended to me that the term not be used.
DESCRIPTION OF THE MEGASEQUENCES OF SOUTH AFRICA
Megasequences (MSQs) are defined by identifying major (erosive) unconformities in the geological column and then looking at the rocks between them, such as lithologic similarities within the sequence, and related origins of sedimentation and depositional patterns. The regional extent of the strata must be considered, as well as its spatial relationship between the overlying and underlying strata. Table 1 gives the stratigraphic units informally assigned to each MSQ in South Africa (SAF). Spatial relationships of these MSQs are shown in Figures 5 and 6. Stratigraphic sequences are usually numbered from the top down;57 however, it is easier to discuss the MSQs in terms of depositional history, so they are numbered accordingly here and the first MSQ discussed will be SAF-1, the oldest identifiable MSQ in South Africa. What follows is a description, and not a formal definition, of the megasequences of South Africa. Space does not allow for formal definitions

at this time, and the purpose of this section is to set up a MSQ framework for South Africa that can later be correlated with other MSQ frameworks around the world as an example at the end of this paper. More rigorous definitions of the South African MSQs will be forthcoming. Also note that tectonic controls (or lack of them) on sedimentation are emphasised for the various megasequences, and are briefly
summarised. Unless otherwise footnoted, the data for the South African megasequence interpretation following is based on the SACS,58,59 Tankard et al.,60 and Visser.61
Below SAF-1, within the Kaapvaal Craton, are deformed greenstones and sediments, such as those in the Barberton Greenstone Belt. While stratigraphic relationships can be determined within an individual greenstone belt (for example,
Figure 5. Map of South African megasequence distribution (note: Bushveld Igneous Complex ignored).
the Barberton Sequence), relationships between greenstone belts are more difficult to determine. These greenstone sequences are interpreted here to be highly deformed pre- Flood sedimentary and volcanic rocks originally deposited during the Day 3 Regression described by Wise.62 As these are not considered Flood deposits, they will not be discussed further.
The MSQ SAF-1 is described as the rocks that overlie an inter-regional unconformity cut into the pre-Flood crystalline basement and underlie an inter-regional unconformity at the base of the MSQ SAF-2 (and younger MSQs). The MSQ is comprised of the Dominion Group, Witwatersrand Supergroup, the Pongola Supergroup, the
Ventersdorp Supergroup, and the Wolkberg and Buffelsfontein Groups. The Pongola Supergroup is considered to be the lateral (distant) correlative of the Witwatersrand Supergroup and the Dominion Group.63 The inclusion of the Dominion Group is uncertain at this point because of the argument that the lavas within the group may be subaerial — this is still under investigation. It is presently included based on its correlation to the Pongola Group. The predominant lithologies of this megasequence are arenaceous quartzites, conglomerates (many mineralised), and mafic and felsic lavas. The Dominion, Witwatersrand and Pongola all contain basal conglomerates, and iron-rich (magnetic) shales (slates) are common in the Witwatersrand and Pongola
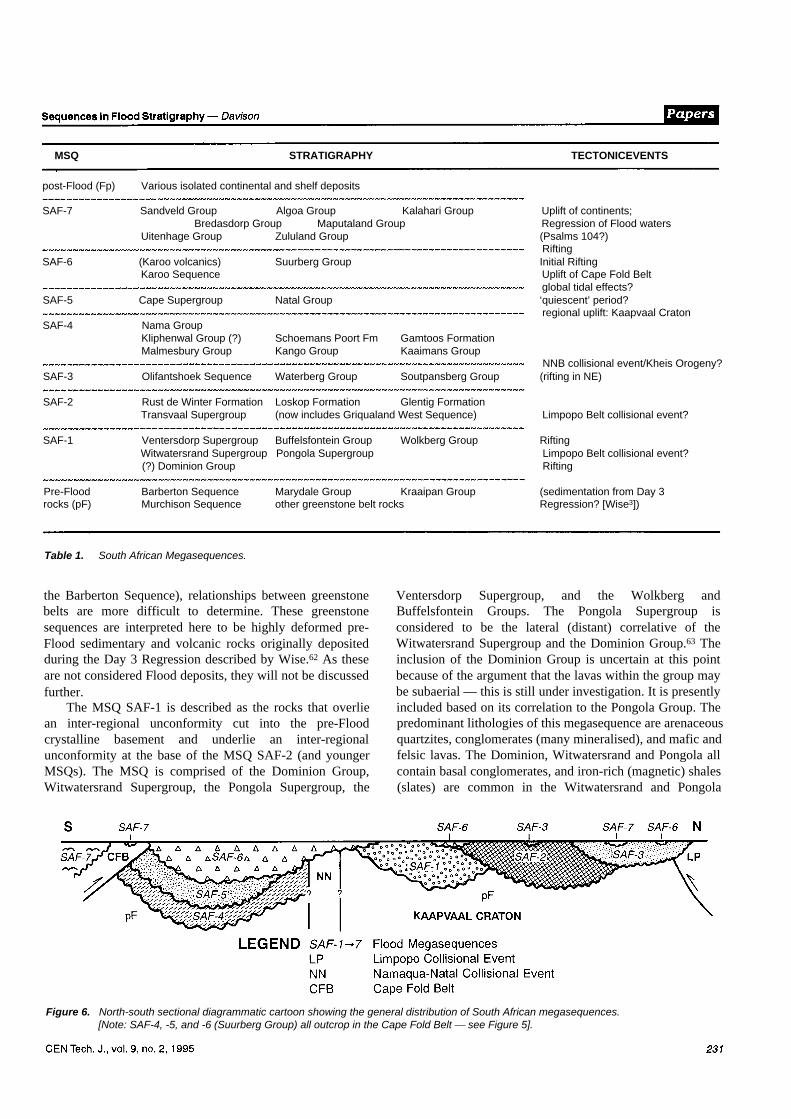
Figure 6. North-south sectional diagrammatic cartoon showing the general distribution of South African megasequences. [Note: SAF-4, -5, and -6 (Suurberg Group) all outcrop in the Cape Fold Belt — see Figure 5].
MSQ STRATIGRAPHY TECTONIC EVENTS
Table 1. South African Megasequences.
post-Flood (Fp) Various isolated continental and shelf deposits
SAF-7 Sandveld Group Algoa Group Kalahari Group Uplift of continents;Bredasdorp Group Maputaland Group Regression of Flood waters
Uitenhage Group Zululand Group (Psalms 104?)Rifting
SAF-6 (Karoo volcanics) Suurberg Group Initial RiftingKaroo Sequence Uplift of Cape Fold Belt
global tidal effects?SAF-5 Cape Supergroup Natal Group ‘quiescent’ period?
regional uplift: Kaapvaal CratonSAF-4 Nama Group
Kliphenwal Group (?) Schoemans Poort Fm Gamtoos FormationMalmesbury Group Kango Group Kaaimans Group
NNB collisional event/Kheis Orogeny?SAF-3 Olifantshoek Sequence Waterberg Group Soutpansberg Group (rifting in NE)
SAF-2 Rust de Winter Formation Loskop Formation Glentig FormationTransvaal Supergroup (now includes Griqualand West Sequence) Limpopo Belt collisional event?
SAF-1 Ventersdorp Supergroup Buffelsfontein Group Wolkberg Group RiftingWitwatersrand Supergroup Pongola Supergroup Limpopo Belt collisional event?(?) Dominion Group Rifting
Pre-Flood Barberton Sequence Marydale Group Kraaipan Group (sedimentation from Day 3rocks (pF) Murchison Sequence other greenstone belt rocks Regression? [Wise3])
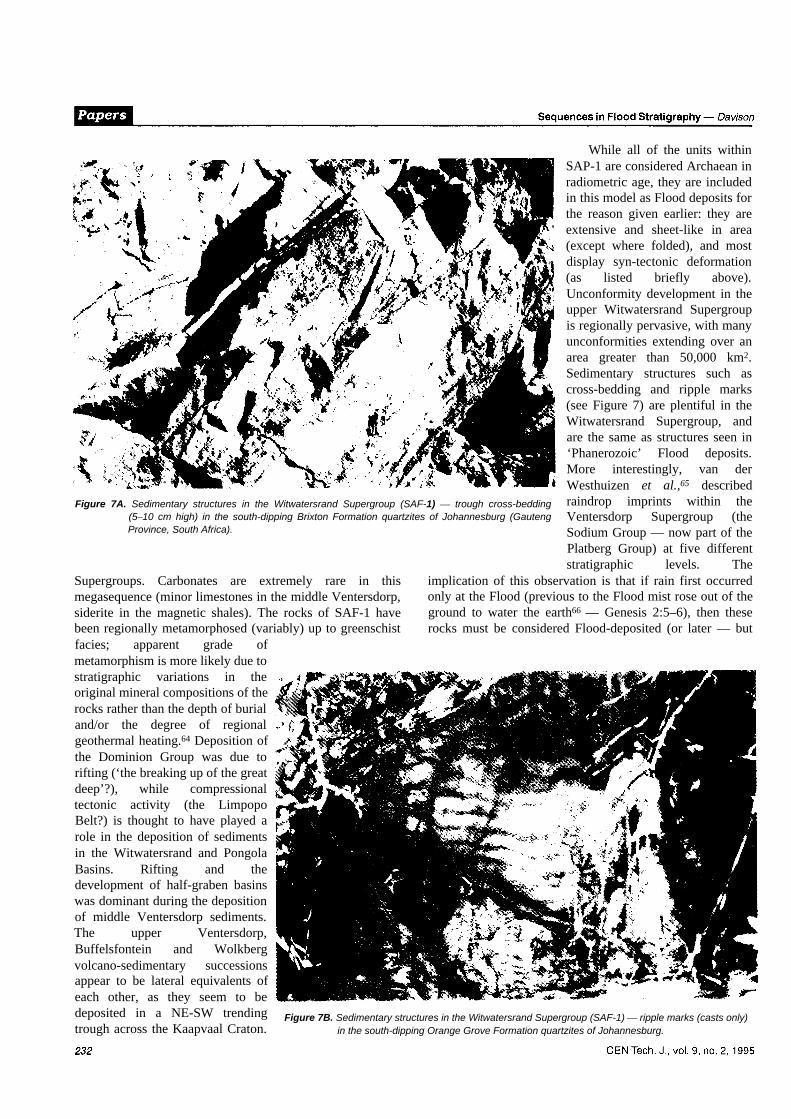
While all of the units within SAP-1 are considered Archaean in radiometric age, they are included in this model as Flood deposits for the reason given earlier: they are extensive and sheet-like in area (except where folded), and most display syn-tectonic deformation (as listed briefly above). Unconformity development in the upper Witwatersrand Supergroup is regionally pervasive, with many unconformities extending over an area greater than 50,000 km2. Sedimentary structures such as cross-bedding and ripple marks (see Figure 7) are plentiful in the Witwatersrand Supergroup, and are the same as structures seen in ‘Phanerozoic’ Flood deposits. More interestingly, van der Westhuizen et al.,65 described raindrop imprints within the Ventersdorp Supergroup (the Sodium Group — now part of the Platberg Group) at five different stratigraphic levels. The
implication of this observation is that if rain first occurred only at the Flood (previous to the Flood mist rose out of the ground to water the earth66 — Genesis 2:5–6), then these rocks must be considered Flood-deposited (or later — but
Figure 7B. Sedimentary structures in the Witwatersrand Supergroup (SAF-1) — ripple marks (casts only) in the south-dipping Orange Grove Formation quartzites of Johannesburg.
Supergroups. Carbonates are extremely rare in this megasequence (minor limestones in the middle Ventersdorp, siderite in the magnetic shales). The rocks of SAF-1 have been regionally metamorphosed (variably) up to greenschist facies; apparent grade of metamorphism is more likely due to stratigraphic variations in the original mineral compositions of the rocks rather than the depth of burial and/or the degree of regional geothermal heating.64 Deposition of the Dominion Group was due to rifting (‘the breaking up of the great deep’?), while compressional tectonic activity (the Limpopo Belt?) is thought to have played a role in the deposition of sediments in the Witwatersrand and Pongola Basins. Rifting and the development of half-graben basins was dominant during the deposition of middle Ventersdorp sediments. The upper Ventersdorp, Buffelsfontein and Wolkberg volcano-sedimentary successions appear to be lateral equivalents of each other, as they seem to be deposited in a NE-SW trending trough across the Kaapvaal Craton.
Figure 7A. Sedimentary structures in the Witwatersrand Supergroup (SAF-1) — trough cross-bedding (5–10 cm high) in the south-dipping Brixton Formation quartzites of Johannesburg (Gauteng Province, South Africa).

Figure 8. Stromatolite colonies in the Chuniespoort Group dolomites of the Transvaal Supergroup (SAF-2), near Sudwala Caves in the Eastern Transvaal Province. ‘Bedding’ is horizontal in this perspective (author for scale: 1.79 m/5 ft 10 inches).
that doesn’t make sense). Also implied by this observation is that some sort of mechanism allowed for repeated brief subaerial exposure of the deposits during the Flood. Further support for these rocks being Flood deposited is the recognition of organic carbon (‘kerogen’) in Witwatersrand rocks,67 implying that organic material was buried and matured within theWitwatersrand Basin. Regional metamorphism would have destroyed any fossil imprints. (See Snelling for further discussion of ‘Precambrian’ Flood deposits.68)
A simple lithologic description of the pre-Flood/Flood boundary is difficult to do here because of the complexity of the deposits. The ‘Vendian (Eocambrian) double- tillite’ described by Wise does not exist in southern Africa, and therefore cannot be used as a stratigraphic marker. In the central Kaapvaal Craton, the base of the Flood stratigraphic column is represented by the Dominion Group, which has one basal sedimentary formation (with a
basal boulder-conglomerate) and two upper volcanic formations whichprogressively onlap onto the basement until the Vredefort Dome, where only the upper volcanic formation is represented. AtJohannesburg, the Dominion Group is not represented and the basal quartzites (with a lag conglomerate at the base) of the Orange Grove Quartzite Formation (see Figure 7B), representing the base of the Witwatersrand Supergroup, rest on a pre-Flood granitic basement. In the eastern Kaapvaal Craton, the base of the Flood stratigraphic column is represented by the Pongola Supergroup. Its basal formations are composed of quartzites in the north, with the development of basal arkosic layers towards the centre; the basal quartzites grade into quartz-sericite
schists and phyllites to the south, as the Pongola Basin approaches the Namaqua-Natal Metamorphic Belt. Neither the Dominion Group nor the Pongola Supergroup are known
Figure 9. Banded iron formation in the Asbesheuwels Subgroup of the Transvaal Supergroup (SAF-2) west of Kuruman, Northern Cape Province. Bedding is dipping slightly west (right).

Figure 10. Johnson’s model of the formation of a diachronous unconformity. The schematic cross-section is parallel to the margin of the basin. (A)– (E): Uplift (crustal flexure) proceeds progressively from left to right, forming a diachronous unconformity. a–g represent chronostratigraphic units. (F): A ‘Wheeler diagram’ representation of the situation depicted in (E). The diagonal shading denotes periods of erosion and/or non-deposition. Note that units d–f occur on both sides of the unconformity. Also note that at any one vertical location, the rocks above the unconformity are younger than the rocks below the unconformity.
to be represented in the western Kaapvaal Craton, where the oldest rocks mapped are the sedimentary and volcanic rocks of the middle and upper Ventersdorp Supergroup.
MSQ SAF-2 is described as the rocks that overlie an inter-regional unconformity cut into the rocks of MSQ SAF-1 and the pre-Flood basement, and underlie the inter-regional unconformity at the base of the MSQ SAF- 3. MSQ SAF-2 is comprised of the Transvaal Supergroup (which now includes the Griqualand West Sequence)69 and a few ungrouped formations which stratigraphically lie between the Transvaal Supergroup and the Waterberg Group (see Table 1). Lithologically, SAF-2 begins with basal conglomerate formations (the Black Reef in the east and the Vryburg in the west). This is followed by a ‘chemical’ sequence of carbonate rocks (mainly dolomite) with stromatolite fossils (see Figure 8) and massive banded iron formations (see Figure 9). (See Austin for a discussion on Flood- deposited carbonate rocks.70) A regional unconformity lies between this sequence and the overlying sequence of clastic rocks (with minor andesitic volcanics), the Pretoria Group, which is then capped by felsic volcanics and clastic sediments. The ‘chemical’ sequence is thought to have been deposited during a tectonically quiescent period, while the Pretoria Group is now claimed to be the foreland basin of the Limpopo Orogeny by Cheney and Winter.71 The felsic volcanism is thought to be in response to extensional tectonics (that is, continued ‘breaking up of the great deep’). The overlying sedimentary formations are considered by SACS to be the ‘final sedimentary phase of the Transvaal Basin’.
MSQ SAF-3 is described as the rocks that overlie an inter-regional unconformity cut into the rocks of MSQ-2 (and older) and underlie an inter-regional unconformity which separates the rocks of SAF-3 from younger megasequences. The unconformity at the base of SAF-3 is a possible example of a diachronous or time- transgressive unconformity (older in the west and younger in the east). In the west, the basal rocks of SAF-3 rest unconformably on the rocks of the lower part of SAF-2 (see Figure 1), while in the centre a full succession of Transvaal Supergroup (SAF-2) rocks are preserved. The SAF-3 basal unconformity rests on pre- Flood rocks in the northeast, where SAF-2 and SAF-1 rocks are unrepresented. The base of the central Waterberg Basin (SAF-3) may be a correlative conformity, and the basal SAF-3 rocks in the northeast may be younger than those in the centre; the basal rocks in the southwest are thought to be older. This possibility needs to be investigated further. Johnson72 presented a model (see Figure 10) which illustrates one possible way a diachronous unconformity could develop, envisaging a regional crustal flexure migrating from left to right (west to east?). While the model has possible applications here, one must note that the lithologies above and below the SAF-3 basal unconformity are very

Figure 11. ‘Red bed’ quartzites of the Volop Subgroup of the Olifantshoek Sequence (SAF-3) southwest of Olifantshoek, Northern Cape Province. The structure pictured is a tightly folded anticline, with the bedding steeply-dipping eastward on the left side and steeply-dipping westward to vertical on the right (Kheis Fold Belt).
Belt (NNB) may have also uplifted the northern portions of the Kaapvaal Craton, causing a commencement of erosion of SAF-3. Sedimentation apparently shifted to the south of the NNB at this point in time during the Flood, with minor onlaps of sediments over the NNB to the west.
The MSQ SAF-4 is described as the rocks that overlie an inter-regional unconformity cut into the basement rocks (of uncertain age) south of (or across) the NNB and underlie an interregional unconformity at the base of MSQ SAF-5. Aside from the Nama Group, the rocks of SAF- 4 (Table 1) all outcrop in the Cape Fold Belt. SAF-4 is a poorly defined MSQ because the bases of many of the units are unobserved, and the relationship between units is uncertain, with two exceptions. The first
different before trying to assign any time equivalence across the unconformity.
MSQ SAF-3 is comprised of the Olifantshoek Sequence in the southwest, the Waterberg Group in the centre, and the Soutpansberg Group in the northeast (in a graben structure). The introduction of red bed deposits into the geologic column in South Africa occurs in SAF-3, and is the predominant lithology of the MSQ (see Figure 11). Both the Olifantshoek Sequence and the Soutpansberg Group have basal conglomerates or greywackes (diamictites); however, the Waterberg Group has several basal units, with lithologies ranging from felsic volcanics (non- SAF-2) to conglomerates and greywackes to shales. Deposition of SAF-3 sediments is thought to occur due to crustal subsidence, except in the northeast where extensional tectonics dominated.
The tectonic event that created the Namaqua-Natal Metamorphic
Figure 12. Interbedded sandstones and shales of the basal portion of the Table Mountain Group at Chapman's Peak, Cape Town (Western Cape Province). The fault throw is about 1 metre. The Table Mountain Group is the basal group of the Cape Supergroup (SAF-5).

Figure 13. Faintly-bedded diamictite of the Dwyka Group (SAF-6) near Douglas, Northern Cape Province. Note the 1 metre-diameter boulder embedded in the diamictite, deposited by a debris flow (Oard73). The SAF-6 basal unconformity is clearly seen here, with the Dwyka diamictite overlying a stromatolitic dolomite belonging to the lower SAF-2 megasequence. The striations on the ‘SAF-2 pavement’ are thought to be caused by boulders dragged by the debris flow.
an inter-regional unconformity at the base of the MSQ SAF-6 (and younger MSQs). SAF-5 is comprised of the Cape Supergroup in the west and south, and the Natal Group in the east. SAF-5 is entirely comprised of clastic rocks, with the predominant rock type quartz arenites (sandstones). Figure 12 shows the interbedded sandstones and shales near the base of the Cape Supergroup. Basal beds of SAF-5 are conglomeratic in the north and east, and coarse and/or immature sandstone in the south. This may be interpreted as a tectonically quiescent period during the Flood. Tidal or eustatic activity may have played a greater role in the formation of this MSQ than tectonic activity.
The MSQ SAF-6 is described as the rocks that overlie an inter- regional unconformity cut into the rocks of SAF-5 and older MSQs and underlie an inter-regional unconformity at the base of MSQ SAF-7. The basal unconformity of
exception is that the Schoemans Poort Formation lies unconformably on the Kango Group; the second is that the Klipheuwels Group unconformably overlies the Malmesbury Group. The Schoemans Poort Formation was at one time correlated with the Klipheuwels Group on lithological grounds; that correlation is not used at present. Otherwise, SAF-4 is a grouping of pre-SAF-5 rocks south of the NNB, deemed younger than the SAF-3 rocks. The Nama Group, composed primarily of clastic rocks, is better understood because of greater exposure. It unconformably overlays rocks of the Namaqualand Province and the NNB, and contains a basal conglomerate or pebbly sandstone. The Nama Group strata are thought to be the youngest rocks of SAF-4.
MSQ SAF-5 is described as the rocks that overlie an inter-regional unconformity cut into the rocks of SAF-4 and older rocks, and underlie
Figure 14. Basal sandstones and caliche breccia deposits of the Kalahari Group (SAF-7) unconformably overlying the Hotazel Formation (manganese ore) of the SAF-2 megasequence at Mamatwan Mine, Northern Cape Province. This locality is 27 km southeast of the cross-section of Figure 1, where the SAF-7 basal unconformity overlies the Dwyka Group (SAF-6). Glauconite was identified in the caliche breccia.

SAF-6 cuts across all of the previously described MSQs (SAF-1 to SAF-5) and pre-Flood rocks. Extensions of SAF- 6 continue northward into the southern African subcontinent. SAF-6 is comprised of the Karoo Sequence and the Suurberg Group. The major lithology in SAF-6 is mudstones, and are often associated with lenticular sandstones. The Dwyka Group, at the base of SAF-6, is composed primarily of diamictites (see Figure 13). These diamictites are interpreted to represent massive turbidite flows73 from northern sources (uplift?), and reach thicknesses of 600-750 metres in the southern Cape region. Uplift of the Cape Fold Belt to the south is probably responsible for much of the sedimentation of the middle and upper Karoo, and for erosion of older MSQ rocks. SAF-6 is capped by the flood basalts of the Drakensberg and Lebombo Groups (Karoo) and the Suurberg Group (in the Cape Fold Belt); these seem to have been associated with continental uplift and initial rifting (to form the ocean basins?).
The MSQ SAF-7 is described as the rocks that overlie an inter-regional unconformity cut into the rocks of SAF-6 and older MSQs and underlie an inter-regional (world-wide?) unconformity which is interpreted to have formed by the cessation of sedimentation at the end of the Flood (in offshore areas, this unconformity may have a correlative conformity, as sedimentation would have continued, albeit at a much slower rate). SAF-7 is composed of various geological formations and groups which lie along the coastal regions of South Africa (see Table 1), and the cratonic Kalahari Group, which occupies a relative low region in the mid-continent plateau of southern Africa (1000 m [3300 ft] above mean sea level). Figure 14 shows the unconformable contact of the Kalahari Group on the Hotazel Formation of SAF-2 (cf. Figure 1). The base of the Kalahari Group consists of basal sandstones, gravels, and caliche breccia. Glauconite, normally a marine clay mineral, was identified at this site in the caliche breccia, suggesting a subaqueous origin for these rocks. The upper sands of the Kalahari Group are interpreted (at this time) as reworked Flood deposits. The major rock types in SAF-7 are sandstones and shales, with limestones only abundant at certain localities (for example, the southern Cape coast). Both the Zululand and Uitenhage Groups have basal conglomerates. Regression of the Flood waters off of the continent and rift tectonics are thought to have played a major role in the deposition of sediments of this MSQ.
Above the inter-regional/world-wide unconformity which forms the top of MSQ SAF-7 in South Africa are isolated post-Flood (Fp) continental and offshore deposits (see Figure 5). While the Flood/post-Flood boundary is not well defined along the coast of South Africa at this time, post-Flood deposits further inland are easy to identify due to their local nature, and the ability to describe their depositional history using present-day processes. Examples of these deposits are the calcretes formed in the Northern Cape Province (derived from SAF-2 dolomites), various terrace and river gravel deposits, peat and sand deposits associated with warm springs (for example, the Florisbad Formation), and post-Flood river
fill deposits (for example, the Virginia Sand Formation, in which a fossilised specimen of Mammuthus subplanifrons was found). Cave deposits are also included as post-Flood; many deposits, such as the Sterkfontein Formation, contain australopithecine and hominid faunal fossils. The ‘age’ of the Flood/post-Flood boundary is different from location to location, ranging from Pliocene to Holocene on the evolutionary scale. Along the coast of South Africa, the Flood/post-Flood boundary is not well defined at this time, partially due to the lack of research and partially due to SACS’ present re-shuffling of stratigraphic assignments and the introduction of new formation names along the coast. Hopefully, this situation will be rectified in the next couple of years.
Post-Flood deposits generally cannot be grouped into a megasequence due to their local and non-genetic relationship with respect to each other. Offshore deposits may possibly be grouped into sequences — if they are unconformity bound. In cases where deposition is still occurring (for example, fluvial deposits), sequences cannot formally be defined as there is no upper bounding unconformity.
MEGASEQUENCE CORRELATION
The next step is to analyze major MSQs of the Phanerozoic and Precambrian of several sub-continental locations around the world and attempt to correlate these MSQs with each other. Eight additional sites have been chosen (based on the local availability of published data):–
North American Craton (Mid-continent, Gulf Coast and Atlantic Coast)
Europe: Russian Platform Western Europe Scotland
Arabia/Persian Gulf West Africa South Australia South China SeaThe relevant literature available for each region was
reviewed and bounding unconformities selected for the megasequences as could best be determined from the literature. A re-occurring problem in this exercise was the dependence on others’ evolutionary-based interpretations — certainly not the ideal for trying to do a Flood-based interpretation, but often it couldn’t be helped. Thus what is presented is an interpreted framework of megasequences. The major purpose for which they were developed was to create an example of megasequence correlation which involved real geology, rather than using a purposely perfect, fictional example with bogus data. It must be stressed that what follows is an initial working model with room for improvement (especially by local geologists). Summaries of the selected regions follow.
North American Craton (NA)Table 2 lists the Flood MSQs proposed for North

America. Sloss’s74 sequences are used; Precambrian depositional sequences are also included,75-79 for reasons given in the introduction. Wise previously defined the pre-Flood/ Flood boundary as the base of the ‘Vendian (Eocambrian) double-tillite’80 in North America, mainly based on the preserved (macro-) fossil record. Unfortunately, this definition is not correlatable world-wide (for example, Southern Africa). Wise has not dealt satisfactorily with the massive volume of Precambrian sequences deposited in areas outside the USA (for example, greater than 900,000 km3 in South Africa alone), not to mention the complex syn-tectonic activity which accompanied deposition — and all this would have had to happen in less than 24 hours. It is also my conjecture that the pre-Flood/Flood boundary will occur at different stratigraphic (evolutionary) ‘ages’ from location to location (similar to the Flood/post-Flood boundary.81)
I have included the ‘Precambrian’ Grand Canyon Supergroup as a Flood deposit based on Snelling’s argument,82 the fossil record within the supergroup (albeit disputed), and my own bias (as discussed earlier). This is not to say that Austin’s argument83 is invalid, or that NA-1 and NA-2 are definitely Flood deposits; this is simply an interpretation, whose purpose is to show that Precambrian depositional sequences can be fitted into a Flood stratigraphic framework.
MSQ NA-2 has been informally named the ‘Skookumchuk’ based on a suggestion by Bally et al.84 (following Sloss’ practice of naming sequences after Native American tribes), derived from their observation that the
Table 2. North American Megasequences.
Purcell Series (Canadian Rockies) is unconformity- bounded. They also interpreted the upper-bounding Windermere Unconformity to be due to effects from the Grenville Orogeny — which occurred on the other side of North America. Thus eight MSQs are here suggested to exist on the North American craton.
EuropeThis region was difficult to work in as most of
the stratigraphic geology and correlation is based on chronostratigraphy rather than lithostratigraphy.85 Generalised MSQ correlations were constructed for three localities in Europe, using the evolutionary time scheme to indicate the location of inter-regional unconformities.
Russian Platform (RP)Table 3 shows the generalised MSQ correlation
for this region; nine MSQs were interpreted. Data sources used were Nalivkin,86 and Sahagian and Jones.87
Western Europe (WE)Table 4 shows the generalised MSQ correlation
for the Paris Basin, English Channel, Central British Block, and the North Sea. Note the variable positions of correlated unconformities in evolutionary time.
MSQ STRATIGRAPHY
RP-9 Quaternary Tertiary (Eocene?)
Table 3. Generalised MSQ correlationfor the Russian Platform.
MSQ STRATIGRAPHY
pF Vishnu Schists (a) Peddlar and Lovingston Formations (b)Marquette Flange Supergroup (c)
(a) — Colorado Province (d) — Slave Province(b) — Grenville Province (e) — ‘Beltian’ (c) — Superior Province
RP-8 Tertiary (Palaeocene) Cretaceous (Coniacian)
RP-7 Cretaceous (Tutonian) Cretaceous (Hauterivian)
RP-6 Cretaceous (Valanginian) Upper Jurassic
RP-5 Lower Jurassic Triassic
RP-4 Permian Devonian
RP-3 Silurian
RP-2 Ordovician ‘Eocambrian’
RP-1 Serdobskian
pF ‘basement’ rocks
NA-8 Tejas Sequence
NA-7 Zuni Sequence
NA-6 Absoroka Sequence
NA-5 Kaskaskia Sequence
NA-4 Tippecanoe Sequence
NA-3 Sauk Sequence
NA-2 ‘Skookumchuk’ Sequence: Purcell ‘Series’ (e) Grand Canyon Supergroup (a)Catactin, Swift Run, and Lynchburg Formations (b) Keweenawan Supgergroup (c)
NA-1 Mazatzal, Hess Canyon, Adler, and Hondo Groups (a) Grenville Group (b) Gouldburn Supergroup (d)

Table 4. Generalised MSQ correlation for Western Europe.
Eight MSQs were interpreted. Data are from Duff and Smith,88 and Aigner et al.89
Scotland (SCT)Table 5 shows the generalised MSQ correlation for this
region; eight MSQs were interpreted. Scotland’s stratigraphy may be more correlatable to North America than to Europe. Data are from Craig.90
Arabia/Persian Gulf (APG)Table 6 shows the proposed MSQs for this region; there
may be more than six MSQs in this region as no information was readily found regarding the stratigraphy of the Arabian Shield (thus the oldest suggested MSQ being labelled APG- 2). Data are from Aigner et al.,91 and Alsharhan and Kendall.92
West Africa (WAF)West African Flood MSQs are shown in Table 7. Data
are from Wright.93 Seven MSQs are interpreted for West Africa.
South Australia (SAS)Eight MSQs were interpreted for South Australia (see
Table 8). SAS-4 and SAS-5 are based on scant data, but the unconformities appear to be real. Data are from Parkin94 and Veevers.95 The MSQs correlate well with Veevers’
‘Regimes’.
South China Sea (SCS)Table 9 shows the generalised
MSQ correlation for this region; there are probably more than five MSQs in this region as no information was available regarding the pre-Permian stratigraphy (again, the oldest suggested MSQ is labelled SCS- 2). Of interest with this MSQ column is that the post-Flood unconformity is well developed on the Chinese mainland and the change from unconformity (onshore: ~~~) to correlativeconformity (offshore: ---, see Table 9) is well-documented. The regional geology and the pre- SCS-5 regional events are described in Holloway.96 MSQ SCS-5 and SCS-4 (and their bounding unconformities) can be correlated to Indonesia.97
Table 10 shows an example correlation of the nine regionally- described MSQs outlined here. While the correlations are
simplistic, it suggests that world-wide correlations based on unconformities may be possible, with the unconformities
Table 5. Generalised MSQ correlation of Scotland.
‘Quaternary’Cretaceous
MSQ STRATIGRAPHY
Paris Basin English Channel Central British Block/North Sea
WE-8 Quaternary Quaternary QuaternaryTertiary (Palaeocene) Tertiary (Eocene) Tertiary (Palaeocene)
WE-7 Cretaceous (Maastr.) Tertiary (Palaeocene) Cretaceous (Maastr.)Cretaceous (Conian.) Cretaceous (Albian) Cretaceous (Cenom.)
WE-6 Cretaceous (Turonian) Cretaceous (Aptian) Cretaceous (Albian)Cretaceous Cretaceous
WE-5 Jurassic Cretaceous (Neocom.) JurassicPermian Permian Permian
WE-4 (no data available) Carboniferous CarboniferousDevonian Devonian
WE-3 (no data available) SilurianOrdovician (Ashgill)
WE-2 Ordovician (Caradoc)‘Eocambrian’
WE-1 Monian Supergroup
pF 'basement' rocks
MSQs STRATIGRAPHY
SCT-7 Jurassic
SCT-6 Triassic Stornway BedsPermian (upper) New Red Sandstones
SCT-5 Permian (lower)Devonian Old Red Sandstones
SCT-4 SilurianOrdovician (Ashgill)
SCT-3 Ordovician (Caradoc)‘Eocambrian’ Dalradian Supergroup
SCT-2 Torridon GroupSleat Group Moine rocks (?)Stoer Group
SCT-1 (?) Loch Marie Series Moine rocks (?)
pF ‘basement’ rocks (‘Lewisian’)
SCT-8

MSQ STRATIGRAPHY
Table 6. Arabian/Persian Gulf Megasequences.
representing geologic/hydrologic events which occurred during the Genesis Flood. Similarities in lithologies between locations aid in correlating MSQs.98'99 This was the way SAS-1 was correlated to SAF-1 (and WAF-1). MSQs RP- 2, WAF-2, SAF-2, and SAS-2 are correlated based on their basal carbonate successions, and MSQs NA-2, SCT-2, and SAF-3 are correlated based on their inclusion of ‘red bed’ type lithologies. However, different MSQs can have different rock types, depending on more local sediment sources, and still be correlated based on other criteria, including their general position in the stratigraphic column. The example correlation given is a cursory one, and not assumed to be absolutely correct. The labelled unconformities in Figure 10 are inferred to be world-wide, and due to global-scale,
Table 7. West African Megasequences.
SAS-8 Loxton Formation Parilla FormationBookpurnang Formation
SAS-7 Port Willunga Beds Gambier LimestoneBuccleuch Group Knight Group
SAS-6 Neales River Group Sherbrook GroupBlythesdale Group Otway GroupBirkhead Formation Hutton Formation
SAS-5 Nappamerrie Formation (scant data)Gidgealpa Formation Merrimelia Formation
SAS-4 Devonian (scant data)Ordovician
SAS-3 Lake Frome Group Kangaroo Island GroupHawker Group Kanmantoo Group
SAS-2 Wilpena Group Umberatana GroupBurra Group Callanna Beds
(Adelaidian Sequence)
SAS-1 Gawler Range VolcanicsCorunna Conglomerate
Formation Moonabie Formation
pF Clive MetamorphicsWillyama Complex
Table 8. Megasequences of South Australia.
globally-controlled tectonic activity. The MSQ correlation shown in Table 10 presents an initial framework for deducing the geologic history of the Flood based on lithostratigraphy without having to depend on the current geological (evolution- based) time system. This is important, as MSQ correlations cross evolutionary ‘time lines’; for example, MSQ NA-8 (see Table 2) includes Tate Palaeocene to Pleistocene’ sediments on the Texas Gulf coast, but would include ‘early Cretaceous to Pleistocene’ sediments on the Virginia coastal plain. Another example would be that of the correlation of ‘Proterozoic’ NA-1 with ‘Archaean’ SAF-1.
Please note that at no single locality in the world do all the described megasequences for a region lie atop one another; the time relationships are horizontal as well as vertical in space. Figures 5 and 6 demonstrate this for the South African MSQs.100101 Even in the Grand Canyon, as deep as it is, there are only four MSQs represented:102 NA-6, NA-5, NA-3 and NA-2 (resting on pre-Flood rocks).
PRESENT LIMITATIONS
There are presently two basic limitations to this method.
WAF-7 Niger Delta Imo ShaleChad Formation Gwandu Formation
WAF-6 Sokoto Group Rima GroupAsu River Group Continental Hamadian
WAF-5 Tegma Sandstone GroupIrhazerClays
WAF-4 Obosum Group
WAF-3 Pendjari Group
WAF-2 Dapango-Bombouaka Group Katangan
WAF-1 Birmian-Tarkwaian rocks
pF greenstone belts
MSQ STRATIGRAPHY
APG-7
APG-6
APG-5
APG-4
APG-3
APG-2
?
MSQ STRATIGRAPHY
‘Quaternary’Tertiary
Aruma Group
Wasia Group Kahmah Group Sahtan Group
Akdar Group Haushi Group
Haima Group
Huqt Group
‘Basement Complex’
(no data available for this megasequence)
Mila Group
Hormuz Group/Formation?
(no details available)

Table 9. Generalised Megasequences for the South China Sea.
Firstly, it is mainly restricted to cratonic regions and passive margins. Due to locally and regionally variable sedimentation, it is not applicable to collision zones or active margins (for example, the Namaqua-Natal Metamorphic Belt of South Africa). Klein also argues that UBSs (MSQs) cannot be correlated into foreland basins because ‘a fundamental tectonic control influences the sequence arrangement’.103 Klein reports that his attempt to correlate Sloss’s cratonic sequences into the Appalachian foreland basin failed. I suggest that Klein’s attempted correlation may have been based on assigned (evolutionary) geologic time, rather than on comparing lithostratigraphic packages. On the other hand, most of the Karoo Sequence is a foreland basin to the Cape Fold Belt, and yet it seems to correlate well even with Sloss’s scheme.104 More work needs to be
done to investigate this issue.Secondly, much of the MSQ definitions presented here
(except for parts of North America and South Africa) are dependent on (evolutionary-time based) interpretations of other geologists. For example, in the Grand Canyon, Kaskaskia (NA-5) Redwall Limestone lies unconformably on Sauk (NA-3) Muav Limestone.105 However, a recent investigation into this unconformity questions whether it is real. Snelling reports that
‘the actual observational evidence in the field supports the contention that continuous deposition occurred as the Redwall Limestone was deposited on top of the Muav Limestone, there being some interfingering and fluctuations during the postulated “changeover” period. There is no buried erosion surface evident, so the facts strongly suggest that the Redwall Limestone was deposited immediately after, and about the same time as, the Muav Limestone.’106 (Emphasis his.) Geologists familiar with individual regions need to
construct and verify megasequence stratigraphic columns for those regions.
CONCLUSION
In conclusion, it is suggested that megasequences (and their bounding unconformities) can indicate globally- controlled tectonic (including volcanic), tidal, eustatic and hydraulic activity, which would have controlled sedimentation during the Flood. Unconformities are understood to be erosive boundaries created by the combination of tectonic movements, tidal effects, eustasy and hydraulic action. As explained earlier, unconformities do have time significance, as they mark the occurrence of an event in real time which interrupted the otherwise continuous deposition of sediments
during the Flood. The determination of MSQs in a region gives the stratigraphic framework of the depositional history of the Genesis Flood for that region. From the correlation of MSQs, it may be possible to construct a Flood stratigraphic framework in which to interpret the depositional history of the Genesis Flood for the entire earth. As Table 10 shows, the example correlation done suggests that five of the i n t e r - r e g i o n a l unconformities defined in each region are possibly world-wide in Table 10. Example Correlation of MSQs.
post-Flood Pleistocene and younger~~~~~~~~~~~~~~~~~~~~~~~~~~~~~~~~~~~~ end FloodSCS-6 Pliocene Regression of
Oligocene (upper) Flood waters~~~~~~~~~~~~~~~~~~~~~~~~~~~~~~~~~~~~ Rift break-upSCS-5 Oligocene (lower)
Palaeocene~~~~~~~~~~~~~~~~~~~~~~~~~~~~~~~~~~~~ Rift onsetSCS-4 Cretaceous~~~~~~~~~~~~~~~~~~~~~~~~~~~~~~~~~~~~ ‘Yenshanian’SCS-3 Jurassic~~~~~~~~~~~~~~~~~~~~~~~~~~~~~~~~~~~~ ‘Indosinian’SCS-2 Permo-Triassic???~~~~~~~~~~~~~~~~~~~~~~~~~~~~~~~~?
? (no further information)
MSQ STRATIGRAPHY REGIONAL EVENTS

extent, indicating the possibility that five major tectonic/ eustatic (or other) events were globally-controlled. It is suggested that this concept be adopted for interpreting Flood geology for several reasons, including the fact that MSQs are defined by physical boundaries (unconformities), and are thus lithostratigraphic (as opposed to time stratigraphic [evolutionary]). Each sequence refers to a cluster of strata of varying but continuous (relative) age, that is, continuous deposition (within the sequence/depocentre). It is suggested that MSQs represent more coherent subdivisions of geologic time within a single tectonic domain during the Flood, and should be utilised to replace the presently used uniformitarian geologic time system for analysis of the depositional history of the Genesis Flood.
ACKNOWLEDGMENTS
I would like to thank Dr Andrew Snelling, Dr Kurt Wise, and an anonymous reviewer of an earlier manuscript for their input into this paper; they have made it a better paper. I would like to thank Cathy Christiansen for drafting the figures, and Laurel Hemmings, Marie Price and Alison Davison for assistance with typing and setting out the paper (deciphering my ‘chicken scratch’). I want to thank God for bringing me into contact with people and ideas over the years that have led to the formulation of the framework proposed in this paper. I want to also thank Andrew for the encouragement to finish the paper in the face of several obstacles. Finally, I want to thank my wife Alison for putting up with this project for the last two years, despite the obstacles we had to face together during that time; thank you for your love and support.
REFERENCES
1. Barker, K. (ed.), 1985. The NIV Study Bible (New International Version), Zondervan Bible Publishers, Grand Rapids, Michigan, USA.
2. Wheeler, H. E., 1964. Base level, lithosphere surface and time-stratigraphy. Geological Society of America Bulletin, 75:599–610.
3. Wise, K. P., 1992. Some thoughts on the Precambrian fossil record. CEN Tech. J., 6(1): 154-175.
4. Holt, R., 1995. The Flood/post-Flood boundary. CEN Tech. J. (in preparation).
5. Austin, S. A. (ed.), 1994. Grand Canyon — Monument to Catastrophe, Institute for Creation Research, Santee, California, USA.
6. Vail, P. R., Mitchum, R. M., Jr, and Thompson, S., Ill, 1977. Seismic stratigraphy and global changes in sea level, Part 4: Global cycles of relative changes of sea level. In: Seismic Stratigraphy — Applications to Hydrocarbon Exploration, AAPG Memoir 26, C. E. Payton (ed.), American Association of Petroleum Geologists, Tulsa, Oklahoma, USA.
7. Vail et al., Ref. 6.8. Froede, C. R., Jr., 1994. Sequence stratigraphy and creation geology.
Creation Research Society Quarterly, 31(3): 138-147 (p. 144).9. Clark, R. E. D. and Voss, H. D., 1990. Resonance and sedimentary layering
in the context of a global Flood. In: Proceedings of the Second International Conference on Creationism, R. E. Walsh and C. L. Brooks (eds), Creation Science Fellowship, Pittsburgh, Pennsylvania, Vol. 2, pp. 53-63.
10. Longwell, C. R. (chairman), 1949. Sedimentary Facies in Geologic History, Memoir 39, Geological Society of America, Boulder, Colorado.
11. Sloss, L. L., 1963. Sequences in the cratonic interior of North America.
Geological Society of America Bulletin, 74:93-114.12. Wheeler, Ref. 2.13. Mitchum, R. M., Jnr., Vail, P. R. and Thompson, S., Ill, 1977. Seismic
stratigraphy and global changes of sea level, part 2: the depositional sequence as a basic unit for stratigraphic analysis. In : AAPG Memoir 20, American Association of Petroleum Geologists, Tulsa, Oklahoma, pp. 53-62.
14. Winter, H. de la R., 1984. Tectonostratigraphy, as applied to analysis of South African Phanerozoic basins. Transactions of the Geological Society of South Africa, 87:169-179.
15. Klein, G.deV., 1991. Basin sedimentology and stratigraphy — the basin fill. In: Sedimentary and Diagenetic Mineral Deposits: A Basin Analysis Approach to Exploration, Reviews in Economic Geology 5, E. R. Force, J. J. Eidel and J. B. Maynard (eds), Society of Economic Geologists, Chelsea, Michigan, USA.
16. Sloss, Ref. 11.17. Klein, Ref. 15.18. Sloss, Ref. 11.19. Mitchum et al., Ref. 13, p. 53.20. Nevins, S. E., 1971. Stratigraphic evidence of the Flood. In: A Symposium
on Creation, D. W. Patten (ed.), Baker Book House, Grand Rapids, Michigan, Vol. Ill, pp. 33-65.
21. Froede, Ref. 8.22. American Geological Institute, 1976. Dictionary of Geological Terms,
Anchor Press/Doubleday, Garden City, New York.23. Bates, R. L. and Jackson, J. A., 1980. Glossary of Geology, American
Geological Institute, Falls Church, Virginia, USA, 751. p.24. Beukes, N. J. and Smit, C. A., 1987. New evidence for thrust faulting in
Griqualand West, South Africa: implications for stratigraphy and the age of red beds. South African Journal of Geology, 90(4):378–394.
25. Roth, A. A., 1988. Those gaps in the sedimentary layers. Origins, 15(2):75-92.
26. Clark and Voss, Ref. 9.27. Roth, Ref. 25.28. Roth, Ref. 25, p. 89.29. Visser, J. N. J., 1992. The Dwyka Group in the western half of the Karoo
Basin, South Africa. Field Guide Book for Excursion 1, Geocongress 1992, Geological Society of South Africa, Johannesburg.
30. Winter, H. de la R., 1993. All the rocks below an unconformity are older than the rocks above it: the fundamental law of sequence chronostratigraphy (reply to Johnson). South African Journal of Geology, 96(4):228-231.
31. Winter, Ref. 14.32. Abbott, W. O., 1985. The recognition and mapping of a basal transgressive
sand from outcrop, subsurface, and seismic data. In: Seismic Stratigraphy II: An Integrated Approach, AAPG Memoir 39, O. R. Berg and D. G. Woolverton (eds), American Association of Petroleum Geologists, Tulsa, Oklahoma, USA.
33. Abbott, Ref. 32.34. Mitchum et al., Ref. 13.35. Winter, Ref. 30.36. Vail et al., Ref. 6.37. Klein, Ref. 15.38. Morris, H. M. and Parker, G. E, 1987. What is Creation Science?, Master
Books, El Cajon, California, USA.39. Mitchum et al., Ref. 13.40. Klein, Ref. 15.41. Morton, G. R, 1984. Global, continental and regional sedimentation
systems and their implications. Creation Research Society Quarterly, 21(1):23–33.
42. Ager, D. V, 1993. The Nature of the Stratigraphical Record, Third edition, John Wiley and Sons, Inc, New York.
43. Ager, Ref 42, p. 23.44. Morton, Ref. 41, p. 31.45. Sloss, Ref. 11.46. Sloss, L. L, 1976. Areas and volumes of cratonic sediments, western North
America and eastern Europe. Geology, 4:272-276.47. Klein, Ref. 15.48. Winter, Ref. 14.49. Klein, Ref. 15.50. Winter, Ref. 14.

51. Nevins, Ref. 20.52. For example, see Froede, Ref. 8, Table 1.53. Austin, S. A. and Wise, K. P., 1994. The pre-Flood/Flood boundary: as
defined in Grand Canyon, Arizona and eastern Mojave Desert, California. In: Proceedings of the Third International Conference on Creationism, R. E. Walsh (ed.), Creation Science Fellowship, Pittsburgh, Pennsylvania, pp. 37–47.
54. Austin and Wise, Ref. 53.55. Mitcham et al., Ref. 13.56. Mitcham et al., Ref. 13.57. Klein, Ref. 15.58. Kent, L. E. (compiler), 1980. Lithostratigraphy of the Republic of South
Africa, South West Africa/Namibia, and the Republics of Bophuthatswana, Transkei and Venda, Handbook 8, South African Committee for Stratigraphy (SACS), Stratigraphy of South Africa, Part 1, Geological Survey South Africa, Pretoria.
59. Johnson, M. R., 1995. Developments in South African stratigraphy: 1980- 1995. Geobulletin, Geological Society of South Africa, Johannesburg, Vol. 38, no. 2, pp. 4–6.
60. Tankard, A, J., Jackson, M. P. A., Eriksson, K. A., Hobday, P. K., Hunter,D. R. and Minter, W. E. L., 1982. Crustal Evolution of Southern Africa, Springer-Verlag, New York.
61. Visser, D. J. L. (compiler), 1984. Geological Map of the Republics of South Africa, Transkei, Bophuthatswana, Venda, and Ciskei and the Kingdoms of Lesotho and Swaziland, South African Geological Survey, Pretoria.
62. Wise, Ref. 3.63. Beukes, N.J. and Cairncross, B., 1991. A lithostratigraphic-
sedimentological reference profile for the Late Archaean Mozaan Group, Pongola Sequence: application to sequence stratigraphy and correlation with the Witwatersrand Supergroup. South African Journal of Geology, 94(l):44-69.
64. Snelling, A. A., 1994. Towards a creationist explanation of regional metamorphism. CEN Tech. J., 8(1):51-77.
65. van der Westhuisen, W. A., Grabler, N. J., Loock, J. C. and Tordriffe, E. A. W., 1989. Raindrop imprints in the Late Archaean-Early Proterozoic Ventersdorp Supergroup, South Africa. Sedimentary Geology, 61:303- 309.
66. Morris, H. M., 1976. The Genesis Record, Baker Book House, Grand Rapids, Michigan, USA.
67. Robb, L. J., Landais, P., Meyer, F. M. and Davis, D. W., 1994. Nodular organic matter in granites: implications for the origin of ‘kerogen’ in the Witwatersrand Basin, South Africa. Exploration Mining Geology, 3:219- 230.
68. Snelling, A. A., 1991. Creationist geology: where do the ‘Precambrian’ strata fit? CEN Tech. J., 5(2): 154-175.
69. Johnson, Ref. 59.70. Austin, Ref. 5, pp. 24-28.71. Cheney, E. S. and Winter, H. de la R., 1995. Precambrian Research (in
press).72. Johnson, M. R., 1993. Discussion on chronostratigraphic subdivision of
the Witwatersrand Basin based on a western Transvaal composite column. South African Journal of Geology, 96(4):226-228.
73. Oard, M. J., 1994. Submarine mass flow deposition of pre-Pleistocene ‘ice age’ deposits. In: Proceedings of the Third International Conference on Creationism, R. E. Walsh (ed.), Creation Science Fellowship, Pittsburgh, Pennsylvania, pp. 407–418.
74. Sloss, Ref. 11.75. Beus, S. S. and Morales, M., 1990. Grand Canyon Geology, Oxford
University Press/Museum of Northern Arizona Press, New York.76. Cox, R., 1994. Sediment Recycling, Crustal Development and
Compositional Evolution of Clastic Sediments, Southwestern USA. Oral presentation (based on Ph.D. thesis) at Rand Afrikaans University, Johannesburg, South Africa, on 16 March 1994.
77. Grotzinger, J. P., 1990. The Evolution of Sedimentary Basins, Short Course Notes, Rand Afrikaans University, Johannesburg, South Africa.
78. Gathright, T. M., II, Henika, W. S. and Sullivan, J. L., Ill, 1977. Geology
of the Waynesboro East and Waynesboro West Quadrangles, Virginia, Virginia Division of Mineral Resources Publication 3, Charlottesville, Virginia, USA, 53 p.
79. King, P. B. and Beikman, H. M., 1974. Geologic Map of the United States (exclusive of Alaska and Hawaii), US Geological Survey, Reston, Virginia, USA (1:2,500,000 scale).
80. Wise, Ref. 3.81. Holt, Ref. 4.82. Snelling, Ref. 68.83. Austin, Ref. 5.84. Bally, A. W., Gordy, P. L. and Stewart, G. A., 1966. Structure, seismic
data, and orogenic evolution of southern Canadian Rocky Mountains. Bulletin of Canadian Rocky Mountains, 14(3):337-381.
85. Rutten, M. G., 1969. The Geology of Western Europe, Elsevier Publishing Co., Amsterdam.
86. Nalivkin, D. V., 1973. Geology of the USSR, N. Rast (translator and editor), Oliver and Boyd, Edinburgh.
87. Sahagian, D. and Jones, M., 1993. Quantified Middle Jurassic to Palaeocene eustatic variations based on Russian Platform stratigraphy: stage level resolution. Geological Society of America Bulletin, 105(7):1109–1118.
88. Duff, P. McL. D. and Smith, A. J. (eds), 1992. Geology of England and Wales, Geological Society of London, London.
89. Aigner, T., Brandenberg, A., van Vliet, A., Doyle, M., Lawrence, D. and Westrick, J., 1990. Stratigraphic modelling of epicontinental basins: two applications. Sedimentary Geology, 69:167-190.
90. Craig, G. V. (ed.), 1983. Geology of Scotland, John Wiley and Sons, New York, 472 p.
91. Aigner et al., Ref. 89.92. Alsharhan, A. S. and Kendall, C. G. St.C., 1986. Precambrian to Jurassic
rocks of Arabian Gulf and adjacent areas: their facies, depositional setting, and hydrocarbon habitat. American Association of Petroleum Geologists Bulletin, 70(8):977-1002.
93. Wright, J. B. (ed.), 1985. Geology and Mineral Resources of West Africa, George Allen and Unwin (Publishers) Ltd, London.
94. Parkin, L. W. (ed.), 1969. Handbook of South Australian Geology, Government Printer, Adelaide.
95. Veevers, J. J. (ed.), 1986. Phanerozoic Earth History of Australia, Oxford University Press, Oxford, United Kingdom.
96. Holloway, N. H., 1982. North Palawan Block, Philippines — its relation to the Asian mainland and role in the evolution of South China Sea. American Association of Petroleum Geologists Bulletin, 66(9):1355- 1383.
97. Bee, Ooi Jin, 1982. The Petroleum Resources of Indonesia, Oxford University Press, Oxford, United Kingdom.
98. Ager, Ref. 42.99. Morton, Ref. 41.100. Kent, Ref. 58.101. Visser, Ref. 61.102. Beus and Morales, Ref. 75.103. Klein, Ref. 15, p. 66.104. Winter, Ref. 14.105. Beus and Morales, Ref. 75.106. Snelling, A. A., 1992. The case of the ‘missing’ geologic time. Creation
Ex Nihilo, 14(3):30-35 (p. 34).
Gordon E. Davison has a B.S. in geology and an M.S. in geology and geophysics, both from Old Dominion University, Norfolk, Virginia (USA). He worked in the oil industry in Texas before emigrating to South Africa, where he now works as a Section Geophysicist for Anglo American Prospecting Services based in the Johannesburg area. Gordon is also involved in part-time creation science ministry as Speak to the Earth Ministries.