the incidence and impact of flexitime work arrangements
TRANSCRIPT
The Incidence and Impact of Flexitime Work Arrangements
The incidence and impact of flexitime programs in Britain are assessed by using a linked dataset of employers and employees. Organizations adopt this practice for a variety of reasons, ranging from the concern for widening the scope for employee choice to the need to comply with public regulations. Recent public regulations are based on the premise that a long hours working culture exists in society that results in low levels of job satisfaction and ill and stressed employees. The results from the British 1998 Workplace Employee Relations Survey data show a significant relationship between flexitime and various establishment and employee characteristics. There is a weak relationship between flexitime and measures of job control and, more important, the relationship is negative between flexitime and employee stress and job security.
A massive ongoing area of policy development work for many employers in Britain
currently involves putting in place a formal procedure for considering employee
requests for flexible working. This is because of the new statutory rights1 given to
parents of young or disabled children to apply for a wide variety of flexible work
arrangements – including homeworking, compressed weeks, flexitime and term-time
working – and for their requests to be given serious consideration by employers. The
British Government has actively encouraged family-friendly employment practices
over the last few years. The Government’s initial motive was to encourage employers
to adopt greater flexibility in employment conditions as provided in the Employment
Relations Act (1999) that offered employees enhanced maternity rights, new rights for
unpaid parental leave and for unpaid time off for dependents.
Government policy is primarily motivated by the assumption that there is a tension
between the demands of work (which in recent years has come to be associated with
long working hours) and home, and so it is in the interest of employers to provide 1 Under the terms of the Employment Act 2002, a ‘qualifying employee’ may apply to their employer for a change in terms and conditions of employment if the change relates to any of the following: (i) the hours the employee is required to work; (ii) the times when they are required to work; and (iii) where, as between home and a place of business of the employer, the employee is required to work.

opportunities for their workforce to achieve a better work-life balance with the pay-
back of increased morale, improved productivity, and the ability to embrace change
(Bevan et al 1999). Research on the effect of family-friendly employment practices
provides key empirical support to this position (see, for example, a special issue of
Industrial Relations (2003) on this subject). However, because the current policy
debates in Britain frequently invoke the ill-effects of long hours culture as the main
raison d'être for working time flexibility, it will be instructive to investigate the scope
and limitations of the flexitime solution2. For instance, empirical investigations will
shed light on the extent to which flexitime practices are positively linked to lower
levels of employee stress and job insecurity.
Empirical tests on questions such as these are made possible by the recent availability
of the 1998 British Workplace Employee Relations Survey (WERS98) as it provides a
comprehensive linked dataset on the managers’ and employees’ own assessment of
the use and effectiveness of flexitime. The present study aims to investigate the
incidence and impact of flexitime on employee stress and job security, and on various
organizational practices. The article first provides a brief summary of the issues
currently discussed in the literature on flexitime, and then discusses regression results
from WERS98. The final section highlights the limitations of the study and indicates
potential future research areas.
2 This has been one of the central research area in work-family research in the USA (Drago and Hyatt, 2003). This research mainly focuses on the existence of long hours of employment and its effects on work and families (Schor 1991; Hochschild 1997)

The Effect of Long Hours Culture
The main goal of ‘flexitime’ is to give people choice about their actual working hours,
usually outside certain agreed core times. This means employees can vary their
starting and finishing times each day at work and sometimes also their break times
during the day. This managerial innovation was initially seen as an attempt to reduce
absenteeism, especially among women employees3.
However, flexitime is now seen as an important component of a work-life balance
package designed for mitigating the ill-effects of a ‘long hours working culture’, with
important ramifications for both employers and employees (Galinsky and Johnson
1998). The current policy debate involves three important sets of arguments for
promoting flexitime work practices, including (i) the incidence of a long hours
working culture, (ii) its impact on employee attitudes and company performance, and
(iii) the role of complementary organizational practices. We discuss these in turn:
The incidence of long working hours. The thesis on flexitime examines the question of
whether and why the average time that many people spend at work is increasing,
despite cuts in the basic working week and increases in paid holiday. The aggregate
pattern in the United States suggests that the average hours worked by individuals has
not declined since 1970; indeed, for some groups average hours have increased
(Golden and Figart 2000). Similar patterns have been observed for British corporate
employees. The usual working week for full-time employees in Britain is the highest
in the European Union: 43.3 hours, compared with an average of 39.3 hours in the 3 For instance, Piotet (1988) argues that female absenteeism is due primarily to inflexibilities in both the workplace and society at large, which result in problems associated with children together with problems of access to social and commercial services during normal hours of work (pp. 128-129).
euro area and just 37.7 hours in France. Amongst full-time employees, a quarter of
British men and a tenth of women usually work more than 48 hours a week.
The ‘extensive work effort’ (i.e. long working hours) has in some cases been
accompanied by increases in ‘intensive work effort’ or ‘work intensity’. Green (1999)
argues that recent studies on work restructuring support the view that a substantial
degree of work intensification took place during the 1980s (especially in
manufacturing) and may have extended into the 1990s4. Consequently, the old ‘job for
life’ has been replaced by unstable and promiscuous working lives, where ‘hire and
fire’ is rampant. Employees feel insecure – not just in terms of employability, but also
in terms of the impact on their role of organizational changes in the workplace.
Creating a work-life balance. A persistent culture of extensive and intensive work
efforts may run the risk of stifling worker productivity and economic competitiveness
(Dex and Scheibl 1999). When people are juggling work with home responsibilities or
working long hours that result in exhaustion, stress and reduced effectiveness, a toll is
taken not only on their approach to work but also on their health and well-being.
According to the Labor Force Survey (LFS), nearly 1.9 million working days a week
were lost to sickness and injury in summer 2000 (ONS 2000). This figure represented
1.8% of scheduled working days in Britain. Moreover, the number of claimants
incapacitated by sickness and invalidity5 has increased substantially since the late
1970s, especially linked to the mental disorders of ‘stress and depression’.
4 In this respect, IDS (1997) cite the example of new office accessories, such as the fax, modem and the mobile phone, which are all very convenient, but also make it harder to draw the line between work and home life. Accessibility via mobile phone and e-mail extends the working day, and many find themselves overloaded with information and working at their laptops late into the night. 5 Invalidity benefit was replaced by incapacity benefit in 1995.

The introduction of flexitime work arrangements, or a better work-life balance, is seen
as alleviating many of the inflexibilities resulting from demanding and stressful work
environments (Arnott and Emmerson 2001). For instance, Stone et al. (1994) found
that the sickness records of part time workers were better than those of full-time staff.
One study on the benefits of childcare suggested that employers who provided
childcare referral services for employees saved an estimated £2 for every £1 they
spent due to reduced sickness absence (Dex and Scheibl 1999). A Hewitt Associates
(1996) survey reported that 68 percent of all U.S. companies offered flexitime.
Research work conducted in the late 1970s and early 1980s using American company
data found that permitting employees to exercise flexibility in their arrival and leaving
times reduced absenteeism, tardiness, overtime, etc (Golembiewski and Hilles 1975;
Kim and Campagna 1981; Hicks and Klimoski 1981). Later work supported the
earlier findings that increased access to flexible options reduces absenteeism (Kandola
and Fullerton 1998).
Complementary organizational practices. Flexibility is thus stressed as an important
part of a work-life balance package, in which the primary objective is to dismantle
many of the organizational barriers created by a lethargic mass production system
(DfEE 2000). Flexitime encourages employee control over scheduling, as well as the
work process itself, thereby enhancing the autonomy of employees to make work-
related decisions independently and with a greater degree of confidence and trust
(Bailyn, 1993, Atkinson and Meager 1986). Delegation of authority in this way
increases employee involvement as well as securing a better match between
complementary organisational practices (Wood, de Menezes and Lasaosa, 2003, Berg,
Kalleberg and Appelbaum 2003). Further, the degree of freedom afforded to an
.

individual to schedule her work enhances her ability to make opportune decisions
about her needs.
For some people, evening or weekend work means the chance to gain an extra income
while a partner is at home to care for children or elderly relatives. For others, a late
morning start, a longer lunch break or a shift at night, allows sport and fitness to be
factored into their day. In these situations giving employees opportunities to adjust
their working hours will have positive staffing consequences for the organization. For
example, an increase in staff working at peak demand times on shorter shifts, such as
on a 4pm – 10pm, or 5pm – 11pm shift in a control room, can cut down on the need
for other staff to work overtime6.
A Critique. Whilst some of the conclusions of the work discussed above lay emphasis
on the negative impact of an overbearing work culture, a significant body of research
also seeks to provide alternative explanations for the prevalence of these particular
work norms. Golden and Figart (2000) suggest that, for many, the expression
‘overwork’ is inaccurate, for it fails to encapsulate individuals’ preferences to work
long hours, either to satisfy material desires or in recognition of the fact that, for many,
remaining at work ‘after hours’ may be more enjoyable, fulfilling and less arduous
than the domestic chores awaiting them at home. Thus, there is an important
difference between those forced into working long hours by low wage rates or an
exploitative employer, and those working long hours by choice.
6 These staff are also known as `key timers’. In some cases this strategy may be unpopular if staff rely on overtime hours to boost their wages.

Empirical studies also demonstrate the dangers of seeking a general thesis on
working-time trends; for, while some groups (particularly white, educated men) may
be identified as ‘overworked’ in terms of the number of hours worked, others (women,
ethnic minorities, and the less educated) are often underemployed (Pe´rotin and
Robinson 2000). The pressure of work and organizational change plus excessive
hours may result in low levels of job satisfaction and ill and stressed employees but
there is no evidence that this is entirely due to a ‘long hours culture’. Moreover, job
duration data show very modest changes over the last 20 years (ONS, 2003); this, in
itself, refutes the assertion that job ‘insecurity’ has dramatically increased over this
period.
The growth of extensive unpaid-overtime working may, in fact, manifest the way
incentives are diffused through organizational processes such as the link between
promotional opportunities and long working hours (Bell and Hart 1998, Landers et al
1996). Empirical results on ‘flexitime’ workplaces implementing an integrated and
comprehensive management approach are also mixed - a baseline organizational
requirement for the successful implementation of flexitime. Pendleton (1991)
illustrates a case of the conflicts over flexible rostering and employment rules and
practices in his study of railway workers.
The evidence discussed above casts doubt on the special case for work-life balance
programs and raises important questions about the extent to which practices such as
flexitime can be usefully employed to tackle problems such as employee stress and
job dissatisfaction. Further, the role of flexitime in helping create an environment of
decentralized decision-making is also ambiguous. A detailed empirical evaluation of

the effect of flexitime may possibly shed light on these questions as well as the
conditions required for mitigating the ill-effects of work-life imbalances.
Empirical Analysis
The aim of the present study is to evaluate the incidence and impact of flexitime using
data from the 1998 British Workplace Employee Relations Survey (WERS98).
WERS98 is a nationally representative survey of workplaces with 10 or more
employees and contains a vast amount of information on diverse aspects of employee
relations and organisational formats (Cully et al 1999). The WERS 98 data are
designed to be nationally representative of workplaces with 10 or more employees.
Face-to-face interviews for WERS98 were conducted with a manager (with day-to-
day responsibility for employee relations) at 2,191 workplaces, constituting a
response rate of 80 per cent. The WERS 98 survey of employees comprises 28,240
observations, constituting a response rate of 64 per cent. The use of this dataset
overcomes many of the difficulties experienced by earlier research on similar topics
(Cappelli and Neumark 2002).
For instance, existing literature on the determinants of work flexibility has been
largely concerned with analyzing the impact of establishment level factors, such as
task flexibility, on organizational productivity. It seldom employs workplace and
employee information together to examine the relative contribution of employee and
establishment level factors to the incidence and impact of flexible working practices.
The present research fills this gap by using the WERS98 dataset, which is a linked
survey of workplaces and employees.

Work benefits that are not fully contingent are hard to identify, but WERS98 provides
a useful set of information about work environment, job characteristics, and
occupation. The survey covers a wide range of demographic information, including
age, gender, ethnic background, disability, education, number of children etc and
information about job activities, such as permanent employment, occupational choice
and employer-provided training. This permits researchers to examine questions such
as whether individual employees have identifiable characteristics that make them
more likely to have reduced levels of participation in work-life programs than other
groups, and vice versa.
Research Design
The present investigation focuses on the three areas of the research outlined above,
namely the extent to which flexitime has been adopted, and the impact it has had on
employee stress and job control. Given the nature of the research questions, survey
probit or ordered probit modelling techniques are used throughout. It is thus possible
to hold constant a range of workplace and individual level characteristics, while the
relationships between the dependent and independent variables are analyzed. These
techniques also enable the probability of respondents’ selection into the sample and
the design of the survey of employees to be taken into account. Probability weights
are used in all regressions.
The particular tests of the incidence and impact of flexitime are the following.
The Incidence of Flexitime Work Arrangements. A major stated goal of flexitime
work arrangements is to ensure that work-life balance makes an effective contribution
to the personal development of employees and to assist progress toward enterprise
competitiveness. The article first examines the types of workplaces that have
introduced flexitime, and considers whether there are certain types of workplaces
within which the use of flexitime is significantly poorer. The results should be of
particular interest to policy makers, as they will identify the types of workplaces that
are less likely to have sought a flexible working approach.
To carry out this analysis, a dichotomous dependent variable is created (where 1 =
flexitime workplaces, and 0 = non-flexitime workplaces). The objective is to regress a
range of independent variables concerning workforce characteristics onto this
dependent variable so as to identify the types of workplaces that are more/less likely
to have introduced flexitime work arrangements. A full listing of the variables used is
provided in Table 1. A similar analysis is undertaken by using employee data to
identify employee characteristics that are more/less likely to be associated with the
use of flexitime (Table 2 contains all variables used).
Employee account of job stress and employment security. Existing literature on work-
life balance emphasizes the need for practices such as flexitime because of continuing
concerns over the lack of employee job satisfaction and welfare (Perry-Jenkins,
Repetti, and Crouter 2000, DfEE 2000). It is believed that flexitime work
arrangements would alleviate the instances of stress and job insecurity within the
workplace. The second aim is to use the WERS 98 survey of employees to compare

employees’ experience of job insecurity and stress in flextime workplaces and in non-
flexitime workplaces.
In order to evaluate this issue, a dichotomous independent variable (where 1 =
‘employees in flexitime workplaces’, and 0 = ‘employees in non -flexitime
workplaces’) is regressed onto three dependent variables. These are: firstly, whether
the employee agrees with the statement that ‘you worry a lot about your work outside
working hours’ (on a scale of 1 to 6 where 1 = ‘ten days or more’ and 6 = ‘none’;
mean score 3.33); secondly, whether the employee agrees with the statement that ‘you
feel your job is secure in this workplace’ (on a scale of 1 to 5 where 1 = ‘strongly
agree’ and 5 = ‘ strongly disagree’; mean score 2.57); and thirdly, whether the
employee agrees with the statement that ‘you never seem to have enough time to get
your job done’ (on a scale of 1 to 5 where 1 = ‘strongly agree’ and 5 = ‘ strongly
disagree’; mean score 2.66). All of these equations include controls for the employee
characteristics listed in Table 2.
The Relationship between Flexitime and Job Control. Organizations embracing
flexitime work arrangements as part of a work-life balance package are likely to
dismantle many of the features of control-based organizational systems and introduce
measures which will provide better variety and control over the work itself (Berg,
Kalleberg, Appelbaum 2003, Wood, de Menezes, Lasaosa 2003). This is based on the
assumption that flexitime encourages employee control over scheduling, and provides
the freedom to make work-related decisions more independently. As Eaton (2003)
notes, “The design of work-family programs and work structures and the amount of
control employees have over the pace and place of their work are all-important (p.
163)”. The third aim of this article is to test whether workplaces with flexitime work
arrangements are indeed more likely to have adopted activities associated with
participatory organizational practices than are their counterparts without flexitime
work arrangements.
To evaluate this issue, a dichotomous independent variable (where 1 = ‘flexitime
practice’, and 0 = ‘no-flexitime practice’) is regressed onto three dependent variables.
These are, firstly, the extent to which employees in the largest occupational group
have discretion over how they do their work? (on a scale of 1 to 4 where 1 = ‘none’
and 4 = ‘a lot’ ; mean score 2.19); secondly, the extent to which employees in the
largest occupational group have control over the pace at which they work (on a scale
of 1 to 4 where 1 = ‘none’ and 4 = ‘a lot’ ; mean score 2.29); and thirdly, the
proportion of employees in the largest occupational group who work in formally
designated teams (on a scale 1 to 7 where 1 = ‘none’ and 7 = ‘all’ ; mean score 2.91).
All of these regressions control for a range of workplace-level characteristics listed in
Table 1.
Results
The Incidence of Flexitime Work Arrangements. The results provided in Table 1
report the coefficients and standard errors from the probit equation as well as the
magnitude of the effect of workplace characteristics on the probability of uptake of
flexitime work arrangements. The procedure followed is to report, first, the
probability of flexitime working arrangements for a ‘benchmark’ workplace, and then
vary the workplace characteristics one at a time to see how they influence the

probability of uptake of flexitime work arrangements. There are 34 per cent of
workplaces with flexitime work arrangements in the sample under investigation.
Table 1 about here
The factor that appears most significant in deciding whether flexitime is introduced is
organizational size. The benchmark probability of flexitime practice increases by 37
per cent when it is recalculated using large size establishments (i.e. more than 10,000
employees) as opposed to workplaces that are part of a smaller organization (with all
other variables staying the same). Small or medium size establishments are less likely
to have introduced flexitime work arrangements. The magnitude of the effect is not
inconsiderable. For example, the probability of flexitime work arrangements uptake
falls by –25 per cent, from 0.309 for the benchmark workplace to 0.234 when it is
recalculated using workplaces with 50-199 employees as opposed to 200-499
employees (keeping all other variables the same). This is a somewhat surprising result
as it is generally assumed that small workplaces are more likely to use innovative
practices to stay competitive in their particular markets (for instance, competing for
highly skilled workers). However, since the costs of setting up (and providing)
flexitime work arrangements are considerably higher for small establishments, it is
likely that they are held back from embarking on that expensive route.
A considerable degree of variation in the probability of uptake of flexitime work
arrangements by industry sector is also apparent from Table 1. The recalculation of
the benchmark probability of uptake by using workplaces in the financial
intermediation sector as opposed to manufacturing (with all other characteristics
staying the same) show that the probability increases by 82 per cent. Similar trends
are found when other sectors are used: for instance, it increases by 62 per cent when
the electricity, gas and water supply sector is used, it increases by 56 per cent when
the health and social work sector is used, by 44 when the hotels and restaurants sector
is used, and by 17 when the wholesale and retail trade and the repair of motor vehicles
sectors are used. Sectors such as construction and transport, storage and
communication experience the negative trend of a decreasing probability of flexitime
uptake.
Workplaces operating in regional markets are more likely to have introduced
flexitime work arrangements: the likelihood of the adoption of flexitime increases by
27 per cent to 0.393 when the benchmark probability is recalculated using local
markets. On the other hand, workplaces serving national and international markets are
less likely to have adopted flexitime work arrangements. A more significant disparity
emerges between establishments partly or predominately owned locally and
establishments predominantly or fully owned and controlled by foreigners – the
likelihood of uptake increases by 33 per cent to 0.412 when the benchmark
probability is recalculated using foreign ownership as opposed to UK owned firms.
This suggests that the UK firms lag behind their foreign counterparts in taking
initiatives to introduce more competitive employment packages. It may be the case
that foreign owned firms are more inclined to use flexitime work arrangements so as
to compete more effectively in local labor markets.
A related finding is that intensely competitive environments are negatively correlated
with the adoption of flexitime arrangements – the likelihood of the uptake of flexitime
work arrangements falls to 30 per cent when the benchmark probability is recalculated

using workplaces operating in highly competitive markets as opposed to workplaces
with no competition. This is probably because of the constraints that workplaces in
competitive markets are under, and because a more flexible approach toward
managing employee schedule is considered less valuable, given the circumstances in
which they find themselves.
However, workplaces with a major market share have a higher probability of
introducing flexitime practice. Indeed, the probability of the uptake of flexitime work
arrangements increases by 26 per cent, from 0.309 for the benchmark workplace to
0.392 when it is recalculated using workplaces with a market share of more than 50%
as opposed to workplaces that occupy a small market share (with all other
characteristics staying the same). It would seem that workplaces with a larger market
share recognize the need to adopt more flexible organizational practices, especially if
they are to maintain and control a larger part of the market. This result is consistent
with the predictions of agency models that emphasize greater employee control in
situations in which managers may not be able to write full employment contracts
(Gibbons 1998).
The relationships between flexitime and union recognition and establishment age are
found to be insignificant.
Table 2 about here
Table 2 provides details of the uptake of flexitime work arrangements using
employees-level data. A range of variables for individual human capital, demographic

information, and current features of the employee’s job were included in the
regression. The results show that all three groups of variables are important in
explaining the variation in an individual employee’s opportunity to participate in
work-life schemes.
A general observation is that educated workers are more likely to receive flexitime
work opportunities than their relatively less educated counter-parts. It is argued that
since educated workers are more likely to benefit from organizational change - it
takes more education to cope with the constraints imposed by new productive systems
- there is possibility that they will be more involved in various types of flexibility
schemes. This prediction is fully borne out in our results. The benchmark probability
of the use of flexitime work arrangements increases by 64 per cent when it is
recalculated using postgraduate education as opposed to no education (with all other
characteristics staying the same). It would seem that organizations with established
flexibility schemes are more willing to provide education and training opportunities to
their staff.
Similar findings for white collar workers (i.e. manager/senior administrator,
professional and associate professional) and high-income bracket workers (i.e. from
12480.5 to 35361) suggest that more professional workers and workers at higher
income levels are more likely to embrace new flexibility measures. This might either
be due to the very nature of the work (as top level workers have higher responsibility
thresholds, so they find the need to have more flexible hours) or because new
flexitime trends tie in with their individual preferences for work-life balance.

Finally, temporary workers are, unsurprisingly, less likely to use flexitime work
arrangements. The benchmark probability of flexitime work arrangements use falls by
21 per cent when it is recalculated using temporary workers as opposed to permanent
employees. This is understandable, as, in many instances, flexitime work
arrangements are primarily designed to facilitate the work of permanent employees.
For example, temporary workers are in some instances hired to replace the permanent
employees while they are on special leave.
The relationships between flexitime and ethnic minority, gender and dependent child
are not found to be significant.
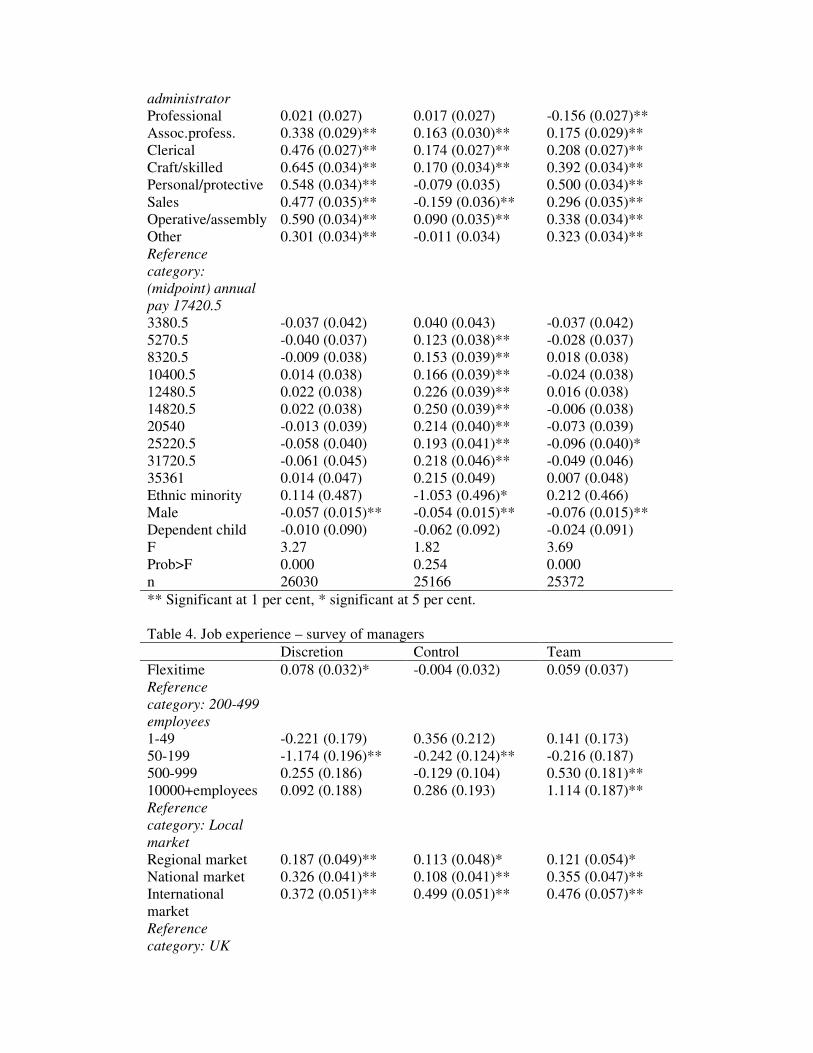
Employee Reports of Stress and Job Security. As demonstrated by Table 3, contrary to
the flexitime case backed by public agencies, employee reports and attitudes toward
stress and job insecurity are significantly more prevalent in flexitime workplaces than
in non-flexitime workplaces. The results show, firstly, that employees within
flexitime workplaces report a high degree of stress. Secondly, they are less likely to
have felt secure in their establishments. Thirdly, they experience a high degree of job
demand in their workplaces. There is a possibility that high stressed establishments
are the ones actually that introduce flexitime practices, but our results should be
interpreted with caution as the present analysis demonstrates at best a correlation
between different practices. No inference about causality can be drawn from these
results.
Table 3 about here

The major thrust of the British government policy on flexitime is based on the
assumption that job ‘insecurity’ is endemic in th e country’s ‘hire and fire’ culture and
that insecure jobs are the ‘unacceptable face’ of inflexible and unprotected labor
markets (DfEE 2000). It is argued that when employees fail to reconcile their
priorities at work and at home, they may eventually suffer stress and bad health. The
organization thus loses their commitment and quality effort and incurs unnecessary
productivity loss, as well as a period of reduced hours of work. Many recent public
initiatives on employment and labor market practices bear the mark of these largely
theoretical arguments.
However, the prediction about the supposed link between flexitime and the work-life
balance does not bear out in our results. The establishments with flexitime
arrangements are likely to have employees who are stressed and feel insecure,
resulting in a state of discontentment and job dissatisfaction. This implies that the
causes of job stress and other worked-related ailments are possibly deeper than the
break down of some individual workplace norm that can be easily put to right by
introducing practices such as flexitime.
The Relationship between Fexitime Work Arrangements and Measures of Job Control.
The analysis of the WERS 98 survey of managers, as reported in Table 4, focuses
upon the relationship between flexitime work arrangements and three measures of job
control, i.e. job discretion, job control and work teams. There is some evidence that
job discretion and work teams are slightly more practised in workplaces with
flexitime work arrangements than in workplaces with no flexitime. This result is
consistent with other research (Batt, Valcour 2003, Wood, de Menezes, Lasaosa 2003,

Berg, Kalleberg, Appelbaum 2003) on commitment and high-performance workplace
environments. However, the relationships found here are not very strong. It would
seem that innovations in organizational practices such as flexitime are part of a larger
program of organizational change and development. For instance, flexitime is used as
a measure to help support the move from traditional hierarchical structures to new
systems of flexible coordinative arrangements in modern organizations. Our findings
could then be explained by examining recent institutional changes in industrial
organization.
Table 4 about here
The critical advantage perceived for the hierarchical organizational systems
associated largely with mass production systems was the principle of ‘economies of
scale’, which permitted a steep decline in unit cost when volume output was increased.
One result of employing such production systems was that jobs were broken down
into small minute tasks so that they could be repeated an infinite number of times by
operational workers with limited skills which could, though, be learned quickly with a
minimum amount of effort. The association between a mass demand market, the
division of tasks into small minute activities, and organizations serving as
mechanisms of control and regulation meant that firms embodied highly repetitive,
predictable behaviors in work toward the goal of obtaining high volume production
with a modest attention to quality (Doeringer and Piore 1971).
Flexible work organizations, or integrated manufacturing systems, on the other hand,
not only recognize the significant role of individual employee skill in the production

process, but also find it useful whether members of a group extend their cooperation
to perform work tasks in a team environment (Marchington 1990). Special attention is
accorded to developing those norms which enhance cooperative efforts, because the
effective implementation of many new productive processes critically depends on
team members’ initiative and feedback. Such an integrative process is, to an extent,
facilitated by the introduction of streamlined organizational systems such as flexitime,
as the practice allows individuals to schedule their own working hours. The WERS 98
survey of managers demonstrates that the introduction and use of flexitime induce
employee control over the jobs they perform; however, because the statistical strength
of the relationship is not very significant it will be difficult to argue that flexitime is a
major driving force behind the large scale changes seen recently in the organizational
design and practice of productive activities.
Conclusions
The policy agenda on ‘work-life balance’ is largely based on the assumption that
changes in the profile of the workforce and in shifting expectations, both of the
business and the employee, are demanding reorganization of working practices to
ensure that the business keeps up with the competition and that employees achieve a
balance between work and life.
The present study has investigated the determinants of flexitime work arrangements
by using a linked employee-employer dataset. The first aim of this investigation was
to determine the extent to which such work-life programs occur in British
establishments, and how this is influenced by a range of establishment and employee

characteristics. In particular, the debate on organisational flexibility has largely taken
place without a consideration of the role of specific employee characteristics, which
may be critical in determining the extent of employees’ participation under a given
scheme.
For instance, there is the possibility that employees are divided into workplaces that
offer better working conditions, are more attractive places of employment and are
associated with greater opportunities for work-life balance, than those that are not. It
has previously been suggested that some labor market segments, such as female and
ethnic employees, experience reduced levels of work-life opportunities (Pe´rotin and
Robinson 2000). The results of this study, however, do not lend support to these
earlier findings.
Consistent with a growing body of evidence, a range of educational, occupation and
work environment variables were found to have a significant role in explaining the
extent to which establishments adopt flexitime practice. A common observation is that
larger, more capital intensive workplaces provide greater opportunities for work-life
balance. In this study, both medium and larger establishment sizes are found to have
positive relationships with flexitime measures. It is possible that small establishments
are unable to offer the incentive to their employees due to high implementation costs.
In contrast, large establishments will be prepared to absorb such costs, especially if
they face a tight labor market. The industry in which the workplace operates has
positive bearing on workplace flexibility. Significant and positive industry effects are
found in relation to financial intermediation, electricity, gas and water supply, health
and social work, hotels and restaurants and wholesale and retail trade and the repair of

motor vehicles sectors, for flexitime schemes. However, this is not the case for several
other sectors, including workplaces in construction and transport and storage and
communication sectors.
It is argued that organizations that do not recognise and address problems of work-life
balance will be at a competitive disadvantage (Bevan et al 1999). At the
organizational level, when work and family goals and priorities collide, realization of
business goals is frequently compromised as employees experience stress and job
dissatisfaction. However, there is no evidence of the establishments with flexitime
arrangements having less stressed employees than non-flexitime establishments.
Further, there is a positive relationship between flexitime arrangements and
demanding work conditions and job insecurity. These findings raise the possibility
that establishments operating flexitime schemes pursue goals that are not fully
explained by a ‘working long hours culture’ thesis. Our results also suggest that
educated and professional workers are more likely to avail themselves of the
opportunity for flexitime working. It may be the case that attracting and retaining
well-qualified workers is probably a goal well served by a flexitime working hours
program.
Literature on flexibility suggests that strategies such as flat hierarchies, restructuring,
horizontal networking and team-building are commonly designed to respond to the
need for change in control- and authority-based systems of organization. Such
changes enhance the ability of employees to perform their tasks more efficiently in an
environment in which technology and skill are ever more important. Further, the
development and effective utilization of multi-level skills require complementary

organizational and human resource management strategies such as employee
participation in return, team operation and employee involvement in shop-floor
decision-making. It is argued that flexitime is one such strategy, which ensures the
effective implementation of decentralized organizational structures through its impact
on the ability of employees to schedule their own working hours. This study only
found a limited support for this supposed relationship.
Taken together, the results reported here on the impact of flexitime on employee
stress and job control do not provide a clearer picture of the precise motives of
workplaces in going about their flexitime programs. While the concept of flexitime
has gained considerable government and management support in recent years,
individual company needs and objectives must be carefully evaluated before flexible
work hours are favored. A better understood managerial practice would improve the
opportunities for the cost effective design and implementation of organizational
development strategies such as flexitime. A case study approach may well be useful in
investigating these important research questions.
References Arnott, J. and K. Emmerson. 2000. “In Sickness and In Health: Reducing Sickness Absence in the Police Service.” Police Research Series Paper 147. London: Home Office. Atkinson, J. and N. Meager, 1986. “Changing Work Patterns: How Companies Achieve Flexibility to Meet New Needs.” Sussex: Institute of Manpower Studies. Bailyn, Lotte. 1993. Breaking the Mold: Women, Men, and Time in the New Corporate World. New York: The Free Press. Batt, Rosemary, and P. Monique Valcour. 2003. “Human Resources Practices as Predictors of Work-Family Outcomes and Employee Turnover.” Industrial Relations 42(2):189-220.

Berg, Peter, Arne L. Kalleberg, and Eileen Appelbaum. 2003. “Balancing Work and Family: The Role of High Commitment Environments.” Industrial Relations 42(2):168-188. Bevan, S., S. Dench, P. Tamkin, and J. Cummings. 1999. “Family Friendly Employment: The Business Case.” DfEE Research Report 136. London: HMSO. Cappelli, P., and D. Neumark. 2001 “Do “High -Performance” Work Practices Improve Establishment-Level Outcomes?” Industrial and Labour Relations Review 54(4): 737-775. Cully Mark et al.1999. Britain at Work : As Depicted by 1998 Workplace Employee Relations Survey. New York: Routledge. DfEE. 2000. “Work -Life Balance 2000 Baseline Survey.” London: Department for Education and Employment. Dex, S., and F. Scheibl. 1999. “Business Performance and Family -Friendly Policies.” Journal of General Management 24(4). Doeringer, P.B., and M.J. Piore. 1971. Internal Labor Markets and Manpower Analysis. Massachusetts: D.C. Heath. Drago, Robert, and Gouglas Hyatt. 2003. “Editors’ Introduction: Symposium: The Effect of Work-Family Policies on Employees and Employers.” Industrial Relations 42(2):139-144. Eaton Susan C. 2003. “If You Can Use Them: Flexibility Policies, Organizational Commitment, and Perceived Performance.” Industrial Relations 42(2):145-167. Galinkksy, Ellen, and Arlene A. Johnson. 1998. Reframing the Business Case for Work-Life Initiatives. New York: Families and Work Institute Gibbons, Robert. 1998. “Incentives in Organizations. Journal of Economic Perspectives. 12: 115-32 Golden, Lonnie, and Figart Deborah M. 2000. Working Time: International Trends and Policy Perspectives. (eds) London/New York: Routledge. Golembiewski, Robert T., Samuel Yeager, and Rick Hilles. 1975. “Factors Analysis of Some Flexitime Effects: Attitudinal and Behavioral Consequences of a Structural Intervention.” Academy of Management Journal 18(3):500 Green, Francis. 1999. “It’s been a Hard Day’s Night; The Concentration and Intensification of Work in late 20th Century Britain” Kent university paper Hewitt Associates. 1996. Flexitime study, cited on Catalystwomen.org at http://www.Catalystwomen.org/press/infobriefs/infoflex.html. Hicks, William D. and Richard J. Klimoski. 1981. “The Impact of Flextime on Employee Attitudes.” Academy of Management Journal 81(24):333

Income Data Services. 1997. “Overtime Study.” IPD January Kandola, R., and J. Fullerton. 1998. Diversity in Action: Managing the Mosaic. 2nd edition. London: Institute of Personnel and Development. Kim, Jay S., and Anthony F. Campagna. 1981. “Effects of Flexitime on Empl oyee Attendance and Performance.” Academy of Management Journal 24(4):729 Marchington, M. 1990. “Analysing the Links between Product Markets and the Management of Employee Relations.” Journal of Management Studies 27( 2):111-32. ONS. 2000. “Labour Force Survey.” Autumn and Spring. London: Office of National Statistics. ONS. 2003. “Labor Market Trends.” London: Office of National Statistics. Pe´rotin, V., and A. Robinson. 2000. “ Employee Participation and Equal Opportunities Practices: Productivity Effect and Potential Complementarities.” British Journal of Industrial Relations 38(4). Perry-Jenkins, Maureen, Rena L. Repetti, and Ann C. Crouter. 2000. “Work and Family in the 1990s”. Journal of Marriage and the Family 62:981-98 Piotet, Francoise. 1988. The Changing Face of Work: Researching and Debating the Issues. Luxembourg : Office for Official Publications of the European Communities Schor, Juliet. 1991. The Overworked American: The Unexpected Decline of Leisure. New York: Basic Books Stone, R., T. Kemp, and G. Weldon. 1994 “Part -time Working and Job Sharing in the Police Service.” Police Research Series Paper 7. London: Home Office. Wood, Stephen J., Lillian M. de Menezes, and Ana Lasaosa. 2003. “Family -Friendly Management in Great Britain: Testing Various Perspectives.” Industrial Relations 42(2):221-250. Table 1. The uptake of flexitime by workplace characteristics Coeff./std error Marginal impact
(% change) Probability of uptake of flexitime
Benchmark workplace: 200-499 employees; manufacturing; local market; UK owned; no competition; less than 5% market share; non-union; operating for more than five years
-
.309

than five years Change in characteristics from benchmark workplace:
Reference category: 200-499 employees
1-49 -102 (0.078) -9 .282 50-199 -0.132 (0.196) -25 .234 500-999 -0.174 (0.186) +14 .354 10000+employees 0.496 (0.186)** +37 .426 Reference category: SIC major group D (manufacturing)
SIC major group E (electricity, gas and water supply)
0.529 (0.077)** +62 .501
SIC major group F (construction)
-0.101 (0.100) -42 .182
SIC major group G (wholesale and retail trade)
0.397 (0.059)** +17 .364
SIC major group H (hotels and restaurants)
0.653 (0.074)** +44 .446
SIC major group I (transport, storage and communication)
0.117 (0.066) -11 .278
SIC major group J (financial intermediation)
0.907 (0.060)** +82 .563
SIC major group K (real estate, renting)
0.422 (0.066)** +11 .346
SIC major group L (public admin., defense, social security)
0.152 (0.129) +2 .318
SIC major group M (education)
0.178 (0.101)* +6 .328
SIC major group N (health and social work)
0.721 (0.103)** +56 .483
SIC major group O (other community, social, personal)
0.328 (0.195)** +11 .343
Reference category: Local market

category: Local market Regional market 0.380 (0.248) +27 .393 National market -0.055 (0.041) -7 .288 International market
-0.032 (0.052) -42 .181
Reference category: UK owned
Predominately UK owned
-0.085 (0.055) -14 .268
50/50 UK and foreign ownership
-0.013 (0.131) -61 .121
Predominately foreign owned and controlled
0.290 (0.177) +6 .329
Foreign owned 0.357 (0.346)** +33 .412 Reference category: No competition
Few competitors -0.155 (0.072)* -8 .287 Many competitors -0.108 (0.074)** -30 .219 Reference category: 1-4% market share
5-10% -0.092 (0.054) -14 .268 11-25% 0.050 (0.051) +6 .329 26-50% 0.142 (0.052) +15 .357 More than 50% 0.351 (0.157) +26 .392 Reference category: non-union
Union recognized 0.294 (0.169) +1 .315 Reference category: operating for more than five years
Operating for less than five years
-0.024 (0.056) -8 .287
F 4.67 Prob>F 0.000 N 27666 ** Significant at 1 per cent, * significant at 5 per cent. Table 2. The uptake of flexitime by employee characteristics Coeff. / std error Marginal impact of
(% change) Probability of uptake of flexitime
Benchmark employee characteristics: 19 years or less; single; no qualifications; permanent; manager/senior administrator;

years or less; single; no qualifications; permanent; manager/senior administrator; 17420.5 annual pay
-
.334
Change in characteristics from benchmark employee:
Reference category: 19 years or less (midpoint)
22 years -0.211 (0.053)** -3 .326 27 years 0.346 (0.152)** +13 .380 35 years 0.327 (0.251)** +7 .357 45 years -0.271 (0.052)** -5 .322 55 years -0.289 (0.054) -9 .304 60 years -0.193 (0.069) -29 .239 Reference category: Single
Widowed -0.003 (0.081) -23 .258 Divorced/separated -0.247 (0.139) -3 .326 Living with partner -0.250 (0.125)* -4 .321 Reference category: No qualifications
O level -0.214 (0.031) -6 .315 A level 0.402 (0.334)** +23 .411 Degree 0.455 (0.336) +43 .478 Postgraduate degree
0.533 (0.346)** +64 .560
Vocational qual. -0.072 (0.018)** -17 .279 Reference category: Permanent
Temporary -0.113 (0.044)** -21 .265 Fixed term 0.561 (0.246) +82 .609 Part time -0.166 (0.025) -47 .179 Reference category: Manager/senior administrator
Professional 0.317 (0.330)** +32 .443 Assoc.profess. 0.374 (0.135)* +36 .457 Clerical 0.476 (0.232) +55 .521 Craft/skilled -0.185 (0.043)** -72 .096 Personal/protective -0.173 (0.042)** -48 .174 Sales -0.182 (0.042) -37 .212

Operative/assembly -0.015 (0.044)** -83 .059 Other -0.172 (0.041)** -71 .100 Reference category: (midpoint) 17420.5 annual pay
3380.5 -0.106 (0.052)* -45 .187 5270.5 -0.182 (0.045) -43 .193 8320.5 -0.088 (0.047) -47 .180 10400.5 -0.105 (0.046)* -40 .203 12480.5 -0.214 (0.047)* -24 .257 14820.5 -0.095 (0.147)* -9 .307 20540 0.364 (0.148) +31 .439 25220.5 0.431 (0.249) +54 .516 31720.5 0.461 (0.256)** +68 .562 35361 0.474 (0.258)** +75 .587 Ethnic minority -0.274 (0.042) -5 .329 Female -0.270 (0.019)** -4 .321 Dependent child -0.137 (0.113) -28 .263 F 4.11 Prob>F 0.000 n 26727 ** Significant at 1 per cent, * significant at 5 per cent. Table 3. Job experience – survey of employees Stress Security Job Demand Flexitime 0.318 (0.115)** -0.037* (0.015) 0.376 (0.179)** Reference category: Single
Widowed 0.049 (0.067) 0.021 (0.069) 0.017 (0.067) Divorced/separated -0.035 (0.031) -0.053 (0.032) -0.041 (0.031) Living with partner -0.063 (0.020)** -0.032 (0.020) -0.088 (0.020)** Reference category: No qualifications
O level 0.006 (0.025) 0.094 (0.025)** 0.022 (0.025) A level 0.021 (0.027) 0.163 (0.028)** 0.029 (0.027) Degree -0.054 (0.029) 0.134 (0.030)** -0.178 (0.029)** Postgraduate degree
-0.042 (0.037) 0.146 (0.038)** -0.142 (0.037)**
Vocational qual. -0.169 (0.402) -0.100 (0.015)** 0.018 (0.015) Reference category: Permanent
Temporary 0.156 (0.036)** 0.754 (0.038)** 0.182 (0.037)** Fixed term 0.082 (0.038)* 0.563 (0.039)** 0.140 (0.039)** Part time -0.069 (0.174) 0.861 (0.179)** 0.175 (0.180) Reference category: Manager/senior administrator
administrator Professional 0.021 (0.027) 0.017 (0.027) -0.156 (0.027)** Assoc.profess. 0.338 (0.029)** 0.163 (0.030)** 0.175 (0.029)** Clerical 0.476 (0.027)** 0.174 (0.027)** 0.208 (0.027)** Craft/skilled 0.645 (0.034)** 0.170 (0.034)** 0.392 (0.034)** Personal/protective 0.548 (0.034)** -0.079 (0.035) 0.500 (0.034)** Sales 0.477 (0.035)** -0.159 (0.036)** 0.296 (0.035)** Operative/assembly 0.590 (0.034)** 0.090 (0.035)** 0.338 (0.034)** Other 0.301 (0.034)** -0.011 (0.034) 0.323 (0.034)** Reference category: (midpoint) annual pay 17420.5
3380.5 -0.037 (0.042) 0.040 (0.043) -0.037 (0.042) 5270.5 -0.040 (0.037) 0.123 (0.038)** -0.028 (0.037) 8320.5 -0.009 (0.038) 0.153 (0.039)** 0.018 (0.038) 10400.5 0.014 (0.038) 0.166 (0.039)** -0.024 (0.038) 12480.5 0.022 (0.038) 0.226 (0.039)** 0.016 (0.038) 14820.5 0.022 (0.038) 0.250 (0.039)** -0.006 (0.038) 20540 -0.013 (0.039) 0.214 (0.040)** -0.073 (0.039) 25220.5 -0.058 (0.040) 0.193 (0.041)** -0.096 (0.040)* 31720.5 -0.061 (0.045) 0.218 (0.046)** -0.049 (0.046) 35361 0.014 (0.047) 0.215 (0.049) 0.007 (0.048) Ethnic minority 0.114 (0.487) -1.053 (0.496)* 0.212 (0.466) Male -0.057 (0.015)** -0.054 (0.015)** -0.076 (0.015)** Dependent child -0.010 (0.090) -0.062 (0.092) -0.024 (0.091) F 3.27 1.82 3.69 Prob>F 0.000 0.254 0.000 n 26030 25166 25372 ** Significant at 1 per cent, * significant at 5 per cent. Table 4. Job experience – survey of managers Discretion Control Team Flexitime 0.078 (0.032)* -0.004 (0.032) 0.059 (0.037) Reference category: 200-499 employees
1-49 -0.221 (0.179) 0.356 (0.212) 0.141 (0.173) 50-199 -1.174 (0.196)** -0.242 (0.124)** -0.216 (0.187) 500-999 0.255 (0.186) -0.129 (0.104) 0.530 (0.181)** 10000+employees 0.092 (0.188) 0.286 (0.193) 1.114 (0.187)** Reference category: Local market
Regional market 0.187 (0.049)** 0.113 (0.048)* 0.121 (0.054)* National market 0.326 (0.041)** 0.108 (0.041)** 0.355 (0.047)** International market
0.372 (0.051)** 0.499 (0.051)** 0.476 (0.057)**
Reference category: UK owned

owned Predominately UK owned
0.302 (0.055)** 0.100 (0.053) 0.372 (0.064)**
50/50 UK and foreign ownership
0.247 (0.119)* 0.048 (0.120) -0.331 (0.124)**
Predominately foreign owned
-0.229 (0.075)** -0.751 (0.076)** -0.504 (0.075)**
Foreign owned and controlled
0.172 (0.047)** -0.208 (0.045)** 0.095 (0.053)
Reference category: No competitors
Few competitors -0.253 (0.076)** -0.291 (0.075)** 0.178 (0.086)* Many competitors -0.181 (0.078)* -0.519 (0.076)** 0.286 (0.087)** Reference category:
5-10% 0.297 (0.053) -0.003 (0.053) 0.271 (0.057)** 11-25% 0.240 (0.051)** -0.041 (0.050) 0.437 (0.055)** 26-50% 0.304 (0.052)** -0.138 (0.051)** 0.513 (0.055)** More than 50% 0.225 (0.056)** 0.066 (0.055) 0.393 (0.059)** Reference category: Non-union
Union -0.182 (0.038)** -0.016 (0.037) -0.124 (0.041)** Reference category: Operating for more than five years
Operating for less than five years
0.056 (0.057) -0.007 (0.001) 0.567 (0.073)
F 4.11 2.56 3.89 Prob>F 0.243 0.000 0.000 n 27525 27555 27557 ** Significant at 1 per cent, * significant at 5 per cent.