the incidence of georgia’s electric vehicle credit 7may2021
TRANSCRIPT

1
The Incidence of Georgia’s Electric Vehicle Credit
Peter Bluestone Center for State and Local Finance
Robert Buschman Fiscal Research Center [email protected]
Laura Wheeler
Center for State and Local Finance [email protected]
Andrew Young School of Policy Studies Georgia State University
May 7, 2021
ALL RESULTS ARE PRELIMINARY – DO NOT CITE WITHOUT AUTHORS’ PERMISSION
Abstract: This research analyzes the effect of the elimination of the credit on the mix of vehicles purchased and the price paid for the subsidized vehicles. Standard economic theory suggests that the gross price of the subsidized vehicles will be higher during the subsidy period relative to the no-subsidy period as the net-of-subsidy price increases the quantity demanded and as suppliers capture a portion of the tax credit through higher prices compared to the unsubsidized equilibrium price. We test this hypothesis by considering the change in prices for the Nissan Leaf and Tesla models before and after the credit expiration. The existing literature finds mixed results for various incentive programs for alternative fuel vehicles with some research finding increased prices as a result of the subsidy and others finding no effect. Our results indicate the presence of an effect in the mix of vehicles purchased before and after the credit expiration. Our preliminary results find an increase in price after the credit expiration as far fewer vehicles are sold but for a higher average price.
Key Words: Electric vehicle, tax credit, tax incidence
JEL Codes: H22, H71, D12

2
Introduction
This research analyzes the incidence of the Georgia Electric Vehicle Tax Credit. Standard economic theory suggests that the gross price of the subsidized vehicles will be higher during the subsidy period relative to the nonsubsidized period as the net-of-subsidy price increases the quantity demanded and as suppliers capture a portion of the tax credit through higher prices compared to the unsubsidized equilibrium price. We test this hypothesis directly by considering the change in prices for the Nissan Leaf and Tesla models, then the largest-selling car models eligible for the credit, before and after the credit expiration on June 30, 2015.
Before proceeding further, it is helpful to clarify the vehicle types referred to in this analysis. For the purposes of this research, we use the term EV to refer to the category of vehicles that include hybrid electric vehicles (HEV), plug-in hybrid electric vehicles (PHEV), and battery only electric vehicles (BEV). HEVs include such models as the traditional Toyota Prius. Although HEVs have a small battery, these vehicles are completely reliant on motor fuel for propulsion. Currently a smaller part of the market, PHEVs operate over some range using electricity as the propulsion fuel but then have an ability to operate using an internal combustion engine once the battery power is exhausted. An example of this vehicle during our study period is the Chevrolet Volt. Lastly, BEVs run solely on battery power and include such vehicles as the Nissan Leaf and Tesla models. In our study environment, only BEVs qualified for the state tax credit.
Our work contributes to the existing literature in several ways. First, our data provides daily transaction-specific information on the price of vehicles purchased before and after the credit elimination, allowing us to measure the possible effects of the credit on price. Second, sales of treated vehicles following the months after the elimination of the credit declined dramatically. This clear change in consumer behavior illustrates the power of the credit on BEV demand and suggests that there may be other secondary pricing effects by dealers.
Our initial findings show no direct evidence that dealers were charging higher prices while the credit was in place, capturing part of it. Instead, we find the prices after the credit expired rose on the Leaf and Tesla vehicles. We attribute this change in prices to a change in the mix of vehicles purchased. It appears that while the credit was in place, consumers preferred lower cost models of eligible vehicles. After the credit expired, those consumers still in the market preferred costlier models or trim packages.
The paper proceeds as follows. Section 1 provides a description of the state and federal tax credit programs. Section 2 discusses the electric vehicle market in Georgia before and immediately after the state credit was eliminated, while section 3 provides a review of the existing literature on the effect of subsidies on prices and the effect of electric vehicle subsidies in the adoption of these vehicles. Section 4 provides a discussion of our dataset and relevant variables. Section 5 discusses the potential impact of leasing on the incidence of the credit. Section 6 discusses the empirical model and estimation strategy. Sections 7 and 8 present our results and conclusions.

3
Section 1. Georgia Tax Credit
Prior to July 1, 2015, Georgia allowed a generous tax credit for the purchase or lease of new BEVs. This credit was originally adopted by the state in 2001, three years before Tesla began development of its first model, the Tesla Roadster, and nine years before the introduction of the Nissan Leaf.1 Under the credit, individuals were allowed a $5,000 credit against their income tax liability for the purchase or lease of a qualifying vehicle. Relative to other states in the country, only Colorado offered a higher incentive, at $6,000, during this time period.
To claim the credit, vehicles must be certified as qualified by the Georgia Department of Natural Resource. All qualifying vehicles had to be powered solely via alternative fuel such as electricity. Most qualifying vehicles during our study period were either Nissan Leaf or Tesla models, but other eligible models included the BMW i3, Chevrolet Spark EV, Kia EV Soul and others.
To qualify for the credit, individuals had to take possession of the vehicle on or before June 30, 2015. Based on our conversations with dealers involved in these transactions over this time period, dealers were able to sell all vehicles scheduled to be delivered to their dealerships prior to the elimination of the credit. As part of a state transportation funding reform package enacted in 2015, this credit was eliminated for new vehicles purchased on or after July 1, 2015.
In addition to the Georgia credit, there existed a federal income tax credit of up to $7,500 which applied to many of the vehicles which also qualified for the Georgia credit. The most significant difference between the state and federal credit aside from their values is that the federal credit did not apply in the case of a leased vehicle. Based on conversations with dealers in the Atlanta area and on press reports, most transactions involving the Leaf were in the form of leases. During the period of our study Tesla offered a three-year payment plan with a guaranteed buy-back price. This arrangement operated much like a lease but for the purposes of the credit was classified as a sale. Thus, individuals involved in the Tesla transactions could claim both the federal and state tax credits. The combination of the two credits resulted in a price subsidy of $12,500. In the case of Leaf lease transactions, the dealer would claim the $7,500 federal credit and the individuals would claim the $5,000 state credit. Neither the federal or the state credit was refundable but unused credits could be carried forward and used against future tax liabilities.
Lastly during this period, Nissan was also providing incentives designed to stimulate sales in order to make room for the 2016 models which were scheduled for release in the fall of 2015. For instance, during April 2015 Nissan offered a $3,500 cash back deal which further reduced the price. In addition, Tesla was also under pressure to sell existing Model S and Xs before the
1 Georgia enacted a smaller credit on low-emission alternative-fuel vehicles in 1998 (HB 1161) and added a $5,000 zero-emission vehicles (ZEV) credit in 2001 (HB 261). At the time, a limited number of ZEV models were available and were sold largely in California in response to state Air Resources Board mandates.

4
Model 3s came into the market. Thus, both manufacturers were also offering incentives or at least under pressure to encourage sales during this time period.
Section 2. EVs in Georgia
Figure 1 illustrates the volume of sales of electric vehicles nationwide from 2013 through 2016 by quarter. Over this period, total vehicle sales of all types (electric and internal combustion) in the US grew at an average rate of 3.8 percent annually. During this same period, sales of EVs declined on average 4.9 percent per year. The negative growth occurred specifically as a result of a decline in the sales of hybrid vehicles. The reason for this dip is not entirely understood but may be related to the general shift by American consumers away from more fuel-efficient sedans and toward more SUVs and trucks.
Although still dominated by sales of hybrid vehicles, there has been a significant shift between the types of EVs purchased, as seen in Figure 1. In 2013, HEVs represented 84 percent of all EVs. By 2016, this share had declined to 70 percent. Conversely, in 2013 BEVs represented 8 percent of all EVs nationwide. By 2016, this share had risen to 15 percent.
Figure 1. US Annual Sales of EVs by type, 2013 – 2016
Source: Auto Alliance: U.S. Light-Duty ATV Sales.
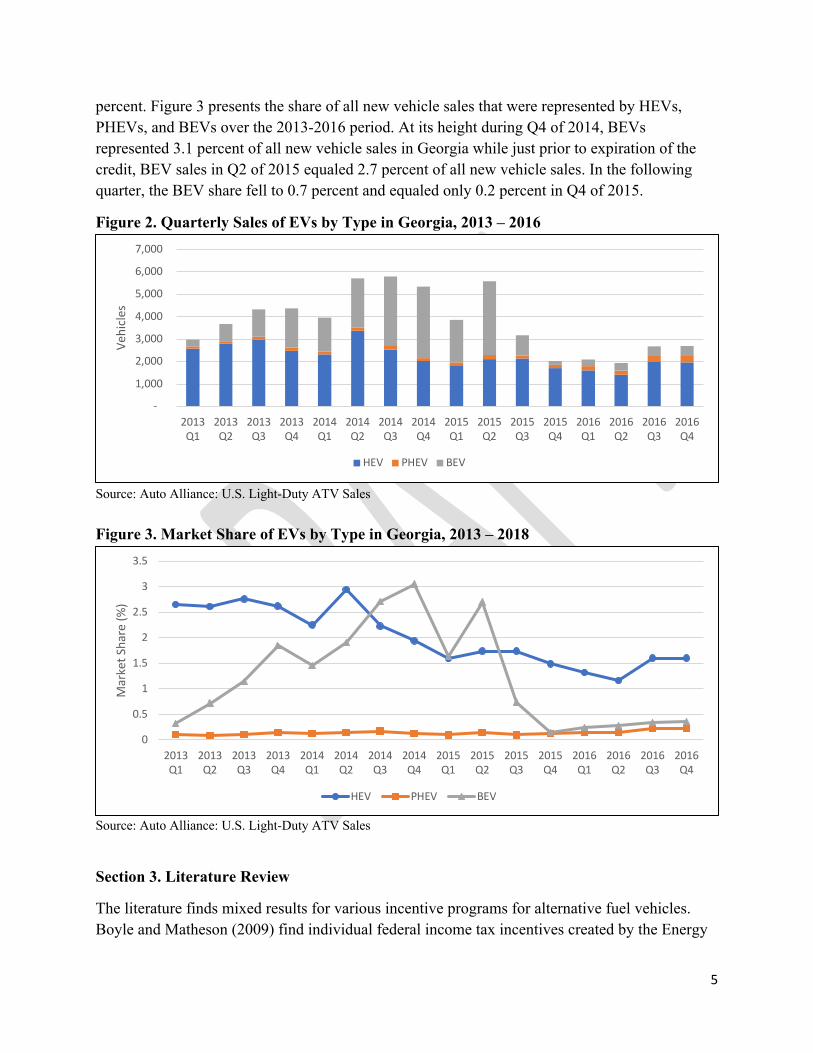
Figure 2 presents the quarterly sales figures for all types of EVs in Georgia during the 2013-2016 period, over which sales declined an average of 10 percent per year. However, this period is marked by two distinct trends. Over the 2013 Q1-2015 Q2 period, average growth in EV sales equaled about 7.2 percent per quarter, but for the Q2 2015-Q4 2016 period, averaged -11.5 percent per quarter. Although national market conditions were in flux during this period, this precipitous change in consumption coincides with the elimination of the state tax credit for BEVs. In share terms, for Q3 of 2014, HEVs comprised 44 percent of all EV sales in the state while BEVs made up 53 percent. By Q3 of 2016, HEVs made up 74 percent and BEVs 16
-
20,000
40,000
60,000
80,000
100,000
120,000
140,000
160,000
180,000
2013Q1
2013Q2
2013Q3
2013Q4
2014Q1
2014Q2
2014Q3
2014Q4
2015Q1
2015Q2
2015Q3
2015Q4
2016Q1
2016Q2
2016Q3
2016Q4
Vehi
cles
HEV PHEV BEV
5
percent. Figure 3 presents the share of all new vehicle sales that were represented by HEVs, PHEVs, and BEVs over the 2013-2016 period. At its height during Q4 of 2014, BEVs represented 3.1 percent of all new vehicle sales in Georgia while just prior to expiration of the credit, BEV sales in Q2 of 2015 equaled 2.7 percent of all new vehicle sales. In the following quarter, the BEV share fell to 0.7 percent and equaled only 0.2 percent in Q4 of 2015.
Figure 2. Quarterly Sales of EVs by Type in Georgia, 2013 – 2016
Source: Auto Alliance: U.S. Light-Duty ATV Sales Figure 3. Market Share of EVs by Type in Georgia, 2013 – 2018
Source: Auto Alliance: U.S. Light-Duty ATV Sales
Section 3. Literature Review
The literature finds mixed results for various incentive programs for alternative fuel vehicles. Boyle and Matheson (2009) find individual federal income tax incentives created by the Energy
-
1,000
2,000
3,000
4,000
5,000
6,000
7,000
2013Q1
2013Q2
2013Q3
2013Q4
2014Q1
2014Q2
2014Q3
2014Q4
2015Q1
2015Q2
2015Q3
2015Q4
2016Q1
2016Q2
2016Q3
2016Q4
Vehi
cles
HEV PHEV BEV
0
0.5
1
1.5
2
2.5
3
3.5
2013Q1
2013Q2
2013Q3
2013Q4
2014Q1
2014Q2
2014Q3
2014Q4
2015Q1
2015Q2
2015Q3
2015Q4
2016Q1
2016Q2
2016Q3
2016Q4
Mar
ket S
hare
(%)
HEV PHEV BEV

6
Policy Act of 2005 did have an impact on the price of most hybrid vehicles sold in the US, increasing prices by $0.75 on average for every additional dollar of credit. However, Sallee (2011), examining the same federal energy policy act, finds the income tax incentives had no effect on dealer prices in the US on one specific hybrid, the popular Toyota Prius.
Studying incentives for hybrid electric vehicles in Canada, Gulati et al. (2017) find that for every $1,000 of sales tax rebate available to consumers, the final vehicle price rose by $570. The authors show, however, that approximately 80 percent of this increase reflects an endogenous behavioral response of consumers to the subsidy, purchasing vehicles with additional features or options that raise the price of the subsidized vehicles.
These researchers studied the effect of incentives offered directly to consumers in the form of income tax credits or sales tax rebates. Other research has shown that consumers capture less of the value of incentives when they are offered as dealer incentives rather than as consumer rebates (Busse et al. 2006), but because the Georgia credit is taken by the consumer when they file their taxes, it is more akin to a rebate, suggesting greater subsidy incidence on the consumer.
Research into similar public subsidies for other large household purchases also offers relevant insights, particularly that into residential solar power subsidies. Three recent papers investigated subsidy pass-through using system characteristics and transaction prices for residential solar systems eligible for rebate payments under the California Solar Initiative (CSI). Like automobiles, these systems can be purchased by homeowners (host-owned or HO) or owned by a third-party (TPO). In addition to conventional leasing, TPO includes arrangements where the homeowner enters a power purchase agreement with the system owner. In both cases, the owner of the system – homeowner or third party – receives the rebate payment. The papers exploit variation in rebates over time and across operating districts of utilities for identification.
Dong, Wiser, and Rai (2018) took two modeling approaches – a structural model estimating supply and demand relations, and a conduct or market-power parameter; and a reduced-form regression of net system price on the amount of rebate, system characteristics, installer and market characteristics, and other controls – to estimate the subsidy pass-through. Both models produced similar results of near 100 percent pass-through, varying across counties in the structural model between 92 and 103 percent (mean 99 percent), and in the reduced form model between 86 and 103 percent (mean 95 percent). They did not, however, estimate whether pass-through differed between HO and TPO transactions. The possibility of different pass-through rates for HO and TPO is relevant to evaluating the effectiveness of the incentive in subsidizing the desired consumer choice.
Pless and van Benthem (2019) used a similar reduced-form model, but also included an indicator for TPO transactions interacted with the rebate variable to pick up any difference in pass-through rates for those transactions and adjusted the rebate values downward to account for interaction between the CSI rebate and federal depreciation allowances. The authors found a somewhat lower pass-through rate for HO transactions than Dong et al. at about 78 percent, but over-

7
shifting of the subsidy to consumers in the case of TPO transactions, estimating pass-through at 153 percent.
Finally, Li (2018) used a similar reduced-form model, but focused only on TPO transactions. Included controls were similar, except that Li included parameters for certain contract terms – downpayments, escalations, and duration – that were obscured by the calculation of price as the net present value of all payments. Li found the opposite result of Pless and van Benthem, estimating a 62 percent pass-through rate or significant under-shifting of the subsidy for TPO transactions, the difference apparently due largely to the lack of adjustment in the rebate value for federal tax interactions.
Section 4. Data
For our analysis, we make use of two datasets. The first is transaction-level data on motor vehicle sales from the Georgia Department of Revenue (DOR). The second is from the information services firm IHS Markit (IHS). The DOR dataset includes new and used vehicle sales of non-traditional-fuel vehicles, including vehicles classified as hybrid electric, flexible fuel vehicles, battery electric vehicles, plug-in electric vehicles, and natural gas or propane vehicles. Each observation includes year and make of vehicle, sale date, county of registration, title ad valorem tax paid, trade-in value (if any), fuel type, and other information. Precise model information is inconsistently reported in the DOR data, however, limiting our ability to control for possible changes in the mix of models sold after expiration of the tax credit.
We use the IHS dataset to supplement the shortcomings in the DOR dataset. The IHS dataset provides precise model information for most vehicle makes, along with the manufacturer’s suggested retail price (MSRP), county and month of registration, and other information. Unfortunately the Nissan vehicle identification numbers (VINs) during our time period of interest were not encoded to provide specific model information. While we can distinguish a Leaf from an Altima transaction in our data, we are unable to determine if the Leaf in question is a low-end or high-end model. The information available for the Tesla and Lexus analysis does not suffer from this same issue as the VINs for these vehicles contain more specific model-level information.
To merge the two datasets, we examined the DOR sales dates and counties and compared them to the IHS data for registration month and county. For the Lexus, the data matched up fairly well with only minor discrepancies. In addition, the DOR data for the Lexus sales had accurate model number information that could be matched to the IHS data in cases in which the date from the DOR county data did not match up with the IHS registration month.
The Tesla data was harder to merge for several reasons. First, the DOR data did not have useable model information. Second, there were more discrepancies between the county level DOR sale date and the IHS registration month. These discrepancies are likely due to the lag in vehicle registration date which IHS uses compared to the sales date recorded by DOR. This is apparent

8
when the data for June and July are examined, two critical months as the credit expired at the end of June. For instance, the DOR data had 186 sales occurring in June, while IHS listed only 123. But in July, DOR lists only 8 sales while IHS lists 84. The total sales for June and July are a closer match with 194 for DOR and 207 for IHS. Researcher judgment was used to match the DOR county level sale prices to IHS county level MSRP data. Note for the both the Lexus and Tesla data, the DOR data was the controlling data set as it contained price data and is believed more reliable as it is a state record and closer the original data generating process, a dealer sale.
The resulting merged dataset covers a total of 493 sales of new credit-eligible and ineligible vehicles occurring within the second and third quarters of 2015, the three months immediately before and after expiration of Georgia’s tax credit.
With regard to vehicle sale prices, while the DOR dataset provides the fair market value of the vehicle as reported by the dealer, this may not represent the actual sale price, especially in the case of a lease, so we instead impute the sale price from the value of the motor vehicle tax paid on each transaction, also known as the Title Ad Valorem Tax (TAVT).2 The TAVT is levied on the higher of the sale price and a book value, determined by DOR according to state law, that is the average of the average wholesale and average retail prices of the vehicle make and model in the given year, less the value of any trade-in. For new vehicles, where no material differences in mileage or condition exist to cause sale prices of some vehicles to fall below this book value, we presume the imputed price consistently represents the actual retail sale price. Specifically, we compute the price variable, Price2, as the taxable value implied by the TAVT amount plus the value of any trade-in vehicle. Our dataset is augmented by the addition of a control variable to denote registrations occurring in the Atlanta metro area.3 This variable has a value of one for vehicles registered in the 10 metro counties surrounding Atlanta and zero otherwise.
Table 1 provides the summary statistics for our analysis using the DOR data set which includes all new 2015 Leaf, Prius, Tesla and Lexus EV models sold over the 2nd and 3rd quarters of 2015. Table 2 provides a breakdown of the number of observations of each treated vehicle model in quarter 2 (prior to credit elimination) and quarter 3 (after credit elimination). Table 3 provides a similar breakdown of the data for the Tesla and Lexus from the merged DOR-IHS dataset.
2 During our study period, the TAVT for leased vehicles was based on the full retail price of the vehicle and not truncated by the leasing period. 3 Although we are interested in the location of the sale, we do not have this data. On the other hand, in the case of the Leaf due to the limited range of the vehicle the sale likely took place close to the location of registration.

9
Table 1. DOR dataset - Summary statistics Variable Obs Mean Std. Dev. Min Max
Fair market value 5,382 $27,733.08 $18,769.45 0 $141,645 Leaf dummy 5,382 0.5823114 0.4932241 0 1 Tesla dummy 5,382 0.0626161 0.2422937 0 1 Prius dummy 5,382 0.3264586 0.4689608 0 1 Lexus dummy 5,382 0.0286139 0.1667342 0 1 Federal credit 5,382 $4,836.957 $3,589.348 0 $7,500 State credit 5,382 $3,094.575 $2,428.493 0 $,5000
Price2 5,382 $26,999.79 $19,586.3 3,888.429 14,1645 Metro county dummy 5,382 0.5769231 0.4940933 0 1
Table 2. DOR dataset - Statistics before and after state credit elimination
Variable State credit=$5,000 State credit=$0
Obs Mean Price2 Obs Price2 Leaf 3,058 $19,986.94 76 $22,594.67 Tesla 273 $96,145.31 64 $101,651.9 Prius 813 $24,268.75 944 $24,190.38 Lexus 71 $47,133.35 83 $45,897.91
Table 3. Merged DOR-IHS data – Statistics before and after state credit elimination Variable State Credit = $5,000 State Credit = $0 Obs Mean Price Mean
MSRP Obs Mean Price Mean
MSRP Tesla 275 $96,466 $83,031 64 $101,652 $84,217 Lexus 71 $45,116 $42,428 83 $43,136 $42,044
Section 5. Impact of Leasing
A key characteristic of these transactions is that most were in the form of leases. Although our data does not identify leased vehicles, news reports and anecdotal evidence from dealers indicate that a large majority of these vehicles were leased, especially in the case of the Nissan Leaf, even though the option to purchase did exist for both vehicles. For instance, one news report put the percentage between 75 and 80 percent of EVs, excluding Tesla.4 An analysis by Bloomberg New Energy Finance finds that 80 percent of EVs are leased, but the percentage depends on the vehicle. The study finds that 96 percent of the BMW i3 are leased, but 65 percent of Chevrolet
4 “Why 75% of electric-car buyers don’t buy electric cars”, Michael Sheetz, published 10/17/2015 CNBC - https://www.cnbc.com/2015/10/17/ric-cars.html

10
Bolts are purchased.5 The Bloomberg data indicate that the leasing rate for the Nissan Leaf was between 70 and 85 percent nationwide from late 2014 to mid-2015 period, though by early 2017, the leased share was fluctuating between 20 and 50 percent.6 Across all vehicles, the leasing rate is about 30 percent.
Data on Tesla’s leasing rate is less clear as its cars are sold only through Tesla owned dealerships and it does not report sale vs. lease unit volumes. There is survey evidence from 2013-2014 that estimated that 95 percent of all Teslas were purchased, compared to 14 percent for Leaf’s.7
In Georgia, the largest daily newspaper, the Atlanta Journal Constitution, routinely advertised leasing deals for the Nissan Leaf during the time the state credit was in effect and a 2013 article in the Wall Street Journal documents the two-year lease deal commonly offered in the state, with out-of-pocket expenses for a two-year lease totaling about $2,000 after federal and state credits.8
There are several reasons for the high share of lease transactions in this market. First, the uncertainty surrounding the battery life caused consumers to by wary of the life span of these vehicles. A lease reduces the risk to the consumer if the batteries have a shorter usable life than expected. Second, the general assumption is that the EV technology will continue to evolve. Thus, consumers may be less willing to lock themselves into a current level of technology by purchasing a vehicle. For instance, for both the Tesla and Leaf models, the 2016-2017 model years brought significant improvements in vehicle range. Third, EVs tend to be more expensive relative to their conventionally powered competitors, making leasing a more attractive option for monthly payment sensitive consumers.
Section 6. Model Specification and Estimation
To estimate the effect of the subsidy on prices, we employ a standard difference-in-difference model, expressed in Eq. 1.
𝑃𝑟𝑖𝑐𝑒 = 𝛽!𝐶𝑟𝑒𝑑𝑖𝑡 +𝛽"𝐵𝐸𝑉 + 𝛿𝐷𝑖𝐷 + 𝛾𝑀𝑒𝑡𝑟𝑜 + 𝜃𝐷𝑖𝐷 ∗ 𝑀𝑒𝑡𝑟𝑜 + 𝜀 (Eq.1)
where Credit is a dummy variable with a value of 1 prior to the elimination of the credit effective July 1, 2015, and a value of 0 for transactions after expiration. BEV is a dummy variable with a
5 “New electric cars: Love it or lease it?”, Kyle Hyatt, published January 3, 2018 Road Show - https://www.cnet.com/roadshow/news/new-electric-cars-love-it-or-lease-it/ 6 “Why early EV adopters prefer leasing – by far”, Kyle Stock, published January 3, 2018 Automotive News - https://www.autonews.com/article/20180103/OEM05/180109952/why-early-ev-adopters-prefer-leasing-by-far 7 National Research Council 2015. Overcoming Barriers to Deployment of Plug-in Electric Vehicles. Washington, DC: The National Academies Press. https://doi.org/10.17226/21725. Citing, Strategic Vision New Vehicle Experience Study of Vehicle Registrants, October 2013-June 2014. 8 “To Spark Buyers for Electric Cars, Drop the Price to Nearly $0”, Joseph P. White, published May 22, 2013 Wall Street Journal - https://www.wsj.com/articles/SB10001424127887323982704578453123010639156

11
value of 1 for BEV vehicles in all periods, i.e. those vehicles that would have been eligible for the credit while it was available.
The 𝐷𝑖𝐷 variable is the interaction of the Credit dummy and the BEV dummy variable and is our variable of interest. The coefficient δ can be interpreted as the effect of the change in the credit policy on the price of BEVs relative to the ineligible control cars.
The price of cars can vary seasonally as well. To limit the impacts of seasonal variation, we choose a limited time period of three months before and after the credit expired, that is April-June and July-September of 2015. To allow for possibly greater competition in the Atlanta metro area due to a greater concentration of dealerships or regional price differences for other reasons, we include a dummy variable, Metro, indicating the location of vehicle registration within that area.9 The coefficient θ can be interpreted as the differential effect of the change in the credit policy on the price of BEVs in the metro area relative to those in the non-metro areas. We run this model in levels to estimate the impact that the credit expiration had in the price of the vehicle.
To estimate our model, we rely on two different manufactures of electric vehicles as was previously discussed, the 2015 Nissan Leaf and the Tesla Model S. We use the Toyota Prius as the control observations for the model specification that includes the Leaf and for the Tesla, we use the group of Lexus luxury hybrid vehicles available in 2015. In both cases, the controls are vehicles expected to appeal to similar consumers and their inclusion also helps to control for unobserved factors affecting market demand during the period, including seasonal effects approaching the end of the model year.
A necessary condition for the validity of a difference-in-difference model is the absence of pretreatment trends for the treated and control observations. Figures 4 and 5 present graphs of the average weekly price of the treatment and control vehicles in the weeks of our study period. For both the Leaf/Prius and Tesla/Lexus combinations we see no evidence of pretreatment trends prior to the elimination of the credit. In addition, we see no effect of the elimination of the credit on the price of the control vehicles, supporting our argument that these vehicles are appropriate controls for the treated group.
9 Although we are really interested in the location of sale, the registration of sale is a good proxy for this. This is especially true in the case of the Leaf due to its limited range.

12
Figure 4. Trends in Average Prices for Leaf and Prius
Figure 5. Trends in Average Price for Tesla and Lexus
As was discussed in the earlier literature review section, a tax credit can affect the price of a car in several ways. One mechanism would be through behavior by the car dealer to try to capture some of the credit by raising prices while the credit was in effect. Another mechanism would be changes in the mix of vehicles purchased which would be reflected in the trim levels and options chosen by consumers. For the first mechanism, we would expect the DID coefficient to be zero or near zero if the consumer is capturing the full value of the credit and positive if the dealers are capturing a portion. Alternatively, a negative value could suggest over-shifting of the incentive to consumers, which Pless and van Benthem (2019) showed can occur in an imperfectly competitive market with sufficiently convex demand.
$0
$5,000
$10,000
$15,000
$20,000
$25,000
$30,000
1 2 3 4 5 6 7 8 9 10 11 12 13 14 15 16 17 18 19 20 21 22 23 24 25 26
Wee
kly
Aver
age
Pric
e
Week of Study Period
Weekly Average Price - Leaf & Prius
Leaf Prius
Credit period - April 1-June 30 Post-credit period - July 1-Sept 30
$0
$20,000
$40,000
$60,000
$80,000
$100,000
$120,000
$140,000
1 2 3 4 5 6 7 8 9 10 11 12 13 14 15 16 17 18 19 20 21 22 23 24 25 26
Wee
kly
Aver
age
Pric
e
Week of Study Period
Weekly Average Price - Tesla & Lexus
Tesla Lexus
Credit period - April 1-June 30 Post-credit period - July 1-Sept 30

13
For the second mechanism, consumers may choose to purchase a different trim package or vehicle options when the credit is available than without the credit. Or to put it another way, the credit may attract new consumers for lower-priced models/trims who are not in the market absent the credit. If the mix changes to higher-priced vehicles after the credit expires, the DID coefficient would be negative, as the average vehicle price is lower during the credit period. It is possible for these effects to work in combination. For instance, if the DID coefficient is negative, it is still possible that dealers captured part of the credit (or at least did not over-shift), but the negative impact of the mix effect of consumers purchasing lower-priced vehicles during the credit period dominated. This combined effect points to the need to control for possible mix effects before and after the credit. While this ability was greatly limited with the DOR dataset, the merged dataset of DOR and IHS data allows us improve our controls using the vehicles’ MSRP variable (MSRP-IHS) as a proxy for more specific model information.
Section 7. Model Results
The Nissan Leaf was the highest selling credit-eligible vehicle sold in the state during our study period. Much of the policy discussion and news relating to the credit focused specifically on that vehicle. Thus, as a first pass, we estimate the basic DID model represented by Equation 1 (with and without the Metro terms) using the DOR data. We then proceed to the merged Tesla/Lexus dataset, including MSRP-IHS to control for model mix effects.
Results for Leaf and Prius
We run three models, the first just uses the variables of interest and the DID term. The second includes the dummy variable for Metro Atlanta purchase and the third interacts the Metro Atlanta dummy with the DID term to see if there is a differential effect after the credit expires for cars purchased in the Metro Atlanta region. The results shown in Table 3 for models 1 and 2 are very similar so we will discuss only models 2 and 3 here (see table results). In Leaf-Prius model 2, the DID coefficient estimate is $2,658, significant at the 1 percent level. The metro coefficient is -$388 and also statistically significant, suggesting that both Leaf and Prius models purchased in the Metro area were $388 lower-priced than those purchased outside the metro area. In Model 3, the Metro dummy is interacted with the DID term to estimate any difference in the DID term for those cars purchased in the Metro area. The coefficient on the primary DID term is somewhat smaller than in Model 2 at $3,075.The interaction term is positive, and statistically significant, suggesting metro transactions before the credit were almost $700 higher than nonmetro transactions after the credit expired.

14
Table 3. Difference in Difference – Leaf & Prius (1) (2) (3) VARIABLES Model 1 Model 2 Model 3 1.Leaf -1,596*** -1,537*** -1,473*** (471.2) (471.1) (471.2) 1.credit 78.36 71.08 63.16 (189.1) (188.9) (188.8) 1.did -2,686*** -2,658*** -3,075*** (496.3) (495.9) (515.9) 1.metro -387.6*** -809.2*** (116.5) (186.1) 1.did_metro 692.8*** (238.5) Constant 24,190*** 24,361*** 24,547*** (128.6) (138.4) (152.3) Observations 4,891 4,891 4,891 R-squared 0.209 0.211 0.212
Standard errors in parentheses *** p<0.01, ** p<0.05, * p<0.1
The large positive coefficients on the DID terms suggest that there may be a large mix effect occurring post credit. This is supported by the analysis of model/trim mix for the Leaf shown in Table 4A. The average price of a Leaf increases by 9 percent post credit and there is evidence of a greater share of the higher priced vehicles and a decline in the share of the lowest-priced model. Also, the number of vehicle transactions drops dramatically post credit from 3,058 to 76. Note there is no large change in either mix or average price for the Prius as shown in Table 4B and unit sales increased.
Table 4A. Change in price for Leaf before and after credit expiration Nissan Leaf April-June 2015 with credit July-Sept post credit Leaf (Price includes $7,500 fed credit kept by dealers) Count Share Count Share Model S ($31K and less) 2,578 84% 50 66% Model SV ($32K-$34K) 238 8% 8 11% Model SL ($35K and greater) 242 8% 18 24% Total 3,058 76 Average price $27,487 $30,095 Price change post credit 9%
15
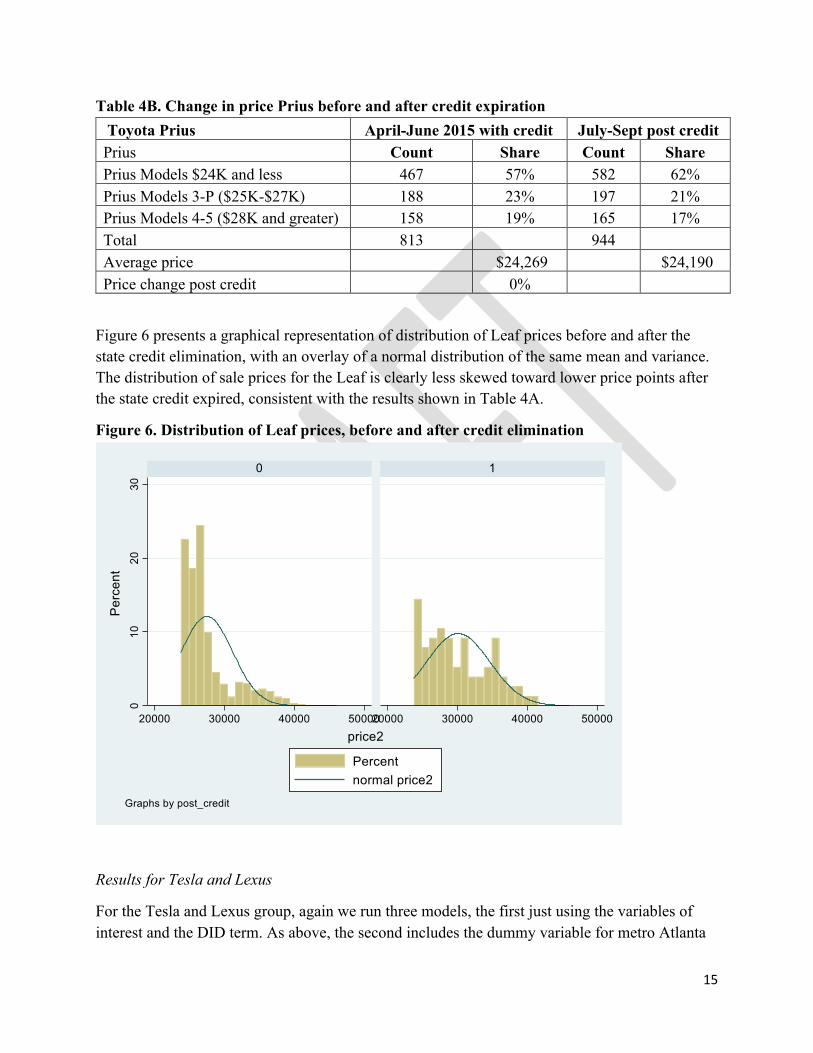
Table 4B. Change in price Prius before and after credit expiration Toyota Prius April-June 2015 with credit July-Sept post credit Prius Count Share Count Share Prius Models $24K and less 467 57% 582 62% Prius Models 3-P ($25K-$27K) 188 23% 197 21% Prius Models 4-5 ($28K and greater) 158 19% 165 17% Total 813 944 Average price $24,269 $24,190 Price change post credit 0%
Figure 6 presents a graphical representation of distribution of Leaf prices before and after the state credit elimination, with an overlay of a normal distribution of the same mean and variance. The distribution of sale prices for the Leaf is clearly less skewed toward lower price points after the state credit expired, consistent with the results shown in Table 4A.
Figure 6. Distribution of Leaf prices, before and after credit elimination
Results for Tesla and Lexus
For the Tesla and Lexus group, again we run three models, the first just using the variables of interest and the DID term. As above, the second includes the dummy variable for metro Atlanta

16
registrations and the third interacts Metro with the DID term to see if there is a differential effect of the credit expiration for cars purchased in the Metro Atlanta region. Again, the results shown in Table 5 for models 1 and 2 are very similar, so we will discuss only models 2 and 3 here (see table results). In Tesla-Lexus model 2, the DID coefficient estimate is $6,744, again highly significant. The Metro coefficient estimate is $307, but not statistically significant, suggesting little or no price differences between Tesla and Lexus vehicles purchased in the metro area versus those purchased outside the metro area. In model 3, the Metro*DID term is again positive, but with a large standard error, while the coefficient on the primary DID term loses statistical significance in this model, thus we will focus further discussion on model 2.
Table 5. Difference in Difference – Tesla & Lexus (1) (2) (3) VARIABLES Model 1 Model 2 Model 3 1.Tesla 55,754*** 55,713*** 55,595*** (2,410) (2,420) (2,429) 1.credit 1,235 1,252 1,299 (2,342) (2,346) (2,349) 1.did2 -6,742** -6,744** -5,607 (3,088) (3,091) (3,637) 1.metro 307.3 1,203 (1,393) (2,054) 1.did2_metro -1,661 (2,796) Constant 45,898*** 45,713*** 45,173*** (1,590) (1,799) (2,017) Observations 491 491 491 R-squared 0.728 0.728 0.728
Standard errors in parentheses *** p<0.01, ** p<0.05, * p<0.1
The large, positive coefficient estimates on the DID term in models 1 and 2 again suggest a possible mix effect, a shift in the sales mix toward more expensive models and options. As in the case of the Leaf, this is supported by the analysis in Table 6A. The average price of a Tesla increases by 6 percent post credit and there appears to be a shift toward higher priced models, at the expense of the mid-priced ones. Again, the number of vehicle transactions drops dramatically post credit from 273 to 64.

17
Table 6A. Change in price Tesla before and after credit expiration Tesla Model S April-June 2015 with credit July-Sept post credit Count Share Count Share Tesla Models $80K and less 31 11% 10 16% Tesla Models $81K-$100K 157 58% 23 36% Tesla Models over $100K 85 31% 31 48% Total 273 64 Average price $96,145 $101,652 Price change post credit 6%
As in the case of the Prius, there is no large change in either mix or price for the Lexus, as shown in Table 6B, while unit volume rises somewhat.
Table 6B. Change in price Lexus before and after credit expiration LEXUS April-June 2015 w/ credit July-Sept post credit Count Share Count Share ES300 H (Avg price $38K-$40K) 40 38% 52 41% NX300H (Avg price $48K-$49K) 8 8% 12 9% RX450H (Avg price $51K-$53K) 23 22% 19 15% Total 71 83 Average price $47,133 $45,898 Price change post credit -3%
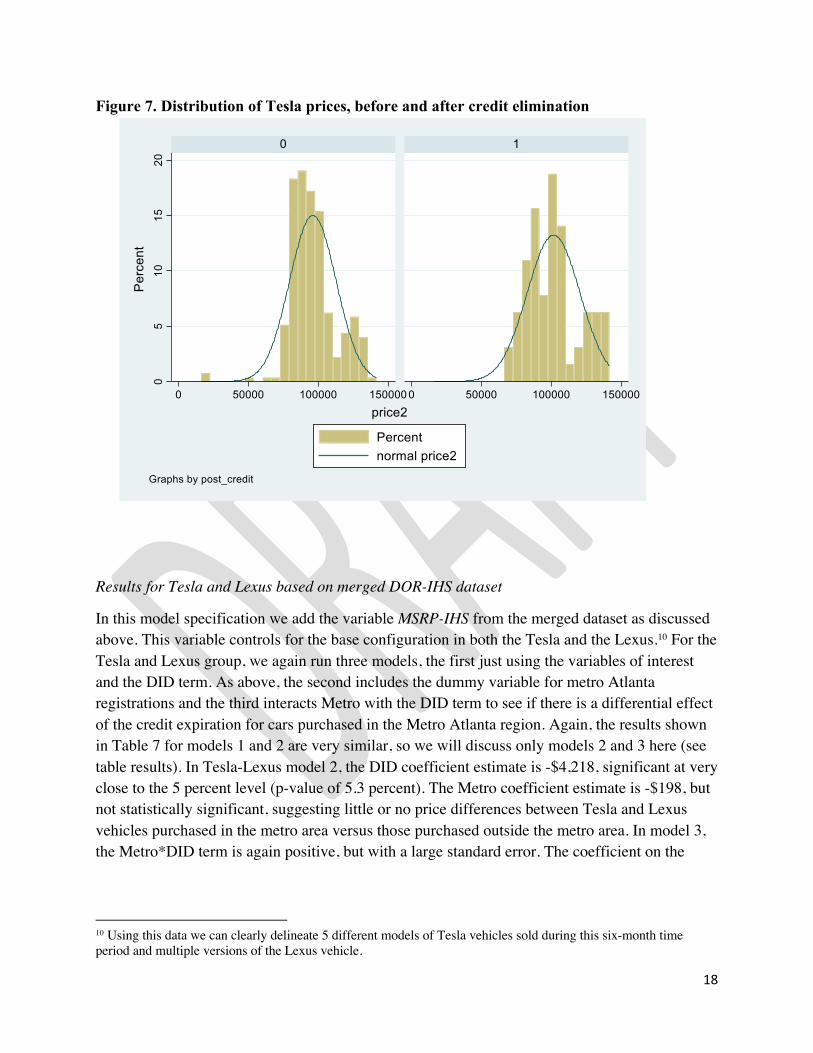
Figure 7 provides a graphical representation of the distribution of the Tesla prices prior to and after the expiration of the state credit, with normal distribution overlays. Though less dramatic than that seen for the Leaf, the graphs are consistent with the table in showing an increase in the price of the Tesla models following the expiration of the credit and some shift to higher price-point Teslas. Consistent with that of the Leaf, the distribution also becomes somewhat wider during the post credit period, suggesting more heterogeneity in the prices paid, presumably due to greater variability in options chosen by the consumer.
18
Figure 7. Distribution of Tesla prices, before and after credit elimination
Results for Tesla and Lexus based on merged DOR-IHS dataset
In this model specification we add the variable MSRP-IHS from the merged dataset as discussed above. This variable controls for the base configuration in both the Tesla and the Lexus.10 For the Tesla and Lexus group, we again run three models, the first just using the variables of interest and the DID term. As above, the second includes the dummy variable for metro Atlanta registrations and the third interacts Metro with the DID term to see if there is a differential effect of the credit expiration for cars purchased in the Metro Atlanta region. Again, the results shown in Table 7 for models 1 and 2 are very similar, so we will discuss only models 2 and 3 here (see table results). In Tesla-Lexus model 2, the DID coefficient estimate is -$4,218, significant at very close to the 5 percent level (p-value of 5.3 percent). The Metro coefficient estimate is -$198, but not statistically significant, suggesting little or no price differences between Tesla and Lexus vehicles purchased in the metro area versus those purchased outside the metro area. In model 3, the Metro*DID term is again positive, but with a large standard error. The coefficient on the
10 Using this data we can clearly delineate 5 different models of Tesla vehicles sold during this six-month time period and multiple versions of the Lexus vehicle.

19
primary DID term is not statistical significance in this model, thus we will focus further discussion on model 2.
Of particular note here, after adding the MSRP control variable, estimates of the DID term were materially smaller (37 percent smaller or about $2,500 in absolute value terms) than in the estimates reported in Table 5, supporting the hypothesis that extensive-margin consumers, attracted by the credit, were opting for lower-priced Tesla models. However, the coefficient estimates on the DID term in models 1 and 2 remain negative and (marginally) statistically significant, again suggesting either shifting of the tax incentive to consumers or that MSRP is not fully controlling for possible mix effects (or possibly some other, unobserved factor). While the results may still be confounding various effects of the extent to which consumers capture some of the subsidy, this analysis does not seem to support the hypothesis of dealer capture of the subsidy.
The MSRP variable in the IHS data is assigned based on parsing of VINs to identify the vehicle model (and the corresponding list price of that model), but this base price for each model does not include options or extras on a given vehicle that are not standard for the given model, such as sunroofs, larger wheels, and sound systems, and thus increase the price of the car above the assigned MSRP. The data do not identify the options included, above what is standard for the given model, but we note that DID coefficient representing the reduced price for Teslas during the credit period, is about 4 percent of the $96,145 average price of a Tesla during that period. Thus, while we cannot rule out over-shifting, the remaining estimated negative price effect during the credit period is small enough that it may still be reflecting only mix effects, consumers on the extensive margin who are not only buying lower-priced Tesla models, but also opting for fewer expensive extras.

20
Table 7. Difference in Difference – Tesla and Lexus, controlling for mix effect
(1) (2) (3) VARIABLES Model 1 Model 2 Model 3 MSRP_IHS 1.460*** 1.459*** 1.458*** (0.0430) (0.0434) (0.0439) 1.Tesla -3,040 -3,002 -2,980 (2,304) (2,302) (2,320) 1.credit 766.1 759.9 771.1 (1,831) (1,845) (1,862) 1.did -4,221* -4,218* -3,721 (2,163) (2,172) (2,274) 1.metro -197.9 110.7 (1,092) (1,621) 1.did_metro -619.4 (2,193) Constant -18,231*** -18,070*** -18,239*** (2,347) (2,681) (2,801) Observations 493 493 493 R-squared 0.885 0.885 0.885
Robust standard errors in parentheses *** p<0.01, ** p<0.05, * p<0.1
Section 8. Conclusions
Economic theory suggests that a subsidy paid to the consumer will increase the quantity demanded at any given gross or pre-subsidy price, with the change in the equilibrium price depending on the shapes of the supply and demand curves for the subsidized good. A rise in the pre-tax price in the presence of the subsidy would suggest that producers are capturing a portion of the subsidy incidence, while a decline would suggest the consumer is benefiting in excess of the subsidy amount, also known as over-shifting. In a perfectly-competitive market, sellers are price-takers (firm supply is horizontal), so the equilibrium pre-tax price does not change and 100 percent of the subsidy incidence flows to the consumer.
This research explores the incidence of the Georgia Electric Vehicle Tax Credit by analyzing changes in vehicle prices from before to after expiration of the Georgia tax credit on June 30, 2015, focusing on changes in prices for Nissan Leaf and Tesla EVs, which were eligible for the credit, compared to changes in control vehicles – Prius and Lexus HEVs and PHEVs – that were not eligible, but which appealed to the same consumers.

21
We find no direct evidence that dealers were charging higher prices while the credit was in place, capturing part of it. Instead, we find the prices after the credit expired rose on the Leaf and Tesla vehicles. We attribute these changing prices to a change in the mix of vehicles purchased, partially confirmed by controlling, for the mix of vehicle model or trim price points, to the degree captured by MSRP. The mix of vehicles during the credit period skewed toward lower-priced models compared to when the credit was not available, suggesting that the credit attracted consumers on the extensive margin to lower price-point models of eligible vehicles. Leaf unit sales declined 98 percent after the credit expired, while the Tesla sales declined 77 percent post-credit. In contrast, no dramatic drop off is observed in either the Prius or the Lexus control groups, after the credit expires; rather, volumes of both increased.

22
References
Boyle, M. A., & Matheson, V. A. (2009). Measuring tax incidence: a natural experiment in the hybrid vehicle market. Environmental Economics and Policy Studies 10(2-4), 101-107. Busse, M., Silva-Risso, J., & Zettelmeyer, F. (2006). $1,000 cash back: The pass-through of auto manufacturer promotions. American Economic Review, 96(4), 1253-1270. Dong, C., Wiser, R., & Rai, V. (2018). Incentive pass-through for residential solar systems in California. Energy Economics 72, 154-165. Gulati, S., McAusland, C., & Sallee, J. M. (2017). Tax incidence with endogenous quality and costly bargaining: Theory and evidence from hybrid vehicle subsidies. Journal of Public Economics, 155, 93-107. Li, Y. (2018). Incentive pass-through in the California Solar Initiative – An analysis based on third-party contracts. Energy Policy 121, 534-541. Pless, J., van Benthem, A.A. (2019). Pass-Through as a Test for Market Power: An Application to Solar Subsidies. American Economic Journal: Applied Economics 11(4), 367–401. Sallee, J. M. (2011). The surprising incidence of tax credits for the Toyota Prius. American Economic Journal: Economic Policy 3(2), 189-219.