the indian media & entertainment industry 2015 (revision1)
TRANSCRIPT

The Indian Media &
Entertainment Industry
2015
Presentation by
Trends & Analysis - Past, Present & Future

Source: FICCI-KPMG Report 2015
The Indian M&E Industry
The Indian Media & Entertainment Industry includes
Television, Film, Print, Radio, Music, Digital Media, Animation, Gaming,
Events & Live Media, Out-of-home & other ancillary media.
• Valued at over US$
16.2bn (1,02,600Cr INR)
which is 0.9% of the
global M&E industry
(estimated at US$ 1.8tn)
• Its growth (11.7%) is
nearly double the growth
of the global M&E industry
(at 6.1%)
• High-volume, low-value.
580 587652
728
821
918
1026
1160
1330
1532
1740
1964
0
200
400
600
800
1000
1200
1400
1600
1800
2000
2008 2009 2010 2011 2012 2013 2014 2015 2016 2017 2018 2019
INR
Billio
ns
11.7%
13.9%

Source: FICCI-KPMG Report 2015
Indian M&E Industry – % Breakdown
TV to grow from 46% to 50% market-share by 2019.
Film is expected to drop from 12% in 2008 to 10% in 2018.
Digital is expected double its share of the M&E market in the next 5 years.
2008 2009 2010 2011 2012 2013 2014 2015 2016 2017 2018 2019
42% 44% 46% 45% 45% 45% 46% 47% 47% 48% 49% 50%
30%30%
30% 29% 27% 26% 26% 25% 23% 22% 21% 20%
18% 15% 13% 13% 14% 14% 12% 12% 12% 11% 11% 10%
1% 1% 2%2% 2% 2%
2%2% 2%
2% 2% 2%
1% 1% 1%1% 1% 1%
1%1% 1%
1% 1% 1%
3% 2% 2%2% 2% 2%
2%2% 2%
2% 2% 2%
3% 3% 4%4% 4% 4%
4%4% 4%
5% 5% 5%
1% 1% 2% 2% 2% 2%2%
2% 2%2% 2% 2%
1% 1% 2% 2% 3% 3% 4% 5% 6% 8% 8% 8%
TV Print Motion Picture Radio Music OOH Animation & VFX Gaming Digital

Source: FICCI-KPMG Report 2015
The Indian Film Industry
• Largest in the world by
films released theatrically
or tickets sold (over 1,400
films released & over
3.25bn tickets sold)
• 2014 was a year of
introspection when the
‘star-backed’ films
performed average and
the ‘script-backed’ films
did great, marking a
coming of age of
Bollywood.
1913-2000 2000-2004 2004-2010 2010-2014
Production Analog Analog Analog Analog & Digital
Post-Production Analog Digital Digital Digital
Distribution Analog Analog Analog & Digital Analog & Digital
The Digital-isation of the Industry
105
8983
93
113
125 126
136
156
171
186
204
0
50
100
150
200
2008 2009 2010 2011 2012 2013 2014 2015 2016 2017 2018 2019
INR
Billio
ns
Film
0.9%
10%

Source: FICCI-KPMG Report 2015
The Indian Film Industry =
‘Bollywood’While‘Bollywood’ is a generally used term to define the Indian Film industry,
Hindi films accounted for only 16% of the 1,400+ films that released.
The South Indian Film industry accounts for almost 50% of the films
Language No of Films
Hindi 234
Tamil 210
Telugu 218
Kannada 157
Malayalam 108
Bengali 139
Marathi 122
Gujrati 67
Bhojpuri 84
Punjabi 9
Others 78
Total 1,426

Source: FICCI-KPMG Report 2015
Film Revenues Breakdown
Domestic Revenues have always accounted for over 90% of the Indian Film
industry’s revenues. The trend is expected to strengthen against International
revenues. This is THE double-edged sword for the industry.
Proving the digital
medium’s
dominance, Ancillary
revenues as a % of
total film revenue
will increase 1.5x
over the next 5
years.
Home Video, like in
the rest of the world,
is dying out fast. 0%
20%
40%
60%
80%
100%
2010 2011 2012 2013 2014 2015 2016 2017 2018 2019
74% 74% 76% 75% 74% 73% 73% 72% 72% 71%
8% 7% 7% 7% 7% 7% 7% 7% 7% 7%
10% 11% 11% 12% 12% 11% 11% 11% 11% 11%
5% 5% 5% 6% 7% 8% 8% 9% 10% 11%
IN
R B
illio
ns
Film Revenues % Breakdown
Domestic Theatrical Overseas Theatrical Home Video Cable & Satellite Rights Ancillary Revenues

Source: FICCI-KPMG Report 2015
Film – Revenue Split
When you pay Rs 100 for a movie ticket, what is the split?
• Gross – 100% (Rs 100)
• Entertainment Tax – 30% (Rs 30)
• Exhibitor – 50% of balance 70% (Rs 35)
• Distributor – 50% of balance 70% (Rs 35)
• Lead Producer(s) – depends on what deal they have made with
distributor – Outright / MG / Commission
• Co-producer(s) – Last in First out.
• Talent – actors / director – points!

Source: FICCI-KPMG Report 2015
Exhibition needs to grow!
• India has one of the lowest screen
densities among global film markets
• Urgent & rapid infrastructure growth in
multiplex screens is needed
• Since the Box office is not as robust as
other countries, government
intervention is needed by way of SOPs.
125
85 82
61 57
26
137
0
20
40
60
80
100
120
140
Screens/Million
1 1.11.4
1.6 1.61.5
2
2.7
3.5
4.7
0
0.5
1
1.5
2
2.5
3
3.5
4
4.5
5
2010 2011 2012 2013 2014
Billio
n $
Domestic Box Office Size
India China
1,000 1,250 1,470 1,650 1,750
6,256
9,200
13,118
18,195
22,000
-
5,000
10,000
15,000
20,000
25,000
2010 2011 2012 2013 2014
Multiplex Screens
India China

Source: FICCI-KPMG Report 2015
Industry = Value x Volume
No of screens that a film plays in
has grown radically over the past
decade, curbing piracy and
augmenting theatrical revenues
239
127
95
56
0
50
100
150
200
250
300
High EndMultiplex
Multiplex Single Screen Low End SingleScreen
Ticket Rates (INR)
500
1000
3000
4500
0
500
1000
1500
2000
2500
3000
3500
4000
4500
5000
1994 - HumAapke Hain Koun
2009 - 3 Idiots 2012 - Ek ThaTiger
2013 - Dhoom 3
No of Screens
Average ticket prices of
multiplexes are 3-4 times that of
single screen theatres.

Source: FICCI-KPMG Report 2015
The Indian Film Industry - Key points
• Realisation of the value of Film education. Scale needed. Urgently.
• Script-backed v/s Star-backed.
• Hollywood films account for less than 10% of the Indian Film industry.
• Over-reliance on Domestic Theatrical revenues for mid-range films.
• Increased in-film advertising – Tourism & products
• Increased no of domestic prints – 5000
• Increased no of overseas prints – 2000
• Share of Revenue from first week is highly critical (ranges from 55-
75% of box office collections)
• The industry lacks a globally merchandisable home-grown IP brand.

Source: FICCI-KPMG Report 2015
The Indian Television Industry
• The most consistently
performing sector of the
Indian M&E Industry.
• It is, presently, nearly 4
times the size of the Indian
Film industry and is the
largest employer in the M&E
space.
• India overtook the US in
2014 as the 2nd largest TV-
owning market in the world
(168 million TV households
– 82% penetration).
The potential: The Indian average subscription rate is
US$5-6 per month per TV for Cable TV / DTH against
US$40-100 in evolved markets like US / UK / Europe.
241 257297
329370
417
475
543
631
739
855
975
0
100
200
300
400
500
600
700
800
900
1000
2008 2009 2010 2011 2012 2013 2014 2015 2016 2017 2018 2019
INR
Billio
ns
TV
13.8%
15.5%

Source: FICCI-KPMG Report 2015
TV Connectivity – A Digital blitz
With digitisation
primarily
successful for
Phase 1 & 2
(over 95%) and
the rest of the
country
underway on
the same path,
digital STBs
and DTH
connections are
the way of the
future. 0
20
40
60
80
100
120
140
160
180
200
2010 2011 2012 2013 2014 2015 2016 2017 2018 2019
6574 69 68 70
55
27
5 5 5
5
6 19 2529
45
67
85 90 94
28
31
3437
4048 61 72
7476
8
8
9
9
10
1111
1212
12
Subscribers
Analog Cable Digital Cable DTH Other Digital

Source: FICCI-KPMG Report 2015
TV Connectivity – A Digital blitz
TV households, C&S penetration & ARPUs are all expected to grow
over the next 5 years, enabling distribution-led growth in TV
161 168
196
80%
82%
90%
0
50
100
150
200
250
74%
76%
78%
80%
82%
84%
86%
88%
90%
92%
2013 2014 2019
TV Households (Millions) C&S penetration
175
196
225
248
273
301
200
220
242
266
292
322
150
170
190
210
230
250
270
290
310
330
350
2014 2015 2016 2017 2018 2019
ARPUs
Digital Cable DTH

Source: FICCI-KPMG Report 2015
TV Channels galore!
• Channel growth over
the past 14 years has
been significant. On
an average, India has
added 3.2 channels
per month for the
past 14 years.
• India has more than
400 news channels.
• Channel
differentiation is
weak.
0
100
200
300
400
500
600
700
800
1991 1995 2000 2005 2010 2014
5
55
130
263
550
800
No of Channels

Source: FICCI-KPMG Report 2015
GEC – GRP v/s Profitability
Low GRP High GRP
Low
Profitability
High
Profitability
Long running soaps
Low-cost game /
performance based
reality shows
Mythological series
Recently released movies
Celebrity-based shows
Why do we see what we see on TV?
How do funds available for content creation get allocated between building a viewer
base and then en-cashing on the base?
Source: FICCI-KPMG Report 2015
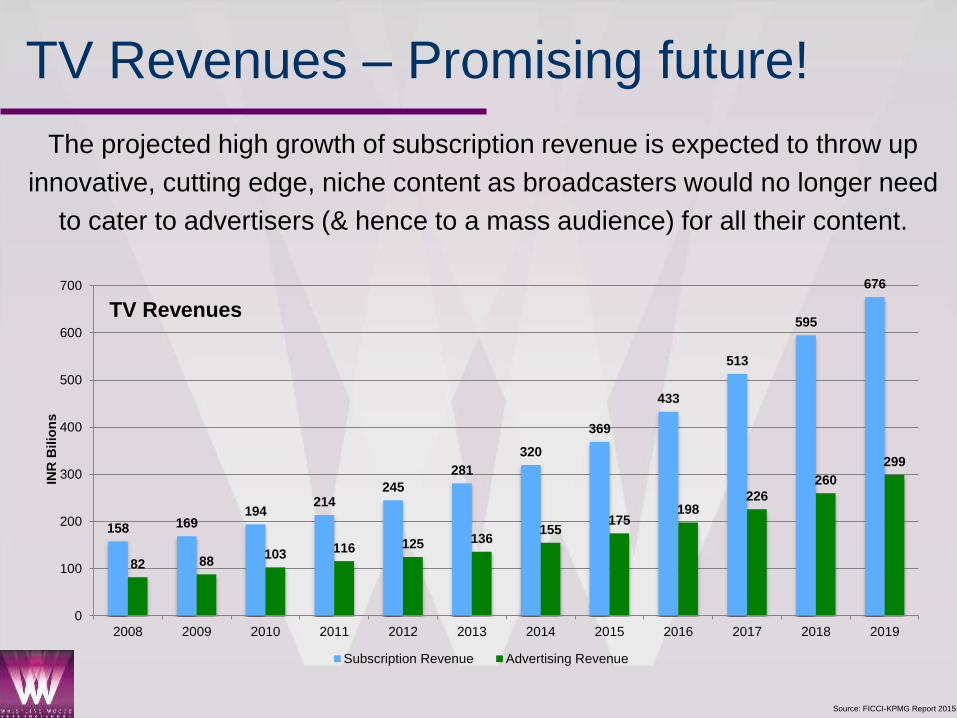
TV Revenues – Promising future!
The projected high growth of subscription revenue is expected to throw up
innovative, cutting edge, niche content as broadcasters would no longer need
to cater to advertisers (& hence to a mass audience) for all their content.
158 169194
214245
281
320
369
433
513
595
676
82 88103 116 125 136
155175
198226
260
299
0
100
200
300
400
500
600
700
2008 2009 2010 2011 2012 2013 2014 2015 2016 2017 2018 2019
INR
Bilio
ns
TV Revenues
Subscription Revenue Advertising Revenue

Source: FICCI-KPMG Report 2015
TV Revenue Sharing – A concern!
Of an amount collected of INR 320 billion, ONLY INR 75 billion is reaching
the broadcasters, which is less than 25%. Ideally, it should be in reverse with
only 25-30% being retained by the LCOs, MSOs. However, underreporting of
subscribers, carriage fees & lack of digitisation is the reason for this.
245281
320369
433
513
595
676
57 69 75 90 114 145 174 201
23%25%
23%24%
26%
28%29% 30%
0%
5%
10%
15%
20%
25%
30%
35%
0
100
200
300
400
500
600
700
800
2012 2013 2014 2015 2016 2017 2018 2019
INR
Billio
ns
Subscription Revenue
Paid by Consumers Recd by Broadcasters %

Source: FICCI-KPMG Report 2015
Viewership & Ad-Revenue
Disparity between viewership & Ad Revenue is stark, esp. in the case of English
content. English News has 0.1% viewership but gets a whopping 5.2% of the Ad
Revenue. Similarly, English Entertainment has 1.1% of the viewership but 4.5% of the
Ad Revenue pie. It reflects the SEC & spending capacity of its audience. Regional TV
is heavily discounted in pricing on account of the nature / SEC of its audience.

Source: FICCI-KPMG Report 2015
Indian Animation picks up
• Broadcasters are willing to pay
double for good quality Indian
Animated content as compared to
daily soaps / Hindi general
entertainment content, even though
this segment gets only 7.3% of the
viewership, as compared to 31.1%
for Hindi GECs.
• Also the fact that this segment
continues to be under-indexed, with
only 3.8% ad-revenue share doesn’t
bother broadcasters as this content
has long-tail revenue
• It offers repeat viewing value, multi-
language dubbing value and
merchandising value.

Source: FICCI-KPMG Report 2015
Hindi GEC Fiction content changing. Slowly.
• GECs have finally embraced the
tele-series format with season-
based programming
• The value:volume ratio is reversed
in such programming as compared
to the daily / weekly soaps.
• For the past 20-odd years, the
content has largely mirrored
American programming of the 70s-
80s, with our soaps comparable to
content like the Bold & The
Beautiful, Santa Barbara, Dallas,
etc.

Source: FICCI-KPMG Report 2015
TV – Key Points
• Digitisation – increased revenue for the broadcaster, should lead to
more investment in content (& hence better quality content)
• Global proliferation of Indian-origin content is increasing, albeit for
the Indian diaspora only. This is THE BIG opportunity.
• Indian animation on TV is starting to matter.
• Hindi GECs are exploring new content programming & a changed
value:volume mix in revenue models.
• Lack of quality viewership measurement systems is an issue.
Hopefully, digitisation should resolve this.

Source: FICCI-KPMG Report 2015
Focus: Digital
INR Billions
Digital is expected to triple in industry size in the next 5 years.

Source: FICCI-KPMG Report 2015
The Digital Business – A BLITZ of growth!
• India has the lowest net penetration
among all developing countries and
much lower than the developed ones.
• Despite that, India has more internet
users than the US.
• Increasing cellphone penetration, large
number of low-cost smartphones fuels
this growth.
0
100
200
300
400
500
600
2014 2015 2016 2017 2018 2019
20 22 25 27 30 32
210
273
337
402
469
528
Milio
ns o
f U
sers
Internet Users
Wired Wireless
19%
53%
46%
60%
87%90%
86%
0%
10%
20%
30%
40%
50%
60%
70%
80%
90%
100%
India Brazil China Russia USA UK Japan
Internet Penetration
0
50
100
150
200
250
300
350
400
450
500
2014 2015 2016 2017 2018 2019
173
232
286
342
399
457
116
188
249
299
369
435
Millio
ns o
f U
sers
Net on Mobile
Net on Mobile Smartphones
21%

Source: FICCI-KPMG Report 2015
Telecom Base – Volume galore!
The overall tele-
density in India was
81.83
Urban tele-density
was 153.45 and
rural teledensity was
49.94
As of December 2015
Telecom Service Providers
Active subscribers
Bharti Airtel 243,289,404
Vodafone 193.600,085
IDEA 171,912,608
Reliance 100,890,431
Aircel 85,632,249
BSNL 82,507,640
Tata 60,727,856
Telenor 50,702,396
Sistema 8,006,814
Videocon 6,958,178
MTNL 3,614,439
Quadrant 3,047,100TOTAL 1,010,889,200

Source: FICCI-KPMG Report 2015
TV v/s Digital
Digital is the medium
for the future.
The web user base is expected to
grow at an incredible 18% annual
growth rate over the next 5 years as
compared to 3% of TV.
AD Spend on Digital platforms is
growing at four times the rate of TV.
825857
886913
938 960
281
348
420
494
570
640
0
100
200
300
400
500
600
700
800
900
1000
2014 2015 2016 2017 2018 2019
Millio
ns o
f U
sers
TV Internet
18%
38.354.8
72.498.6
116.1135.4
5.2
7.7
11.6
16.8
22.1
27.1
0
20
40
60
80
100
120
140
160
180
2014 2015 2016 2017 2018 2019
INR
Billio
ns
Digital Advertising Growth
Web Mobile
30.16%

Source: FICCI-KPMG Report 2015
Digital – Key Points
• The Digital platforms of web, mobile & web-connected smart TVs
are the future.
• Content consumption modes & patterns are already starting to
change with a large number of sub-18-yr-olds are switching to
YouTube to find their new ‘stars’
• YouTube is taking the Indian market very seriously and has set up
a ‘YouTube space’ in India, in partnership with Whistling Woods
International
• YouTube has ‘approved’ a credit-based semester-long training
course for ‘Content Creation, Audience Development &
Monetisation for digital platforms’ developed by Whistling Woods.
Source: FICCI-KPMG Report 2015
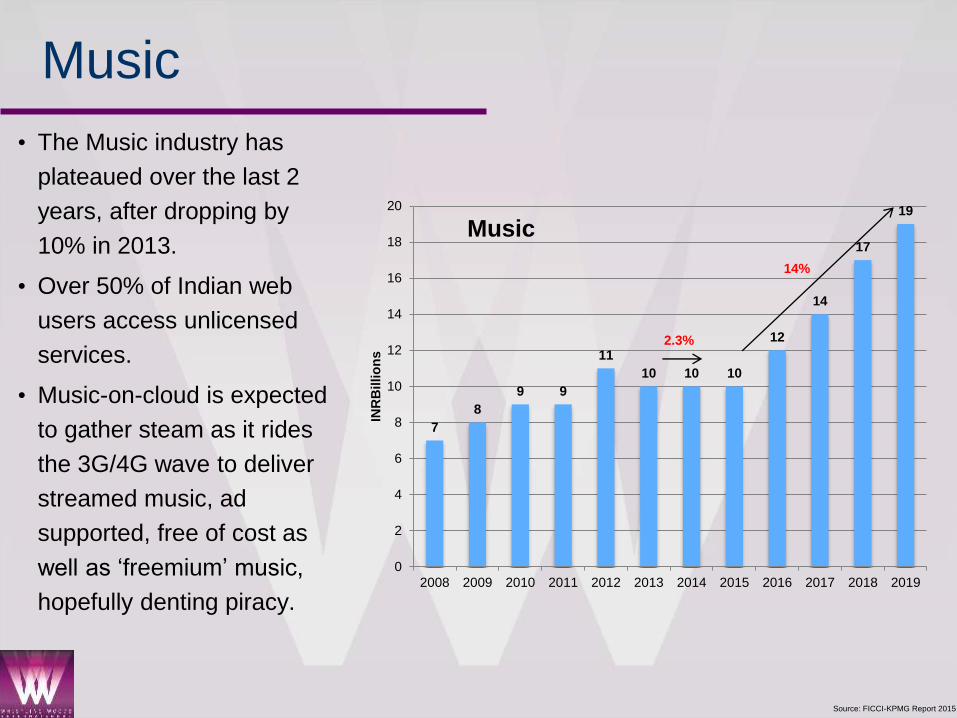
Music
• The Music industry has
plateaued over the last 2
years, after dropping by
10% in 2013.
• Over 50% of Indian web
users access unlicensed
services.
• Music-on-cloud is expected
to gather steam as it rides
the 3G/4G wave to deliver
streamed music, ad
supported, free of cost as
well as ‘freemium’ music,
hopefully denting piracy.
7
8
9 9
11
10 10 10
12
14
17
19
0
2
4
6
8
10
12
14
16
18
20
2008 2009 2010 2011 2012 2013 2014 2015 2016 2017 2018 2019
INR
Billio
ns
Music
14%
2.3%

Source: FICCI-KPMG Report 2015
Music - Consumption
• The consumption % reversed
from 2009 to 2014 between
physical & digital.
• Bollywood fuels over 80% of
the Music industry
• Indian non-Bollywood music
(Indie / pop / rock / regional) is
struggling, with only Religious
& Indian Classical music
managing to survive.
• Hardly ANY innovation in
Music, since AR Rahman.
• Hardly any proper music
schools
58%
33%
6%3%
20%
55%
15%
10%
0%
10%
20%
30%
40%
50%
60%
70%
Physical Digital TV & Radio PublicPerformance
Music Consumptionby Source
2009
2014
81.0%
10.0%
4.0%2.2% 2.8%Music Consumption
by Genre
Bollywood
International
South Indian
Punjabi
Others

Source: FICCI-KPMG Report 2015
Gaming
• Grew over 20%, on the back of
mobile gaming.
• With 960 mn+ users & a young
population, India is one of the
fastest growing mobile gaming
markets in the world
7 810
1315
19
24
28
32
35
40
46
0
5
10
15
20
25
30
35
40
45
50
2008 2009 2010 2011 2012 2013 2014 2015 2016 2017 2018 2019
INR
Billio
ns
Gaming14.3%
46% 49% 51% 52% 55% 57%
39% 35% 32% 30% 28% 26%
15% 16% 17% 18% 18% 17%
0%
10%
20%
30%
40%
50%
60%
70%
80%
90%
100%
2014 2015 2016 2017 2018 2019
Mobile Console PC & Online
22.4%

Source: FICCI-KPMG Report 2015
Radio
• Small industry size, primarily
on account of restriction of
content by the government (no
news radio, talk radio allowed)
• Hence every FM radio station
sounds the same.
• The growth in 2014 has been
built around increased ad-ex
by e-commerce, real estate
and retail.
• The shift to radio is as it is a
cost-effective advertising
vehicle, as compared to TV.
8 810 11
1315
17
2022
27
33
40
0
5
10
15
20
25
30
35
40
45
2008 2009 2010 2011 2012 2013 2014 2015 2016 2017 2018 2019
INR
Billio
ns
Radio18.1%
17.6%
21266
401
1232
12 98167
431
0
200
400
600
800
1000
1200
1400
Phase 1 (1990s) Phase 2 (2006-07)
Phase 3 - 1(2015)
Phase 3 - 2(2015-16)
Licences available Cities

Source: FICCI-KPMG Report 2015
Animation, VFX & Post-Production
• The industry has shown decent
growth, on the back of VFX / post-
prodn, not Animation.
• Increased consumption of VFX &
digital post production in Film & TV.
• Lack of original IP creation is a major
reason of the stagnation of the
Animation industry.
18 2024
3135
4045
51
59
69
81
96
0
10
20
30
40
50
60
70
80
90
100
2008 2009 2010 2011 2012 2013 2014 2015 2016 2017 2018 2019
INR
Billio
ns
Animation & VFX16.3%
13.1%
1 1
2 2
4
6
1
4
1
5
3 3
0
1
2
3
4
5
6
7
1992 2000 2005 2006 2007 2008 2009 2010 2011 2012 2013 2014
Animated Films Released Theatrically

Source: FICCI-KPMG Report 2015
Animation, VFX & Post-Production
The industry has split with itself, with the Animation industry tanking and
the VFX / post-prodn growing.
From a 60:40 ratio in 2010, the industry reaches a 80:20 ratio in 2019.
26% 23% 22% 20% 18% 16% 15% 14% 13% 12%
16%
14%13%
12%11%
11%10% 9% 9% 8%
19%
20% 22% 23%25% 27% 29% 30% 32% 34%
38%44% 44% 45% 45% 46% 46% 46% 46% 46%
0%
10%
20%
30%
40%
50%
60%
70%
80%
90%
100%
2010 2011 2012 2013 2014 2015 2016 2017 2018 2019
Animation Services Animation Product Creation VFX Post-Prodn

Source: FICCI-KPMG Report 2015
Animation on Indian Screens
Only 3 out of the top-10 characters on Indian TV are of Indian origin!

Source: FICCI-KPMG Report 2015
Jobs in M&E
• By 2022, as per the NSDC, the
Media & Entertainment industry
would be requiring 12.9 lakh
skilled professionals, over 80% of
these in the Film & TV vertical.
• The media industry as a whole still
lacks sufficient world-class
training facilities to enable
professionalism and best
practices.
• Significant government-
intervention and private
investments will be needed to
correct this imbalance
1.60 2.40
4.40
1.40
2.80
6.40
0.60 0.70
1.30
0.20 0.30 0.40 0.20 0.30 0.40
-
1.00
2.00
3.00
4.00
5.00
6.00
7.00
2014 2017 2022
EmploymentGrowth
Film
TV
Radio
Animation,VFX, Gaming
Source: FICCI-KPMG Report 2015
What are the pain-points of the Indian M&E Industry?
• Lack of original Intellectual Property creation leading to lack of a globally
merchandisable brand.
• M&E Education & Training
o Of the 4 lakh people employed, nearly 75% involved in content creation have
no formal training.
o Very few world-class Film & Media institutes with a combined output of
approx 500 graduates a year, with 200 of them being from a single institute.
• Innovation – we are followers, not leaders when it comes to formats or
technical / narrative innovation.
• Piracy - Affects every sector of the industry & causes nearly 35%
revenue reduction

Source: FICCI-KPMG Report 2015
The Great Opportunities in M&E
• Digital – with an increasing youth population who are open to new
platforms and new content ideas, the next generation of Indian
consumers are ready and waiting for content for the digital
platforms.
• In the M&E industry, building volume is hard. India already has the
volume. We now need to build value to each unit of the already
existing volume. This is done by enhancing quality. The best way to
build quality is be educating & training the industry.
