the influence of climate change at high altitude and high ... · pdf filethe influence of...
TRANSCRIPT

The influence of climate change at high altitude and high latitude
Raino Heino Finnish Meteorological Institute
CONTENTS
- Background and sources
- Climate changes (past and future)- hellip and their impacts- helliphellip at high latitudes altitudes
- Concluding remarks
References
Intergovernmental Panelon Climate Change (IPCC)
2007
Impacts of Europersquos changing climate (EEA)
Arctic Climate Impact Assessment (ACIA)
etchellip
WMO- CCl (Commission for
Climatology)- IPY (International Polar Year)- CliC (Climate and Crysphere)
- BALTEX Assessment of Climate Change
etchellip
EEA ACIAseveral 2004
gt3000 p
WG1 WG2 WG3
2009 ~2013
2010 - 2012Springer 500p
The Intergovernmental Panel on Climate Change (IPCC) was established by WMO and UNEP in 1988 to assess scientific technical and socio-economic information relevant for the understanding of climate change its impacts and options for adaptation and mitigationMain activities and products -gt httpwwwipccchIPCC Working Groups 4 major assessment reports- WG I hellipscientific aspects of climate change - WG II hellipimpacts of climate changehellip- WG III hellipmitigating of climate changehellip
IPCC ja Nobel (2007)
IPCC 1990 IPCC 1996 IPCC 2007 hellipIPCC 2050
WHY IPCC hellip policymakers need an objective source of information about the causes of climate change its potential environmental and socio-economic consequences and the adaptation and mitigation options to respond to it
Rio 1992 Kyoto 1997 Bali 2007UNFCCC -gt Copenhagen 2009
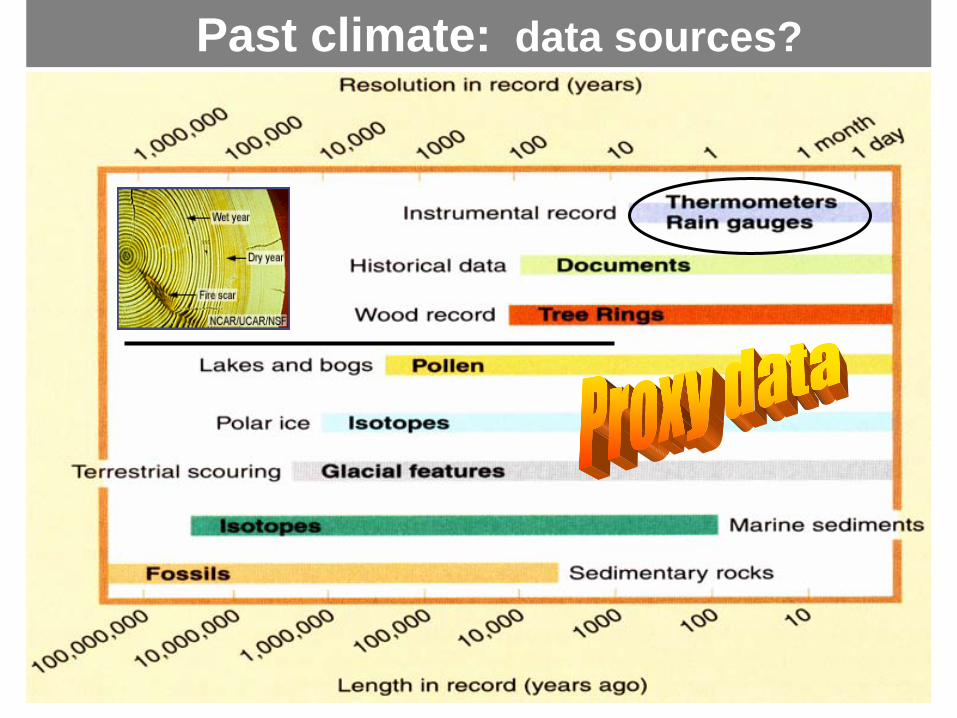
Past climate data sources
helliphellipin different time-scaleshelliphellipGlobal Tempereture Changes
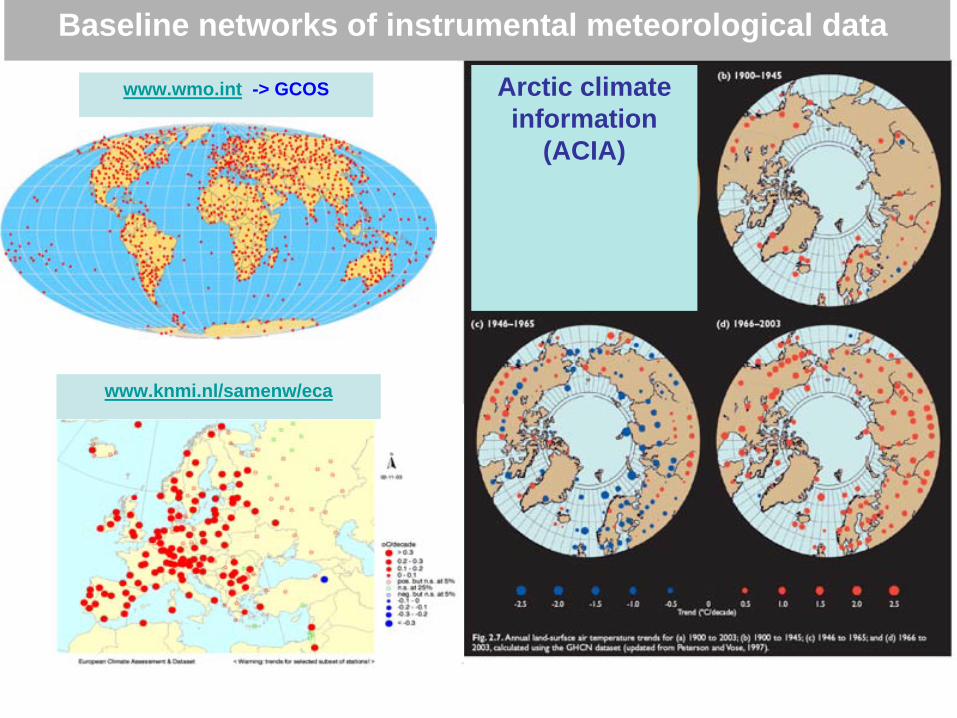
wwwknminlsamenweca
wwwwmoint -gt GCOS
Baseline networks of instrumental meteorological data
Arctic climate information
(ACIA)
Stockholm Helsinki
Spitsbergen Norway
StykkisholmurIceland Tasillaq Greenland
NORDIC ANNUAL MEAN TEMPERATURES
1960-1920-
1800-
1840-1750-
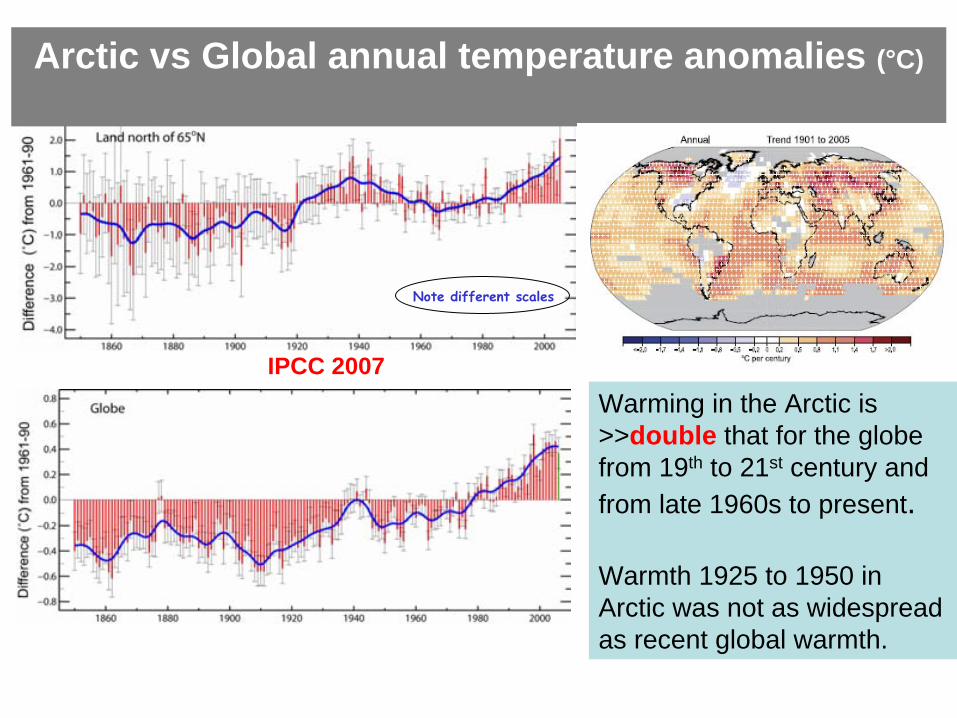
Warming in the Arctic is gtgtdouble that for the globe from 19th to 21st century and from late 1960s to present
Warmth 1925 to 1950 in Arctic was not as widespread as recent global warmth
Note different scales
Arctic vs Global annual temperature anomalies (degC)
IPCC 2007
BACC The Baltic area has become warmerhellipbull spring growing season and summer start earlierbull autumn frost season and winter start later
Annual trends (daysyear)ECA dataset 1951-2000
10 20 30 40
50
60
70
10 20 30 40
50
60
70Frost days
Hot days
100
120
140
160
180
200
220
1834 1854 1874 1894 1914 1934 1954 1974 1994
years
Dur
atio
n of
ice
cove
r (da
ys)
Oulujaumlrvi
Kallavesi
Naumlsijaumlrvi
Duration of the ice cover in some Finnish lakes
+-
-3
-2
-1
0
1
2
3
1870 1900 1930 1960 1990
Tem
pera
ture
ano
mal
y ( C
)
North Year Filter South Year Filter
Annual mean temperature
Linear trend in the DJF number of events above 90th percentile during the period 1958ndash2000
Highprecipitation
(BALTEX Assessment of Climate ChangehellipBACC)
Interannual variability in water inflow is considerable but no statistically significant trend is found in the annual time series for the period 1921-2005
Change -gt 2071-2100
1961-90
httpwwwdartmouthedu~floodsArchives
2008
Large Flood Events 1985-2007
UNTIL NOW
- No change in heat content and salinity
- Accelerated rise of the sea level
- Less icehellip
Observed Projected
No long-term trends in storminessHowever it is possible to attribute parts of the observed regional changes to changes in the large-scale circulation
(BALTEX Assessment of Climate ChangehellipBACC)
IPCC Past and future
Projected warmingin 21st century expected to be
- greatest over land and at most high northern latitudes
- and least over the Southern Ocean and parts of the North Atlantic Ocean
Projections of future temperature changes
rdquoGreenrdquoworld
Medium
rdquoBaUrdquo
-gt Increases very likely in high latitudes-gt Decreases likely in most subtropical land regions
Projections of future precipitation changes
Winter Summer
Implications (hellip of climate changes) -gt IPCC WG2
Arctic ice and snow as well as permafrost and vegetation zones
2007 2005
Thickness
Ice cover of the Arctic Sea hellipis disappearing
Linear trend coefficients in the time series of mean snow depths for the permanent snow-cover period 1936-2000
EU-INTASproject (SCCONE)Snow cover changes over Northern Eurasia
Snow Satellite measurements 1966 ndashJuly 2008
IPCC Glaciers and frozen ground
Area of seasonally frozen ground has decreasedhellip
Increased glacier retreatsince the early 1990s
DesertSteppe
Dry climates
Mild winters
Dry summers
Wet all seasons
Cold winters
Dry summers
Wet all seasons
Polar climatesTundraIce cap
Koumlppen climatic zonesbased on present (1961-90) temperature and precipitation
Pine
Spruce
Birch
now in 2100 Flying into climate change
Climate threat to coral reefs
The Earth is rdquogreeningrdquo
(from satellites)
Biologicalinfluences
1990s
2020s
2050s
2080s
Temp amp Prec -gt 2100
Rising sea levelshellip60 cm
20 cm
IPCC2007
Concluding remarksClimate change will notbe gradual buthellip
Complicated sea currents
If the Golf stream would not exist
Greenland melting
- 5-10 degrC
gt 2 km
what about +5
Arctic ClimateImpact Assessment(ACIA 2004)
-gt httpwwwbaltex-researcheu
The overall format is similar to the IPCC- author groups for the individual chapters- overall policymakers-summary - review process
BALTEX Assessment of Climate Change -gt BACC (2007)
Springer 500p
-gt httpwwwaciauafedu
ARCTIC
Presentand futuretemperature
(Attributionhellip)
Natural +anhtropogeniccauses
Naturalcauses
NAOetc
- The influence of climate change at high altitude and high latitude Raino Heino Finnish Meteorological Institute
- References
- Slide Number 3
- Slide Number 4
- Slide Number 5
- Slide Number 6
- Slide Number 7
- Slide Number 8
- Slide Number 9
- Slide Number 10
- Slide Number 11
- UNTIL NOW - No change in heat content and salinity- Accelerated rise of the sea level- Less icehellip
- IPCC Past and future
- Projections of future temperature changes
- Projections of future precipitation changes
- Slide Number 16
- Slide Number 17
- Slide Number 18
- IPCC Glaciers and frozen ground
- The Earth is rdquogreeningrdquo
- Slide Number 21
- Rising sea levelshellip
- Slide Number 23
- Slide Number 24
- Slide Number 25
- Slide Number 26
- Slide Number 27
- Slide Number 28
-

References
Intergovernmental Panelon Climate Change (IPCC)
2007
Impacts of Europersquos changing climate (EEA)
Arctic Climate Impact Assessment (ACIA)
etchellip
WMO- CCl (Commission for
Climatology)- IPY (International Polar Year)- CliC (Climate and Crysphere)
- BALTEX Assessment of Climate Change
etchellip
EEA ACIAseveral 2004
gt3000 p
WG1 WG2 WG3
2009 ~2013
2010 - 2012Springer 500p
The Intergovernmental Panel on Climate Change (IPCC) was established by WMO and UNEP in 1988 to assess scientific technical and socio-economic information relevant for the understanding of climate change its impacts and options for adaptation and mitigationMain activities and products -gt httpwwwipccchIPCC Working Groups 4 major assessment reports- WG I hellipscientific aspects of climate change - WG II hellipimpacts of climate changehellip- WG III hellipmitigating of climate changehellip
IPCC ja Nobel (2007)
IPCC 1990 IPCC 1996 IPCC 2007 hellipIPCC 2050
WHY IPCC hellip policymakers need an objective source of information about the causes of climate change its potential environmental and socio-economic consequences and the adaptation and mitigation options to respond to it
Rio 1992 Kyoto 1997 Bali 2007UNFCCC -gt Copenhagen 2009
Past climate data sources
helliphellipin different time-scaleshelliphellipGlobal Tempereture Changes
wwwknminlsamenweca
wwwwmoint -gt GCOS
Baseline networks of instrumental meteorological data
Arctic climate information
(ACIA)
Stockholm Helsinki
Spitsbergen Norway
StykkisholmurIceland Tasillaq Greenland
NORDIC ANNUAL MEAN TEMPERATURES
1960-1920-
1800-
1840-1750-
Warming in the Arctic is gtgtdouble that for the globe from 19th to 21st century and from late 1960s to present
Warmth 1925 to 1950 in Arctic was not as widespread as recent global warmth
Note different scales
Arctic vs Global annual temperature anomalies (degC)
IPCC 2007
BACC The Baltic area has become warmerhellipbull spring growing season and summer start earlierbull autumn frost season and winter start later
Annual trends (daysyear)ECA dataset 1951-2000
10 20 30 40
50
60
70
10 20 30 40
50
60
70Frost days
Hot days
100
120
140
160
180
200
220
1834 1854 1874 1894 1914 1934 1954 1974 1994
years
Dur
atio
n of
ice
cove
r (da
ys)
Oulujaumlrvi
Kallavesi
Naumlsijaumlrvi
Duration of the ice cover in some Finnish lakes
+-
-3
-2
-1
0
1
2
3
1870 1900 1930 1960 1990
Tem
pera
ture
ano
mal
y ( C
)
North Year Filter South Year Filter
Annual mean temperature
Linear trend in the DJF number of events above 90th percentile during the period 1958ndash2000
Highprecipitation
(BALTEX Assessment of Climate ChangehellipBACC)
Interannual variability in water inflow is considerable but no statistically significant trend is found in the annual time series for the period 1921-2005
Change -gt 2071-2100
1961-90
httpwwwdartmouthedu~floodsArchives
2008
Large Flood Events 1985-2007
UNTIL NOW
- No change in heat content and salinity
- Accelerated rise of the sea level
- Less icehellip
Observed Projected
No long-term trends in storminessHowever it is possible to attribute parts of the observed regional changes to changes in the large-scale circulation
(BALTEX Assessment of Climate ChangehellipBACC)
IPCC Past and future
Projected warmingin 21st century expected to be
- greatest over land and at most high northern latitudes
- and least over the Southern Ocean and parts of the North Atlantic Ocean
Projections of future temperature changes
rdquoGreenrdquoworld
Medium
rdquoBaUrdquo
-gt Increases very likely in high latitudes-gt Decreases likely in most subtropical land regions
Projections of future precipitation changes
Winter Summer
Implications (hellip of climate changes) -gt IPCC WG2
Arctic ice and snow as well as permafrost and vegetation zones
2007 2005
Thickness
Ice cover of the Arctic Sea hellipis disappearing
Linear trend coefficients in the time series of mean snow depths for the permanent snow-cover period 1936-2000
EU-INTASproject (SCCONE)Snow cover changes over Northern Eurasia
Snow Satellite measurements 1966 ndashJuly 2008
IPCC Glaciers and frozen ground
Area of seasonally frozen ground has decreasedhellip
Increased glacier retreatsince the early 1990s
DesertSteppe
Dry climates
Mild winters
Dry summers
Wet all seasons
Cold winters
Dry summers
Wet all seasons
Polar climatesTundraIce cap
Koumlppen climatic zonesbased on present (1961-90) temperature and precipitation
Pine
Spruce
Birch
now in 2100 Flying into climate change
Climate threat to coral reefs
The Earth is rdquogreeningrdquo
(from satellites)
Biologicalinfluences
1990s
2020s
2050s
2080s
Temp amp Prec -gt 2100
Rising sea levelshellip60 cm
20 cm
IPCC2007
Concluding remarksClimate change will notbe gradual buthellip
Complicated sea currents
If the Golf stream would not exist
Greenland melting
- 5-10 degrC
gt 2 km
what about +5
Arctic ClimateImpact Assessment(ACIA 2004)
-gt httpwwwbaltex-researcheu
The overall format is similar to the IPCC- author groups for the individual chapters- overall policymakers-summary - review process
BALTEX Assessment of Climate Change -gt BACC (2007)
Springer 500p
-gt httpwwwaciauafedu
ARCTIC
Presentand futuretemperature
(Attributionhellip)
Natural +anhtropogeniccauses
Naturalcauses
NAOetc
- The influence of climate change at high altitude and high latitude Raino Heino Finnish Meteorological Institute
- References
- Slide Number 3
- Slide Number 4
- Slide Number 5
- Slide Number 6
- Slide Number 7
- Slide Number 8
- Slide Number 9
- Slide Number 10
- Slide Number 11
- UNTIL NOW - No change in heat content and salinity- Accelerated rise of the sea level- Less icehellip
- IPCC Past and future
- Projections of future temperature changes
- Projections of future precipitation changes
- Slide Number 16
- Slide Number 17
- Slide Number 18
- IPCC Glaciers and frozen ground
- The Earth is rdquogreeningrdquo
- Slide Number 21
- Rising sea levelshellip
- Slide Number 23
- Slide Number 24
- Slide Number 25
- Slide Number 26
- Slide Number 27
- Slide Number 28
-

(BALTEX Assessment of Climate ChangehellipBACC)
Interannual variability in water inflow is considerable but no statistically significant trend is found in the annual time series for the period 1921-2005
Change -gt 2071-2100
1961-90
httpwwwdartmouthedu~floodsArchives
2008
Large Flood Events 1985-2007
UNTIL NOW
- No change in heat content and salinity
- Accelerated rise of the sea level
- Less icehellip
Observed Projected
No long-term trends in storminessHowever it is possible to attribute parts of the observed regional changes to changes in the large-scale circulation
(BALTEX Assessment of Climate ChangehellipBACC)
IPCC Past and future
Projected warmingin 21st century expected to be
- greatest over land and at most high northern latitudes
- and least over the Southern Ocean and parts of the North Atlantic Ocean
Projections of future temperature changes
rdquoGreenrdquoworld
Medium
rdquoBaUrdquo
-gt Increases very likely in high latitudes-gt Decreases likely in most subtropical land regions
Projections of future precipitation changes
Winter Summer
Implications (hellip of climate changes) -gt IPCC WG2
Arctic ice and snow as well as permafrost and vegetation zones
2007 2005
Thickness
Ice cover of the Arctic Sea hellipis disappearing
Linear trend coefficients in the time series of mean snow depths for the permanent snow-cover period 1936-2000
EU-INTASproject (SCCONE)Snow cover changes over Northern Eurasia
Snow Satellite measurements 1966 ndashJuly 2008
IPCC Glaciers and frozen ground
Area of seasonally frozen ground has decreasedhellip
Increased glacier retreatsince the early 1990s
DesertSteppe
Dry climates
Mild winters
Dry summers
Wet all seasons
Cold winters
Dry summers
Wet all seasons
Polar climatesTundraIce cap
Koumlppen climatic zonesbased on present (1961-90) temperature and precipitation
Pine
Spruce
Birch
now in 2100 Flying into climate change
Climate threat to coral reefs
The Earth is rdquogreeningrdquo
(from satellites)
Biologicalinfluences
1990s
2020s
2050s
2080s
Temp amp Prec -gt 2100
Rising sea levelshellip60 cm
20 cm
IPCC2007
Concluding remarksClimate change will notbe gradual buthellip
Complicated sea currents
If the Golf stream would not exist
Greenland melting
- 5-10 degrC
gt 2 km
what about +5
Arctic ClimateImpact Assessment(ACIA 2004)
-gt httpwwwbaltex-researcheu
The overall format is similar to the IPCC- author groups for the individual chapters- overall policymakers-summary - review process
BALTEX Assessment of Climate Change -gt BACC (2007)
Springer 500p
-gt httpwwwaciauafedu
ARCTIC
Presentand futuretemperature
(Attributionhellip)
Natural +anhtropogeniccauses
Naturalcauses
NAOetc
- The influence of climate change at high altitude and high latitude Raino Heino Finnish Meteorological Institute
- References
- Slide Number 3
- Slide Number 4
- Slide Number 5
- Slide Number 6
- Slide Number 7
- Slide Number 8
- Slide Number 9
- Slide Number 10
- Slide Number 11
- UNTIL NOW - No change in heat content and salinity- Accelerated rise of the sea level- Less icehellip
- IPCC Past and future
- Projections of future temperature changes
- Projections of future precipitation changes
- Slide Number 16
- Slide Number 17
- Slide Number 18
- IPCC Glaciers and frozen ground
- The Earth is rdquogreeningrdquo
- Slide Number 21
- Rising sea levelshellip
- Slide Number 23
- Slide Number 24
- Slide Number 25
- Slide Number 26
- Slide Number 27
- Slide Number 28
-